Urban Forest Resource Analysis The State of Montana 2017

Urban Forest Resource Analysis
The State of Montana 2017
Prepared for: Montana Department of Natural Resources and Conservation 2705 Spurgin Road Missoula, MT 59804 Phone: (406) 542-4300 Fax: (406) 542-4217 http://www.dnrc.mt.gov Prepared by: Davey Resource Group A Division of the Davey Tree Expert Company 6005 Capistrano Ave. Suite A Atascadero, California 93422 Phone: 805-461-7500 Toll Free: 800-966-2021 Fax: 805-461-8501 www.davey.com/drg
Acknowledgements:
Funding provided by the United States Forest Service and the Montana Department of Natural Resources and Conservation.
While the specific reports and recommendations can be attributed to this study, the basis for its structure and written content comes from the entire series of Municipal Forest Resource Analysis reports prepared and published by the USDA Forest Service, Pacific Southwest Research Station, Center for Urban Forest Research, and credit should be given to those authors. The Municipal Forest Resource Analysis Reports are companions to the regional Tree Guides and i-Tree’s Streets application developed by the USDA Forest Service, Pacific Southwest Research Station, Center for Urban Forest Research.
In accordance with Federal law and U.S. Department of Agriculture policy, this institution is prohibited from discriminating on the basis of race, color, national origin, sex, age, or disability. (Not all prohibited bases apply to all programs.) To file a complaint of discrimination, write USDA, Director, Office of Civil Rights, Room 326-W, Whitten Building, 1400 Independence Avenue, SW, Washington, DC 20250-9410 or call (202) 720-5964 (voice and TDD). USDA is an equal opportunity provider and employer.
Table of Contents Executive Summary ............................................................................................................................. 1 Introduction .......................................................................................................................................... 4
Communities .............................................................................................................................. 4 Climate ....................................................................................................................................... 8 Data Collection and Analysis ..................................................................................................... 9
Quick Facts ........................................................................................................................................ 11 Structure .................................................................................................................................. 11 Benefits .................................................................................................................................... 11 Management ............................................................................................................................ 12
Montana’s Urban Forest Resource ................................................................................................... 14 Population Composition........................................................................................................... 14 Species Richness and Composition ........................................................................................ 15
Leaf Surface Area ............................................................................................................... 18 Species Diversity-Differences Between Eastern and Western Montana ................................ 19 Stocking Level ......................................................................................................................... 20 Relative Age Distribution ......................................................................................................... 20 Urban Forest Condition ........................................................................................................... 24 Replacement Value ................................................................................................................. 26
Benefits from Montana’s Urban Forest ............................................................................................. 29 Energy Savings ....................................................................................................................... 30 Electricity and Natural Gas Reduction .................................................................................... 30 Atmospheric Carbon Dioxide Reduction ................................................................................. 32 Carbon Dioxide Benefits .......................................................................................................... 32 Air Quality Improvement .......................................................................................................... 34 Air Quality Benefits .................................................................................................................. 35 Stormwater Runoff Reductions ............................................................................................... 37 Aesthetic, Property Value, and Socioeconomic Benefits ........................................................ 39
Summary of Benefits ......................................................................................................................... 41 Benefit-Investment Ratio (BIR) .......................................................................................................... 43 Other Statewide Assessments .......................................................................................................... 45 Conclusion ......................................................................................................................................... 46 Appendix A: Methodology ................................................................................................................. 49 Appendix B: Glossary of Terms ......................................................................................................... 50 Appendix C: References ................................................................................................................... 51 Appendix D: Species Index ............................................................................................................... 53 Appendix E: Emerald Ash Borer ........................................................................................................ 58

Tables Table 1: Inventoried Communities West of the Continental Divide .................................................. 6 Table 2: Inventoried Communities East of the Continental Divide ................................................... 7 Table 3: Population Summary (Species Exceeding 1%) ................................................................ 15 Table 4: Relative Performance Index for Most Prevalent Species (representing >1%) ................. 25 Table 5: Species that May Be Underused ...................................................................................... 26 Table 6: Replacement Value Summary .......................................................................................... 27 Table 7: Per-Community Replacement Value Summary ................................................................ 27 Table 8: Annual Electric and Natural Gas Benefits ......................................................................... 31 Table 9: Summary of Annual Carbon Benefits ................................................................................ 33 Table 10: Urban Forest Management Strategies to Improve Air Quality .......................................... 35 Table 11: Summary of Annual Air Quality Benefits ........................................................................... 36 Table 12. Summary of Annual Stormwater Runoff Reduction Benefits ............................................ 38 Table 13. Summary of Annual Aesthetic, Property Value, and Socioeconomic Benefits ................. 40 Table 14. Summary of Annual Per-Tree Benefits for the Top Ten Species ..................................... 42 Table 15. Tree City USA Benefits Investment Ratio (BIR) ............................................................... 44 Table 16: Statewide Assessment Comparisons ............................................................................... 45
Figures Figure 1: Top Ten Species in Statewide Urban Forests .................................................................... 2 Figure 2: Young Maples Line this Park in Columbia Falls ................................................................. 3 Figure 3: The State Capitol in Fall Color, Helena .............................................................................. 4 Figure 4: Inventoried Montana Communities ..................................................................................... 5 Figure 5: USDA Hardiness Zones of Montana ................................................................................... 9 Figure 6: Volunteers Worked with DNRC to Complete Inventories in Several Communities.......... 10 Figure 7: Pruning Young Trees is an Essential Part of Tree Maintenance ..................................... 13 Figure 8: Composition of Tree Type and Stature in Montana’s Urban Forest ................................. 14 Figure 9: The Most Prevalent Species ............................................................................................. 17 Figure 10: Elm in Kalispell with Dutch Elm Disease ......................................................................... 17 Figure 11: Top 10 Species East of Continental Divide ..................................................................... 19 Figure 12: Top 10 Species West of the Continental Divide .............................................................. 20 Figure 13: Mature Cottonwoods in Hamilton ..................................................................................... 21 Figure 14: Statewide Age Distribution ............................................................................................... 22 Figure 15: Age Distribution of the Top 10 Tree Species ................................................................... 23 Figure 16: Condition Summary .......................................................................................................... 24 Figure 17: As Trees Mature their Replacement Value Increases (Silver Park, City of Missoula) .... 27 Figure 18: Mature Trees in Peterson Park Provide Benefits to the Sidney Community ................... 29 Figure 19: Top Five Highest Per-Tree Annual Electricity and Natural Gas Benefits ........................ 31 Figure 20: Top Five Highest Per-Tree Annual Carbon Benefits ....................................................... 33 Figure 21: Top Five Highest Per-Tree Air Quality Benefits ............................................................... 35 Figure 22. Top Five Highest Per-Tree Annual Stormwater Benefits ................................................ 37 Figure 23. Ash Trees in Columbus Provide Aesthetic Values to the Community ............................. 39 Figure 24. Top Five Species with the Highest Property Value Benefits ........................................... 40 Figure 25. Summary of Annual Per-Tree Benefits for the Top Ten Species .................................... 41 Figure 26: Siberian Elms Provide the Greatest Overall Per-Tree Benefit ........................................ 42 Figure 27. City of Whitefish Arbor Day Celebration .......................................................................... 48


1 Executive Summary January 2017
Executive Summary
Urban and community trees play a critical role in the State of Montana. They provide numerous benefits both tangible and intangible to residents, visitors, and neighboring communities. Montana’s publicly-owned forest includes 157,403 individual sites that include 138,420 trees, 17,512 vacant sites, and 1,471 stumps throughout 61 inventoried communities. Montana’s Department of Natural Resources and Conservation (DNRC) recognizes that these trees are a valued resource, an important component of the urban infrastructure, and part of the state’s identity.
In recent years, to support the preservation and management of urban and community trees, the state of Montana Urban and Community Forestry Program and various communities commissioned inventories of public trees within the street right-of-way (ROW) and in city parks. The inventories produced GIS layers that include information about each tree including species, size, condition, and geographic location. Davey Resource Group (DRG) used this data in conjunction with Treekeeper® version 7.7 and MyTreekeeper®, which uses the National Tree Benefit Calculator (treebenefits.org) to determine species benefits and to develop a quantified analysis of the current structure, function, and value of the urban forest. This report details the results of that analysis.
The 61 inventoried forests throughout Montana provide nearly $17.2 million in annual benefits. These benefits include air quality improvements, energy savings, stormwater runoff reduction, atmospheric CO₂ reduction, and aesthetic contributions to the social and economic health of the state. Based on the 40 communities that report an annual tree care budget to the Arbor Day Foundation’s Tree City USA program, Montana communities are contributing at least $3.3 million annually to support publicly-owned trees. This value represents both budget dollars and in-kind (volunteer) contributions. For every $1 invested in Tree City USA communities, they receive $4.41 in benefits (see Benefit-Investment Ratio).
Annually, Montana’s urban forests are reducing electric energy consumption by 12,455 megawatt hours (MWh) and natural gas consumption by nearly 1.2 million therms, for a combined value of $1,844,435. The sheltering effect of the public tree canopy reduces stormwater runoff by more than 122.4 million gallons each year, helping to protect local, regional, and state water resources by reducing sediment and pollution loading. Annually, public trees sequester 4,768 tons of carbon (CO₂). An additional 5,874 tons of CO₂ is avoided each year for an annual net benefit valued at $147,635.1 Each year public trees are removing 47,513 pounds of pollutants from the air, including ozone (O3), nitrogen dioxide (NO2), sulfur dioxide (SO2), and particulates (PM10).
The urban forests across Montana are mostly well established and 55% of inventoried trees are considered to be in good condition. Statewide, the age distribution of all trees is quite favorable. Nearly half (47%) of the inventoried trees are young trees measuring 8 inches or less in diameter at breast height (DBH). The abundance of young trees ensures a future forest that will provide benefits for many years. Eleven percent of Montana’s inventoried trees are greater than 24 inches DBH, suggesting that from a statewide perspective, a reasonably small percentage of trees are very mature and will soon require expensive maintenance and removal costs. Realizing that several cities in Montana were established nearly 150 years ago, portions of many urban forests, especially in Missoula and Kalispell, are declining due to age. The necessity of removing and replacing many dead and dying trees during a short time period creates management issues that communities in the state have not previously faced.
1 Avoided Carbon: Avoided carbon is a result of reducing energy consumption. The avoided value represents carbon that would have been created from the production of additional energy.

January 2017 Executive Summary 2
Regular inspection and proactive maintenance will promote the preservation of existing benefits, support individual tree longevity, and help manage risk.
Ash are the most commonly planted trees in several Montana communities, especially east of the Continental Divide. Nearly 30% of all trees inventoried were ash (green, white, spp.) (Figure 1). Emerald ash borer (EAB), an Asian beetle has killed millions of trees in at least 30 states since 2002. Although EAB is not known from Montana as of 2017, it threatens to drastically change communities with an over-abundance of ash. In response to this serious threat, regulatory agencies and the USDA enforce quarantines and fines to prevent potentially infested ash trees, logs or firewood from moving out of areas where EAB occurs. Planting a broad diversity of non-ash species may help to limit future tree death from EAB and other species-specific pests, but will not prevent widespread loss in our urban forests given their current condition. New forest pests will continue to be detected; vigilance in monitoring and continued education is necessary to maintain the health of urban forests.
Some urban foresters use a 10-20-30 threshold as a guideline to reduce the possibility of catastrophic tree loss due to insects or disease striking a specific tree type. This recommendation suggests an urban tree population include no more than 10% of any one species, 20% of one genus or 30% of one family. For some western Montana communities, Norway maples, exceed the maximum 10%, and at the state level they rank second to ash and are 9.7% of the inventoried population.
Figure 1: Top Ten Species in Statewide Inventoried Forests
Public trees are a part of the infrastructure and character of Montana communities. Unlike most other public assets, with proper maintenance, trees have the potential to increase in value over time (Figure 2). With the overall established tree population in good condition, a high percentage of young trees, and more than 180 different species, urban and community forests in Montana will continue to be a vital asset at both the local and statewide levels.
38.7%
2.2%
2.3%
2.7%
2.7%
2.8%
3.1%
3.9%
4.2%
9.7%
27.9%
0% 10% 20% 30% 40% 50%
Other
Pinus ponderosa
Gleditsia triacanthos
Poplar spp.
Little-leaf linden
Common chokecherry
Siberian elm
Colorado blue spruce
Crabapple spp.
Norway maple
Ash (green, white, spp.)
Suggested 10% Threshold (Santamour 1990)

3 Executive Summary January 2017
Figure 2: Young Maples Line this Park in Columbia Falls

January 2017 Introduction 4
Introduction The eastern portion of Montana was originally acquired by the U.S. from France in 1803 as part of the Louisiana Purchase, while the western region was obtained from Great Britain in the Oregon Treaty of 1846. Montana became a territory in 1864 and became the 41st state, with Helena as its capital, in 1889 (Figure 3). Despite being the 4th largest state by size (147,042 square miles of land and water), Montana is one of the least populous states, with an average of 6 people per square mile (Montana.gov 2016). The state is ranked 44th for population size, with the U.S. Census Bureau estimating the 2015 population at 1,032,949 people.
Montana has 54 state parks, and is home to Glacier National Park, Little Bighorn National Monument, a portion of Yellowstone National Park, and millions of acres of United States Forest Service and Bureau of Land Management lands. Popular outdoor recreational activities include hunting, fishing, horseback riding, hiking, snowmobiling, and skiing.
Figure 3: The State Capitol in Fall Color, Helena
Communities Montana has 129 incorporated municipalities. Using state and federal funding, the DNRC collected or compiled inventory data from 61 of these municipalities. The communities are widespread across the state of Montana, and represent diverse climatic and ecological conditions. Only cities with a current tree inventory (performed between 2008 and 2015) were included as part of this report (Figure 4). The populations of these communities range from 125 (City of Judith Gap) to 110,623 (City of Billings). Most communities have inventory data for public right-of-way trees, park trees, and vacancies, but not every city provided information

5 Introduction January 2017
for all three categories. Montana’s three largest cities do not have complete public tree inventories. The City of Billings has inventory data for their parks, but not for street right-of-ways, and Great Falls has no current inventory at the time of this publication, but Malmstrom Air Force Base, adjacent to Great Falls, has a completed inventory. The inventory for Missoula, the second-largest city in Montana, is still in progress. Of the 61 communities, 66% are Tree City USA communities. The Tree City USA program is administered by the National Arbor Day Foundation providing nation-wide recognition of a community’s commitment to their urban forest.
Figure 4: Inventoried Montana Communities
Individual trees and healthy urban forests play an important role in the quality of life and the sustainability of every community. Research demonstrates that healthy urban trees can improve the local environment and diminish the impact resulting from urbanization and industry (Center for Urban Forest Research). Trees improve air quality by manufacturing oxygen and absorbing carbon dioxide (CO₂), as well as filtering and reducing airborne particulate matter such as smoke and dust. Urban trees reduce energy consumption by shading structures from solar energy and reducing the overall rise in temperature created through urban heat island effects (EPA). Trees slow and reduce stormwater runoff, helping to protect critical waterways from excess pollutants and particulates. In addition, urban trees provide critical habitat for wildlife and promote a connection to the natural world for urban residents.

January 2017 Introduction 6
Healthy urban trees increase the overall attractiveness of a community and the value of local real estate. Trees promote shopping, retail sales, and tourism (Wolf 2007). Trees support a livable community, fostering psychological health, and providing residents with a greater sense of place (Ulrich 1986, Kaplan 1989). Community trees, both public and private, soften the urban hardscape by providing a green sanctuary, ensuring that Montana’s urban areas provide a more enjoyable place to live, work, and play. Public trees play a prominent role in the overall urban forest benefits afforded to each community.
The Urban and Community Forestry Program of Montana DNRC assists Montana communities with the development and maintenance of their urban forestry programs. The communities studied as part of this project oversee 138,420 trees on streets and right-of-ways and in city parks. Each of these vital resources is cared for by the local communities with the help of Montana DNRC. Inventoried cities are dispersed widely across the state, with 16 communities located west of the Continental Divide and 45 communities east of the Divide. The median population of the western communities is 3,624, while the median population for eastern communities is 1,923. See Tables 1 and 2 for estimated population and number of trees in each inventoried community.
Table 1: Inventoried Communities West of the Continental Divide
Inventoried Communities West of the Continental Divide
Community County Population (2015
estimated) Number of Trees
Alberton Mineral 424 101
Anaconda Deer Lodge 9,139 2,643
Butte Silver Bow 33,922 4,403
Columbia Falls Flathead 5,093 3,339
Drummond Granite 336 276
Eureka Lincoln 1,074 364
Hamilton Ravalli 4,602 1,639
Kalispell Flathead 22,052 9,077
Libby Lincoln 2,645 1,751
Missoula Missoula 71,022 22,537
Polson Lake 4,707 1,584
Ronan Lake 1,981 867
Stevensville Ravalli 1,922 614
Superior Mineral 839 347
Thompson Falls Sanders 1,332 623
Whitefish Flathead 7,073 3,474
16 Communities Total
168,163 53,639

7 Introduction January 2017
Table 2: Inventoried Communities East of the Continental Divide
Inventoried Communities East of the Continental Divide
Community County Population (2015
estimated) Number of Trees
Big Timber Sweet Grass 1,648 1,069 Billings (parks) Yellowstone 110,263 8,335 Bozeman Gallatin 43,405 10,559 Broadus Powder River 488 731 Browning Glacier 1,027 344 Cascade Cascade 696 418 Choteau Teton 1,696 1,354 Colstrip Rosebud 2,336 855 Columbus Stillwater 2,042 1,192 Conrad Pondera 2,593 1,203 Culbertson Roosevelt 815 339 Cut Bank Glacier 3,002 577 Dillon Beaverhead 4,210 781 Ennis Madison 884 216 Forsyth Rosebud 1,892 716 Fort Benton Chouteau 1,460 895 Fort Peck Valley 251 584 Glasgow Valley 3,414 1,603 Glendive Dawson 5,490 1,987 Great Falls MAFB Cascade 3,472 8,610 Hardin Big Horn 3,505 1,000 Harlowton Wheatland 979 1,080 Havre Hill 9,834 3,554 Helena Lewis and Clark 30,581 9,385 Judith Gap Wheatland 125 148 Laurel Yellowstone 6,943 3,361 Lewistown Fergus 5,874 2,665 Livingston Park 7,307 3,888 Lodge Grass Big Horn 445 86 Manhattan Gallatin 1,631 774 Miles City Custer 8,796 4,238 Plentywood Sheridan 1,923 606 Red Lodge Carbon 2,222 2,205 Roundup Musselshell 1,836 1,548 Saco Phillips 201 116 Shelby Toole 3,268 1,364 Sheridan Madison 677 141 Sidney Richland 6,828 2,125 Stanford Judith Basin 381 297 Townsend Broadwater 1,959 997 Valier Pondera 508 564 West Yellowstone Gallatin 1,339 637 White Sulphur Springs Meagher 910 492 Whitehall Jefferson 1,094 422 Wolf Point Roosevelt 2,850 1,016
45 Communities Total
293,100 85,077

January 2017 Introduction 8
Climate Montana has various climates across the state, but weather tends to be milder west of the Continental Divide. West of the mountain barrier winters are less severe, precipitation occurs more evenly throughout the year, summers are a little cooler, and winds are lighter than on the eastern side. More cloudy days occur west of the Divide in all seasons, humidity is higher, and the growing season is shorter than in the eastern plains. Climatic variations are influenced by the wide range of elevations, from 1,800 feet in the northwestern corner to over 12,800 feet near Yellowstone National Park. Most of the western third of Montana is very mountainous, while the eastern portion is characterized by grassy plains with wide valleys and small, isolated mountain ranges, hills, and badlands. Half of the state’s topography is over 4,000 feet above sea level (Western Regional Climate Center 2016).
Precipitation levels differ considerably, depending on the region of the state. The northwest community of Heron in Sanders County receives the highest annual precipitation of 35 inches, while less than 7 inches falls at the Clarks Fork of the Yellowstone River, in southern Montana’s Carbon County. In the mountainous regions of the state, annual snowfall can sometimes reach 300 inches, but in north central and northeast Montana, snowfall has been as low as 20 inches. Most larger cities receive an average annual snowfall of between 30 to 50 inches. The annual rainy season usually spans May through July, and snowfall typically occurs in November through April. Occasionally, snowstorms will begin as unseasonably early as September, or as late as May (Western Regional Climate Center 2016).
The average summer temperature in southeastern Montana is 74° F, while in the higher elevation southwest the average is 64° F. Miles City, one of the communities with the warmest summers, has a maximum average summer temperature of 90° Fahrenheit (F). Winter temperatures are also variable, with northeastern Montana averaging approximately 11° F. This area experiences between six to twelve cold waves per winter, where temperatures can fall below zero, and as low as -50° F. The south-central portion of the state averages 22° F in winter. (Western Regional Climate Center 2016)
Helena, the state capital, experiences an annual high of 86° F, and low of 12° F with a 12-month average annual temperature of 46° F. The city receives an average annual rainfall of 11 inches, and an average annual snowfall of 38 inches (US Climate Data 2016).
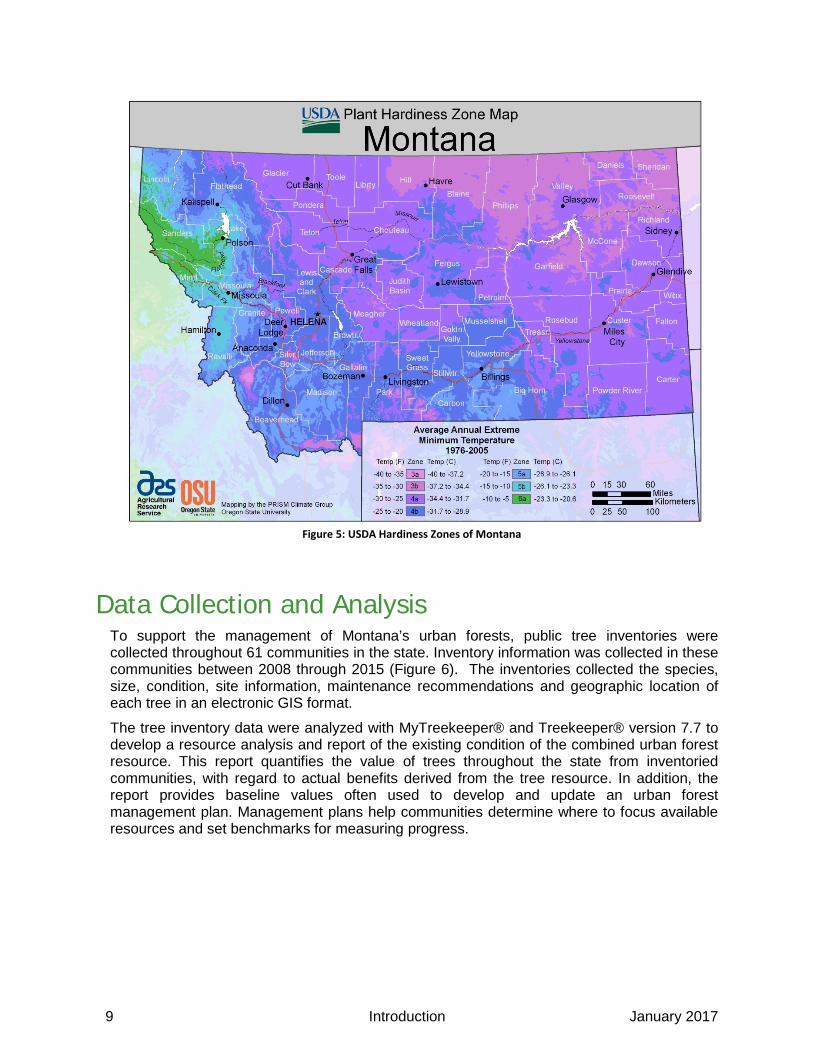
Montana includes seven USDA Plant Hardiness Zones, from 3a to 6a (Figure 5). The coldest zone (3a) includes northern and northeast Montana, and along the peaks of the Rocky Mountains. Warmer zones are generally located in the west and south, with the warmest, zone 6a (-10° F to -5° F), covering portions of Sanders, Mineral, Lincoln and Lake counties. (USDA 2016).
9 Introduction January 2017
Figure 5: USDA Hardiness Zones of Montana
Data Collection and Analysis To support the management of Montana’s urban forests, public tree inventories were collected throughout 61 communities in the state. Inventory information was collected in these communities between 2008 through 2015 (Figure 6). The inventories collected the species, size, condition, site information, maintenance recommendations and geographic location of each tree in an electronic GIS format.
The tree inventory data were analyzed with MyTreekeeper® and Treekeeper® version 7.7 to develop a resource analysis and report of the existing condition of the combined urban forest resource. This report quantifies the value of trees throughout the state from inventoried communities, with regard to actual benefits derived from the tree resource. In addition, the report provides baseline values often used to develop and update an urban forest management plan. Management plans help communities determine where to focus available resources and set benchmarks for measuring progress.

January 2017 Introduction 10
Figure 6: Volunteers Worked with DNRC to Complete Inventories in Several Communities
This analysis describes the overall structure, function, and value of Montana’s community trees, and paints a representative picture for the rest of the state. With this information, managers and residents can make informed decisions about tree management strategies. This report provides the following information: ▪ A description of the current overall structure of the community tree resource in Montana
and an established benchmark for future management decisions ▪ The overall economic value of the benefits from urban forests, illustrating the relevance
and relationship of trees to the quality of life issues such as air quality, environmental health, economic development, and psychological health
▪ Data that may be used by resource managers in the pursuit of alternative funding sources and collaborative relationships with utility purveyors, non-governmental organizations, air quality districts, federal and state agencies, legislative initiatives, or local assessment fees
▪ Benchmark data for developing long-term urban forest strategies
This resource analysis is distinctive in that most projects analyze only one community at a time. Working at a broad statewide scale provides a unique perspective but comes with challenges as well. Since this study does not represent every Montana community, it is important to be aware that this is a representative analysis rather than a comprehensive one. Variations in climate, geography, local management practices and staffing, species compositions, and tree age distribution in these communities contribute to regional diversity, which may not be fully represented in this report.

11 Quick Facts January 2017
Quick Facts Structure
Montana’s inventoried urban forests include 138,420 public trees and 17,512 available planting sites on streets. A structural analysis is the first step towards understanding the benefits provided by these trees as well as their management needs. Considering species composition, diversity, age distribution, condition, canopy coverage, and replacement value, DRG determined that the following information characterizes the overall urban forest resource in Montana: ▪ More than 180 unique tree species were identified by the inventories. The predominant
species are ash (Fraxinus spp, 28%), Norway maple (Acer platanoides, 10%), and crabapple (Malus spp., 4%). These comprise 42% of the overall resource.
▪ Ash is dominant in many communities east of the Continental Divide (33,776 trees). Norway maple is dominant or of high importance in many cities west of the Divide (11,853 trees).
▪ Almost half of all trees are less than 8” DBH (47%) and 11% are larger than 24”, indicating a nearly ideal mix of young, established, and mature trees providing a sustainable benefit flow.
▪ 55% of trees are in good condition. ▪ The current stocking level for the inventoried urban forest is 87.9%, based on a total
157,403 sites, including 138,420 trees and 18,983 vacant sites and stumps. ▪ While each community has a unique number of trees, the average is 2,269 trees per
community, which equates to one tree for every three people. ▪ Replacement of Montana’s 138,420 community trees with trees of similar size, species,
and condition would cost nearly $185.5 million.
Benefits Annually, community trees in Montana provide cumulative benefits at an average value of $124.15 per tree, for a total gross value of nearly $17.2 million per year (Appendix A). MyTreekeeper®, which used the National Tree Benefits Calculator (treebenefits.org), was used to calculate environmental, aesthetic, and socioeconomic benefits as well as tree value estimates. The National Tree Benefits Calculator is based on i-Tree STREETS, a peer-reviewed software suite from the USDA Forest Service. These annual benefits include: $13.7 million in benefits of property value, health, aesthetics, and socioeconomics; an
average of $99.32 per tree. Reduction in electricity and natural gas consumption through shading and climate effects
for an overall benefit of $1,844,435, an average of $15.25 per tree. 4,768 tons of atmospheric CO₂ sequestered and an additional 5,874 tons avoided for a
net value of $147,635 and a net average of $1.22 per tree. 47,513 pounds of air pollutants removed with a gross value of $123,273. More than 122 million gallons of stormwater intercepted annually for a total value of
more than $1.3 million, an average of $10.93 per tree Forty inventoried communities reported urban forestry budgets to Tree City USA in 2015. These communities reported an overall $3.3 million towards the support of their urban forests (including in-kind volunteer hours). Overall annual net benefit (benefit minus investment) for

January 2017 Quick Facts 12
these communities is $11.2 million, an average of $92 per tree. For every $1 invested in public trees, Tree City USA communities receive $4.41 in benefits.
Management Montana’s urban forests are a dynamic resource that requires continued investment to maintain and realize full benefit potential. Trees are one of the few community assets that have the potential to increase in value with time. Proper and timely tree care can substantially increase lifespan. When trees live longer, they provide greater air quality, human health, energy-saving and other benefits. Trees are, however, vulnerable to a host of stressors and require sustainable best management practices to ensure a continued flow of benefits for future generations.
Young tree training, a consistent pruning cycle, and regular inspection to identify structural and age-related defects will manage risk and reduce hazards from tree and branch failure. Based on this resource analysis, DRG recommends the following approach for Montana’s communities: ▪ Increase species diversity by ensuring that new tree plantings include a variety of
suitable species, since a diverse tree population is more resilient to biological and environmental threats.
▪ Increase the stocking level by using all available planting sites to improve diversity and increase benefits. Plant large-stature species wherever space allows.
▪ Provide structural pruning for young trees and a regular pruning cycle for all trees (preferably every 5-7 years for mature trees) (Figure 7).
▪ Protect existing trees from equipment, animal and human-caused damage, especially mature high-value species, and manage risk with regular inspection to identify and mitigate structural and age-related defects.
▪ Continue to maintain and update the inventory database, including tracking tree growth and condition during regular pruning cycles.
It is important to note that the statewide values are averages and individual communities will have tree populations with differing size or condition distributions. Ultimately, when considering maintenance planning, communities must remember that the most successful plans will be established for local conditions.
Montana DNRC can help to further the benefits of trees and urban forestry by providing the following services to communities:
▪ Provide technical assistance, financial assistance, public education and volunteer coordination
▪ Update existing inventories and perform new inventories to develop a more complete picture of the Montana statewide urban forest resource
▪ Develop a general Urban and Community Forestry Program Plan template. Work with individual communities to tailor plans to their specific needs.
▪ Encourage communities to understand the important distinction between forestry and urban forestry, and help them to develop proactive urban forest maintenance plans
▪ Further explore the inventory by sub-regions to find additional trends that might encourage maintenance practices.
▪ Increase public outreach and education of urban forestry, using inventory information as a catalyst for leveraging local and statewide support of urban forestry programs.

13 Quick Facts January 2017
With adequate protection and planning, the value of the community forest resource in Montana will increase over time. Proactive management and a tree replacement plan at the community level are critical to ensuring that residents continue to receive a high return on their investment. Along with new tree installation and replacement planting, funding for tree maintenance and inspection is vital to preserving benefits, prolonging tree life, and managing risk. Existing mature trees should be maintained and protected to ensure the continued growth and longevity of the existing canopy, and the environmental, social and economic benefits associated with those trees. Managers can take pride in knowing that community trees support the quality of life for residents and neighboring communities.
Figure 7: Pruning Young Trees is an Essential Part of Tree Maintenance

January 2017 Montana’s Urban Forest Resource 14
Montana’s Urban Forest Resource An urban forest is more thoroughly understood through examination of composition and species richness (diversity). Consideration of stocking level (trees per total available space), canopy cover, relative age distribution, condition, and performance provides a foundation for urban forest planning and management strategies. Inferences based on this data can help managers understand the importance of individual tree species to the overall forest as it exists today and provide a basis on which to project the potential value of the resource.
Population Composition Of prevalent species (those representing >1% of the overall population), broadleaf deciduous species comprise 86% of the species inventoried, including 67% classified as large-stature, 9% medium-stature, and 10% small-stature species (Figure 8). Conifers comprise the remainder of the tree population at 14%, including 1% medium-stature and 13% large-stature species.
Figure 8: Composition of Tree Type and Stature in Montana’s Urban Forests
67%
9%
10%
14%
Population Composition of Prevalent Species
Broadlaf Deciduous Large
Broadleaf Deciduous Medium
Broadleaf Deciduous Small
Conifer

15 Montana’s Urban Forest Resource January 2017
Species Richness and Composition No single species should dominate the composition of an urban forest population. Suitability of the dominant species is an important consideration. Planting short-lived or poorly-adapted species can result in shorter lifespans and increased long-term management investments.
Montana’s urban forests include more than 180 unique species (Table 3). While this value is measured statewide in 61 communities, rather than just for a single community, the value is much greater than the mean of 53 species reported by McPherson and Rowntree (1989) in their nationwide survey of street tree populations in 22 U.S. cities. Other states have higher unique species values. For example, in Washington state, 20 communities have 330 unique species, and in Indiana, 23 communities have 243 unique species (WA DNR 2015, DRG 2009).
The top three most prevalent trees represent 42% of the overall population: ash (Fraxinus spp., 28%), Norway maple (Acer platanoides, 10%), and crabapple (Malus spp., 4%) (Figure 9). A widely accepted guideline suggests that no single species should represent greater than 10% of the total population, and no single genus more than 20% (Clark et al. 1997). Ash and Norway maple both exceed this recommendation at the state level. Several other species exceed 10% and several genera exceed 20% in individual communities. Communities differed in their inventory methods; some communities collected data at the species level, while others interpret their tree populations using broader genus or population descriptors (i.e. ash spp., elm spp., poplar spp; or Broadleaf Deciduous Small, Medium or Large, and Conifer), thus the exact species percentage may not be known for a community.
Maintaining diversity in an urban forest is important. Dominance of any single species or genus can have detrimental consequences in the event of storms, drought, disease, pests, or other stressors. Catastrophic pathogens, such as Dutch elm disease (Ophiostoma ulmi), emerald ash borer (Agrilus planipennis), Asian longhorned beetle (Anoplophora glabripennis), and sudden oak death (SOD) (Phytophthora ramorum) are some examples of unexpected, devastating, and costly pests and pathogens that highlight the importance of diversity and the balanced distribution of species and genera (Figure 10).
Table 3: Population Summary (Species Exceeding 1%)
Species 0-3" 3-6" 6-12" 12-18" 18-24" 24-30" 30-36" 36-42" >42" Total % of Pop
Broadleaf Deciduous Large
Green ash 2,470 4,012 5,887 8,597 5,550 1,283 186 48 37 28,070 20.28% Norway maple 1,073 1,298 1,742 2,629 4,203 1,931 404 76 18 13,374 9.66% Ash spp. 434 498 783 2,273 1,625 441 58 9 5 6,126 4.43% White ash 382 579 1,049 1,485 722 208 44 10 1 4,480 3.24% Little-leaf linden 1,280 1,359 739 198 72 20 10 1 4 3,683 2.66% Poplar spp. 177 235 533 566 650 595 416 257 253 3,682 2.66% Honey locust 786 803 1,031 342 123 32 10 3 0 3,130 2.26% Eastern cottonwood 590 186 386 474 346 330 271 162 146 2,891 2.09% Quaking aspen 693 823 857 283 70 27 7 9 7 2,776 2.01% American elm 237 103 205 435 728 614 273 87 51 2,733 1.97% American linden 658 671 505 132 115 52 11 5 3 2,152 1.55% Silver maple 173 221 250 258 310 302 181 83 70 1,848 1.34% Other BDL 1,878 1,578 1,208 871 888 811 515 333 415 8,497 6.14% Total Broadleaf Deciduous Large 10,831 12,366 15,175 18,543 15,402 6,646 2,386 1,083 1,010 83,442 60.3%

January 2017 Montana’s Urban Forest Resource 16
Species 0-3" 3-6" 6-12" 12-18" 18-24" 24-30" 30-36" 36-42" >42" Total % of Pop
Broadleaf Deciduous Medium
Siberian elm 299 462 665 853 784 705 342 150 75 4,335 3.13% Willow spp. 1,755 66 112 99 86 119 68 65 106 2,476 1.79% Red maple 798 799 246 41 12 7 2 0 0 1,905 1.38% Boxelder 118 152 250 244 264 212 93 42 22 1,397 1.01% Other BDM 1,838 1,505 1,468 1,103 714 345 148 65 38 7,224 5.22% Total Broadleaf Deciduous Medium 4,808 2,984 2,741 2,340 1,860 1,388 653 322 241 17,337 12.5%
Broadleaf Deciduous Small
Crabapple spp. 2,200 1,857 1,122 362 122 53 19 9 4 5,748 4.15% Common chokecherry 1,648 1,362 646 119 29 14 14 1 1 3,834 2.77% Broadleaf Deciduous Small 377 1,211 307 73 71 39 18 6 5 2,107 1.52%
Other BDS 1,772 1,752 1,040 400 174 81 30 12 23 5,284 3.82% Total Broadleaf Deciduous Small 5,997 6,182 3,115 954 396 187 81 28 33 16,973 12.3%
Total Broadleaf Evergreen Large 0 0 4 5 4 0 0 0 0 13 0.01%
Total Broadleaf Evergreen Medium 0 0 0 0 1 0 0 0 0 1 0.00%
Total Broadleaf Evergreen Large 5 8 8 4 4 4 0 0 1 34 0.02%
Conifer
Colorado blue spruce 692 662 1,371 1,250 778 454 147 19 7 5,380 3.89% Ponderosa pine 812 356 694 597 276 158 62 47 8 3,010 2.17% Spruce spp. 358 437 456 325 183 81 39 4 0 1,883 1.36% Austrian pine 274 561 418 275 78 20 3 0 0 1,629 1.18% Douglas-fir 97 92 263 373 277 214 90 46 18 1,470 1.06% Engelmann spruce 56 94 241 440 456 132 31 0 3 1,453 1.05% Juniper spp. 494 498 185 78 32 16 11 0 2 1,316 0.95% Other Conifer 687 989 1,400 831 356 152 40 10 14 4,479 3.24% Total Conifer 3,470 3,689 5,028 4,169 2,436 1,227 423 126 52 20,620 14.9%
Total All Trees 25,111 25,229 26,071 26,015 20,103 9,452 3,543 1,559 1,337 138,420 100%

17 Montana’s Urban Forest Resource January 2017
Figure 9: The Most Prevalent Trees Species2
2 Index of common and scientific names for all figures and tables can be found in Appendix D
20.28%
9.66%
4.43%
4.15%
3.89%
3.24%
3.13%
2.77%
2.66%
2.66%
2.26%
2.17%
2.09%
2.01%
1.98%
1.79%
1.55%
1.52%
1.38%
1.36%
1.34%
1.18%
1.06%
1.05%
1.01%
19.39%
0.00% 5.00% 10.00% 15.00% 20.00% 25.00%
Green ash
Norway maple
Ash spp.
Crabapple spp.
Colorado blue spruce
White ash
Siberian elm
Common chokecherry
Little-leaf linden
Poplar spp.
Honey locust
Ponderosa pine
Eastern cottonwood
Quaking aspen
American elm
Willow spp.
American linden
Broadleaf Deciduous Small
Red maple
Spruce spp.
Silver maple
Austrian pine
Douglas-fir
Engelmann spruce
Boxelder
Other
Suggested Threshold

January 2017 Montana’s Urban Forest Resource 18
Figure 10: Elm in Kalispell with Dutch Elm Disease
The emerald ash borer (EAB) is a pest of specific concern to Montana communities. An invasive beetle pest native to eastern Asia, EAB threatens significant fiscal and environmental impacts wherever identified. While not yet identified in Montana, the borer has been spreading rapidly across the United States since its discovery. Emerald ash borer larval feeding disrupts the flow of nutrients and water, effectively girdling and eventually killing the tree. This feeding behavior combined with a fast reproduction cycle means that EAB is highly destructive to ash populations (Montana DNRC, 2015). Further information regarding EAB can be found in Appendix E. Additional resources can be found online at the Montana DNRC website’s “Montana Urban and Community Forestry Association” page (http://dnrc.mt.gov/divisions/forestry/forestry-assistance/urban-and-community-forestry/urban-and-community-forestry-association ).
Leaf Surface Area The amount and distribution of leaf surface area will determine the urban forest’s ability to produce benefits for the community (Clark 1997). As canopy cover increases, so do the benefits afforded by leaf area. Overall, community trees in Montana provide approximately 419.3 acres of leaf surface area. This value is not the same as canopy cover as it takes into consideration the entire surface area of the trees’ leaves including vertical overlap. Also leaf surface area includes areas where canopies overlap, whereas canopy cover is a calculation that only considers the amount of tree canopy that shades the ground. This report only discusses leaf surface area, which includes vertical values and does not discuss the single-plane canopy cover.
The 10 most prevalent tree species represent 57% of the overall population and 66% of the total leaf area. Of these, the highest leaf surface is provided by green ash (Fraxinus pennsylvanica) at almost 120.7 acres. Norway maple (Acer platanoides) provides the second largest area of leaf surface at 38.3 acres.

19 Montana’s Urban Forest Resource January 2017
Species Diversity-Differences Between Eastern and Western Montana
Distinct patterns are evident when using the Continental Divide as a boundary. Both eastern and western regions top ten species are mostly broadleaf deciduous, with approximately 4% conifers in the east and 7% in the west. (Figures 11 and 12) Ash (green, white, and spp. combined) are the most abundant tree east of the Divide, and second most abundant in western Montana. Norway maple is the top species west of the Divide. The top ten species in eastern Montana make up 67% of the total of eastern trees, while 58% of the total number of trees present in western Montana are included in the western top ten. Trees present in high numbers in both eastern and western Montana in addition to ash are Colorado blue spruce, crabapples, Siberian elm, poplars and common chokecherry.
Figure 11: Top 10 Species East of Continental Divide
2.5%
2.5%
2.7%
2.8%
2.9%
3.1%
3.3%
3.7%
4.3%
39.3%
0% 10% 20% 30% 40%
Common chokecherry
Willow spp.
Poplar spp.
American elm
Littleleaf linden
Eastern cottonwood
Siberian elm
Crabapple spp.
Colorado blue spruce
Ash (green, white, spp.)
East of the Continental Divide

January 2017 Montana’s Urban Forest Resource 20
Figure 12: Top 10 Species West of the Continental Divide
Stocking Level Community forests inventoried in Montana currently include at least 17,512 available planting sites and 1,471 stumps. (Planting sites were not counted in all communities). Considering the street tree inventories identified these planting sites in addition to 138,420 existing trees, the current overall stocking level of community forests is 87.9% (138,420/157,403). In addition, the inventories identified 363 trees that are recommended for immediate removal for public safety, 827 additional trees that are recommended for immediate removal, and 3,811 recommended for removal as routine maintenance over the next few years. If these removal locations are suitable for planting, an additional 5001 planting sites are available.
Relative Age Distribution The distribution of individual tree ages within a tree population influences present and future costs as well as the flow of benefits. An ideally-aged population allows managers to allocate annual maintenance costs uniformly over many years and assures continuity in overall tree canopy coverage and associated benefits. The DBH range of the overall population and individual species is a good, general indicator of age. Trees with smaller diameters tend to be younger, although some trees with slow growth rates or trees growing in poor conditions may be older than the size of tree suggests. As a general practice, a desirable distribution has a high proportion of young trees to offset establishment and age-related mortality as the percentage of older trees declines over time (Richards 1983). This ideal distribution, albeit uneven, suggests that a large fraction of trees (~40%) should be young with diameters (DBH) less than eight inches, while only 10% should be in the large diameter classes (>24 inches DBH). DBH distributions vary by community, with some communities having a higher number of newly planted trees (under 8”) and some having a large maturing population (trees over 24”), but at the state level, the distribution of inventoried trees fits within the accepted practice.
2.5%
2.6%
2.7%
2.9%
3.2%
3.2%
3.9%
4.8%
9.8%
22.2%
0% 10% 20% 30%
Poplar spp.
Aspen
Red maple
Siberian elm
Colorado blue spruce
Common chokecherry
Ponderosa pine
Crabapple spp.
Ash (green, white, spp.)
Norway maple
West of the Continental Divide

21 Montana’s Urban Forest Resource January 2017
Figure 13: Mature Cottonwoods in Hamilton
The overall age distribution of inventoried urban forests is nearly ideal, with 47% of trees 8 inches or less in diameter (DBH) and 11% of trees larger than 24 inches in diameter (Figure 14). With ongoing proactive management in communities with this exemplar distribution, the resource will continue to produce stable benefits, supporting the quality of life of the community and the environment. In communities with mature to older populations, new plantings could compensate for the approaching benefit decline.
Of the ten most common trees in Montana’s community forests, the youngest populations are chokecherry (Prunus virginiana), little-leaf linden (Tilia cordata), and crabapple species (Malus spp.) (Figure 15). Over 70% of these species are 6 inches or less in diameter. This suggests that recent tree plantings have increased the prevalence of these species. The poplar species (Populus spp.) group contains more trees greater than 24 inches in diameter than any other species (41.3%). Siberian elm (Ulmus pumila) ranks second with 29.3% greater than 24 inches. These high percentages are likely due to the high number of these species planted when towns were first established and rapid growth rates. Norway maple (Acer platanoides), ash species (Fraxinus spp.), and Colorado blue spruce (Picea pungens) are all well-established populations throughout the state. These species provide significant representation of the middle-class sizes, between 8 inches and 24 inches diameter.

January 2017 Montana’s Urban Forest Resource 22
Figure 14: Statewide Age Distribution
0%
5%
10%
15%
20%
25%
0-3" 3-6" 6-12" 12-18" 18-24" 24-30" 30-36" 36-42" >42"
Statewide Age Distribution
Ideal Values All Trees

23 Montana’s Urban Forest Resource January 2017
Figure 15: Age Distribution of the Top 10 Tree Species
0%
5%
10%
15%
20%
25%
30%
35%
40%
45%
0-3" 3-6" 6-12" 12-18" 18-24" 24-30" 30-36" 36-42" >42"
DBH Class (Species)
Ideal Values Norway maple White ash
Green ash Ash spp. Crabapple spp.
0%
5%
10%
15%
20%
25%
30%
35%
40%
45%
50%
0-3" 3-6" 6-12" 12-18" 18-24" 24-30" 30-36" 36-42" >42"
Ideal Values Colorado blue spruce Poplar spp.
Common chokecherry Little-leaf linden Siberian elm

January 2017 Montana’s Urban Forest Resource 24
Urban Forest Condition Tree condition is an indication of how well trees are managed and how they are performing in given site-specific environments (e.g., street, median, parking lot, etc.). Condition ratings can help urban forest managers anticipate maintenance and funding needs and are an important factor for the calculation of urban forest benefits. A ‘good’ condition rating assumes that a tree has no major structural problems, no significant mechanical damage, and may have only minor aesthetic, insect, disease, or structural problems, and is in good health. Condition descriptions are defined in Appendix A.
Fifty-five percent of the trees in Montana’s community forests are in overall good condition.
Thirty-one percent are in fair condition and fourteen percent are in poor condition or dead (Figure 16).
The relative performance index (RPI) further analyzes the condition and suitability of specific tree species by comparing the condition rating of an individual tree species to that of every other tree species within the population. The RPI provides an urban forest manager with a threshold to assess species performance. The index compares the condition ratings of each tree species with the condition ratings of every other tree species within the population. An RPI of 1.00 or better indicates that the species is performing as well or better than average. An RPI value below 1.00 indicates that the species is not performing as well in comparison to the rest of the population.
Among the most common trees in the inventories (all species that represent more than 1%), 16 have an RPI of 1.00 or greater (Table 4). Of these, spruce (Picea spp., RPI=1.14), Austrian pine (Pinus nigra, RPI=1.12), and Colorado blue spruce (Picea pungens, RPI=1.11) have the highest RPI, while Siberian elm (Ulmus pumila, RPI=0.87), Norway maple (Acer platanoides, RPI=0.86), and boxelder (Acer negundo, RPI=0.85) have the lowest.
The RPI can be a useful tool for urban forest managers. For example, if a community has been planting two or more new species, the RPI can compare their relative performance. If the RPI indicates that one is performing relatively poorly, managers may decide to reduce or even stop planting that species to reduce expenditures on planting stock and replacement costs. The RPI also enables managers to look at the performance of long-standing species. Established species with an RPI of 1.00 or greater should be retained, and included in future plantings. It is important to keep in mind that, because RPI is based on condition at the time of the inventory, it may not reflect cosmetic, seasonal or nuisance issues that are not threatening the health or structure of the trees.
An RPI value less than 1.00 may be indicative of a species that is not well adapted to local conditions. Poorly adapted species are more likely to present safety and maintenance issues. Species with an RPI less than 1.00 should receive careful consideration before being chosen for future planting. However, prior to selecting or deselecting trees based on RPI alone, managers should consider the species age distribution and other factors. A species that has
55%31%
10%
4%
Condition
Good
Fair
Poor
Dead or dying
Figure 16: Condition Summary

25 Montana’s Urban Forest Resource January 2017
an RPI of less than 1.00, but has a significant number of trees in larger DBH classes, may simply be exhibiting signs of population senescence.
Table 4: Relative Performance Index for Most Prevalent Species (representing >1%)
Species Dead or Dying Poor Fair Good RPI # of Trees % of Pop
Green ash 0.03 0.10 0.37 0.50 0.99 28070 20.28% Norway maple 0.08 0.19 0.46 0.27 0.86 13374 9.66% Ash spp. 0.03 0.10 0.44 0.43 0.96 6126 4.43% Crabapple spp. 0.02 0.06 0.24 0.67 1.05 5748 4.15% Colorado blue spruce 0.01 0.04 0.14 0.81 1.11 5380 3.89% White ash 0.01 0.09 0.38 0.52 1.00 4480 3.24% Siberian elm 0.08 0.19 0.43 0.29 0.87 4335 3.13% Common chokecherry 0.02 0.05 0.19 0.74 1.08 3834 2.77% Little-leaf linden 0.02 0.07 0.25 0.67 1.05 3683 2.66% Poplar spp. 0.02 0.10 0.39 0.49 0.99 3682 2.66% Honey locust 0.02 0.06 0.19 0.73 1.08 3130 2.26% Ponderosa pine 0.01 0.03 0.13 0.83 1.12 3010 2.17% Eastern cottonwood 0.03 0.05 0.24 0.68 1.05 2891 2.09% Quaking aspen 0.06 0.11 0.25 0.59 0.99 2778 2.01% American elm 0.05 0.06 0.32 0.57 1.01 2734 1.98% Willow spp. 0.02 0.05 0.12 0.81 1.10 2478 1.79% American linden 0.03 0.09 0.31 0.56 1.01 2152 1.55% Broadleaf Deciduous Small 0.06 0.03 0.68 0.23 0.91 2107 1.52% Red maple 0.04 0.14 0.35 0.47 0.96 1905 1.38% Spruce spp. 0.01 0.01 0.07 0.90 1.14 1883 1.36% Silver maple 0.06 0.14 0.25 0.55 0.97 1848 1.34% Austrian pine 0.00 0.03 0.12 0.85 1.12 1629 1.18% Douglas-fir 0.01 0.03 0.19 0.76 1.09 1470 1.06% Engelmann spruce 0.01 0.07 0.21 0.72 1.07 1453 1.05% Boxelder 0.09 0.25 0.35 0.32 0.85 1397 1.01% Juniper spp. 0.01 0.03 0.17 0.79 1.11 1316 0.95% Other 0.04 0.09 0.27 0.60 1.01 25527 18.44%
Total 4% 10% 31% 55% 1.00 138,420 100%
The RPI value can also help to identify underused species that are performing well. Trees with an RPI value greater than 1.00 and an “established population” (a species common enough to represent at least 0.5% of the tree population) may indicate their suitability in the local environment and should receive consideration for additional planting (Table 5).
Of trees with a population between .5% and 1%, the tree with the highest RPI value is the bur oak (Quercus macrocarpa, RPI=1.10), which represents 0.57% of the tree population (793 bur oaks/138,420 total trees). The common hackberry, Celtis occidentalis, which is 0.81% of the tree population, has a high RPI of 1.07. Either tree would be a good consideration for additional planting.

January 2017 Montana’s Urban Forest Resource 26
When considering new species based on RPI, it is important to base the decision on established populations. The greater the number of trees of a particular species, the more relevant the RPI becomes. The following species appear to be performing well and should be considered for future tree plantings:
Table 5: Species that May Be Underused
Replacement Value
The replacement value accounts for the historical investment in trees over their lifetime and is a way of describing the value of a tree population (and/or the average value per tree) at a given time. The replacement value reflects current population numbers, stature, placement, and condition. Distinguishing the replacement value from the value of annual economic, environmental, social and public health benefits produced by this urban forest resource is very important. There are several methods available for obtaining a fair and reasonable perception of a tree’s value (CTLA, 1992; Watson, 2002). The cost approach, trunk formula method used in this analysis assumes the value of a tree is equal to the cost of replacing the tree in its current state (Cullen, 2002).
The combined value of Montana’s community forests is more than $185.5 million (Table 6). The average replacement value per tree is $1,340. Ash (Fraxinus pennsylvanica, americana and spp. [green, white and spp.]) and Norway maple (Acer platanoides) are the most valuable populations representing $71.8 million, 38% of the overall replacement value and 38% of the overall urban forest resource.
Table 7 shows the replacement value of trees per community. Missoula’s trees have the highest overall value ($22.9 million) (Figure 17), and Lodge Grass has the highest value per tree ($3,382 per tree). While it can be expected for Missoula to have a high overall value, as it is the community with the most inventoried trees, Lodge Grass has the fewest trees. The high per-tree value can be explained by taking into consideration the trees’ stature, location, and condition.
Montana’s community trees represent a vital component of community infrastructure and a public asset that with proper care and maintenance will continue to increase in value over time.
Species RPI # of Trees % of Pop
Bur oak 1.10 793 0.57 Rocky Mountain juniper 1.09 693 0.50 Maple spp. 1.07 858 0.62 Common hackberry 1.07 1121 0.81 White poplar 1.02 1120 0.81 Lilac spp. 1.01 764 0.55

27 Montana’s Urban Forest Resource January 2017
Table 6: Replacement Value Summary
Species Total $ % of Total % of Pop Green ash $36,195,765 19.51 20.28 Norway maple $20,666,899 11.14 9.66 Ash spp. $9,490,781 5.12 4.43 Crabapple spp. $2,491,757 1.34 4.15 Colorado blue spruce $9,063,186 4.88 3.89 White ash $5,494,052 2.96 3.24 Siberian elm $8,208,864 4.42 3.13 Common chokecherry $1,199,294 0.65 2.77 Little-leaf linden $1,483,867 0.80 2.66 Poplar spp. $12,058,120 6.50 2.66 Other trees $79,181,338 42.68 43.14
All trees $185,533,923 100% 100%
Figure 17: As Trees Mature their Replacement Value Increases (Silver Park, Missoula)
Table 7: Per-Community Replacement Value Summary
Community Value Number of Trees Per-Tree Value
Alberton $170,331 101 $1,686
Anaconda $3,817,421 2,346 $1,627
Big Timber $2,061,365 1,069 $1,928
Billings Park $14,267,515 8,335 $1,712
Bozeman $11,677,243 10,559 $1,106
Broadus $552,491 731 $756
Browning $265,901 344 $773
Butte $4,920,519 4,404 $1,117
Cascade $667,550 418 $1,597
Choteau $2,963,305 1,354 $2,189
Colstrip $907,002 855 $1,061
Columbia Falls $4,350,594 3,339 $1,303

January 2017 Montana’s Urban Forest Resource 28
Community Value Number of Trees Per-Tree Value
Columbus $2,792,760 1,192 $2,343
Conrad $2,443,445 1,203 $2,031
Culbertson $582,470 339 $1,718
Cut Bank $708,313 577 $1,228
Dillon $1,011,743 781 $1,295
Drummond $295,478 276 $1,071
Ennis $265,317 216 $1,228
Eureka $438,305 364 $1,204
Forsyth $2,006,139 716 $2,802
Fort Benton $2,221,082 895 $2,482
Fort Peck $993,486 584 $1,701
Glasgow $1,622,354 1,603 $1,012
Glendive $3,994,848 1,987 $2,010
Great Falls Malmstrom AFB $5,055,819 8,610 $587
Hamilton $4,099,701 1,639 $2,501
Hardin $1,276,249 1,000 $1,276
Harlowton $1,807,390 1,080 $1,674
Havre $6,362,590 3,554 $1,790
Helena $8,593,055 9,385 $916
Judith Gap $38,378 148 $259
Kalispell $10,718,579 9,077 $1,181
Laurel $4,681,946 3,361 $1,393
Lewiston $4,425,780 2,665 $1,661
Libby $1,680,955 1,751 $960
Livingston $7,962,169 3,888 $2,048
Lodge Grass $290,872 86 $3,382
Manhattan $1,194,913 774 $1,544
Miles City $10,202,381 4,238 $2,407
Missoula $22,885,476 22,537 $1,015
Plentywood $1,048,391 606 $1,730
Polson $2,478,907 1,584 $1,565
Red Lodge $2,786,956 2,205 $1,264
Ronan $1,456,196 867 $1,680
Roundup $2,769,185 1,548 $1,789
Saco $123,019 116 $1,061
Shelby $1,405,592 1,364 $1,030
Sheridan $184,747 141 $1,310
Sidney $3,322,735 2,125 $1,564
Stanford $250,510 297 $843
Stevensville $1,601,367 614 $2,608
Superior $845,460 347 $2,436
Thompson Falls $1,306,850 623 $2,098
Townsend $1,167,366 997 $1,171
Valier $516,258 564 $915
West Yellowstone $444,951 637 $699
Whitefish $3,532,751 3,474 $1,017
Whitehall $531,255 422 $1,259
White Sulfur Springs $1,015,056 492 $2,063
Wolf Point $1,476,415 1,016 $1,453
Total: $185,537,198 138,420 $1,340

29 Benefits from Montana’s Urban Forest January 2017
Benefits from Montana’s Urban Forest Trees conserve and reduce energy use, reduce global carbon dioxide (CO₂) levels, improve air quality, and mitigate stormwater runoff. They provide a wealth of well-documented psychological, social, and economic benefits related primarily to aesthetics. The question remains, however, if the collective benefits are worth the cost of the investment? To answer this question, the benefits are quantified in financial terms.
The analysis model quantifies benefits based on regional reference cities and local community attributes, such as median home values and local energy prices. This analysis provides a snapshot of the annual benefits (along with the value of those benefits) produced by Montana’s community forests. While the annual benefits can be substantial, it is important to recognize that the greatest benefits occur over time, from mature urban forests where trees are well-managed, healthy, and long-lived (Figure 18).
This analysis used current inventory data for Montana’s community trees and MyTreekeeper® and Treekeeper® version 7.7 software to quantify and assess the beneficial functions of the resource. The software determines a dollar value for the annual benefits these trees provide. The benefits calculated are estimations based on the best available and current scientific research with an accepted degree of uncertainty. The data returned can provide a platform from which informed management decisions can be made (Maco and McPherson, 2003). A discussion on the methods used to calculate and assign a monetary value to these benefits is included in Appendix A.
Figure 18: Mature Trees in Peterson Park Provide Benefits to the Sidney Community

January 2017 Benefits from Montana’s Urban Forest 30
Energy Savings Trees modify climate and conserve energy in three principal ways: ▪ Shading reduces the amount of radiant energy absorbed and stored by hardscape
surfaces, thereby reducing the heat island effect of urban areas. ▪ Transpiration converts moisture to water vapor, cooling the air and absorbing solar
energy that would otherwise increase temperature. ▪ Reduction of wind speed, outside to inside air movement, and conductive heat loss
through glass windows (Simpson 1998).
The heat island effect describes the increase in urban temperatures in relation to surrounding suburban and rural areas. Heat islands are associated with an increase in hardscape and impervious surfaces. Trees and other vegetation within an urbanized environment help reduce the heat island effect by lowering air temperatures 5°F (3°C) (Chandler 1965). On a broader scale, temperature differences of more than 9°F (5°C) have been observed between city centers without adequate canopy coverage and more vegetated suburban areas (Akbari 1992). The relative importance of these effects depends on the size and configuration of trees and other landscape elements (McPherson 1993). Tree spacing, crown spread, and vertical distribution of leaf area each influence the transport of warm air and pollutants along streets and out of urban canyons. Trees reduce conductive heat loss from buildings by reducing air movement into buildings and against conductive surfaces (e.g., glass, metal siding). Trees can reduce wind speed and the resulting air infiltration by up to 50%, translating into potential annual heating savings of 25% (Heisler 1986).
These savings are important in Montana because of frequent extreme temperature fluctuations, high winds, and the overall variable climate. Trees can serve in a functional capacity to provide the best benefits for any particular community’s conditions. For example, in communities with high wind speeds such as Shelby or Livingston, using trees as shelterbelts will provide protection along with environmental benefits.
Electricity and Natural Gas Reduction Electricity and natural gas saved annually in Montana from both the shading and climate effects of community trees is equal to 12,456 MWh and 1,160,647.60 therms, for a total retail savings of approximately $1,844,435 ($13.32 average per tree) (Table 8). The electricity savings is equivalent to running 2,491 central air conditioning units in homes for 1,000 hours each, and the natural gas savings is equivalent to heating 8,000 houses (2,500 square feet) for a month. Of the top ten most prevalent species, those that contribute most to energy benefits on a per-tree basis include Siberian elm (Ulmus pumila), with an average value of $27.24 annually, and poplar (Populus spp.) with an average value of $25.24 per tree (Figure 19). The elevated level of benefits provided by these two species are likely due to their medium-to-large stature and the maturity of the populations.
Small-canopy trees are less able to provide electricity and natural gas reduction benefits. On a per-tree basis, chokecherry (Prunus virginiana) provides $2.34 in average annual benefits and it is providing just 0.5% of the energy benefits (Table 8). This is a small-statured tree with 79% of its population less than 6 inches DBH. Apple/crabapple species (Malus spp.) provides $3.06 in average benefits while providing 1% of the energy benefits. This is another small-stature tree with 90% of its population less than 12 inches DBH. These energy benefits will increase over time as this younger population matures and grows in size.

31 Benefits from Montana’s Urban Forest January 2017
Figure 19: Top Five Highest Per-Tree Annual Electricity and Natural Gas Benefits
Table 8: Annual Electric and Natural Gas Benefits
Species Total
Electricity (KWh)
Total Natural
Gas (Therms)
Total ($) % of Pop
% of Total
$
Avg. $/tree
Green ash 3,141,479 293,375 $465,772 20.28 25.25 $16.59 Norway maple 1,571,355 143,466 $230,004 9.66 12.47 $17.20 Ash spp. 848,825 77,543 $124,286 4.43 6.74 $20.29 Crabapple spp. 108,897 11,773 $17,599 4.15 0.95 $3.06 Colorado blue spruce 351,992 41,068 $59,619 3.89 3.23 $11.08 White ash 525,022 51,037 $79,661 3.24 4.32 $17.78 Siberian elm 816,339 72,986 $118,089 3.13 6.40 $27.24 Common chokecherry 53,680 6,112 $8,956 2.77 0.49 $2.34
Little-leaf linden 100,442 11,242 $16,580 2.66 0.90 $4.50 Poplar spp. 673,391 55,256 $92,922 2.66 5.04 $25.24 Other Trees 4,264,428 396,790 $630,947 43.14 34.21 $10.57 All Trees 12,455,850 1,160,648 $1,844,435 100% 100% $13.32
$17.20
$17.78
$20.29
$25.24
$27.24
$0.00 $5.00 $10.00 $15.00 $20.00 $25.00 $30.00
Norway maple
White ash
Ash spp.
Poplar spp.
Siberian elm
Energy Benefits

January 2017 Benefits from Montana’s Urban Forest 32
Atmospheric Carbon Dioxide Reduction As environmental awareness continues to increase, local governments will pay particular attention to climate change and the effects of greenhouse gas (GHG) emissions. As energy from the sun (sunlight) strikes the Earth’s surface it is reflected back into space as infrared radiation (heat). Greenhouse gases absorb some of this infrared radiation and trap heat in the atmosphere, modifying the temperature of the Earth’s surface. Many chemical compounds in the Earth’s atmosphere act as GHGs, including methane (CH4), nitrous oxide (N₂O), carbon dioxide (CO₂), water vapor, and human-made gases and aerosols. As GHGs increase, the amount of energy radiated back into space decreases, trapping more heat in the atmosphere. Increases in the average temperature of the earth are resulting in changes in weather, sea levels, and land-use patterns. In the last 150 years, since large-scale industrialization began, the levels of some GHGs, including CO₂, have increased by 25 percent (U.S. Energy Information Administration).
The Center for Urban Forest Research (CUFR) recently led the development of Urban Forest Project Reporting Protocol. The protocol, which incorporates methods of the Kyoto Protocol and Voluntary Carbon Standard (VCS), establishes methods for calculating reductions, provides guidance for accounting and reporting, and guides urban forest managers in developing tree planting and stewardship projects that could be registered for GHG reduction credits (offsets). The protocol can be applied to urban tree planting projects within municipalities, campuses, and utility service areas anywhere in the United States.
Urban trees reduce atmospheric CO₂ in two ways: ▪ Directly, through growth and the sequestration of CO₂ in wood, foliar biomass, and soil. ▪ Indirectly, by lowering the demand for heating and air conditioning, thereby reducing the
emissions associated with electric power generation and natural gas consumption.
Conversely, vehicles and other combustion engines used to plant and care for trees release CO₂ during operation and CO₂ is released back into the atmosphere during decomposition, after trees die. Each of these factors must be considered when calculating the net CO₂ benefits of trees.
Carbon Dioxide Benefits Annually, community trees in Montana sequester 4,768 tons of CO₂ into woody and foliar biomass and avoid3 5,874 tons of CO₂, valued at $147,635. This is equivalent to the amount of CO2 produced by burning 1.1 million gallons of gasoline. Of the top ten most prevalent species, Siberian elm, poplar spp. and ash (green ash, white ash and ash spp. combined) currently provide the highest annual per tree benefits ($2.29/Siberian elm, $2.23/poplar spp, $2.16/combined ash) (Table 9, Figure 20). Ash trees provide the overall highest amount of annual carbon benefits, valued at $62,327, 64% of the total benefit.
3 Avoided Carbon: Avoided carbon is a result of reducing energy consumption. The avoided value represents carbon that would have been created from the production of additional energy.

33 Benefits from Montana’s Urban Forest January 2017
Figure 20: Top Five Highest Per-Tree Annual Carbon Benefits
Table 9: Summary of Annual Carbon Benefits
Species Sequestered (lb.)
Avoided (lb.) Total ($) % of
Pop
% of Total
$
Avg. $/tree
Green ash 2,306,288 2,551,826 $34,282 20.28 23.22 $1.22 Norway maple 479,484 608,411 $7,417 9.66 5.02 $0.55 Ash spp. 1,117,931 1,244,151 $16,615 4.43 11.25 $2.71 Crabapple spp. 235,050 208,337 $3,060 4.15 2.07 $0.53 Colorado blue spruce 277,867 360,061 $4,364 3.89 2.96 $0.81 White ash 779,760 834,418 $11,430 3.24 7.74 $2.55 Siberian elm 608,105 802,128 $9,932 3.13 6.73 $2.29 Common chokecherry 48,403 37,520 $597 2.77 0.40 $0 Little-leaf linden 40,555 66,942 $759 2.66 0.51 $0.21 Poplar spp. 491,375 734,835 $8,210 2.66 5.56 $2.23 Other Trees 3,151,724 4,299,635 $50,970 43.14 34.52 $0.85
All Trees 9,536,542 11,748,263 $147,635 100% 100% $1.07
$1.22
$2.29
$2.23
$2.55
$2.71
$0.00 $0.50 $1.00 $1.50 $2.00 $2.50 $3.00
Green ash
Siberian elm
Poplar spp.
White ash
Ash spp.
CO₂ Benefits

January 2017 Benefits from Montana’s Urban Forest 34
Air Quality Improvement Urban trees improve air quality in five fundamental ways:
▪ Absorption of gaseous pollutants such as ozone (O₃), sulfur dioxide (SO₂), and nitrogen dioxide (NO₂) through leaf surfaces
▪ Interception of particulate matter (PM10), such as dust, ash, dirt, pollen, and smoke ▪ Reduction of emissions from power generation by reducing energy consumption ▪ Increase of oxygen levels through photosynthesis ▪ Transpiration (the process of water movement and evaporation in plants) and shade
provision, resulting in lower local air temperatures, thereby reducing ozone (O₃) levels
PM10 is particulate matter in the air that measures less than 10 micrometers, smaller than the width of a single human hair. These small particles or liquid droplets include smoke, soot, dust, and secondary reactions from gaseous pollutants. PM10 pollution is detrimental to health and can cause respiratory problems for local residents.
Ozone (O₃) is another air pollutant that is harmful to human health. Ozone forms when nitrogen oxides from fuel combustion and volatile organic gases from evaporated petroleum products react in the presence of sunshine.
In the absence of cooling effects provided by trees, higher temperatures contribute to ozone (O₃) formation. Additionally, short-term increases in ozone concentrations are statistically associated with increased tree mortality (Bell et al. 2004).
While trees do a great deal to absorb air pollutants (especially ozone and particulate matter), they also negatively contribute to air pollution. Trees emit various biogenic volatile organic compounds (BVOCs), such as isoprenes and monoterpenes, which contribute to ozone formation. The analysis for this inventory accounts for these BVOC emissions in the air quality net benefit calculation.
In Montana, air quality issues include drought-related dust in the eastern ranching and farming communities, and smoke inversions in western mountain valley communities. Smoke from wildfires affects not only the wildland urban interface, but also entire communities in a large radius surrounding the incident. Large wildfires in the western United States can pump as much carbon dioxide into the atmosphere in just a few weeks as cars do in those areas in an entire year. A community with a healthy urban tree population can help trap, settle, and hold dust and particulate pollutants from smoke and combat some of the CO2 emitted from the fires (Thompson 2007). Table 10 includes management strategies for improving air quality.

35 Benefits from Montana’s Urban Forest January 2017
Table 10: Urban Forest Management Strategies to Improve Air Quality
Strategy Result Increase the number of healthy trees Increase pollution removal
Sustain existing tree cover Maintain pollution removal levels
Maximize use of low VOC-emitting trees Reduce ozone and carbon monoxide formation
Sustain large, healthy trees Large trees have greatest per-tree effects
Use long-lived trees Reduce long-term pollutant emissions from planting and removal
Use low maintenance trees Minimize pollutants emissions from maintenance activities
Plant trees in energy-conserving locations Reduce pollutant emissions from power plants
Plant trees to shade parked cars Reduce vehicular VOC emissions
Supply ample water to vegetation Enhance pollution removal and temperature reduction Plant trees in polluted or heavily populated areas Maximize tree air quality benefits
Avoid pollutant-sensitive species Reduce tree maintenance and replacement
Utilize evergreen trees for particulate matter Year-round removal of particles
Air Quality Benefits Each year, 47,513 pounds of nitrogen dioxide (NO₂), sulfur dioxide (SO₂), small particulate matter (PM10), and ozone (O₃) are intercepted, absorbed or avoided by community trees, for a value of $123,273. The highest value per tree is the poplar (Populus spp.) at $2.42 per tree (Figure 21). Ash trees (green, white and spp.) are the greatest contributors to pollutant interception and absorption, accounting for 37% of these benefits (Table 11).
Figure 21: Top Five Highest Per-Tree Air Quality Benefits
$0.88
$1.73
$1.81
$2.04
$2.42
$0.00 $0.50 $1.00 $1.50 $2.00 $2.50 $3.00
Green ash
Siberian elm
White ash
Ash spp.
Poplar spp.
Air Quality Benefits

January 2017 Benefits from Montana’s Urban Forest 36
Table 11: Summary of Annual Air Quality Benefits
Species Pollutants (lb.)
Total benefit ($) % of Pop
% of Total
$
Avg. $/tree
Green ash 10,072 $24,639 20.28 19.99 $0.88 Norway maple 2,945 $6,952 9.66 5.64 $0.52 Ash spp. 4,756 $12,517 4.43 10.15 $2.04 Crabapple spp. 867 $2,533 4.15 2.05 $0.44 Colorado blue spruce 1,399 $3,410 3.89 2.77 $0.63 White ash 3,138 $8,130 3.24 6.60 $1.81 Siberian elm 3,065 $7,521 3.13 6.10 $1.73 Common chokecherry 158 $396 2.77 0.32 $0.10 Little-leaf linden 306 $759 2.66 0.62 $0.21 Poplar spp. 3,112 $8,908 2.66 7.23 $2.42 Other Trees 17,695 $47,508 43.14 38.54 $0.80
All Trees 47,513 $123,273 100% 100% $0.89
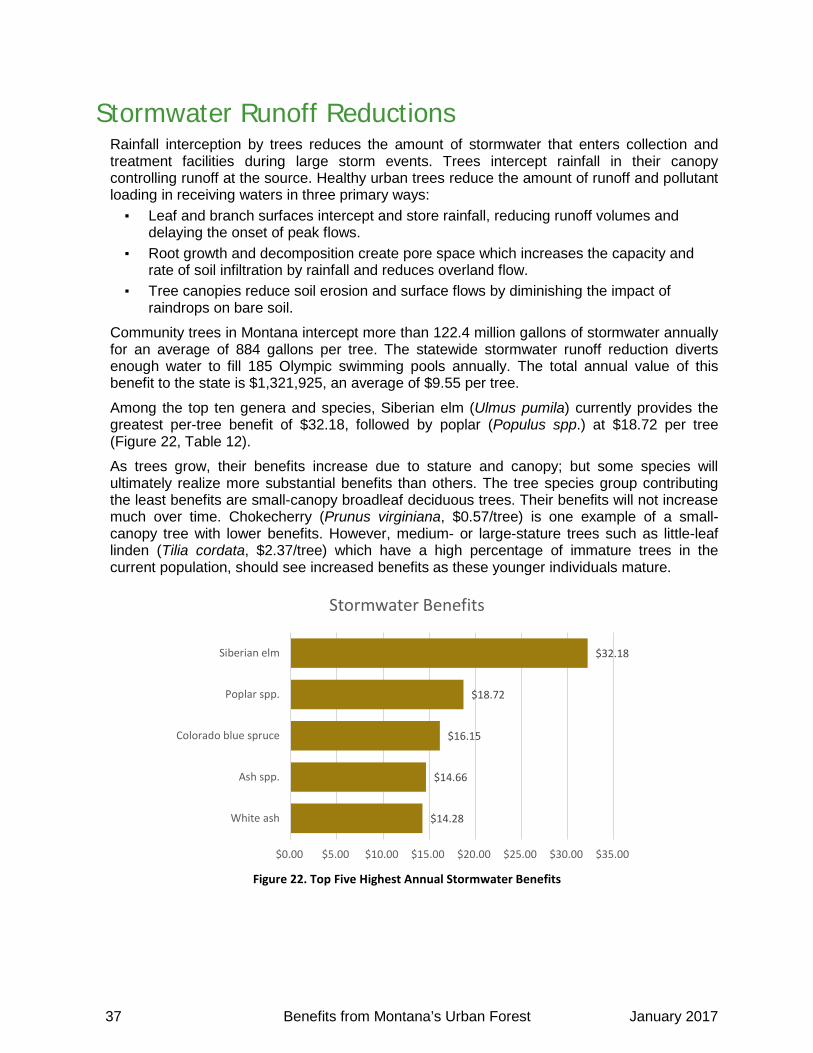
37 Benefits from Montana’s Urban Forest January 2017
Stormwater Runoff Reductions Rainfall interception by trees reduces the amount of stormwater that enters collection and treatment facilities during large storm events. Trees intercept rainfall in their canopy controlling runoff at the source. Healthy urban trees reduce the amount of runoff and pollutant loading in receiving waters in three primary ways: ▪ Leaf and branch surfaces intercept and store rainfall, reducing runoff volumes and
delaying the onset of peak flows. ▪ Root growth and decomposition create pore space which increases the capacity and
rate of soil infiltration by rainfall and reduces overland flow. ▪ Tree canopies reduce soil erosion and surface flows by diminishing the impact of
raindrops on bare soil.
Community trees in Montana intercept more than 122.4 million gallons of stormwater annually for an average of 884 gallons per tree. The statewide stormwater runoff reduction diverts enough water to fill 185 Olympic swimming pools annually. The total annual value of this benefit to the state is $1,321,925, an average of $9.55 per tree.
Among the top ten genera and species, Siberian elm (Ulmus pumila) currently provides the greatest per-tree benefit of $32.18, followed by poplar (Populus spp.) at $18.72 per tree (Figure 22, Table 12).
As trees grow, their benefits increase due to stature and canopy; but some species will ultimately realize more substantial benefits than others. The tree species group contributing the least benefits are small-canopy broadleaf deciduous trees. Their benefits will not increase much over time. Chokecherry (Prunus virginiana, $0.57/tree) is one example of a small-canopy tree with lower benefits. However, medium- or large-stature trees such as little-leaf linden (Tilia cordata, $2.37/tree) which have a high percentage of immature trees in the current population, should see increased benefits as these younger individuals mature.
Figure 22. Top Five Highest Annual Stormwater Benefits
$14.28
$14.66
$16.15
$18.72
$32.18
$0.00 $5.00 $10.00 $15.00 $20.00 $25.00 $30.00 $35.00
White ash
Ash spp.
Colorado blue spruce
Poplar spp.
Siberian elm
Stormwater Benefits

January 2017 Benefits from Montana’s Urban Forest 38
Table 12. Summary of Annual Stormwater Runoff Reduction Benefits
Species Total Rainfall Interception
(Gal) Total ($) % of Pop % of
Total $ Avg.
$/tree
Green ash 22,619,185 $244,287 20.28 18.48 $8.70 Norway maple 10,442,075 $112,774 9.66 8.53 $8.43 Ash spp. 8,315,863 $89,811 4.43 6.79 $14.66 Crabapple spp. 720,202 $7,778 4.15 0.59 $1.35 Colorado blue spruce 8,047,093 $86,909 3.89 6.57 $16.15 White ash 5,924,867 $63,989 3.24 4.84 $14.28 Siberian elm 12,916,084 $139,494 3.13 10.55 $32.18 Common chokecherry 203,957 $2,203 2.77 0.17 $0.57 Little-leaf linden 808,788 $8,735 2.66 0.66 $2.37 Poplar spp. 6,380,828 $68,913 2.66 5.21 $18.72 Other Trees 46,021,541 $497,033 43.14 37.60 $8.32
All Trees 122,400,482 $1,321,925 100% 100% $9.55

39 Benefits from Montana’s Urban Forest January 2017
Aesthetic, Property Value, and Socioeconomic Benefits
Trees provide beauty in the urban landscape, privacy for homeowners, improved human health, a sense of comfort and place, and habitat for urban wildlife (Figure 23). Research shows that trees promote better business by stimulating more frequent and extended shopping and a willingness to pay more for goods and parking (Wolf 1999). Some of these benefits capture a percentage of the value of the property on which a tree stands. To determine the value of these less tangible benefits, MyTreekeeper® uses research that compares differences in sales prices of homes to estimate the contribution associated with trees. Differences in housing prices in relation to the presence or absence of a street tree help define the aesthetic value of street trees in the urban environment.
The calculation of annual aesthetic, property value and socioeconomic benefits corresponds with a tree’s annual increase in leaf area. This equation uses the average sales prices of homes in the region, the value a large tree adds to a home, and the leaf surface area. When a tree is actively growing, leaf area may increase dramatically. Once a tree is mature, there may be little or no net increase in leaf area from one year to the next; thus, there is little or no incremental annual aesthetic benefit for that year even though the cumulative benefit over the course of the entire life of the tree may be large. Since this report represents a one-year sample snapshot of the inventoried tree population, aesthetic benefits reflect the increase in leaf area for each species population over the course of a single year.
The total annual benefit from community trees associated with property value increases and other less tangible benefits is almost $13.7 million, an average of $99 per tree (Table 13, Figure 24). This property value benefit would buy nearly 71 homes in Montana at median price. Overall, among the top ten most prevalent species, Siberian elm (Ulmus pumila, $197.93) and ash (Fraxinus spp., $145.95) provide the greatest per-tree property value annually, likely due to large leaf surface area.
Figure 23. Ash Trees in Columbus Provide Aesthetic Values to the Community

January 2017 Benefits from Montana’s Urban Forest 40
Figure 24. Top Five Species with the Highest Property Value Benefits
Table 13. Summary of Annual Aesthetic, Property Value, and Socioeconomic Benefits
Species Total ($) % of Pop % of Total $
Avg. $/tree
Green ash $3,957,573 20.28 28.79 $140.99 Norway maple $1,255,208 9.66 9.13 $93.85 Ash spp. $941,266 4.43 6.85 $153.65 Crabapple spp. $207,678 4.15 1.51 $36.13 Colorado blue spruce $405,759 3.89 2.95 $75.42 White ash $641,727 3.24 4.67 $143.24 Siberian elm $858,044 3.13 6.24 $197.93 Common chokecherry $127,776 2.77 0.93 $33.33 Little-leaf linden $267,863 2.66 1.95 $72.73 Poplar spp. $448,635 2.66 3.26 $121.85 Other Trees $4,635,914 43.14 33.72 $77.64 All Trees $13,747,444 100% 100% $99.32
$121.85
$140.99
$143.24
$153.65
$197.93
$0.00 $50.00 $100.00 $150.00 $200.00 $250.00
Poplar spp.
Green ash
White ash
Ash spp.
Siberian elm
Property Values

41 Summary of Benefits January 2017
Summary of Benefits
Figure 25. Summary of Annual Per-Tree Benefits for the Top Ten Species
$0 $50 $100 $150 $200 $250 $300
All Other Species
Common Chokecherry
Crabapple spp.
Little-leaf linden
Colorado blue spruce
Norway maple
Green ash
Poplar spp.
White ash
Ash spp.
Siberian elm
Per-Tree Values
Energy CO2 Air Quality Stormwater Aesthetic/Other
$193.35
$179.66
$170.46
$168.38
$120.55
$104.09
$80.02
$41.51
$36.34
$98.18
$261.37

January 2017 Summary of Benefits 42
Table 14. Summary of Annual Per-Tree Benefits for the Top Ten Species Species Energy CO₂ Air Quality Stormwater Aesthetic/Other Total Green ash $16.59 $1.22 $0.88 $8.70 $140.99 $168.38 Norway maple $17.20 $0.55 $0.52 $8.43 $93.85 $120.56 Ash spp. $20.29 $2.71 $2.04 $14.66 $153.65 $193.36 Crabapple spp. $3.06 $0.53 $0.44 $1.35 $36.13 $41.52 Colorado blue spruce $11.08 $0.81 $0.63 $16.15 $75.42 $104.10 White ash $17.78 $2.55 $1.81 $14.28 $143.24 $179.67 Siberian elm $27.24 $2.29 $1.73 $32.18 $197.93 $261.38 Common chokecherry $2.34 $0 $0.10 $0.57 $33.33 $36.50 Little-leaf linden $4.50 $0.21 $0.21 $2.37 $72.73 $80.01 Poplar spp. $25.24 $2.23 $2.42 $18.72 $121.85 $170.45 Other Trees $10.57 $0.85 $0.80 $8.32 $77.64 $98.18 All Trees $13.32 $1.07 $0.89 $9.55 $99.32 $124.15
Figure 26: Siberian Elms Provide the Greatest Overall Per-Tree Benefit

43 Benefit-Investment Ratio (BIR) January 2017
Benefit-Investment Ratio (BIR) Montana receives substantial benefits from community forests; however, the communities must also consider their investments in maintaining this resource. Applying a benefit-investment ratio (BIR) is a useful way to evaluate the public investment in a community tree resource. The benefit-investment ratio is used to summarize the overall value compared to the investments of a given resource. In this analysis, BIR is the ratio of the total value of benefits provided by all inventoried trees compared to the cost (investment) associated with their management.
A BIR was generated for all Tree City USA communities with inventory and budget data (40 communities) (Table 15). Tree City USA-reported expenditures may differ from standard municipal budgetary information as this program includes grant funding, volunteer hours, in-kind funds, local donations, adopt-a-tree programs, and other similar figures that typically are not considered in municipal budgets.
The total estimated community urban forest benefits provided by the combined inventories of the 40 Tree City USA communities is almost $14.5 million, a value of $119 per tree and $31 per capita. These benefits are realized on an annual basis. It is important to acknowledge that this is not a full accounting of the benefits provided by this resource, as some benefits are intangible and/or difficult to quantify, such as impacts on psychological health, crime, and violence. Empirical evidence of these benefits does exist (Wolf 2007, Kaplan 1989, Ulrich 1986), but limited knowledge about the physical processes at work and the complex nature of interactions makes quantification imprecise. Tree growth and mortality rates are highly variable. A true and full accounting of benefits and investments must assess variability among sites (e.g., tree species, growing conditions, maintenance practices) and variability in tree growth. Some trees may be worth far more than this analysis conveys. Considering the total budget (investment) of Tree City USA communities ($3.3 million), the total annual net benefit (benefits minus investment) is $11.2 million. The average net benefit for an individual community tree is $92 and the per capita net benefit is $24. For every $1 dollar invested in the urban forest, Tree City USA communities in Montana are receiving $4.41 in benefits.

January 2017 Benefit-Investment Ratio (BIR) 44
Table 15. Tree City USA Benefits Investment Ratio (BIR) Community Population Expenditures Per capita Benefits Qty. Trees BIR Anaconda 9,139 $36,829 $4.03 $303,074 2,346 $8.23
Billings 110,263 $267,323 $2.42 $1,008,729 8,335 $3.77
Bozeman 43,405 $533,073 $12.28 $1,205,748 10,559 $2.26
Broadus 488 $1,800 $3.69 $78,892 731 $43.83
Butte 33,922 $106,852 $3.15 $345,347 4,404 $3.23
Cascade 696 $3,438 $4.94 $50,196 418 $14.60
Choteau 1,696 $7,287 $4.30 $215,218 1,354 $29.53
Columbia Falls 5,093 $14,222 $2.79 $197,077 3,339 $13.86
Dillon 4,210 $25,390 $6.03 $125,563 781 $4.95
Drummond 336 $1,028 $3.06 $28,628 276 $27.84
Ennis 884 $2,965 $3.35 $23,559 216 $7.95
Eureka 1,074 $6,675 $6.22 $31,191 364 $4.67
Forsyth 1,892 $4,525 $2.39 $115,273 716 $25.47
Fort Benton 1,460 $27,285 $18.69 $151,489 895 $5.55
Glendive 5,490 $21,344 $3.89 $315,661 1,987 $14.79
Great Falls 59,638 $565,383 $9.48 $563,816 8,610 $1.00
Hamilton 4,602 $13,703 $2.98 $240,429 1,639 $17.55
Harlowton 979 $5,992 $6.12 $196,974 1,080 $32.87
Havre 9,834 $52,848 $5.37 $622,384 3,554 $11.78
Helena 30,581 $229,715 $7.51 $1,284,720 9,385 $5.59
Judith Gap 125 $1,826 $14.61 $17,356 148 $9.50
Kalispell 22,052 $260,356 $11.81 $891,375 9,077 $3.42
Laurel 6,943 $200,497 $28.88 $628,740 3,361 $3.14
Lewistown 5,874 $45,776 $7.79 $439,269 2,665 $9.60
Libby 2,645 $5,400 $2.04 $135,322 1,751 $25.06
Livingston 7,307 $22,140 $3.03 $644,150 3,888 $29.09
Manhattan 1,631 $40,842 $25.04 $96,036 774 $2.35
Missoula 71,022 $400,342 $5.64 $2,482,612 22,537 $6.20
Polson 4,707 $36,659 $7.79 $202,732 1,584 $5.53
Red Lodge 2,222 $25,837 $11.63 $246,350 2,205 $9.53
Roundup 1,836 $31,406 $17.11 $307,540 1,548 $9.79
Shelby 3,268 $32,480 $9.94 $162,682 1,364 $5.01
Sidney 6,828 $12,699 $1.86 $308,222 2,125 $24.27
Stanford 381 $54,617 $143.35 $48,744 297 $0.89
Thompson Falls 1,332 $45,315 $34.02 $75,632 623 $1.67
Townsend 1,959 $8,005 $4.09 $114,690 997 $14.33
Valier 508 $1,321 $2.60 $76,253 564 $57.72 White Sulphur Springs 910 $3,260 $3.58 $57,573 492 $17.66
Whitefish 7,073 $49,234 $6.96 $340,775 3,474 $6.92
Whitehall 1,094 $7,800 $7.13 $56,312 422 $7.22
Total 475,399 $3,271,621 $14,436,333 120,885 $4.41
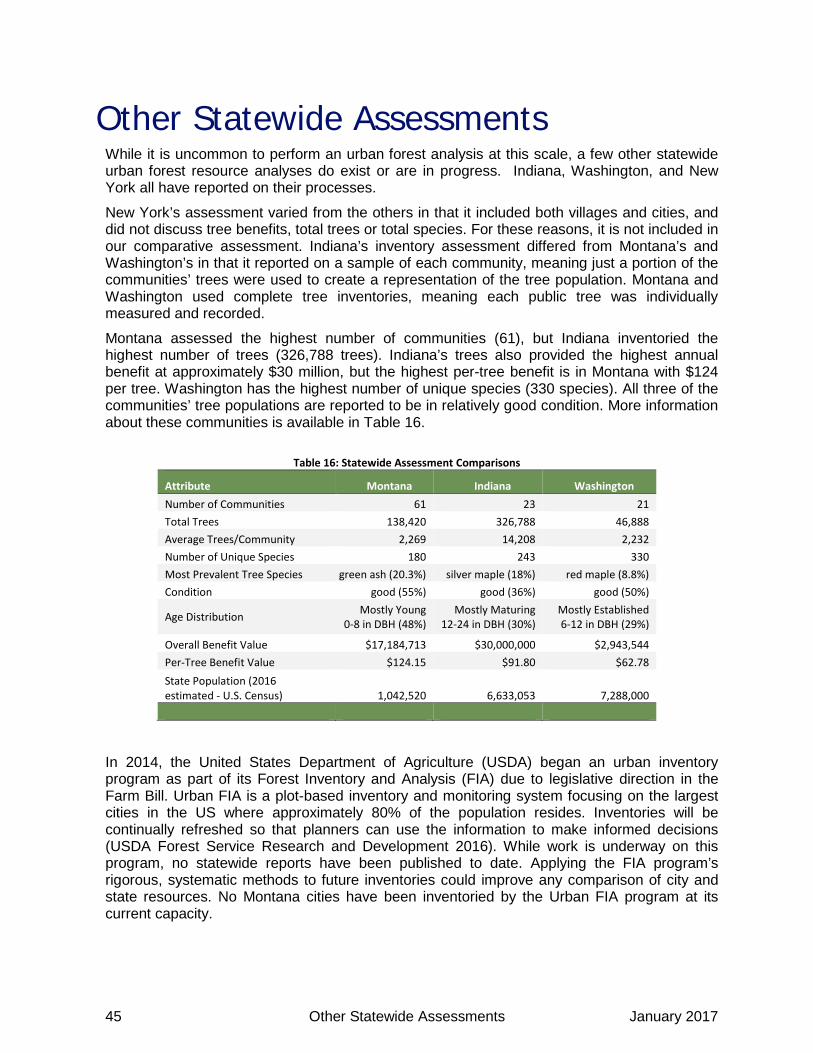
45 Other Statewide Assessments January 2017
Other Statewide Assessments While it is uncommon to perform an urban forest analysis at this scale, a few other statewide urban forest resource analyses do exist or are in progress. Indiana, Washington, and New York all have reported on their processes.
New York’s assessment varied from the others in that it included both villages and cities, and did not discuss tree benefits, total trees or total species. For these reasons, it is not included in our comparative assessment. Indiana’s inventory assessment differed from Montana’s and Washington’s in that it reported on a sample of each community, meaning just a portion of the communities’ trees were used to create a representation of the tree population. Montana and Washington used complete tree inventories, meaning each public tree was individually measured and recorded.
Montana assessed the highest number of communities (61), but Indiana inventoried the highest number of trees (326,788 trees). Indiana’s trees also provided the highest annual benefit at approximately $30 million, but the highest per-tree benefit is in Montana with $124 per tree. Washington has the highest number of unique species (330 species). All three of the communities’ tree populations are reported to be in relatively good condition. More information about these communities is available in Table 16.
Table 16: Statewide Assessment Comparisons
Attribute Montana Indiana Washington Number of Communities 61 23 21 Total Trees 138,420 326,788 46,888 Average Trees/Community 2,269 14,208 2,232 Number of Unique Species 180 243 330 Most Prevalent Tree Species green ash (20.3%) silver maple (18%) red maple (8.8%) Condition good (55%) good (36%) good (50%)
Age Distribution Mostly Young 0-8 in DBH (48%)
Mostly Maturing 12-24 in DBH (30%)
Mostly Established 6-12 in DBH (29%)
Overall Benefit Value $17,184,713 $30,000,000 $2,943,544 Per-Tree Benefit Value $124.15 $91.80 $62.78 State Population (2016 estimated - U.S. Census) 1,042,520 6,633,053 7,288,000
In 2014, the United States Department of Agriculture (USDA) began an urban inventory program as part of its Forest Inventory and Analysis (FIA) due to legislative direction in the Farm Bill. Urban FIA is a plot-based inventory and monitoring system focusing on the largest cities in the US where approximately 80% of the population resides. Inventories will be continually refreshed so that planners can use the information to make informed decisions (USDA Forest Service Research and Development 2016). While work is underway on this program, no statewide reports have been published to date. Applying the FIA program’s rigorous, systematic methods to future inventories could improve any comparison of city and state resources. No Montana cities have been inventoried by the Urban FIA program at its current capacity.

January 2017 Conclusion 46
Conclusion This analysis describes the current overall structural characteristics of Montana’s community forest resources using established tree sampling, numerical modeling, and statistical methods to provide a general accounting of the benefits. The analysis provides a “snapshot” of this resource at its current population, structure, and condition. Rather than examining each individual tree, as an inventory does, a resource analysis examines trends and performance measures across the urban forest, or in this case across multiple community forests within the state, and for each of the predominant species populations within. The goals of the assessment were to:
▪ Determine the current composition and condition of Montana’s community forests ▪ Quantify the ecosystem services Montana’s community forest provides ▪ Provide an improved understanding of the community forest and the benefits it provides
to the general public and public officials ▪ Identify new opportunities to increase benefits to communities and the state of Montana
Across the state of Montana, community trees are providing quantifiable impacts on air quality, reduction in atmospheric CO₂, stormwater runoff, and aesthetic benefits. The 138,420 community trees are providing over $17.2 million in annual gross benefits, an average of $124.15 per tree.
At the state level, community forests in Montana have a nearly ideal age distribution of young, established, and mature trees in good condition. More than 180 different species are documented, however the species diversity of several communities with large ash populations should be improved in preparation for the arrival of emerald ash borer. Each community can increase the benefits from their individual urban forest by using all available planting sites to increase the stocking level (currently 87.9% overall) as well as by replacing mature trees that are in decline and recommended for removal (3.6% overall). Communities should continue to focus resources on preserving existing and mature trees to maintain health, improve structure, promote tree longevity, and manage risk. Structural pruning and training young trees will reduce long-term maintenance costs and ensure proper form as trees mature. Davey Resource Group recommends the following: ▪ Increase species diversity to ensure that new tree plantings include a variety of suitable
species and do not rely on prevalent species. ▪ Increase stocking level by using all available planting sites and plant large-stature
species wherever space allows. ▪ Provide structural pruning for young trees and a regular pruning cycle for all trees. ▪ Protect existing trees and manage risk with regular inspection to identify and mitigate
structural and age-related defects. ▪ Continue to maintain and update the inventory database, including tracking tree growth
and condition during regular pruning cycles.
In addition, Montana DNRC can help to further the benefits of trees and urban forestry by providing the following services to communities:
▪ Continue providing support for community forestry programs with technical assistance, financial assistance, public education and volunteer coordination.
▪ Continue to inventory communities to develop a more complete picture of Montana’s community forests.
▪ Develop a general Urban and Community Forestry Program plan. Work with individual communities to plan for their specific needs.

47 Conclusion January 2017
▪ Encourage communities to understand the important distinction between forestry and urban forestry, and help them to develop proactive urban forest maintenance plans.
▪ Further explore the inventory by sub-regions to find additional trends that might encourage maintenance practices.
Community forest managers can better anticipate future trends with an understanding of their communities’ tree conditions. Managers can also anticipate challenges and devise plans to increase benefits. Performance data from this analysis can help make determinations regarding species selection, distribution, and maintenance policies. Documentation of current structure is necessary for establishing goals and performance objectives, and can serve as a benchmark for measuring future success. Information from this analysis can be referenced in the development of an urban forest management or master plan. An urban forest master plan inspires commitment, provides tools for communication with key decision-makers and informs communities about their current urban forest baseline and future goals and challenges. The next steps are determining the desired outcomes and how to accomplish these outcomes. Considerations should include: ▪ Development of management plans – at the state and community levels. These plans
will utilize existing resources to reach goals ▪ Maintenance of the inventory – keep it live and ongoing, rather than a snapshot. Utilize
TreeKeeper 7.7, the state’s new inventory management system ▪ Initiation of training – starting 2017, local communities will have the ability to update and
manage their own urban forest inventories using DNRC’s TreeKeeper 7.7 system, and between DNRC and DRG plenty of opportunities exist to train staff on the use of this software, whether it be onsite or remotely.
▪ Public awareness (locally, and statewide) – Share the inventory factsheets with city council, tree boards, or organizations that should be aware of tree benefits. Share the executive summary at the state level to further educate and raise awareness.
▪ Currently, inventoried communities have 1 tree per 3 people. As an initial goal, aim to reverse that with 3 trees per person.
Montana’s community trees are imperative to the environmental, social, and economic well-being of the community. The state has demonstrated that public trees are a valued community resource, a vital component of the urban infrastructure, and an important part of Montana’s history and identity (Figure 27). The inventory data can aid in planning a proactive approach to the future care of community trees. Inventory updates should continue as regular maintenance is performed, including updating the DBH and condition of existing trees. Current and complete inventory data will help local and state managers more efficiently track maintenance activities and tree health, and will help inform management decisions. A continued commitment to planting, maintaining, and preserving these trees will support the health and welfare of the state and the surrounding region.

January 2017 Conclusion 48
Figure 27. City of Whitefish Arbor Day Celebration. Community trees are an important part of Montana’s history and identity. Every April students learn how trees benefit their community and future generations at Arbor Day
tree plantings.

49 Appendix A: Methodology January 2017
Appendix A: Methodology Between 2007 and 2015, DNRC technicians or certified arborists conducted inventories of publicly-owned street and right-of-way trees in 61 communities across the State of Montana. The inventories included details about each tree’s species, size, and condition. To determine the overall structure and benefits of community trees in Montana, the inventory data was formatted for use in Treekeeper® version 7.7 and MyTreekeeper®, tree management and assessment tools developed by Davey Resource Group. Treekeeper® version 7.7 was designed to be highly customizable, allowing the user to connect various tree attributes and types of information to it per project specifications. Matrix reports, generated by Treekeeper® provided the data for structural analysis, include species prevalence, condition ratings, and age distribution. MyTreekeeper®, which used the National Tree Benefits Calculator (treebenefits.org), provided data on environmental, aesthetic, and socioeconomic benefits as well as tree value estimates. The National Tree Benefits Calculator is based on i-Tree STREETS. It uses the same base values as i-Tree STREETS, a peer-reviewed software suite from the USDA Forest Service, to calculate benefits. These tools were used in combination to assess tree population structure and function, including the role of trees in reducing energy use, air pollution removal, stormwater interception, carbon dioxide removal, and property value increases. To analyze the economic benefits of Montana’s community trees, MyTreekeeper® was used to calculate the dollar value of annual resource functionality. This analysis considered all the inventoried community tree populations as a whole to develop an assessment of statewide trends and benefit modeling regarding the structure, function, and value of the overall resource.
An annual resource unit was determined on a per tree basis for each of the modeled benefits. Resource units are measured as MWh of electricity saved per tree; therms of natural gas conserved per tree; pounds of atmospheric CO₂ reduced per tree; pounds of NO₂, SO₂, O₃, PM10, and VOCs reduced per tree; cubic feet of stormwater runoff reduced per tree; and square feet of leaf area added per tree to increase property values.
Price values assigned to each resource unit were generated based on economic indicators of society’s willingness to pay for the environmental benefits trees provide. Communities that report an annual budget to Tree City USA provided estimated investment costs for contracted and in-house tree services, pest management, administration, and inspections.
Tree Condition ratings were used in the calculation of annual benefits. Condition ratings for this analysis are defined as the condition of the wood:
Good- Greater than 85% of a tree’s wood is alive and circumference of the trunk has bark. The tree is in good health with no defects which will affect the tree’s longevity. Form is characteristic of the species.
Fair- Dieback of 15-50% of small branches; or 1-2 large branches dead; or 15-50% of trunk circumference dead; or fruiting bodies present.
Poor- Dieback of 50-90% of small branches, 3 or more major branches dead and priority pruning is required. 50-90% of trunk circumference dead, decayed and/or hollow.
Dead or Dying- Less than 10% of the tree’s wood is alive. Likelihood for saving the tree is minimal or non-existent, or tree is currently dead.
Estimates of benefits are initial approximations as some benefits are difficult to quantify (e.g. impacts on psychological health, crime, and violence). In addition, limited knowledge about the physical processes at work and their interactions makes estimates imprecise (e.g., the fate of air pollutants trapped by trees and then washed to the ground by rainfall). Therefore, this method of quantification provides first-order approximations based on current research. It is intended to be a general accounting of the benefits produced by urban trees.

January 2017 Appendix B: Glossary of Terms 50
Appendix B: Glossary of Terms Benefit-Investment Ratio – the remaining benefits once the expenditures are removed from the total benefits
Carbon avoidance – the amount of carbon prevented from being released into the atmosphere due to heating and cooling reductions
Carbon sequestration – the removal of carbon dioxide from the air by plants
CO2 – carbon dioxide
Diameter at Breast Height (DBH) – the diameter of the tree measured 4 ft., 6 in
Leaf surface area – the distribution of leaves in a tree (both horizontal and vertical). This is an area calculation, which differs from canopy cover as it includes vertical area and canopy overlap
NO2 – nitrogen dioxide
O3 – ozone
PM10 – particulate matter less than 10 microns and greater than 2.5 microns
Relative age distribution – the distribution of trees based on their diameter class, which determines their relative age
Replacement value – the cost to replace a tree with another of a similar size, species, and condition
SO2 – sulfur dioxide
Stocking level – trees per available space
Stormwater runoff – rainfall that is unable to percolate the ground or otherwise be intercepted
Ton – short ton (U.S.), 2,000 pounds
Tree condition – a determination of how trees are performing in a site

51 Appendix C: References January 2017
Appendix C: References Akbari, H., Davis, S., Dorsano, S., Huang, J., and S. Winnett. eds. 1992. Cooling Our Communities: A Guidebook on Tree Planting and Light-Colored Surfacing. Washington, DC. U.S. Environmental Protection Agency. 26 p.
Bell, M.L., McDermott, A., Zeger, S.L., Samet, J.M., and F. Dominici. 2004. Ozone and Short-Term Mortality in 95 U.S. Urban Communities, 1987-2000. Journal of the American Medical Association 292: 2372-2378.
Chandler, T.J. 1965. The Climate of London. London UK. Hutchinson and Co. LTD. 292 pp.
Clark, J.R., Matheny, N.P., Cross, G., and V. Wake. 1997. A Model of Urban Forest Sustainability. Journal of Arboriculture 23(1):17-30.
Council of Tree and Landscape Appraisers. 1992. Guide for Plant Appraisal. 8th ed. Savoy, IL: ISA. 103 p.
Center for Urban Forest Research Pacific Southwest Research Station. Accessed 27 December 2016. http://www.fs.fed.us/psw/programs/cufr/
Cullen, S. 2002. Tree Appraisal: Can Depreciation Factors Be Rated Greater than 100%? Journal of Arboriculture 28(3):153-158.
Davey Resource Group. 2009. Sample Urban Statewide Inventory SUSI Project: An analysis of Indiana’s urban forests. 23 pp.
US Environmental Protection Agency. 2013. Heat Island Effect. Accessed 27 December 2016. www.epa.gov/heatisland/about/index.htm
Heisler, G.M. 1986. Energy Savings with Trees. Journal of Arboriculture 12(5):113–125.
Kaplan, R. and S. Kaplan. 1989. The Experience of Nature: A Psychological Perspective. Cambridge: Cambridge University Press. 360 pp.
Maco, S.E. and E. G. McPherson. 2003. A Practical Approach to Assessing Structure, Function, and Value of Street Tree Populations in Small Communities. Journal of Arboriculture 29(2):84-97.
McPherson, E.G, and R.A. Rowntree. 1989. Using Structural Measures to Compare Twenty-Two US Street Tree Populations. Landscape Journal 8:13-23.
McPherson, E.G. 1993. Evaluating the Cost-Effectiveness of Shade Trees for Demand-Side Management. Electricity Journal 6(9):57-65.
Montana Department of Natural Resources and Conservation. 2015. Emerald Ash Borer Readiness and Response Plan. 39 p. Accessed 27 December 2016. http://dnrc.mt.gov/divisions/forestry/docs/assistance/urban/final_eab-response-and-readiness-plan-for-the-dnrc.pdf
Richards, N.A. 1983. Diversity and Stability in a Street Tree Population. Urban Ecology. 7:159–171.
Santamour, F.S. 1990. Trees for Urban Planting: Diversity, Uniformity, and Common Sense. Proceedings of the 7th Conference of the Metropolitan Tree Improvement Alliance. 7:57–65.
Simpson, J.R. 1998. Urban Forest Impacts on Regional Space Conditioning Energy Use: Sacramento County Case Study. Journal of Arboriculture 24(4):201–214.

January 2017 Appendix C: References 52
Thompson, A. 2007. Wildfires Release as Much CO2 as Cars. LiveScience. Accessed 27 December 2016. http://www.livescience.com/1981-wildfires-release-cars.html
Ulrich, R.S. 1986. Human Responses to Vegetation and Landscapes. Landscape and Urban Planning, 13, 29-44.
U.S. Climate Data. Helena, Montana Temperature, Precipitation, Sunshine, Snowfall. Accessed 27 December 2016. http://www.usclimatedata.com/climate/helena/montana/united-states/usmt0163
U.S. Energy Information Administration (EIA). Greenhouse gases Effect on the Climate. Accessed 28 December 2017. http://www.eia.gov/energyexplained/index.cfm?page=environment_how ghg_affect_climate
U.S. Department of Agriculture (USDA). USDA Plant Hardiness Zone Map. Accessed 27 December, 2016. http://planthardiness.ars.usda.gov/PHZMWeb/.
USDA Forest Service Research and Development. Urban FIA: Bringing the Nation’s Forest Census to Urban Areas. Accessed 28 December 2017. https://www.fs.fed.us/research/urban-webinars/urban-fia/
Washington Department of Natural Resources Urban and Community Forestry Program. 2015. Community Tree Inventory Project Report. Plan-it GEO. 35 p.
Watson, G. 2002. Comparing Formula Methods of Tree Appraisal. Journal of Arboriculture 28(1): 11-18.
Western Regional Climate Center. Climate of Montana. Accessed 27 December 2016. http://www.wrcc.dri.edu/narratives/MONTANA.htm
Wolf, K.L. 1999. Nature and Commerce: Human Ecology in Business Districts. 56-59. In C. Kollin (ed.) Building Cities of Green: Proceedings of the 9th National Urban Forest Conference. Washington D.C.: American Forests.
Wolf, K.L. 2007. The Environmental Psychology of Trees. International Council of Shopping Centers Research Review. 14(3):39-43.

53 Appendix D: Species Index January 2017
Appendix D: Species Index Common Name Scientific Name
Balsam fir Abies balsamea
White fir Abies concolor
Fraser fir Abies fraseri
Grand fir Abies grandis
Subalpine fir Abies lasiocarpa
Fir spp. Abies species
Hedge maple Acer campestre
Amur maple Acer ginnala
Rocky Mountain maple Acer glabrum
Bigtooth maple Acer grandidentatum
Paperbark maple Acer griseum
Boxelder Acer negundo
Black maple Acer nigrum
Japanese maple Acer palmatum
Norway maple Acer platanoides
Norway maple 'Schwedler' Acer platanoides 'Schwedleri'
Sycamore maple Acer pseudoplatanus
Red maple Acer rubrum
Silver maple Acer saccharinum
Sugar maple Acer saccharum
Maple spp. Acer species
Tatarian maple Acer tataricum
Freeman maple Acer x freemanii
Ohio buckeye Aesculus glabra
Common horsechestnut Aesculus hippocastanum
Red horsechestnut Aesculus x carnea
Alder spp. Alnus species
Serviceberry spp. Amelanchier species
Yellow birch Betula alleghaniensis
River birch Betula nigra
Paper birch Betula papyrifera
White birch Betula pendula
Gray birch Betula populifolia
Birch spp. Betula species
Broadleaf Deciduous Large Broadleaf Deciduous Large
Broadleaf Deciduous Medium Broadleaf Deciduous Medium
Broadleaf Deciduous Small Broadleaf Deciduous Small
Broadleaf Evergreen Large Broadleaf Evergreen Large
Broadleaf Evergreen Medium Broadleaf Evergreen Medium
Broadleaf Evergreen Small Broadleaf Evergreen Small

January 2017 Appendix D: Species Index 54
Common Name Scientific Name
European hornbeam Carpinus betulus
American hornbeam Carpinus caroliniana
Shagbark hickory Carya ovata
Hickory spp. Carya species
Catalpa spp. Catalpa species
Northern catalpa Catalpa speciosa
Common hackberry Celtis occidentalis
Eastern redbud Cercis canadensis
Conifer Evergreen Large Conifer Evergreen Large
Conifer Evergreen Medium Conifer Evergreen Medium
Conifer Evergreen Small Conifer Evergreen Small
Dogwood spp. Cornus species
Turkish filbert Corylus colurna
Smoketree Cotinus coggygria
Washington hawthorn Crataegus phaenopyrum
Hawthorn spp. Crataegus species
Russian olive Elaeagnus angustifolia
Beech spp. Fagus species
European beech Fagus sylvatica
White ash Fraxinus americana
European ash Fraxinus excelsior
Manchurian ash Fraxinus mandshurica
Black ash Fraxinus nigra
Green ash Fraxinus pennsylvanica
Fraxinus spp. Fraxinus species
Ginkgo Ginkgo biloba
Honey locust Gleditsia triacanthos
Kentucky coffeetree Gymnocladus dioicus
American holly Ilex opaca
Butternut walnut Juglans cinerea
Black walnut Juglans nigra
Chinese juniper Juniperus chinensis
Common juniper Juniperus communis
Cherrystone juniper Juniperus monosperma
Rocky Mountain juniper Juniperus scopulorum
Juniper species Juniperus species
Eastern redcedar Juniperus virginiana
European larch Larix decidua
Western larch Larix occidentalis
Larch spp. Larix species
Sweetgum Liquidambar styraciflua
Tulip tree Liriodendron tulipifera
Honeysuckle spp. Lonicera species

55 Appendix D: Species Index January 2017
Common Name Scientific Name
Amur maackia Maackia amurensis
Southern magnolia Magnolia grandiflora
Common apple Malus pumila
Crabapple spp. Malus species
Dawn redwood Metasequoia glyptostroboides
Red mulberry Morus rubra
American hophornbeam Ostrya virginiana
Amur corktree Phellodendron amurense
Norway spruce Picea abies
Engelmann spruce Picea engelmannii
White spruce Picea glauca
Black spruce Picea mariana
Colorado blue spruce Picea pungens
Red spruce Picea rubens
Sitka Spruce Picea sitchensis
Spruce spp. Picea species
Bristlecone pine Pinus aristata
Jack pine Pinus banksiana
Swiss stone pine Pinus cembra
Lodgepole pine Pinus contorta
Bolander pine Pinus contorta 'bolanderi'
Pinyon pine Pinus edulis
Limber pine Pinus flexilis
Western white pine Pinus monticola
Mugo pine Pinus mugo
Austrian pine Pinus nigra
Ponderosa pine Pinus ponderosa
Pitch pine Pinus rigida
Pine spp. Pinus species
Southwestern white pine Pinus strobiformis
Eastern white pine Pinus strobus
Scotch pine Pinus sylvestris
London planetree Platanus hybrida
White poplar Populus alba
Narrowleaf cottonwood Populus angustifolia
Balsam poplar Populus balsamifera
Black cottonwood Populus balsamifera ssp. trichocarpa
Eastern cottonwood Populus deltoides
Fremont cottonwood Populus fremontii
Bigtooth aspen Populus grandidentata
Lombardy poplar Populus nigra
Lombardy poplar Populus nigra 'italica'
Sargent poplar Populus sargentii

January 2017 Appendix D: Species Index 56
Common Name Scientific Name
Populus spp. Populus species
Quaking aspen Populus tremuloides
Lanceleaf cottonwood Populus x acuminata
Carolina poplar Populus x canadensis
Apricot spp. Prunus armeniaca
Cherry plum Prunus cerasifera
Amur chokecherry Prunus maackii
European bird cherry Prunus padus
Pin cherry Prunus pensylvanica
Black cherry Prunus serotina
Cherry spp. Prunus species
Common chokecherry Prunus virginiana
Shubert chokecherry Prunus virginiana 'Shubert'
Douglas-fir Pseudotsuga menziesii
Pear spp. Pyrus species
White oak Quercus alba
Swamp white oak Quercus bicolor
Scarlet oak Quercus coccinea
Northern pin oak Quercus ellipsoidalis
Bur oak Quercus macrocarpa
Chinkapin oak Quercus muehlenbergii
Water oak Quercus nigra
Pin oak Quercus palustris
English oak Quercus robur
Red oak Quercus rubra
Oak spp. Quercus species
Black oak Quercus velutina
Common buckthorn Rhamnus cathartica
Smooth sumac Rhus glabra
Sumac spp. Rhus species
Staghorn sumac Rhus typhina
Black locust Robinia pseudoacacia
White willow Salix alba
Pussy willow Salix discolor
Crack willow Salix fragilis
Black willow Salix nigra
Willow spp. Salix species
Weeping willow Salix x sepulcralis Simonkai
American mountain-ash Sorbus americana
European mountain-ash Sorbus aucuparia
Mountain-ash Sorbus species
Japanese tree lilac Syringa reticulata
Lilac spp. Syringa species

57 Appendix D: Species Index January 2017
Common Name Scientific Name
American arborvitae Thuja occidentalis
Western redcedar Thuja plicata
Cedar spp. Thuja species
American linden Tilia americana
Little-leaf linden Tilia cordata
Linden spp. Tilia species
American elm Ulmus americana
Chinese elm Ulmus parvifolia
Siberian elm Ulmus pumila
Elm spp. Ulmus species
Viburnum spp. Viburnum species
Chinese wisteria Wisteria sinensis

January 2017 Appendix E: Emerald Ash Borer 58
Appendix E: Emerald Ash Borer The emerald ash borer (EAB) is an invasive beetle that has killed hundreds of millions of trees in eastern North America. The beetle was discovered near Detroit, Michigan in 2002. It was most likely imported into the U.S. from Asia, where it is native, via solid wood packing material. As of 2016, EAB has been detected in twenty-eight states and two Canadian provinces, but has not been detected in Montana. Since ash trees occur in nearly all of Montana towns, consideration of this major pest threat requires attention.
EAB larvae feed on the inner bark of all species of ash trees (Fraxinus spp.) and inhibit trees’ ability to transport water and nutrients. Adults can generally fly two miles in search of a suitable host (Taylor et al., 2006), but the primary means of dispersing great distances has been by human transport of nursery stock, wood packing material, and firewood. All infested trees die if not properly treated with insecticides. Montana is a popular hunting and recreation destination which corresponds with high volumes of out-of-state firewood being brought in. It is estimated that there are approximately 235,000 opportunities a year for the importation of EAB-infested ash firewood into Montana (Foley, 2012). Preventing the introduction of EAB requires close monitoring of the potential host material
that enters Montana. To date, there are no regulations in effect that restrict firewood movement into Montana. In states where
EAB occurs, the United States Department of Agriculture and state regulatory agencies have enforced quarantines and fines to prevent potentially infested ash trees, logs, or firewood from moving out of infested areas.
EAB has imposed a tremendous financial burden on municipalities, property owners, nursery operators and forest products industries. If/when EAB is detected in Montana, its consequences could be severe. Overall, ash comprises approximately 29% of all public trees planted in Montana communities. Five separate species have been reported by the Montana Department of Natural Resources and Conservation (DNRC) urban tree inventory—green ash (Fraxinus pennsylvanica), which is native to eastern Montana, European ash (Fraxinus excelsior), Manchurian ash (Fraxinus mandshurica), white ash (Fraxinus americana), and black ash (Fraxinus nigra). EAB has the potential to drastically change our communities by killing ash trees that beautify our downtowns and neighborhoods, provide shade, regulate stormwater runnoff, improve air quality, and reduce energy costs.
Ash is the most commonly planted tree in several Montana communities east of the Continental Divide. The DNRC urban tree inventory calculated that ash represents more than 50% of all publicly-owned trees in 12 communities: Havre, Roundup, Laurel, Columbus, Stanford, Conrad, Fort Benton, Dillon, Harlowton, Hardin, Lewistown, and the state capital, Helena (Table 17). These communities have the most to lose when emerald ash borer arrives. Figure 29 maps the
Green Ash is the Most Abundant Urban Forest Tree in Montana
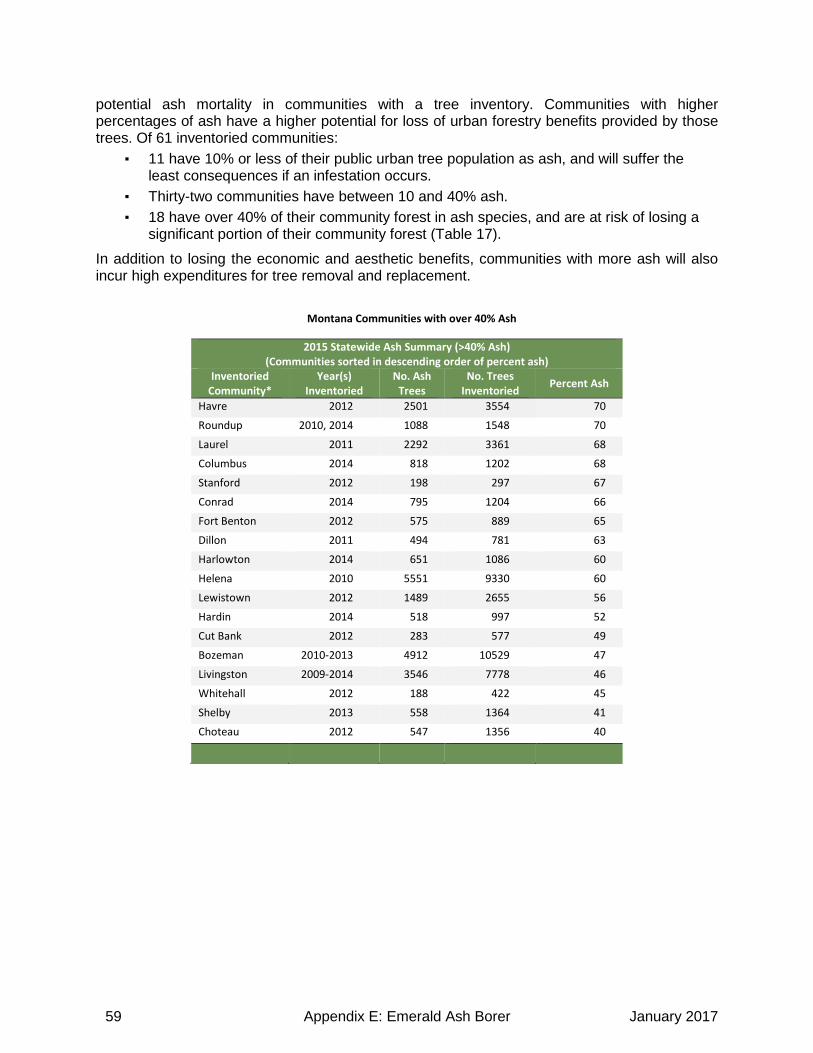
59 Appendix E: Emerald Ash Borer January 2017
potential ash mortality in communities with a tree inventory. Communities with higher percentages of ash have a higher potential for loss of urban forestry benefits provided by those trees. Of 61 inventoried communities:
▪ 11 have 10% or less of their public urban tree population as ash, and will suffer the least consequences if an infestation occurs.
▪ Thirty-two communities have between 10 and 40% ash. ▪ 18 have over 40% of their community forest in ash species, and are at risk of losing a
significant portion of their community forest (Table 17).
In addition to losing the economic and aesthetic benefits, communities with more ash will also incur high expenditures for tree removal and replacement.
Montana Communities with over 40% Ash
2015 Statewide Ash Summary (>40% Ash) (Communities sorted in descending order of percent ash)
Inventoried Community*
Year(s) Inventoried
No. Ash Trees
No. Trees Inventoried Percent Ash
Havre 2012 2501 3554 70
Roundup 2010, 2014 1088 1548 70
Laurel 2011 2292 3361 68
Columbus 2014 818 1202 68
Stanford 2012 198 297 67
Conrad 2014 795 1204 66
Fort Benton 2012 575 889 65
Dillon 2011 494 781 63
Harlowton 2014 651 1086 60
Helena 2010 5551 9330 60
Lewistown 2012 1489 2655 56
Hardin 2014 518 997 52
Cut Bank 2012 283 577 49
Bozeman 2010-2013 4912 10529 47
Livingston 2009-2014 3546 7778 46
Whitehall 2012 188 422 45
Shelby 2013 558 1364 41
Choteau 2012 547 1356 40

January 2017 Appendix E: Emerald Ash Borer 60
Percent Ash and Potential Urban Tree Mortality from EAB in Montana Inventoried Community Forests
DNRC is preparing for a detection of emerald ash borer and evaluating appropriate management options. The Emerald Ash Borer Readiness and Response Plan (Gannon, et al., 2015) outlines Montana DNRC’s approach to EAB prevention, detection, eradication, communication and community forest restoration. DNRC will work in conjunction with federal, state, tribal, university, community, and private partners to establish collaborative efforts for effective responses as an infestation emerges. Specific tactics will change over time as policies are developed and science advances. Thus, this document will be periodically revisited and updated. Any response will incorporate multi-agency involvement.

61 Appendix E: Emerald Ash Borer January 2017
References
Foley, I. 2012. A qualitative risk assessment of the introduction of the emerald ash borer (Coleoptera: Buprestidae, Agrilus planipennis Fairmaire) into Montana. Montana Department of Agriculture Report.
Gannon, A., Kirby, J. and Dooley, E. 2015. Emerald Ash Borer Readiness and Response Plan. Montana Department of Natural Resources and Conservation Forestry Assistance Bureau, Forest Pest Management Program Report.
Taylor, R.A., T.M. Poland, L.S. Bauer, K.N. Windell, and J.L. Kautz. 2006. Emerald ash borer flight estimates revised. Pages 10-12 in: Mastro, V., D. Lance, R. Reardon, and G. Parra, coms. Proceedings of the Emerald Ash Borer and Asian Longhorned Beetle Research and Development Review Meeting; 29 October- 2 November 2006; Cincinnati, OH. FHTET-2007-04. USDA Forest Health Technology Expertise Team; Morgantown, WV.
Recommended