The sole responsibil ity for the content of this report l ies with the authors. It does not necessari ly reflect the opinion of the European Union. Neither EASME nor the European Commission are responsible for any use that may be made of the information contained therein
URBAN‐WASTE Urban strategies for Waste Management
in Tourist Cities D2.7 – Compendium of waste management practices in
pilot cities and best practices in touristic cities
Grant Agreement No: WASTE‐6b‐2015 690452 Project Acronym: URBAN‐WASTE
Project Title: Urban Strategies for Waste Management in Tourist Cities
Funding scheme : Horizon 2020: Eco‐Innovative Strategies: “Waste: a resource to recycle, reuse and recover raw materials”
Project Coordinator: Gobierno de Canarias (Government of Canary Islands)
Start date of the project : 01/06/2016 Duration of the project: 36 months
Contractual delivery date: 31/01/2017
Actual delivery date: 13/02/2017
Contributing WP: 2
Dissemination level: Public
Editors: Gruber Iris Obersteiner Gudrun
Contributing Authors: BJØRN OLSEN Trine, DE LUCA Claudia, ERIKSSON Mattias, GROßE Juliane, GRUBER Iris, KAZERONI Marie, KOVÁCS Erneszt, MAYERHOFER Johannes, OBERSTEINER Gudrun, RAMUSCH Roland, ROMEIN Arie, ZAPATA ARANDA Pilar
URBAN‐WASTE – 690452 – D2.7
Ref. Ares(2017)826224 - 15/02/2017
D2.7 – Compendium of waste management practices in pi lot cit ies and best practices in touristic cit ies
2
Abstract
This report (Deliverable D2.7) refers to URBANWASTE Work Package 2, Task 2.8. Under this Task the current
waste prevention and management practices in the URBANWASTE pilot cases are investigated and best
practices coming from the EU context (focussing on touristic processes) are identified. This document shall
support the selection of innovative strategies to be carried out within Work Package WP 4.
A comparative policy review of national waste management strategies and targets in the European Union
(EU) showed that there is no separate field of policies and instruments for waste generated by tourism
neither on European level nor on the national level of EU member states.
The identified waste prevention and management strategies already existing in the URBANWASTE pilot cities
as well as international best practice examples can be allocated to well‐known policy instruments mainly
based on information and awareness building as well as provision of infrastructure (e.g. bins for separate
collection of food waste). But also regulatory instruments (e.g. ban of plastic bags), economic instruments
and voluntary agreements (e.g. use of returnable containers) could be identified.
Both, existing waste management and prevention practices in pilot cities as well as international best
practices focus on nutrition of tourists. Most measures deal with food waste prevention as well as food
waste management. The low‐waste organisation of events and the promotion of re‐use activities were also
identified to be promising topics to reduce tourist waste generation. The promotion of resource
consciousness in procurement amongst tourist accommodation establishments as well as food and beverage
providers for tourists is another positive example identified.
Most identified international best practice examples connected to tourist waste management refer to eco
labelling and connected guidelines. The hotel industry can considerably reduce their waste generation by
implementing and following a waste management system. One interesting knowledge gained from
international best practice examples is the recommendation to elaborate an extended inventory of waste
types and sources as first step for waste prevention measures.

D2.7 – Compendium of waste management practices in pi lot cit ies and best practices in touristic cit ies
3
Contributors
NAME COMPANY CONTRIBUTIONS INCLUDE
Iris GRUBER
Johannes MAYERHOFER
Gudrun OBERSTEINER
Roland RAMUSCH
Universität für Bodenkultur Wien (BOKU) Chapters 1, 2, 4, 4.9, 4.11, 5
Arie ROMEIN Technische Universiteit Delft (Delft
University of Technology) Chapters 3 and 4.5
Mattias ERIKSSON Sveriges Lantbruksuniversitet – Swedish
University of Agricultural Sciences Chapter 4.7
Juliane GROßE University of Copenhagen Chapter 4.9
Gisela MC. NASCIMENTO Fundo Regional para a Ciência e
Tecnologia‐ FRCT Chapter 4.8
Trine BJØRN OLSEN Aarhus University ‐ AU Herning Chapter 4.1
Claudia DE LUCA CE ‐ CONSULTA EUROPA PROJECTS AND
INNOVATION SL Chapter 4.3
Pilar ZAPATA ARANDA Bioazul Contributing to chapters 4.9 and 4.11
Marie KAZERONI ORDIF ‐ Paris Region Waste Observatory Chapters 4.4, 4.6 and 4.10
Erneszt KOVÁCS
ACR+ ‐ ASSOCIATION DES CITES ET DES
REGIONS POUR LE RECYCLAGE ET LA
GESTION DURABLE DES RESSOURCES
Chapter 4.2

D2.7 – Compendium of waste management practices in pi lot cit ies and best practices in touristic cit ies
4
List of abbreviations
WMP Waste Management Plan
MSW Municipal solid waste
GPP Green Public Procurement

D2.7 – Compendium of waste management practices in pi lot cit ies and best practices in touristic cit ies
5
Table of Contents Summary ....................................................................................................................................... 10
Glossary ........................................................................................................................................ 14
1. Introduction .......................................................................................................................... 15
2. Approach .............................................................................................................................. 16
3. Comparative Policy Review of National Waste Management Strategies and Targets in the
European Union (EU) ..................................................................................................................... 17
3.1 Introduction: Why drawing attention to EU waste policies? ............................................... 17
3.2 EU waste policy framework ................................................................................................. 18
3.2.1 Changed approach to waste and waste policy ................................................................ 18 3.2.2 Strategies, policies, key policy documents and targets ................................................... 19 3.2.3 Significance of EU waste policy for national legislation on solid tourism‐related waste 21
3.3 Country summaries of municipal waste policies .................................................................. 21
3.3.1 Introduction ..................................................................................................................... 21 3.3.2 Waste and waste management policies .......................................................................... 22
3.3.2.1 Group I ................................................................................................................................. 24 3.3.2.2 Group II ................................................................................................................................ 24 3.3.2.3 Reference Group .................................................................................................................. 25
3.3.3 Performance of waste management strategies .............................................................. 26 3.3.3.1 Generation of municipal waste ........................................................................................... 26 3.3.3.2 Landfilling ............................................................................................................................ 28 3.3.3.3 Recycling .............................................................................................................................. 30
3.4 Conclusion ............................................................................................................................ 32
4. Current Waste Prevention and Management Practices in Pilot Cities .................................... 34
4.1 Copenhagen (DK) ................................................................................................................. 35
4.1.1 Brief description of the URBANWASTE pilot case area ................................................... 35 4.1.2 Description of Waste Prevention Actions ........................................................................ 37 4.1.3 Description of Municipal Solid Waste Collection ............................................................ 39 4.1.4 Collection of Waste from Tourist Establishments ........................................................... 45 4.1.5 Description of waste from touristic ships ........................................................................ 45
4.2 Dubrovnik (HR) ..................................................................................................................... 46
4.2.1 Brief description of the URBANWASTE pilot case area ................................................... 46 4.2.2 Description of Waste Prevention Actions ........................................................................ 46 4.2.3 Description of Municipal Solid Waste Collection ............................................................ 46 4.2.4 Collection of Waste from Tourist Establishments ........................................................... 49 4.2.5 Description of waste from touristic ships ........................................................................ 49
4.3 Florence (IT) ......................................................................................................................... 50
4.3.1 Brief description of the URBANWASTE pilot case area ................................................... 50 4.3.2 Description of Waste Prevention Actions ........................................................................ 50 4.3.3 Description of Municipal Solid Waste Collection ............................................................ 52 4.3.4 Collection of Waste from Tourist Establishments ........................................................... 55

D2.7 – Compendium of waste management practices in pi lot cit ies and best practices in touristic cit ies
6
4.3.1 Description of waste from touristic ships ........................................................................ 55 4.4 Kavala (GR)........................................................................................................................... 56
4.4.1 Brief description of the URBANWASTE pilot case area ................................................... 56 4.4.2 Description of Waste Prevention Actions ........................................................................ 56 4.4.3 Description of Municipal Solid Waste Collection ............................................................ 56 4.4.4 Collection of Waste from Tourist Establishments ........................................................... 59 4.4.5 Description of waste from touristic ships ........................................................................ 59
4.5 Lisbon (PT) ............................................................................................................................ 60
4.5.1 Brief description of the URBANWASTE pilot case area ................................................... 60 4.5.2 Description of Waste Prevention Actions ........................................................................ 61 4.5.3 Description of Municipal Solid Waste Collection ............................................................ 62 4.5.4 Collection of Waste from Tourist Establishments ........................................................... 66 4.5.5 Description of waste from touristic ships ........................................................................ 67
4.6 Nice (FR) ............................................................................................................................... 68
4.6.1 Brief description of the URBANWASTE pilot case Métropole Nice Côte d’Azur ............. 68 4.6.2 Description of Waste Prevention Actions ........................................................................ 68 4.6.3 Description of Municipal Solid Waste (MSW) Collection ................................................ 72 4.6.4 Collection of Waste from Tourist Establishments ........................................................... 74 4.6.5 Description of waste from touristic ships ........................................................................ 74
4.7 Nicosia (CY) .......................................................................................................................... 75
4.7.1 Brief description of the URBANWASTE pilot case area ................................................... 75 4.7.2 Description of Waste Prevention Actions ........................................................................ 75 4.7.3 Description of Municipal Solid Waste Collection ............................................................ 77 4.7.4 Collection of Waste from Tourist Establishments ........................................................... 79 4.7.5 Description of waste from touristic ships ........................................................................ 79
4.8 Ponta Delgada (PT) .............................................................................................................. 80
4.8.1 Brief description of the URBANWASTE pilot case area ................................................... 80 4.8.2 Description of Waste Prevention Actions ........................................................................ 80 4.8.3 Description of Municipal Solid Waste Collection ............................................................ 83 4.8.4 Collection of Waste from Tourist Establishments ........................................................... 85 4.8.5 Description of waste from touristic ships ........................................................................ 85
4.9 Santander (ES) ...................................................................................................................... 86
4.9.1 Brief description of the URBANWASTE pilot case area ................................................... 86 4.9.2 Description of Waste Prevention Actions ........................................................................ 86 4.9.3 Description of Municipal Solid Waste Collection ............................................................ 87 4.9.4 Collection of Waste from Tourist Establishments ........................................................... 90 4.9.5 Description of waste from touristic ships ........................................................................ 90
4.10 Syracuse (IT) ......................................................................................................................... 91
4.10.1 Brief description of the URBANWASTE pilot case area ............................................... 91 4.10.2 Description of Waste Prevention Actions ................................................................... 91 4.10.3 Description of Municipal Solid Waste Collection ........................................................ 92 4.10.4 Collection of Waste from Tourist Establishments ....................................................... 94 4.10.5 Description of waste from touristic ships ................................................................... 95
4.11 Tenerife (ES) (Municipalities of Adeje, Arona and Puerto de la Cruz) .................................. 96
4.11.1 Brief description of the URBANWASTE pilot case area ............................................... 96 4.11.2 Description of Waste Prevention Actions ................................................................... 97
D2.7 – Compendium of waste management practices in pi lot cit ies and best practices in touristic cit ies
7
4.11.3 Description of Municipal Solid Waste Collection. ....................................................... 97 4.11.4 Collection of waste from tourist establishments ...................................................... 100 4.11.5 Description of waste from touristic ships ................................................................. 100
4.12 Waste prevention and management strategies in the URBANWASTE pilot cases ............ 101
4.12.1 Waste prevention strategies ..................................................................................... 101 4.12.1.1 Changing waste behaviour of citizens ............................................................................... 101 4.12.1.2 Composting activities at the point of waste generation .................................................... 102 4.12.1.3 Eco‐events ......................................................................................................................... 103 4.12.1.4 Promotion of re‐use activities ........................................................................................... 103 4.12.1.5 Promotion of tap water for drinking ................................................................................. 105 4.12.1.6 Reduction of food waste .................................................................................................... 105 4.12.1.7 Reduction of paper waste from advertisements ............................................................... 106 4.12.1.8 Resource consciousness in procurement .......................................................................... 107 4.12.1.9 Taxes on one‐way packaging ............................................................................................. 107
4.12.2 Waste management strategies ................................................................................. 108 4.12.2.1 Awareness‐raising to change waste separation behaviour (of citizens) ............................ 108 4.12.2.2 Better control of certain waste streams ............................................................................ 109 4.12.2.3 Biogas from organic waste ................................................................................................ 109 4.12.2.4 Deposit‐refund schemes for reusable packaging .............................................................. 110 4.12.2.5 Improve access to information about waste management system .................................. 110 4.12.2.6 Improving waste treatment and recycling ......................................................................... 111 4.12.2.7 Increase waste separation in the business community ..................................................... 111 4.12.2.8 Provision of better waste separation options for citizens ................................................. 112 4.12.2.9 Reduce emissions and noise of waste collection (service) ................................................ 113
4.12.3 Other initiatives with implications on waste generation and management ............ 113 4.12.4 Policy instruments for implementing waste prevention and management strategies 114
4.12.4.1 Information instruments ................................................................................................... 114 4.12.4.2 Regulatory instruments. .................................................................................................... 115 4.12.4.3 Economic instruments ....................................................................................................... 116 4.12.4.4 Voluntary agreements ....................................................................................................... 118 4.12.4.5 Provision of infrastructure ................................................................................................. 119
5. Best Practices for Waste Management in Tourist Cities ....................................................... 121
5.1 Best practices for waste management suitable for URBANWASTE ................................... 121
5.1.1 Eco‐tourism certification scheme and labelling ............................................................ 121 5.1.2 Best practice of local and accommondation activities .................................................. 123 5.1.3 Best practice of municipal or regional waste management .......................................... 126
5.2 Best practices for waste prevention suitable for URBANWASTE ....................................... 127
6. Concluding Remarks ............................................................................................................ 133
7. References .......................................................................................................................... 134
D2.7 – Compendium of waste management practices in pi lot cit ies and best practices in touristic cit ies
8
List of Figures Figure 1: Trends in municipal waste treatment in the EU, 1998‐2008 (EC, 2010)................... 20 Figure 2: Urban waste collection, storage and treatment in Florence .................................... 53 Figure 3: Waste cycle in Florence ............................................................................................. 54 Figure 4: Urban unsorted waste treatment and disposal ........................................................ 54 Figure 5: The waste treatment scheme of VALORSUL (VALORSUL) ........................................ 66 Figure 6: Location of the pilot case Ponta Delgada.................................................................. 80 Figure 7: Composition of residual waste (Ponta Delgada, 2008) ............................................. 84 Figure 8: Location of Santander (Santander City Council. December 2015. Plan de Acción Turistica Santander 2015‐2020) ............................................................................................... 86 Figure 9: Mobile clean points in Santander (Santander City Council, 2017) ........................... 89

D2.7 – Compendium of waste management practices in pi lot cit ies and best practices in touristic cit ies
9
List of Tables Table 1: Municipal solid waste management and selected policy instruments in 14 European countries (2001‐2015) (EEA, 2016) .......................................................................................... 23 Table 2: Generation of municipal waste per capita ................................................................. 27 Table 3: Ranking by waste generation per capita in 2014 ....................................................... 28 Table 4: Landfilling of biodegradable waste ............................................................................ 29 Table 5: Recycling rates by type of waste in percentages, 2001 and 2014 ............................. 31 Table 6: Waste prevention activities in Copenhagen .............................................................. 37 Table 7: Collection system for different waste fractions in Copenhagen ................................ 39 Table 8: Composition of residual waste in Copenhagen (2015) .............................................. 40 Table 9: Waste management activities in Copenhagen ........................................................... 42 Table 10: Waste prevention activities in Florence ................................................................... 52 Table 11: Waste prevention activities in Kavala ...................................................................... 56 Table 12: Average composition of the MWS in Kavala in 2008 ............................................... 58 Table 13: Lisbon: Waste collection system by fraction (Lisbon Municipality) ......................... 63 Table 14: Features of the door‐to‐door, bring collection points and civic amenity site separation systems (EC – Capital factsheet on separate collection) ....................................... 64 Table 15: Lisbon: Separate collection rate for major fractions in Lisbon in 2013 (EC – Capital factsheet on separate collection) ............................................................................................. 65 Table 16: Waste prevention activities in the Metropole Nice Côte d’Azur ............................. 69 Table 17: Waste prevention activities in Nicosia. .................................................................... 77 Table 18: Illustration of the composition of waste produced in Cyprus (Department of Environment evidences 2010) .................................................................................................. 78 Table 19: Waste prevention activities in Ponta Delgada taken on in 2016 (or previous), based on PEGRA ‐ Azores Strategic Plan on Waste Management (previous version) ....................... 81 Table 20: Further waste prevention activities in Ponta Delgada ............................................. 82 Table 21: Waste prevention activities in Santander. ............................................................... 87 Table 22: Waste prevention activities in Syracuse .................................................................. 91 Table 23: Waste prevention activities in the pilot case areas of Tenerife ............................... 97 Table 24: Examples of environmental certification schemes for accommodation ............... 122 Table 25: Best practice measures to separate and recycle waste for accommodations (Styles et al., 2013) ............................................................................................................................. 124 Table 26: Best practice to prevent, select and take actions to avoid waste in accommodation (International Tourism Partnership, 2008; The Travel Foundation, 2016) ............................ 127 Table 27: Quick win opportunities for hotels......................................................................... 128 Table 28: Food waste prevention measures allocated to different departments ................. 129 Table 29: UNITED AGAINST WASTE‐ practical solutions for food waste prevention in gastronomy ............................................................................................................................ 130
D2.7 – Compendium of waste management practices in pi lot cit ies and best practices in touristic cit ies
10
Summary
This report (Deliverable D2.7) refers to URBANWASTE Work Package 2, Task 2.8. Under this Task, project
partners investigated the current waste prevention and management practices in the URBANWASTE pilot cases
as well as identified best practices in these cities as well as from the broader European and international context.
The information about best practices will be used during WP 4 (strategy development) to select those best
practices (strategies) which are most suitable for adaptation and replication in tourist cities. It will be made
available for associated partners and potential stakeholders as well.
A Comparative Policy Review of National Waste Management Strategies and Targets in the European Union
(EU) was performed to serve as background for future waste management and prevention activities in pilot cities.
There is no separate field of policies and instruments for waste generated by tourism neither on EU level nor on
the national level of EU member states. On the everyday level of implementation, specific practices to manage
tourist waste, if existing at all, are usually designed and implemented at city or even local level and are linked to
features of the local societal and geographical context. The comparative review of national waste policies and
performances of the countries of the URBANWASTE pilot cases, which is presented in Chapter 3, is therefore
based on national data about policies and performances regarding the management of the undivided stream of
municipal waste. Nevertheless, European waste policy is the overarching framework for waste management in
Europe. It is used as baseline to assess member states’ national strategies, policies and targets in a comparative
way.
Current Waste Prevention and Management Practices in the URBANWASTE Pilot Cities were investigated to
figure out transferable best practice activities to other regions that are suitable to solve problems resulting from
tourist activities. Additionally, international best practice activities in waste prevention and management were
screened according to their relevance for the URBANWASTE goals.
Besides describing briefly some general characteristics of the pilot case areas, the description focusses on waste
prevention activities that currently exist in the pilot cases as well on the municipal solid waste management.
Attention was further paid on the organisation of waste collection from tourist establishments and touristic
ships.
Waste prevention and management strategies can be designed and implemented by using one or a combination
of various policy instruments and measures. During analysing the waste prevention activities that currently exist
in the URBAN WASTE pilot cases in order to identify the strategies behind, several examples for the following
categories of instruments were found:
Information instruments
Regulatory instruments
Economic instruments
Voluntary agreements
Provision of infrastructure
Through analysing the waste prevention activities and waste management systems in the eleven URBAN WASTE
pilot cases, the following waste prevention strategies have been identified:

D2.7 – Compendium of waste management practices in pi lot cit ies and best practices in touristic cit ies
11
Changing waste behaviour of citizens
Focusing on the waste behaviour of tourists, awareness campaigns can inform about what they can do to prevent
waste (e.g. use public drinking water fountains to refill empty plastic bottles, use reusable bags). Awareness
campaigns aimed at changing waste behaviour of tourists need to be implemented at municipality level, but the
distribution of information can be carried out mainly via tourist accommodation establishments or other tourist
information points.
Composting activities at the point of waste generation
On‐site composting could be implemented at hotel level and for other establishments providing food and
beverage to tourists to catch the organic waste produced by tourists. Information campaigns on composting as
well as the provision of technical composters could be targeted mainly to bigger accommodation establishments
where the compost later can be used on the hotel garden as fertiliser.
Eco‐events
The “green” organisation of events may affect the total amount of waste produced by tourists. Waste of bigger
events like sport or music events attracting thousands of tourists can be highly influenced by green events, but
also small events, even meetings, can be oriented according the green event concept. Bigger Green Events could
be implemented at municipal level, while conferences or seminars can be organised as green event on hotel
level.
Promotion of re‐use activities
Activities aiming at re‐using, which potentially could be implemented in URBAN WASTE, could include: Swap
facilities for products the majority of tourists might only need temporarily such as travel guidebooks, city maps,
bathing and beach gear such as air mattresses, snorkelling gear, etc. but also the use of reusable dishes in tourist
establishments instead of one way dishes and the donation of reusable equipment like furniture, TV, minibar or
computers from hotels to people in need or social organisations could be allocated to this category. Depending
on the specific activity, the implementation level would be either the municipality or the hotel area.
Promotion of tap water for drinking
Through the installation of public drinking water fountains (and accompanying information measures) tourists
could be encouraged to refill their empty plastic drinking bottles, thus, reducing PET‐bottles waste. Responsibility
of implementation level lays at the municipality,
Reduction of food waste
Reducing food waste resulting from tourist activities is useful as food and beverage provision to tourists was
identified to be one of the main hotspots for waste generation by touristic processes. The provision of doggy bag
systems as well as the reduction of food waste in the kitchen can be emphasised. Measures aiming at reducing
food waste from tourism are likely to be implemented at restaurants, hotels etc. The organisation of information
and guidelines for the food service sector at municipality level assists the implementation of food waste
prevention.
Resource consciousness in procurement
Within the scope of URBANWASTE it seems possible to promote resource consciousness in procurement
amongst tourist accommodation establishments as well as food and beverage providers for tourists. Partially this
could be reached by promoting environmental certification labels/schemes.

D2.7 – Compendium of waste management practices in pi lot cit ies and best practices in touristic cit ies
12
In the URBAN WASTE pilot cases the following waste management strategies have been identified to be suitable
strategies to solve problems resulting from tourist activities. Waste management activities will mainly to be
implemented at municipality level.
Awareness‐raising to change waste separation behaviour (of citizens)
Information on correct waste separation could be adapted to create an easily understandable "waste guide" for
tourists.
Level of implementation: "Waste guides" for tourists etc. could be part of the information package tourists
receive in their accommodation establishment.
Biogas from organic waste
The separate collection of organic waste/food waste from establishments providing food and drink to tourists
(restaurants, hotels, …) to use it for biogas production could be an option to deal with organic/food waste from
tourism.
Increase waste separation in the business community
Especially information about multifunctional waste solutions could be a support for hotels that are not concerned
with waste management issues so far. Information campaigns could be targeted for example to all tourist
establishments in a given area. Legal regulations regarding waste management or incentive schemes could have
the same target group/area.
Provision of better waste separation options for citizens
Having many public bins for different waste fractions available and visible might be an incentive also for tourists
to do proper waste separation. Such measures would have to be implemented on municipality level, but the idea
of designing an "attractive" and "easy to understand" waste collection system could also be adopted for hotels
as well. Especially separate collection of food waste can be implemented easily at least at the hotel and
restaurant level
Additional to conventional waste management and prevention issues Eco‐labels and similar
environmental certifications
have been identified to be useful to solve the problem resulting from tourist waste generation. Eco‐labels provide
minimum standards for sustainability in hotel establishments including indicators for waste management
performance like reusable dinnerware and cutlery, refillable toiletry dispensers or on‐site composting or
composting
Also international best practice examples focus on Eco‐tourism certification scheme and labelling. A summary
of several sustainability standards and eco‐tourism labels of European countries is given in the report focussing
on included waste management requirements like facilitating waste separation by guests, separate collection of
waste, avoiding of disposable products and single‐dose food packaging.
The hotel industry can considerably reduce their waste generation by implementing and following a waste
management system that is designed by the concepts of reduce, reuse and recycle (Greenhotelier, 2004). Styles
et al. (2013) identified that “a relevant starting point for waste prevention, sorting and recycling is to record on‐
site waste generation by category and source”. In addition, it may be useful to consider local reuse and recycling

D2.7 – Compendium of waste management practices in pi lot cit ies and best practices in touristic cit ies
13
options, or rather seek opportunities for product reuse before waste is sent for recycling. Concrete examples of
best practices for waste management in the hotels are given in this section.
A universally transferable best practice model of municipal or regional waste management could not be
identified, because each area is dependent of its own characteristic limitations. Two specific best practice
examples can be highlighted: The European project SCOW “Selective collection of organic waste for recycling in
tourist areas”, aims to develop low cost, technically simple and high quality bio‐waste collection and recycling
models in territories with touristic areas and agricultural activity in Mediterranean zones. Another opportunity,
to selectively grade incurring wastes, is the separation of useful organic fractions such as cooking oils, fats and
grease before organic waste is send to anaerobic digestion or composting.
According to the International Tourism Partnership (2008) and the Travel Foundation (2016) the first step for
waste prevention measures in accommodations and touristic destinations is to elaborate an inventory of waste
types and sources. This should help to locate avoidance potentials of waste generation in different departments.
An overview of items to prevent, items to select and actions to avoid waste in accommodation is given.
The Waste Mapping Guidance for Hotels in Cyprus developed by the Cyprus Tourism Organisation, Cyprus
Sustainable Tourism Initiatives and The Travel Foundation (2013) addresses hotel operators and other
organisations working in the Cypriot tourism industry to highlight the financial and environmental benefits of
undertaking waste mapping as part of their on‐going business operations.
United Against Waste (UAW) was launched in 2014 in Austria in form of a cross‐border cooperation platform.
Companies from the food service market as well as the federal government, the provinces, science and NGOs
are pursuing an ambitious goal: reduction of avoidable food waste in kitchens by half by 2020.
The main objective of the Fair Hotel project is to reduce the production of waste packaging in the hotels and
enhance the hotel offer in an environment friendly way.
“Menu Dose Certa” or Right Serving Menu a pioneering project in the city of Espinho, part of greater Porto, aims
to support restaurants in creating menus that avoid food waste.
D2.7 – Compendium of waste management practices in pi lot cit ies and best practices in touristic cit ies
14
Glossary
Litter Litter means small pieces of rubbish (e.g. cans, paper, plastic bottles) that have been left lying on the
ground in public places. Source: Cambridge Dictionary
Metropolitan area A metropolitan area covers the core city / municipal area as well as the surroundings.
Municipal solid waste (MSW) All types of solid waste that are collected by municipalities or by order of them. They include waste
originating from households and similar establishments (e.g. commercial activities, office buildings,
institutions such as schools and government buildings and small businesses) that produce waste
similar (quantity and quality) to household waste and dispose of waste at the same facilities used for
municipally collected waste. They also include similar waste from rural areas, even if they are
disposed by the generator. The definition goes on to include: similar wastes generated by the same
sources that are collected or purchased for recycling, even if the material does not enter the same
waste stream (including separately collected fractions); white goods, bulky waste; street sweepings
and the content of litter containers, if managed as solid waste. Source: EEA Report
Similar establishments Similar establishments are non‐household waste producers producing waste similar (in quantity and
quality) to household waste (e.g. commercial activities, office buildings, institutions such as schools
and government buildings and small businesses).
Street sweeping waste Street sweeping waste refers to waste that accumulates from street sweeping when cleaning large
areas (sometimes including the contents of public waste bins).
Street‐sweepings consist mostly of materials such as grit, dust, salt, and de‐icing products, abraded
particles of the roadbed, interspersed with organic components of soil, roadside greenery, leaves,
etc., as well as harmful substances related to motor vehicles, such as abraded particles from tyres
and brake linings, heavy metals from exhaust fumes, and the residue from car leaks, as well as waste
from collection containers along the roadside and in parks and public squares. Source: Austrian
Federal Waste Management Plan 2006
Tourist establishments Tourist Establishments are hotels and similar accommodation (e.g. hostels, Bed&Breakfast),
restaurants, camping sites, marinas, public structures such as museums, other tourist establishments
Touristic ships: The term “Touristic ships” embraces all types of ships of different size that come from somewhere
else and bring tourists to the pilot case area (e.g. cruise ships). Small boats that only offer sightseeing
cruises on local rivers, channels or along local coast lines (e.g. “boat sightseeing” such as Gondola
rides in Venice) are not included.
D2.7 – Compendium of waste management practices in pi lot cit ies and best practices in touristic cit ies
15
1. Introduction
The impacts of tourism are manifold. On the one hand, tourism is one of the most important industries worldwide
and a driver for socio‐economic development in many regions. Around 10% of the world’s GDP are directly and
indirectly generated by and one out of eleven jobs is related to tourism. On the other hand, the total number of
1.1 billion tourists every year causes a range of negative externalities, including emissions from transport and
touristic activities, high levels of unsustainable resource consumption (renewable and non‐renewable, incl. water
resources) and waste production.
Solid waste generation is considered being one of the most relevant environmental aspects related to tourism
activities. In comparison with other cities, tourist cities have to face additional challenges related to waste
prevention and management due to their geographical and climatic conditions, the seasonality of tourism flows
and the specificity of tourism industry and of tourists as waste producers. One major objective of the
URBANWASTE project is to support policy makers in answering these challenges and in developing strategies
that aim at reducing the amount of municipal waste production and at further support the re‐use, recycle,
collection and disposal of waste in tourist cities.
The main aim of Work Package 2 is to provide background data and to assess waste related impacts of tourism
using a Life Cycle approach. To meet this objective, Work Package WP 2 is composed of three procedural steps.
The first procedural step is the development of a proper methodology (Task 2.2) and the adjustment and
definition of data requirements. A database including each pilot city will provide the information necessary for
linking touristic processes to resource consumption and waste generation, prevention, recycling, treatment and
disposal activities in order to analyse how tourism is responsible for positive and negative impacts considering
the three pillars of sustainability (environment, society and economy). In a second step, a baseline assessment
will be carried out (Task 2.6), applying MFA and LCA to assess the current situation in selected URBANWASTE
pilot cases. The third procedural step within WP 2 to meet the project’s objectives will be to gather information
on existing technologies for innovative waste management and best practices in waste prevention and
management strategies related to touristic activities (Task 2.8).
This report (Deliverable D2.7) refers to URBAN WASTE Work Package 2, Task 2.8. Under this Task, project
partners investigated the current waste prevention and management practices in the URBANWASTE pilot cases
based on a Policy Review of National Waste Management Strategies and Targets in the European Union. Best
practices within the pilot cities as well as examples coming from the European and the international context are
identified. The information about best practices will further be used during WP 4 (strategy development) to
select those best practices (strategies) which are most suitable for adaptation and replication in tourist cities.

D2.7 – Compendium of waste management practices in pi lot cit ies and best practices in touristic cit ies
16
2. Approach
The comparative review of national waste policies and performances of the countries of the URBANWASTE pilot
cases is based on national data about policies and performances regarding the management of the undivided
stream of municipal waste.
The description of the current waste prevention and management practices in the 11 URBANWASTE pilot cases
is mainly based on information provided by the URBANWASTE pilot case partners.
These descriptions follow the following structure:
Brief description of the URBANWASTE pilot case area
Description of waste prevention activities
Description of municipal solid waste collection
Collection of waste from tourist establishments
Description of waste from touristic ships (if relevant for the specific pilot case)
Additional information (mainly on existing waste prevention activities and environmental certifications for
hotels) was retrieved through an internet search.
The findings from this report shall be fed into Work Package WP 4. Within this Work Package, waste prevention
and management strategies that subsequently shall be implemented in the URBANWASTE pilot cases will be
developed. In order to provide the kind of input that is necessary for the tasks of WP 4, the waste prevention
and management practices currently existing in the pilot cases were analysed according to the:
Waste prevention and management strategies they belong to as well as the
Type of policy instruments these activities represent.
Further, it is briefly discussed if the identified strategies can be considered suitable for URBANWASTE in terms
of feasibility in tourism context either at hotel or on municipality level.
In order to find best practice examples for waste prevention and management in tourist cities a comprehensive
web‐based search was carried out. The following general criteria (adopted from Vittuari et al., 2015) were used
as orientation for identifying best practices:
targeted: practices that have a strong waste prevention focus, clearly distinct from other waste
management strategies or broad environmental goals;
effective: practices based on guidelines, protocols, standards, reports, or preferred practice patterns
that have been proven to lead to effective food waste prevention/reduction practices;
measurable: practices that have an evaluation plan in place to measure program outcomes, even if they
do not yet have evaluation data available to demonstrate the effectiveness of positive outcomes;
innovative: practices that use original or resourceful techniques for waste prevention;
replicable: practices that can be easily reproduced and are similarly relevant in regions across Europe;
visible: only measures that are reported either in scientific literature or at other reports or web‐pages
could be taken into account
D2.7 – Compendium of waste management practices in pi lot cit ies and best practices in touristic cit ies
17
3. Comparative Policy Review of National
Waste Management Strategies and
Targets in the European Union (EU)
Arie ROMEIN
3.1 Introduction: Why drawing attention to EU waste
policies?
Tourism contributes by far most to the particular stream of municipal waste. The specific part of this stream
amounts to around 10% in the whole of the EU. There is no separate field of policies and instruments for waste
generated by tourism neither on the EU nor the national level. Whereas policies, policy instrument and targets
to manage municipal waste at large fit within national legislation and policy making ‐ the more the country’s
government system is centralised. On the everyday level of implementation, specific practices to manage tourist
waste, if existing at all, are usually designed and implemented at city or even local level and are linked to features
of the local societal and geographical context. Furthermore, there was no rapidly to find data available in order
to explore the performance of cities on tourism‐generated waste only. Hence, the comparative review of national
waste policies and performances of the countries of the URBANWASTE pilot cases, which is presented in this
chapter, is based on national data about policies and performances regarding the management of the undivided
stream of municipal waste.
Regarding national policies, municipal waste policies including, it is mandatory for EU member states to
transpose EU waste legislation into national policy practices. Broadly speaking, the EU issues four types of
legislative documents with different legislative ‘power’. In a descending order, these are Regulations, Directives,
Decisions and Preparatory Acts (COM, JOIN, SEC and SWD documents). A Regulation becomes immediately
enforceable as law in all member states, supersedes national laws dealing with the same subject, and subsequent
national laws must be made in the light of it. At the other end, COM Documents have no direct impact on national
laws: they are proposals and other acts to be adopted in legislative procedures of the EU, such as
Communications, Recommendations, and White and Green Papers. The EU waste policy that is relevant for
member states’ legislation is mainly included in Directives: legislative acts that are not directly applicable to
national laws but need to be transposed into these. In order to implement Directives correctly, member states
usually have to adjust laws accordingly (Fusions, 2015: 14). So, EU waste policy is an overarching framework to
assess member states’ national strategies, policies and targets in a comparative way. Therefore, this framework
is briefly analysed first.

D2.7 – Compendium of waste management practices in pi lot cit ies and best practices in touristic cit ies
18
3.2 EU waste policy framework
3.2.1 Changed approach to waste and waste policy
Due to both steadily growing quantities of waste and occasional scandals with seriously polluting or hazardous
types of waste, increasing importance has been attached on a European level to environmental policy since the
days of the then EEC in the 1970s. In the past few decades, the EU waste policy apparatus has been gradually
expanded by launching new or revised policy documents and legislative acts to keep a grip on generation and
management of growing volumes and new types of waste. The first versions of the Waste Framework Directive
and the Hazardous Waste Directive that both date back to 1975 have been repetitively amended later on.
Concomitant to this expansion, the ‘concept’ of waste has altered from merely an unwanted burden ‐ “a problem,
a cost, a pollutant” (EC, 2005: 6) ‐ towards a valued resource that is worth to be exploited (EC, 2010; EEA, 2015).
Hence, the progress of solid waste management systems has been driven by concerns about environmental
protection (including GHG emissions by landfilling of food waste), public health and landscape deterioration
(Cailean & Teodosiu, 2016; Cecere & Corrocher, 2016) but also by sustainable use of resources, i.e. re‐use and
recycling of valued materials from waste.
In 2005, the EC commented that “the common set of general principles and control procedures necessary to
ensure a high level of protection of the environment and human health across the Community [EU] has now
been established” (EC, 2005: 10). Notwithstanding, the Commission has seen itself forced to further expand the
legal framework in the decade since then. First and foremost, progress achieved on a number of waste fronts is
persistently set off by the gradual increase in the generated volumes of waste. The total EU waste generation
that amounted to 2.5 billion tonnes in 2010 (http://ec.europa.eu/environment/waste/index.htm) grew further
to 2.6 billion tonnes in 2014 (http://ec.europa.eu/environment/green‐growth/waste‐prevention‐and‐
management/...). Furthermore, practices of prevention and treatment of waste in several member states were,
and still are far from environmentally optimal and need to be tackled by amended or new policies. Too much
waste, for instance, still goes to incineration or to the landfill instead of recycling or recovery facilities. “Currently,
only 36% is being recycled while the rest was either burned or landfilled, of which some 600 million tonnes could
be reused or recycled. For household waste alone, some 40% is reused or recycled, and in some countries more
than 80% still goes to the landfill” (http://ec.europa.eu /environment/waste/index.htm ). Many member states
do still prefer the seemingly cheapest options such as incineration or landfilling and disregard the actual
environmental and economic benefits of re‐use and recycling.
Use and transformation of resources build up capital stocks and are “the backbone of every economy”
(http://ec.europa/environment/archives/natres/index.htm). However, the current non‐sustainable use of
resources in various member states is both harmful to the ecological environment and economically dissipating.
Hence, the challenge faced today by EU waste policy is to achieve integration of environmental sustainability
with economic benefits. Key in this is the objective to tackle the continuing growth of waste streams by
‘decoupling’ them from growth of economic production. Next, the ambition is to take a further step by placing
the objective of decoupling into the framework of the pursuit of a circular economy with the aim to re‐use
resources and stimulate industrial symbiosis – turning one industry’s by‐products into another industry’s raw
material (http://ec.europa/environment/circular‐economy/index_en.htm) ‐ but also to create jobs. EU waste
policy has to be gradually embedded in a broadening framework of strategies and policies to address
environmental, economic and social challenges of the future, with the ultimate objective to transform the EU
into a competitive sustainable recycling economy.

D2.7 – Compendium of waste management practices in pi lot cit ies and best practices in touristic cit ies
19
3.2.2 Strategies, policies, key policy documents and targets
With the development of the post‐war mass‐consumption society, particularly in the western part of Europe, the
amounts of municipal waste have grown together with both population and economic growth. As the EEA (2016,
3‐4) states, “wealthier countries generate more municipal waste per person”. More recent trends that contribute
to the growth of the EU municipal waste mountain are the increasing share of one‐person households – a type
that tends to produce more waste per capita than family households ‐ and the design of consumer goods for
ever shorter lifespans (EC, 2010: 2). Between 1995 and 2003, both GDP and municipal waste grew by 19% in the
EU. For an important component of municipal waste, food waste, the EC predicts a “rise to about 126 million
tonnes a year by 2020 from a baseline of 89 million tonnes in 2006, unless action is taken to halt this trend”
(http://ec.europa/environment/archives/eussd/food/htm). No doubt that increasing volumes of tourism have
added to these trends: it is an economic sector that has proven to continue growing worldwide in spite of the
recent economic downturn (Croti & Mishrahi, 2015).
On the lowest level of enforceability into national laws, main examples of Communications that present general
principles of the EU waste policy with implications for municipal waste management are the Thematic Strategy
on Prevention and Recycling of Waste (2005), the Roadmap to a Resource Efficiency of Europe (2011) and the
Circular Economy Package (2015). The Thematic Strategy, for example, sets long‐term goals for the EU to become
a recycling society that seeks to avoid waste and use waste as a resource. It plays an important role in EU waste
policy development by identifying seven general key actions. Prevention of waste production is prioritized over
recycling, but for waste recycling policy itself this strategy developed minimum standards. Furthermore, it
introduced life‐cycle thinking into the waste management policy (EC, 2011).
To some extent, the Thematic Strategy has been a basis for the latest revision of the Waste Framework Directive
in 2008 and some waste‐specific Directives. The actual version of the Waste Framework Directive “is meant to
be the cornerstone of the current EU waste policy” (EC, 2010).
In order to comply with the objectives of this Directive and to move towards a European recycling society with a
high level of resource efficiency, Member States are legally obliged to adopt waste prevention programmes (by
December 2013) and to take the necessary measures regarding “the preparing for re‐use and the recycling of
waste materials such as at least paper, metal, plastic and glass from households and possibly from other origins
as far as these waste streams are similar to waste from households” (EEA, 2015; EC,2008: 13). To achieve these
objectives, the Waste Framework Directive makes it mandatory for member states to draw up Waste
Management Programmes and Plans in line with the Directive’s targets and cover their entire geographical
territory. Furthermore, unlike the Thematic Strategy, this Directive presents quantified targets for EU waste
policy. An important one is to achieve “a minimum of overall 50% recycling and preparing for re‐use by weight
by 2020”. In 2015, the EC proposed new targets for municipal waste of 60% by 2025 and 65% by 2030. The
Circular Economy Package (2015) proposes to further increase the recycling rate for packaging waste to 75% in
2030.
In addition to these general acts, the EU waste policy apparatus also includes a number of thematically specific
legislative documents, mostly Directives, that focus on either a specific type of waste stream or a stage in the
waste hierarchy. Quite a few of these documents were issued before 2008 but some have been revised on the
basis of the Waste Framework Directive. As to the number of Directives, EU waste management policies with
major implications for municipal waste are first and foremost laid down in waste stream specific directives. There
are now Directives on various types of toxic and hazardous materials (either gaseous, liquid or solid), on solid
D2.7 – Compendium of waste management practices in pi lot cit ies and best practices in touristic cit ies
20
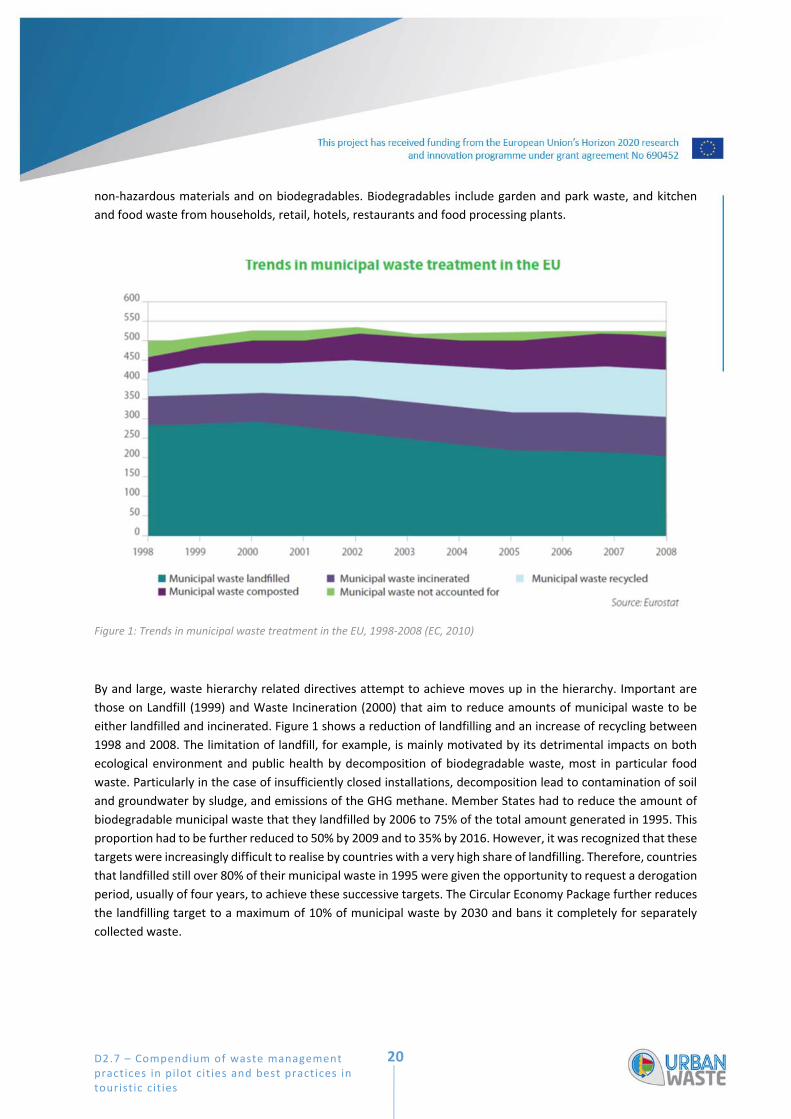
non‐hazardous materials and on biodegradables. Biodegradables include garden and park waste, and kitchen
and food waste from households, retail, hotels, restaurants and food processing plants.
Figure 1: Trends in municipal waste treatment in the EU, 1998‐2008 (EC, 2010)
By and large, waste hierarchy related directives attempt to achieve moves up in the hierarchy. Important are
those on Landfill (1999) and Waste Incineration (2000) that aim to reduce amounts of municipal waste to be
either landfilled and incinerated. Figure 1 shows a reduction of landfilling and an increase of recycling between
1998 and 2008. The limitation of landfill, for example, is mainly motivated by its detrimental impacts on both
ecological environment and public health by decomposition of biodegradable waste, most in particular food
waste. Particularly in the case of insufficiently closed installations, decomposition lead to contamination of soil
and groundwater by sludge, and emissions of the GHG methane. Member States had to reduce the amount of
biodegradable municipal waste that they landfilled by 2006 to 75% of the total amount generated in 1995. This
proportion had to be further reduced to 50% by 2009 and to 35% by 2016. However, it was recognized that these
targets were increasingly difficult to realise by countries with a very high share of landfilling. Therefore, countries
that landfilled still over 80% of their municipal waste in 1995 were given the opportunity to request a derogation
period, usually of four years, to achieve these successive targets. The Circular Economy Package further reduces
the landfilling target to a maximum of 10% of municipal waste by 2030 and bans it completely for separately
collected waste.
D2.7 – Compendium of waste management practices in pi lot cit ies and best practices in touristic cit ies
21
A broader perspective on the transposition of EU regulations into national waste policies in the Member States
includes the following principles:
Protection of ecological environment and human health by preventing or reducing the adverse impacts
of generation and management of waste.
Implementation of the waste hierarchy as management instruments with prevention and recycling as
highest priorities.
Improvement of resource use efficiency performance.
Integration of sustainable resource use and waste treatment policy by means of a life cycle that involves
all ‘operators’: producers, distributors, end‐users (consumers) and waste treatment agencies.
3.2.3 Significance of EU waste policy for national legislation on solid tourism‐related waste
There is no explicit legislative act in EU policies and strategies on waste exclusively produced by the tourist
industry. This industry’s waste streams pertain to some more general legislative acts, or specific articles in acts,
either on waste streams or on stages of the waste hierarchy, in particular related to landfill, incineration and
recycling. By far, most waste generated by the tourist industry ends up in municipal waste. This waste (amongst
others) covers: food waste; packaging waste of food, drinks, detergents and other cleaning materials; and solid
waste from hotel offices and reception desks, bars and restaurants like paper, plastic, glass and batteries. Also
waste from Waste of Electrical and Electronic Equipment from rooms like TV or hair dryers as well as bedlinens
and towels may be allocated to tourist activities. These specific types of waste are covered under EU Directives
on biodegradables, on packaging & packaging waste, on plastics and on batteries, on WEEE but separating these
materials at source or from the municipal solid waste stream is required for the directives to become effective.
Referring to the waste hierarchy, most types of municipal waste generated by the tourist industry may end up
at any level of the hierarchy. This may sound least likely for re‐use of food waste, but the comparative study of
EU Member States’ by Bio by Deloitte (2014), following a call by the European Economic and Social Committee,
makes clear that food that is considered waste due to regulations on durability, date marketing and hygiene
standards still can be donated to food banks and other charities for consumption.
3.3 Country summaries of municipal waste policies
3.3.1 Introduction
This section presents a comparative analysis of waste management in the countries of the URBANWASTE pilot
cases on their way from diverting municipal waste from being landfilled and moving towards more recycling. The
liability to transpose EU Directives into national laws is no guarantee that each country has done so both rapidly
and to a maximum degree. And if transposed, this does not imply that all targets are already met, or will be met
in their target year. To explore the questions if, how and to what extent these countries’ municipal waste
management has moved up the waste hierarchy, the comparison consists of two parts: national waste policies

D2.7 – Compendium of waste management practices in pi lot cit ies and best practices in touristic cit ies
22
and introduced policy instruments against the background of EU legislation, and quantitative trends in waste
generation, recycling and landfilling as indicators of waste management performance. The national policies and
policy instruments are presented first because they contribute to the explanation of the trends in quantitative
and qualitative performances of the countries. It has to be taken into account however, that other factors also
contribute to these trends, like level of wealth, environmental awareness of the population, and specific features
of how waste management legislation, policies and instruments are implemented (EEA, 2016). Inferred from this
comparative analysis, finally, the countries’ challenges in the near future to meet EU targets are indicated.
The comparison contains 14 countries: the eight countries of the URBANWASTE pilot cases and, as a reference
group, the six best performing countries of the 32 member countries of the European Environment Agency (EEA)
– the EU‐27 and 5 non‐member states. These six had already achieved in 2014 a recycling rate of municipal
waste above the Waste Framework Directive 2020 target of 50 percent. In contrast to the countries in the best
performance reference group, the recycling rate of municipal waste of all eight countries of URBANWASTE pilot
cases was lower than 50% in 2014. Nevertheless, these can be further divided into two groups: one with rates
less than 20% and one with rates between 30 and 50%. Hence, the fourteen countries presented in this
comparative analysis consist of three groups. Group I contains Croatia (16%), Cyprus (18%) and Greece (19%);
Group II Portugal (30%), Spain (33%), France (39%), Italy (42%) and Denmark (44%); and the Reference Group
Sweden (50%), the Netherlands (51%), Switzerland (54%), Belgium (55%), Austria (59%) and Germany (64%).
Both the description of national municipal waste policies and policy instruments and of trends in generation,
recycling and landfilling are based on the ‘Country Fact Sheets’ published by the EEA in October (EEA, 2016a‐n).
The Fact Sheets present highly identical, hence comparable information on policies and quantitative
performance data of each country, mainly for the period 2001 – 2014, making them well suited for a general
comparison of the 14 countries. The overviews of national waste management policies is far from exhaustive but
reflects some main policy instruments. Furthermore, explicit distinction between streams of waste paper, plastic,
glass and food – the major types generated by tourism – are not being made in these Fact Sheets. Nevertheless,
the two large flows that are distinguished in these documents ‐ material and organic waste ‐ include in most
countries respectively paper, plastic and glass waste, and food waste. To avoid a large number of repetitions,
references to these Fact Sheets as sources will not be made below.
3.3.2 Waste and waste management policies
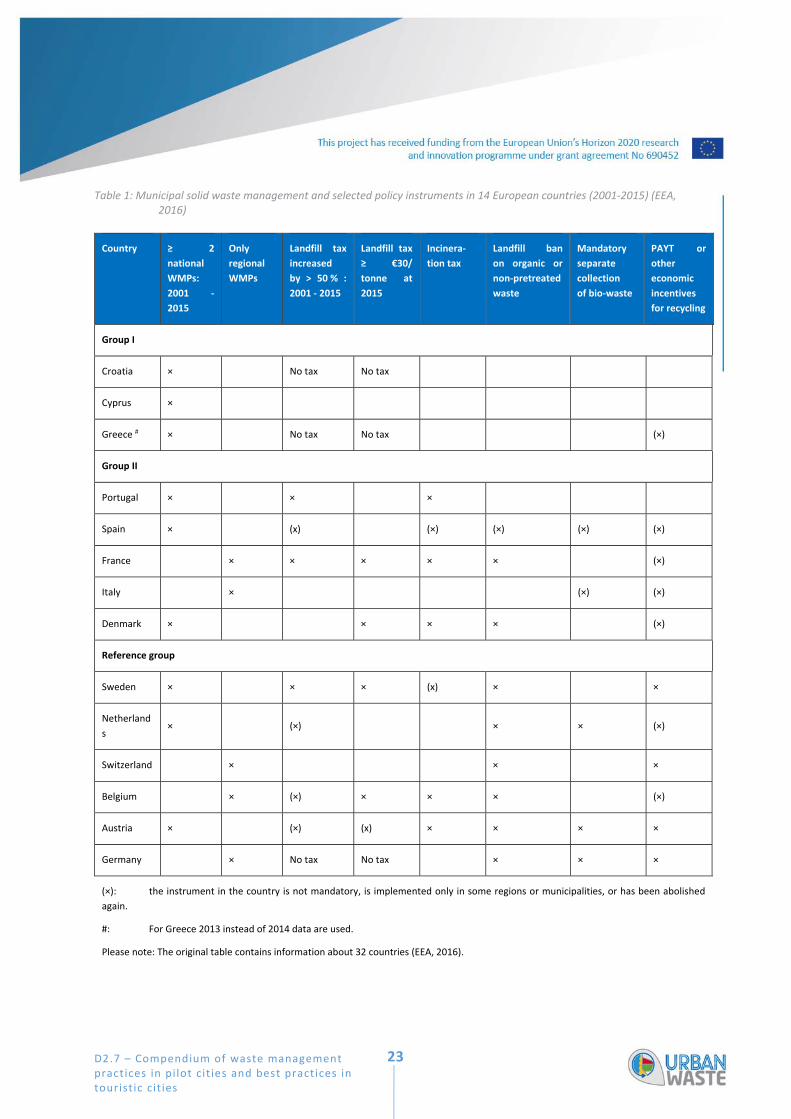
Table 1 presents an overview of municipal waste management policies across the 14 selected countries (EEA,
2016). The first and second column display data about the development of Waste Management Plans (WMPs)
since 2001 ‐ the legal framework for policy instruments as required by the EU Waste Framework Directive.
The next six columns refer to selected policy instruments: a selection that is far from exhaustive but does reflect
the primary policy aim to divert waste from landfilling and move upward in the waste hierarchy: banning and
taxation of landfilling, taxation of incineration, separate collection of bio‐waste and pay‐as‐you‐ throw (PAYT)
systems as instruments to stimulate recycling, respectively after collection and by households before ‘throwing’
and collection. The threshold of € 30/tonne of landfill tax is included as an indicator for effectiveness of the
instrument of landfill tax: EU countries that either ban landfilling of biodegradable or mixed municipal waste, or
implement a ban combined with a landfill tax of at least EUR 30/tonne have a landfill rate well below the EU‐28
average of 28% (EEA, 2016).
D2.7 – Compendium of waste management practices in pi lot cit ies and best practices in touristic cit ies
23
Table 1: Municipal solid waste management and selected policy instruments in 14 European countries (2001‐2015) (EEA, 2016)
Country
≥ 2
national
WMPs:
2001 ‐
2015
Only
regional
WMPs
Landfill tax
increased
by > 50 % :
2001 ‐ 2015
Landfill tax
≥ €30/
tonne at
2015
Incinera‐
tion tax
Landfill ban
on organic or
non‐pretreated
waste
Mandatory
separate
collection
of bio‐waste
PAYT or
other
economic
incentives
for recycling
Group I
Croatia × No tax No tax
Cyprus ×
Greece # × No tax No tax (×)
Group II
Portugal × × ×
Spain × (x) (×) (×) (×) (×)
France × × × × × (×)
Italy × (×) (×)
Denmark × × × × (×)
Reference group
Sweden × × × (x) × ×
Netherland
s × (×) × × (×)
Switzerland × × ×
Belgium × (×) × × × (×)
Austria × (×) (x) × × × ×
Germany × No tax No tax × × ×
(×): the instrument in the country is not mandatory, is implemented only in some regions or municipalities, or has been abolished
again.
#: For Greece 2013 instead of 2014 data are used.
Please note: The original table contains information about 32 countries (EEA, 2016).

D2.7 – Compendium of waste management practices in pi lot cit ies and best practices in touristic cit ies
24
The Table indicates for each instrument if it had been introduced or not. It clearly shows that the difference
between countries in the number of policy instruments introduced in 2014 is large. Nevertheless, this says little
about efficiency, because the same policy instruments can be designed and implemented in many different ways.
A similar conclusion is drawn by Weißenbacher and Seyring (2016) in their assessment of 45 WMPs in 18 different
EU member states: there are “major discrepancies in the proper implementation of the Waste Framework
Directive as regards the drafting of Waste Management Plans”. Three WMPs provide a thorough analysis and
achieve a good quality of waste management planning while eighteen fail to properly address mandatory
elements in the WFD in some way or another and are rated as ‘substandard’ (op. cit.: 58, 59). Overall, Plans differ
on elaborating in detail on specific instruments, indicating clearly whether policy instruments are already in
place, or on providing information about schedule and responsibilities for the implementation of instruments.
An exhaustive description of differences in design and implementation is far beyond the scope of this section but
a few qualitative details will be presented here, as a background for some understanding of the countries’
different performances in the next section.
3.3.2.1 Group I
Each country in Group I introduced its first WMP after 2001 and has revised that Plan once since the introduction.
Croatia is an EU member state only since 2013 but its first WMP dates back to 2007. It covered the period to
2015 and was succeeded by a revised version for 2016‐2022. In Cyprus and Greece, revision of the first WMP
was not a smooth process. Revision in Cyprus has been under consultation between 2012 and 2016, and in
Greece it was the intention to revise WMPs every 5 years but the second edition (2014‐2020) became effective
12 years after the first, in 2015.
Furthermore, in spite of these WMPs, the three countries in this Group hardly introduced any of the policy
instruments selected in Table 1. The only exceptions are (1) landfill taxes in Cyprus that are both very low ‐
between € 5 and € 10/tonne waste ‐ and introduced in two cities ‐ Nicosia and Limmasol – rather than country‐
wide, and (2) a non‐mandatory PAYT system in Greece. It is not surprising, then, that still many landfill sites are
in operation in Group I countries ‐ 109 in Greece in 2011 and 147 in Croatia in 2014. Due to the predominantly
private companies in waste business, diverting waste from these sites is problematic because they require
minimum amounts of waste to be commercially viable.
3.3.2.2 Group II
Unlike the Group I countries, the first WMP of Denmark, Portugal and Spain in Group II dates further back than
2001, to respectively 1993, 1997 and 2000. Denmark has revised its national WMP already three times, Portugal
twice and Spain once. But in spite of its intentions to comply with EU legislation and targets, approximately 60%
of municipal waste was still landfilled in Portugal during the first decade of this century and the country has not
yet succeeded to substantially reduce the number of open dumps. Instead of national WMPs, Italy has regional
Plans and France only municipal Plans. Italian regions hold responsibility for drawing up WMPs but
implementation is decentralised to provinces and municipalities. In fact, Spain is an intermediate case between
countries with national and with regional WMPs: its second Plan (2008‐2015) is national but based on Plans for
its 17 autonomous regions.
The number of the six selected policy instruments introduced in Group II varies between three in Portugal, four
in Italy, five in Denmark and France, and all six in Spain. For landfill, Spain, France and Denmark introduced a ban
at the end of the 1990s on respectively recyclable materials, untreated waste and combustible waste. Further,
all five countries in this Group levy a tax on landfill: Italy and France since the 1990s and Denmark even since
1987. The tax rate in these countries has increased by over 50% since the turn of the century, although not in all
D2.7 – Compendium of waste management practices in pi lot cit ies and best practices in touristic cit ies
25
Italian regions. Actually, that increase varied considerably between these regions. On the Iberian Peninsula,
landfill tax was introduced more recently – in Spain in 2004 and in Portugal in 2007. But this introduction in Spain
was limited to one autonomous region, Catalonia, followed only eight years later, in 2012, by Castilla y León. The
current Spanish third WMP (2016‐2020) proposes a country‐wide landfill tax for the first time. As to the level of
the tax rate, € 30 or more is levied only in Denmark (€ 63.30 in 1999 that increased again in 2010) and France
(€ 30 in 2014 and € 40 in 2015), but in France tax reductions are given on many types of waste. Portugal on the
other hand has one of the lowest in Europe: € 4.28, raised with 50% in case of recyclable waste.
To reduce waste incineration, an incineration tax is being levied in all Group II countries except Italy. But since
incineration is preferred over landfilling, its rate is considerably lower than the landfill tax. The Portuguese third
WMP (2014‐2020) sets it on 25% of the landfill tax. In France this proportion is a bit higher, about one‐third, but
it is lower in the other countries in this group. In Denmark, the proportion can no longer be determined since
the tax rate is calculated in energy content instead of weight.
Finally, the two instruments to stimulate recycling, mandatory separate collection of bio‐waste and a PAYT
system, also exist in most Group II countries. However, their application is either non‐ mandatory, takes place
only in some regions, or is still a pilot project. Separate collection of bio‐waste was introduced in Spain in 1998,
but only in Catalonia and in municipalities with more than 5 000 inhabitants in a few other regions, and in France
its coverage was limited to only 3% of the population living in a few municipalities. Since 2011 however, it is
mandatory in whole France for major producers, like catering businesses, to sort out food waste in order to make
it more properly recyclable. Nevertheless, it is not very likely that country‐wide impacts of these two instruments
on diverting waste towards recycling are large in Group II as a whole.
3.3.2.3 Reference Group
In the Reference Group, three countries – Sweden, Netherlands and Austria – have revised their WMPs at least
twice since 2001. But unlike Group I and II, these countries, and in particular the Netherlands and Sweden, have
been far ahead of the EU legislation: they initiated policies against the municipal waste problem already in
respectively the 1970s and 1980s. What is more, the Dutch waste management policies of the 1990s have served
as examples for more recent EU legislation. The other three reference countries have no national WMPs and
waste management policies are more decentralized. In Germany, the national 1996 Recycling Management of
Waste Act assigns responsibility for many stages of management, including planning and construction of
facilities, to local waste disposal authorities in order to achieve the Act’s targets. The major of these targets is
recovery of all municipal waste in Germany, including incineration residues, by 2020. Switzerland has an explicit
national legal framework for regional plans ‐ the 1990 Technical Ordnance on Waste that was revised completely
as Ordnance of Waste Prevention and Disposal in 2015 – but cantons have to draw up and to periodically review
their own management plans. Belgium, finally, is the only European country without any national legal
framework for waste management. The Brussels Capital Region, Flanders and Wallonia are fully autonomous in
this respect. Accordingly, their first regional WMPs date back to different years – 1986 in Flanders and 1991 in
Wallonia – and Flanders has undertaken further reaching endeavours in waste management policy.
There is no big difference in the number of selected policy instruments introduced in Group II and in this group
of reference countries. But in this latter group, exceptions to mandatory and country‐wide implementation of
the instruments are more rare than in Group II. In all reference countries, landfilling has been banned
comprehensively for rather precisely defined waste streams, mostly in the categories of combustible, bio‐
degradable and reactive waste. The Netherlands have set up a rather detailed list of 35 different waste categories
to banned from 1995 onwards. Landfill taxes have been charged in all reference countries except Germany, with
different rates for different waste streams. Again, the Netherlands is a special case: the charged rates for
D2.7 – Compendium of waste management practices in pi lot cit ies and best practices in touristic cit ies
26
respectively combustible waste and non‐combustible waste ‘with no other favourable recovery option’ were
both extreme in 2010 ‐ the highest rate in Europe, € 107.50, versus the very low € 13. And two years later, the
Netherlands completely abolished this form of taxation. There was indeed no more the pressing need for that
tax: streams of waste towards landfill had become nihil due to strict bans, high taxes for most types of waste,
and an extensive infrastructure of facilities higher up in the hierarchy. It is for similar reasons that landfill tax
rates have been increased only modestly – definitely less than 50% ‐ in Switzerland since the introduction in 2001
and in the Belgian regions of Flanders and BCR, and that landfill tax on reactive waste was abolished in 2009 after
the modernisation of landfills. Similar reasons were also behind the repeal of incineration tax only four years
after introduction in 2010 in Sweden, and why it has never been introduced at all in the Netherlands, Switzerland
and Germany. It is obvious that waste management policy plans and instruments contribute to countries’ waste
disposal performance, but these examples show that the reverse relation may also occur.
Separate collection of bio‐waste is not mandatory in several references countries and regions, for instance
Switzerland and Sweden. Nevertheless, bio‐waste collection covers about three‐quarters of the Swiss population
and Sweden has formulated precise targets for sorting and biologically treating food waste by households and
producers like restaurants and hotels: 35% since 2003 and 50% since 2012. Finally, a PAYT system has been
introduced in all countries but not always nation‐wide: in the Netherlands in 40% of the municipalities, and in
Belgium not in the Brussels Capital Region.
3.3.3 Performance of waste management strategies
This section describes the waste management performance of the 14 countries. Before presenting the
quantitative data on performance, it is commented that we should view these with some scepticism regarding
their validity, reliability and comparability. EU member states could choose between four different ‘methods’ to
measure waste management indicators: most but not all countries choose the same one. Country‐wise, further,
each Fact Sheets presents some uncertainties in the reporting due to the country’s (changes in) methodology of
data collection and features like level of decentralisation. Belgium is the most extreme of the 14 countries: since
no data is collected on national level, the Fact Sheet presents results of ex‐post analysis of reported data by the
three Belgians autonomous policy makers. The EEA (2013: 6) comments that “steps are needed to harmonise
national reporting methodologies, especially on the waste fractions to be included when reporting on municipal
waste”.
3.3.3.1 Generation of municipal waste
Before turning to waste management performance, an overview of the generation of municipal waste by country
is presented. Not surprisingly, the total amounts vary with the size of their population and, in a few cases, also
with the net total annual number of tourist days1. In 2014, 29.6 and 33.7 million tonnes were generated in the
large countries Italy and France, against only 1.6 and 5.6 in Croatia and Greece (EEA, 2013). The impact of tourism
is most notable in Cyprus; a country with a relatively small population and large net inflow of tourists.
1 ∑ # of days that all tourist together stay in a country in a given year

D2.7 – Compendium of waste management practices in pi lot cit ies and best practices in touristic cit ies
27
Table 2: Generation of municipal waste per capita (EEA, 2016)
Generated municipal waste per capita (kg)
2001 2014
Group I
Croatia 304 (2004) # 387
Cyprus 650 617
Greece 414 505 (2013) ##
Group II
Portugal 450 453
Spain 650 435
France 525 512
Italy 516 488
Denmark 606 760
Reference group
Sweden 440 438
Netherlands 595 527
Switzerland 661 730
Belgium 470 435
Austria 575 566
Germany 632 618
EU 510 (2004) 474
#: first year available
##: last year available
The comparison of the countries’ municipal waste production per capita (Table 2) shows a variation in 2014
between 387 kg in Croatia and almost twice that amount, 730 kg, in Switzerland. The picture of the trend
between 2001 and 2014 is similar for all countries except Germany: an increase, in most cases rather gradual, up
to a peak value in the second half of the decade, mostly in 2007, 2008 or 2009, that was followed by a decrease
towards 2014. Germany followed the opposite trend: a decrease until 2006 (564 kg) followed by an increase in
the years after 2006. The most frequently mentioned explanation for the reversal trend in the majority of the
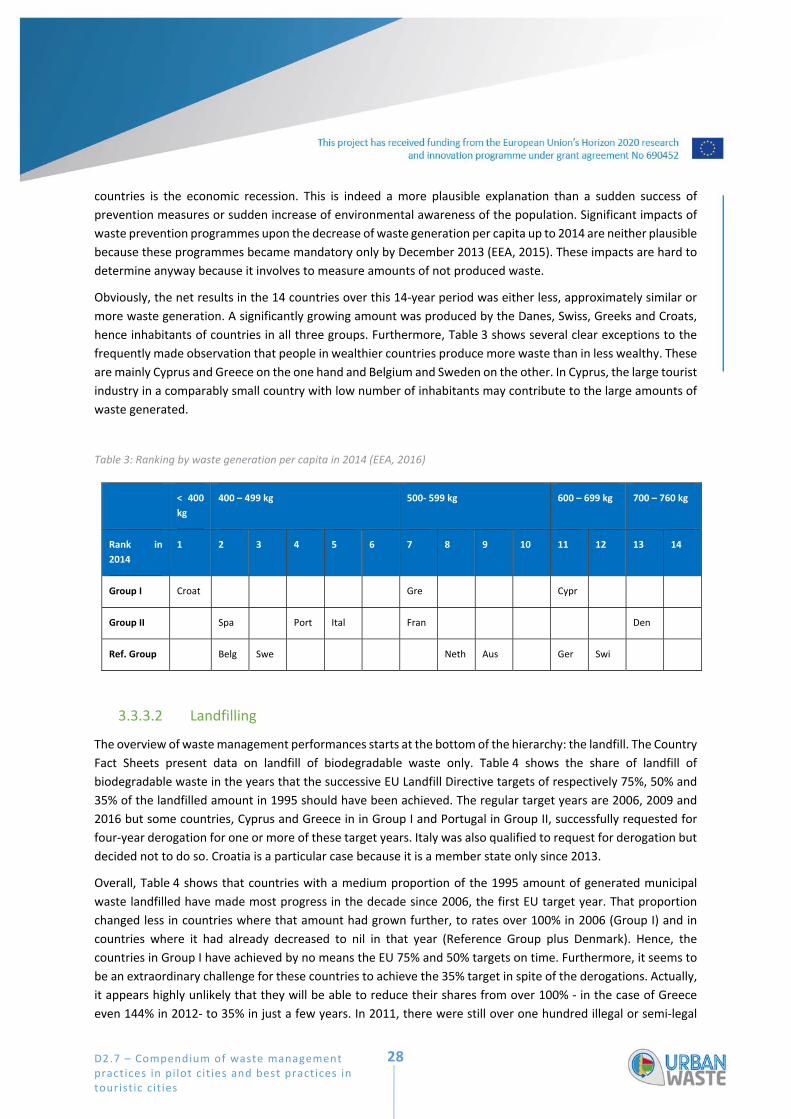
D2.7 – Compendium of waste management practices in pi lot cit ies and best practices in touristic cit ies
28
countries is the economic recession. This is indeed a more plausible explanation than a sudden success of
prevention measures or sudden increase of environmental awareness of the population. Significant impacts of
waste prevention programmes upon the decrease of waste generation per capita up to 2014 are neither plausible
because these programmes became mandatory only by December 2013 (EEA, 2015). These impacts are hard to
determine anyway because it involves to measure amounts of not produced waste.
Obviously, the net results in the 14 countries over this 14‐year period was either less, approximately similar or
more waste generation. A significantly growing amount was produced by the Danes, Swiss, Greeks and Croats,
hence inhabitants of countries in all three groups. Furthermore, Table 3 shows several clear exceptions to the
frequently made observation that people in wealthier countries produce more waste than in less wealthy. These
are mainly Cyprus and Greece on the one hand and Belgium and Sweden on the other. In Cyprus, the large tourist
industry in a comparably small country with low number of inhabitants may contribute to the large amounts of
waste generated.
Table 3: Ranking by waste generation per capita in 2014 (EEA, 2016)
< 400
kg
400 – 499 kg 500‐ 599 kg 600 – 699 kg 700 – 760 kg
Rank in
2014
1 2 3 4 5 6 7 8 9 10 11 12 13 14
Group I Croat Gre Cypr
Group II Spa Port Ital Fran Den
Ref. Group Belg Swe Neth Aus Ger Swi
3.3.3.2 Landfilling
The overview of waste management performances starts at the bottom of the hierarchy: the landfill. The Country
Fact Sheets present data on landfill of biodegradable waste only. Table 4 shows the share of landfill of
biodegradable waste in the years that the successive EU Landfill Directive targets of respectively 75%, 50% and
35% of the landfilled amount in 1995 should have been achieved. The regular target years are 2006, 2009 and
2016 but some countries, Cyprus and Greece in in Group I and Portugal in Group II, successfully requested for
four‐year derogation for one or more of these target years. Italy was also qualified to request for derogation but
decided not to do so. Croatia is a particular case because it is a member state only since 2013.
Overall, Table 4 shows that countries with a medium proportion of the 1995 amount of generated municipal
waste landfilled have made most progress in the decade since 2006, the first EU target year. That proportion
changed less in countries where that amount had grown further, to rates over 100% in 2006 (Group I) and in
countries where it had already decreased to nil in that year (Reference Group plus Denmark). Hence, the
countries in Group I have achieved by no means the EU 75% and 50% targets on time. Furthermore, it seems to
be an extraordinary challenge for these countries to achieve the 35% target in spite of the derogations. Actually,
it appears highly unlikely that they will be able to reduce their shares from over 100% ‐ in the case of Greece
even 144% in 2012‐ to 35% in just a few years. In 2011, there were still over one hundred illegal or semi‐legal
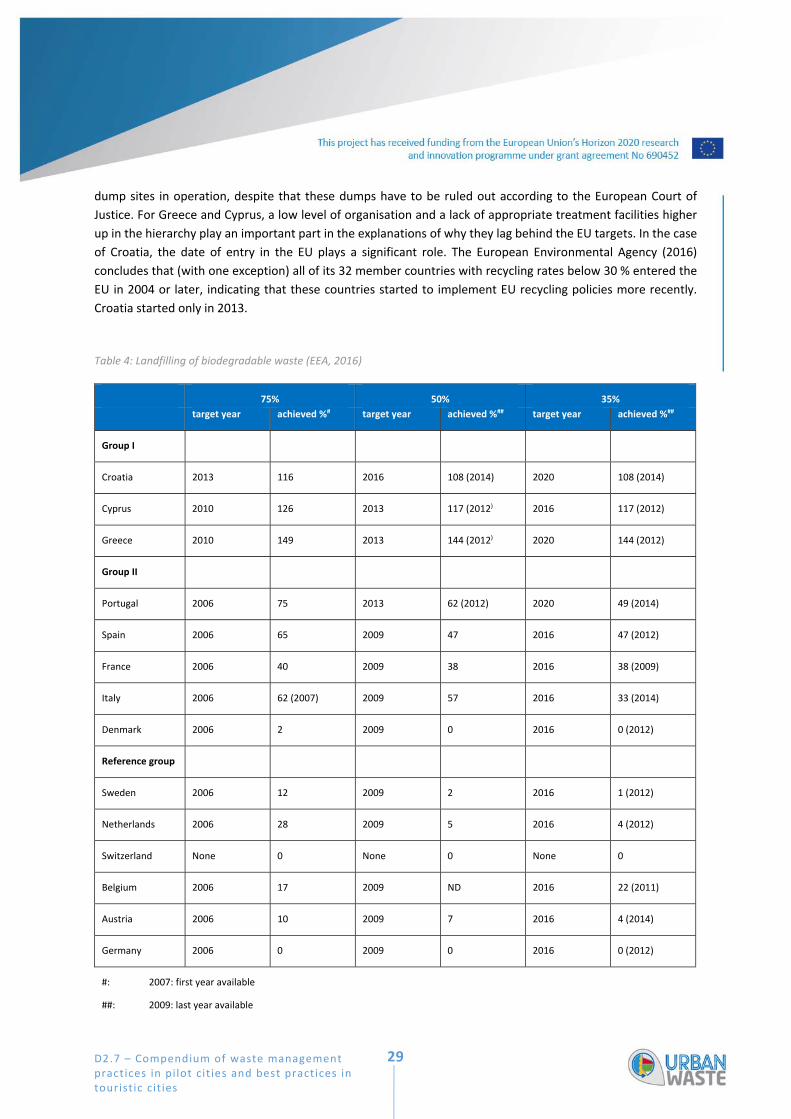
D2.7 – Compendium of waste management practices in pi lot cit ies and best practices in touristic cit ies
29
dump sites in operation, despite that these dumps have to be ruled out according to the European Court of
Justice. For Greece and Cyprus, a low level of organisation and a lack of appropriate treatment facilities higher
up in the hierarchy play an important part in the explanations of why they lag behind the EU targets. In the case
of Croatia, the date of entry in the EU plays a significant role. The European Environmental Agency (2016)
concludes that (with one exception) all of its 32 member countries with recycling rates below 30 % entered the
EU in 2004 or later, indicating that these countries started to implement EU recycling policies more recently.
Croatia started only in 2013.
Table 4: Landfilling of biodegradable waste (EEA, 2016)
75% 50% 35%
target year achieved %# target year achieved %## target year achieved %##
Group I
Croatia 2013 116 2016 108 (2014) 2020 108 (2014)
Cyprus 2010 126 2013 117 (2012) 2016 117 (2012)
Greece 2010 149 2013 144 (2012) 2020 144 (2012)
Group II
Portugal 2006 75 2013 62 (2012) 2020 49 (2014)
Spain 2006 65 2009 47 2016 47 (2012)
France 2006 40 2009 38 2016 38 (2009)
Italy 2006 62 (2007) 2009 57 2016 33 (2014)
Denmark 2006 2 2009 0 2016 0 (2012)
Reference group
Sweden 2006 12 2009 2 2016 1 (2012)
Netherlands 2006 28 2009 5 2016 4 (2012)
Switzerland None 0 None 0 None 0
Belgium 2006 17 2009 ND 2016 22 (2011)
Austria 2006 10 2009 7 2016 4 (2014)
Germany 2006 0 2009 0 2016 0 (2012)
#: 2007: first year available
##: 2009: last year available

D2.7 – Compendium of waste management practices in pi lot cit ies and best practices in touristic cit ies
30
In Group II, Portugal was on schedule and the other four countries ahead of schedule to achieve the 75% target
in 2006. France was ahead to such an extent that reducing the share of landfilled municipal waste target to
achieve the new targets of 2009 and 2016 was reasonably achievable. The same may hold for Italy, but for both
Portugal and Spain these targets seem unachievable. Portugal has invested a lot in other facilities, like
incineration, composting and MBT plants for the treatment of municipal waste, but more efforts are needed.
Denmark, on the other hand, does no longer landfill its municipal waste for quite some time: it is an exceptional
case among the countries of our URBANWASTE pilot cases and performing even better that some reference
countries. Denmark introduced many initiatives to move up towards the highest level of the waste hierarchy
already before the turn of the century ‐ obviously successful ‐ and in 2013 it adopted the prevention strategy
“Denmark Without Waste” that has been implemented by means of many projects.
All reference countries have been ahead of the schedule of the EU landfill targets in the past decade. Out of
these countries, relatively most municipal waste is still landfilled in Belgium. Overall, the Country Fact Sheet
raises the impression that Flanders is, on average, higher up in the waste hierarchy than the other two regions.
In 2006, relatively more municipal waste was landfilled in the Netherlands than in all other reference countries,
including Belgium, but that country made a significant catch‐up effort that resulted in the very low proportion of
4% in 2014; the same as Austria. The other three reference countries ‐ Sweden, Germany and Switzerland ‐
arrived at amounts of landfilling of municipal waste that were negligible or nil in 2014. Actually, Germany and
Switzerland already did so in 2006, the first target year of the Landfill Directive. Sweden landfilled more in 2006
but waste specific bans on landfilling of combustible and organic waste as well as the steep rise of landfill taxes
have been very effective in the last decade. There are hardly any operating sites left in Sweden after those that
did not comply these strict regulations were closed. EU targets do not apply to Switzerland, but no municipal
waste has been landfilled in the country since 2004.
3.3.3.3 Recycling
Table 5 shows the percentages of the total amounts of generated municipal waste that was recycled in 2001 and
2014. The division into three groups of countries corroborates the idea that the economically more developed
and more wealthy ones effectuate higher rates of recycling: higher rates not just require more comprehensive
policies and a more adequate set of policy instruments but also availability of more money to finance expensive
waste treating facilities.
Overall, recycling rates have increased in EU countries since the turn of the century with the expansion of the
legal framework on waste management by the Commission. In the 14 countries included here, the increase was
largest, roughly speaking, in the countries with medium values (Group II), and smallest in the reference countries
that had already a high rate at that beginning.
To achieve the EU target of 50% of total generated waste being recycled in 2020, Italy, France and Denmark in
Group II show good progress but need to accelerate their efforts in an effective way. The recycling rate in Spain
has shown a very changeable pattern since 2007: it increased to 31% in 2007, varied between 40% (2008) and
27% (2011) and end up in 34% in 2014. But overall, both Spain and Portugal are still far away of achieving the
50% target: the plans and measures proposed in both countries’ 3rd national WMP are requisite to move further
forward. In both Denmark and the reference countries, waste management policies were formulated and policy
instruments were implemented already in the 1980s and 1990s. As a result, all reference countries had achieved
the EU 2020 target by 2014, and Austria and Germany already in 2001. After 2001, these two countries
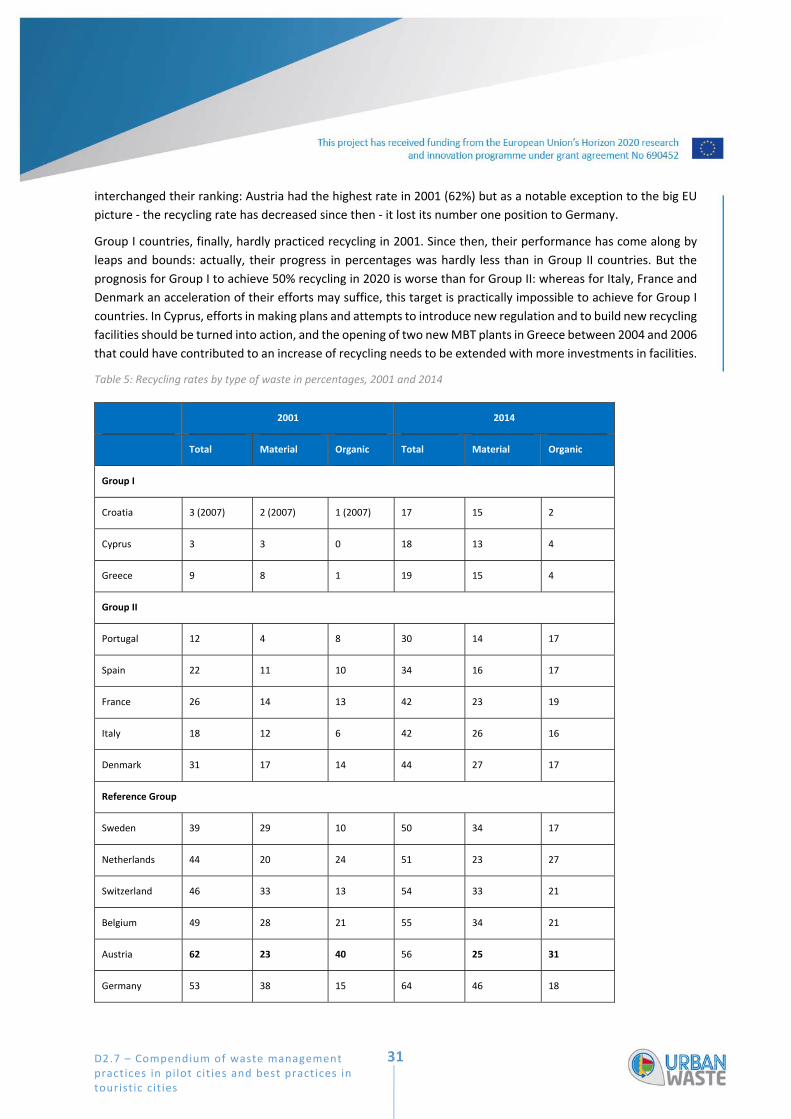
D2.7 – Compendium of waste management practices in pi lot cit ies and best practices in touristic cit ies
31
interchanged their ranking: Austria had the highest rate in 2001 (62%) but as a notable exception to the big EU
picture ‐ the recycling rate has decreased since then ‐ it lost its number one position to Germany.
Group I countries, finally, hardly practiced recycling in 2001. Since then, their performance has come along by
leaps and bounds: actually, their progress in percentages was hardly less than in Group II countries. But the
prognosis for Group I to achieve 50% recycling in 2020 is worse than for Group II: whereas for Italy, France and
Denmark an acceleration of their efforts may suffice, this target is practically impossible to achieve for Group I
countries. In Cyprus, efforts in making plans and attempts to introduce new regulation and to build new recycling
facilities should be turned into action, and the opening of two new MBT plants in Greece between 2004 and 2006
that could have contributed to an increase of recycling needs to be extended with more investments in facilities.
Table 5: Recycling rates by type of waste in percentages, 2001 and 2014
2001 2014
Total Material Organic Total Material Organic
Group I
Croatia 3 (2007) 2 (2007) 1 (2007) 17 15 2
Cyprus 3 3 0 18 13 4
Greece 9 8 1 19 15 4
Group II
Portugal 12 4 8 30 14 17
Spain 22 11 10 34 16 17
France 26 14 13 42 23 19
Italy 18 12 6 42 26 16
Denmark 31 17 14 44 27 17
Reference Group
Sweden 39 29 10 50 34 17
Netherlands 44 20 24 51 23 27
Switzerland 46 33 13 54 33 21
Belgium 49 28 21 55 34 21
Austria 62 23 40 56 25 31
Germany 53 38 15 64 46 18
D2.7 – Compendium of waste management practices in pi lot cit ies and best practices in touristic cit ies
32
When distinguishing the material and organic components of municipal waste, the recycling rate of material
waste was higher than of organic waste in 2001 in all countries but one, and also raised more rapidly in most
countries in the years up to 2014. Hence, progress in enhancing recycling rates is primarily due to trends in
recycling of materials with bio‐waste recycling performing less well. In Spain, recycling of material waste
increased very steadily while that of organic was subject to such great fluctuations that it is hard to conclude a
structural increase. And Austria was the most notable exception to the general observation: the amount of
recycled organic waste was largest during this whole period, although the gap with material waste narrowed.
3.4 Conclusion
The comparison in this chapter of 14 countries ‐ the eight ‘URBANWASTE countries’ and a reference group of the
six best performing countries ‐ is a subsection of the municipal waste policy review by EEA (2016) of all its 32
countries. Since the tourist industry as generator of waste is neither a separate field of national waste policy nor
are data on this specific part of the municipal waste stream available, the comparison includes national policies
and performances regarding the management of the undivided stream of municipal waste.
The list of policy instruments included in the review is far from exhaustive. Furthermore, country‐specific
uncertainties of the reported data are to the disadvantage of both their validity and comparability. Nevertheless,
EEA (2016) observed a few ‘messages’ emerging from the review. This conclusion on policies and performances
of the subsection of 14 countries is based on a combination of these messages and some key findings by EEA
(2013) in an earlier report.
There is no systematic difference in performance between countries with national plans and countries
with only regional plans. What the comparison of those 14 countries does show, however, is that those
that landfill least and recycle most introduced their first waste management plan earlier, before 2000,
and have revised it more often since then. Thus, exactly these countries will not need to make an
extraordinary and accelerating effort in order to achieve the EU target of landfill and recycling in the
coming years. What is more, some already achieved these. For the late starters on the other hand, it
will be extraordinary difficult if not practically impossible to achieve these targets. Which is not to say
that there is only a time gap at stake; some started only when made mandatory by EU legislation and
still lag behind EU targets for other reasons, e.g. a low level of organisation of municipal waste
management, a lack of appropriate treatment facilities and budget to invest in new ones, a low level of
environmental awareness of the population etc. In the case of Croatia, the date of entry in the EU plays
a significant role.
Overall, there are clear indications of a shift away from landfill towards waste management approaches
higher up the hierarchy in the EEA countries. Declining rates of landfilling and increasing recycling rates
go together. This observation also holds for the 14 countries in this chapter. Both taxes – although
landfill more than and incineration tax – and PAYT schemes appear effective instruments to incentivise
this shift up. As to PAYT, all EEA countries with recycling rates above 45% employ a similar system of
sorts, while most countries with recycling rates below 20% do hardly use them (EEA, 2016: 6).
EEA (2013) concludes for its 32 member countries that landfilling usually declines much faster than
recycling grows. The explanation is that “waste management strategies mostly move from landfill
D2.7 – Compendium of waste management practices in pi lot cit ies and best practices in touristic cit ies
33
towards a combination of recycling and incineration, and in some cases also mechanical‐biological
treatment” (EEA, 2016: 5). This conclusion is much less obvious for the group of 14 countries. Landfill
decreased much slower than recycling grew since the turn of the century both in the three countries
(Croatia, Greece and Cyprus) with very high landfill rates – over 100% of the 1995 value ‐ and in three
countries (Denmark, Switzerland and Germany) at the other extreme, i.e. with already very low landfill
rates. The picture is mixed for the other countries.
Countries using a broad range of the instruments listed in Table 1 have a higher municipal waste
recycling rate than countries using few or no instruments. However, the way in which policy instruments
are combined may be more relevant than the total number of instruments. Hence, interactions between
these policies within a waste management life cycle approach also counts.

D2.7 – Compendium of waste management practices in pi lot cit ies and best practices in touristic cit ies
34
4. Current Waste Prevention and
Management Practices in Pilot Cities
This chapter contains a description of the current waste prevention and management practices in the URBANWASTE Pilot Cases. The 11 URBANWASTE pilot cases are (in alphabetical order): Copenhagen (DK), Dubrovnik (HR), Florence (IT), Kavala (GR), Lisbon (PT), Nice (FR), Nicosia (CY), Ponta Delgada (PT), Santander (ES), Syracuse (IT) and Tenerife (ES; Municipalities of Adeje, Arona and Puerto de la Cruz).
Besides describing briefly some general characteristics of the pilot case areas, the description focusses on waste
prevention activities that currently exist in the pilot cases as well on the municipal solid waste management.
Attention is further paid on the organisation of waste collection from tourist establishments and touristic ships.
Definition of terms
According to the EU Waste Framework Directive (WFD, 2008), waste “prevention” means measures taken before
a substance, material or product has become waste, that reduce:
(a) the quantity of waste, including through the re‐use of products or the extension of the life span of
products;
(b) the adverse impacts of the generated waste on the environment and human health; or
(c) the content of harmful substances in materials and products;
“Re‐use” means any operation by which products or components that are not waste are used again for the same
purpose for which they were conceived (WFD, 2008).
Further definitions for terms such as “metropolitan area”, “tourist establishments”, “touristic ships” or
“municipal solid waste (MSW)” are provided in the Glossary.
Waste prevention and management strategies can be designed and implemented by using one or a combination
of various policy instruments and measures. In accordance with Reisinger and Krammer (2007) as well as
Salhofer et al. (2010), to classify the waste prevention activities that are currently existing in the URBANWASTE
pilot case the following categories are used.
1. Regulatory instruments: enforcing limits on waste generation and expanding environmental
obligations, ensure law enforcement, introduce new regulatory approach, Public‐Private Partnership
approach
2. Economic Instruments: applying the “Polluter Pays Principle” for waste generators (e.g. Pay‐as‐you‐
throw schemes and tax on waste disposal) and providing financial and logistical support for beneficial
initiatives;
3. Infrastructural/Technological Instruments: introducing the most suitable technical solutions for
implementing sustainable waste management schemes and supporting good practice implementation
D2.7 – Compendium of waste management practices in pi lot cit ies and best practices in touristic cit ies
35
thanks to the use of IT tools or other enabling technologies targeting tourists, citizens and service
providers
4. Information Instruments: aimed to change behaviours and make informed decisions. In particular, the
strategies will include two main action lines: Waste prevention and reuse.
5. Voluntary Agreements: agreements between industry and the authorities or self‐commitments of
industry
4.1 Copenhagen (DK)
Trine BJØRN OLSEN
4.1.1 Brief description of the URBANWASTE pilot case area
Copenhagen, the capital of Denmark, is a municipality characterised as a metropolitan area. The area of
Copenhagen is 86.2 km22. The total number of inhabitants by first day in the fourth quarter the recent three
years were3:
2014 (Q1): 579,513
2015 (Q1): 589,699
2016 (Q4): 601,448
The waste management in Copenhagen is continuously improved through strategic plans in accordance with
national and European objectives for waste and resource management. Danish waste management plans are
revised every four years.
The City of Copenhagen is ambitious in the field of resource and waste management as well as sustainable
actions. The current Resource and Waste Management Plan 2018, approved by the City Council of Copenhagen,
has been introduced for the period 2013‐2018. The plan outlines the objectives of waste prevention and
increasing the share of materials for recycling:
Waste for incineration should be reduced by 20% by 2018
At least 45% of the household waste should be recycled by 2018
The initiatives in the plan ensure that by 2018 approximately of 90,000 tonnes of waste a year are separated for
other treatment than incineration, including waste prevention measures.
The municipality has the vision of becoming zero waste city by 2050. Circular economy and environmental
sustainability are important focus areas in this context. The Resource and Waste Management Plan also
2 StatBank Denmark: http://www.statistikbanken.dk/statbank5a/default.asp?w=1440 3 StatBank Denmark: http://www.statistikbanken.dk/statbank5a/default.asp?w=1440
D2.7 – Compendium of waste management practices in pi lot cit ies and best practices in touristic cit ies
36
interplays with other strategic plans in the municipality, not least the Climate Plan, aiming at Copenhagen
becoming carbon neutral by 2025.
Currently all households segregate recyclable fractions at source and more fractions will be introduced with the
development of new technologies for waste separation. The MSW fractions are collected from kerbside and from
recycling stations.
The businesses in Copenhagen are obliged to manage their own waste in compliance with the municipal waste
management system. Businesses are free to hire a private company collecting the waste for treatment but source
segregation in recyclable fractions is compulsory. The businesses are also obliged to secure documentation that
the recyclable fractions are actually being recycled.
At the moment, prevention of food waste is a main issue for both households and businesses. A range of
measures are taken helping different stakeholders to prevent food waste e.g. social supermarkets, mobile phone
apps, restaurants providing guests with doggy bags, teaching households as well as staff in large kitchens to use
food items close to “best before”‐date.
Incineration of non‐recyclables is also an essential part of the waste management system. Danish households
are mainly supplied with district heating from an extensive pipeline network and co‐generation of heat and
power (CHP) ensures a high rate of energy recovery from the combustion process. At Amager Ressource Center
in Copenhagen the world’s most energy efficient incinerator will be put into operation from 2017 onwards.
Regarding tourism, Copenhagen hosted around 7 million overnight stays in 2014 and the number is increasing.
On average, tourists stay in Copenhagen for 3.5 days. Summer is high season peaking in July. Tourism is an
integrated part of the activities in Copenhagen and therefore waste management from tourists is not a sector by
itself. Several hotels in Copenhagen have the Green Key eco‐label and some have the Nordic Swan eco‐label. The
City of Copenhagen has made a targeted effort to help hotels introduce waste separation to their operations.
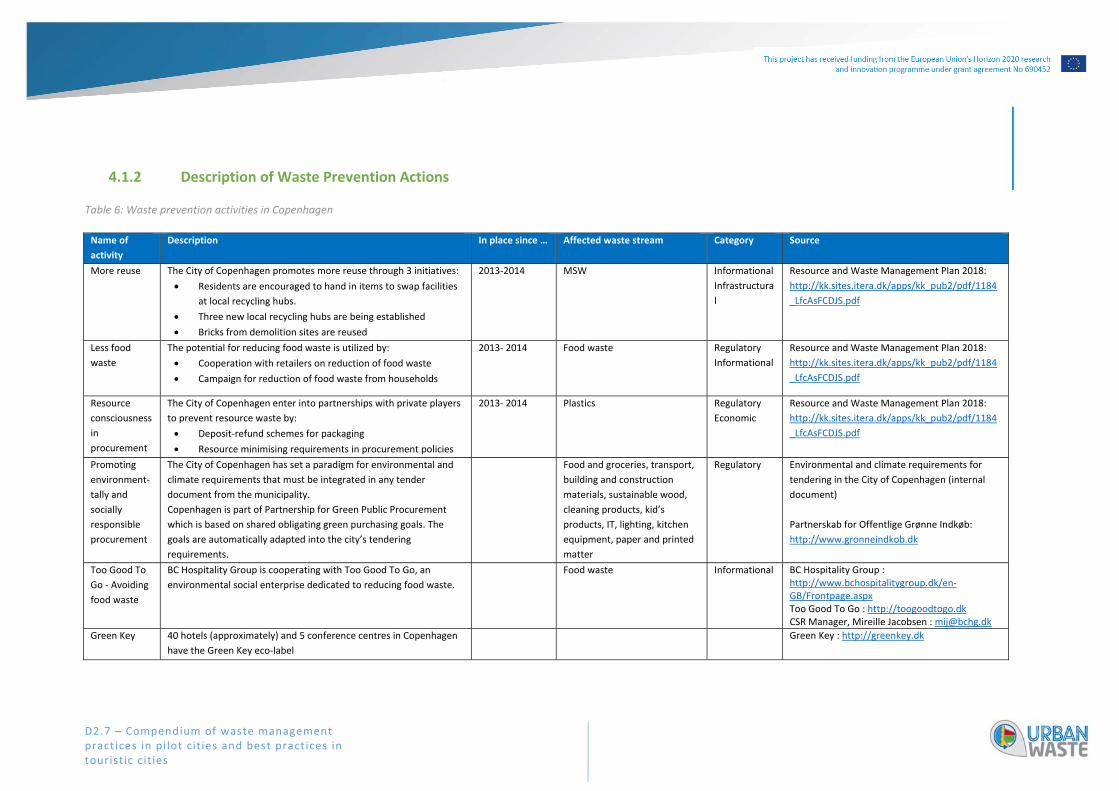
D2.7 – Compendium of waste management practices in pi lot cit ies and best practices in touristic cit ies
4.1.2 Description of Waste Prevention Actions
Table 6: Waste prevention activities in Copenhagen
Name of
activity
Description In place since … Affected waste stream Category Source
More reuse
The City of Copenhagen promotes more reuse through 3 initiatives:
Residents are encouraged to hand in items to swap facilities
at local recycling hubs.
Three new local recycling hubs are being established
Bricks from demolition sites are reused
2013‐2014
MSW Informational
Infrastructura
l
Resource and Waste Management Plan 2018:
http://kk.sites.itera.dk/apps/kk_pub2/pdf/1184
_LfcAsFCDJS.pdf
Less food
waste
The potential for reducing food waste is utilized by:
Cooperation with retailers on reduction of food waste
Campaign for reduction of food waste from households
2013‐ 2014 Food waste Regulatory
Informational
Resource and Waste Management Plan 2018:
http://kk.sites.itera.dk/apps/kk_pub2/pdf/1184
_LfcAsFCDJS.pdf
Resource
consciousness
in
procurement
The City of Copenhagen enter into partnerships with private players
to prevent resource waste by:
Deposit‐refund schemes for packaging
Resource minimising requirements in procurement policies
2013‐ 2014 Plastics Regulatory
Economic
Resource and Waste Management Plan 2018:
http://kk.sites.itera.dk/apps/kk_pub2/pdf/1184
_LfcAsFCDJS.pdf
Promoting
environment‐
tally and
socially
responsible
procurement
The City of Copenhagen has set a paradigm for environmental and
climate requirements that must be integrated in any tender
document from the municipality.
Copenhagen is part of Partnership for Green Public Procurement
which is based on shared obligating green purchasing goals. The
goals are automatically adapted into the city’s tendering
requirements.
Food and groceries, transport,
building and construction
materials, sustainable wood,
cleaning products, kid’s
products, IT, lighting, kitchen
equipment, paper and printed
matter
Regulatory Environmental and climate requirements for
tendering in the City of Copenhagen (internal
document)
Partnerskab for Offentlige Grønne Indkøb:
http://www.gronneindkob.dk
Too Good To
Go ‐ Avoiding
food waste
BC Hospitality Group is cooperating with Too Good To Go, an
environmental social enterprise dedicated to reducing food waste.
Food waste Informational
BC Hospitality Group : http://www.bchospitalitygroup.dk/en‐GB/Frontpage.aspx Too Good To Go : http://toogoodtogo.dk CSR Manager, Mireille Jacobsen : [email protected]
Green Key 40 hotels (approximately) and 5 conference centres in Copenhagen
have the Green Key eco‐label
Green Key : http://greenkey.dk
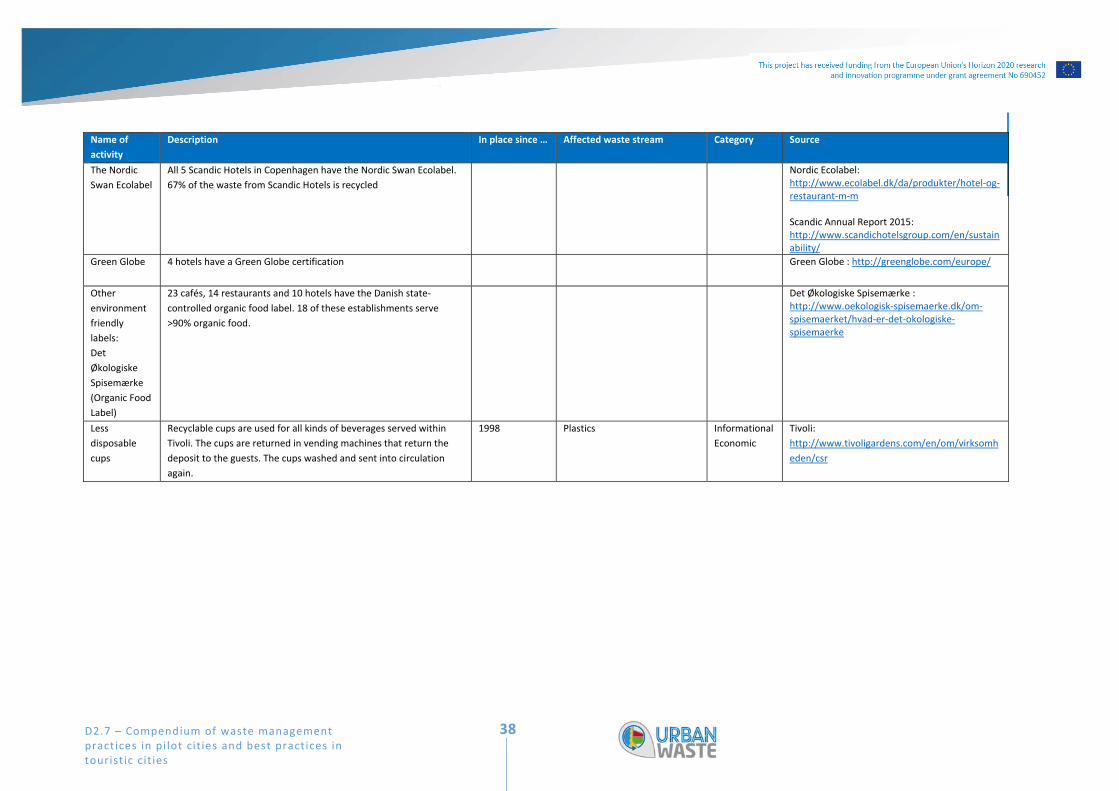
D2.7 – Compendium of waste management practices in pi lot cit ies and best practices in touristic cit ies
38
Name of
activity
Description In place since … Affected waste stream Category Source
The Nordic
Swan Ecolabel
All 5 Scandic Hotels in Copenhagen have the Nordic Swan Ecolabel.
67% of the waste from Scandic Hotels is recycled
Nordic Ecolabel: http://www.ecolabel.dk/da/produkter/hotel‐og‐restaurant‐m‐m Scandic Annual Report 2015: http://www.scandichotelsgroup.com/en/sustainability/
Green Globe 4 hotels have a Green Globe certification
Green Globe : http://greenglobe.com/europe/
Other
environment
friendly
labels:
Det
Økologiske
Spisemærke
(Organic Food
Label)
23 cafés, 14 restaurants and 10 hotels have the Danish state‐
controlled organic food label. 18 of these establishments serve
>90% organic food.
Det Økologiske Spisemærke : http://www.oekologisk‐spisemaerke.dk/om‐spisemaerket/hvad‐er‐det‐okologiske‐spisemaerke
Less
disposable
cups
Recyclable cups are used for all kinds of beverages served within
Tivoli. The cups are returned in vending machines that return the
deposit to the guests. The cups washed and sent into circulation
again.
1998 Plastics Informational
Economic
Tivoli:
http://www.tivoligardens.com/en/om/virksomh
eden/csr
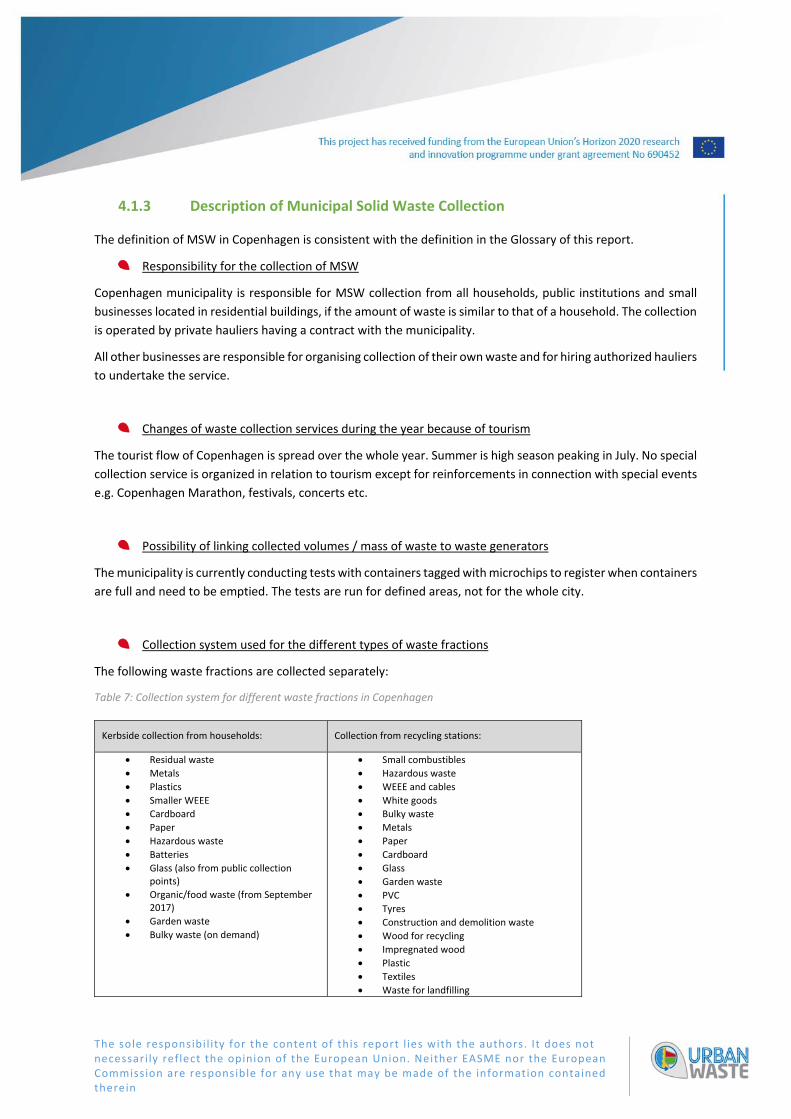
The sole responsibil ity for the content of this report l ies with the authors. It does not necessari ly reflect the opinion of the European Union. Neither EASME nor the European Commission are responsible for any use that may be made of the information contained therein
4.1.3 Description of Municipal Solid Waste Collection
The definition of MSW in Copenhagen is consistent with the definition in the Glossary of this report.
Responsibility for the collection of MSW
Copenhagen municipality is responsible for MSW collection from all households, public institutions and small
businesses located in residential buildings, if the amount of waste is similar to that of a household. The collection
is operated by private hauliers having a contract with the municipality.
All other businesses are responsible for organising collection of their own waste and for hiring authorized hauliers
to undertake the service.
Changes of waste collection services during the year because of tourism
The tourist flow of Copenhagen is spread over the whole year. Summer is high season peaking in July. No special
collection service is organized in relation to tourism except for reinforcements in connection with special events
e.g. Copenhagen Marathon, festivals, concerts etc.
Possibility of linking collected volumes / mass of waste to waste generators
The municipality is currently conducting tests with containers tagged with microchips to register when containers
are full and need to be emptied. The tests are run for defined areas, not for the whole city.
Collection system used for the different types of waste fractions
The following waste fractions are collected separately:
Table 7: Collection system for different waste fractions in Copenhagen
Kerbside collection from households: Collection from recycling stations:
Residual waste
Metals
Plastics
Smaller WEEE
Cardboard
Paper
Hazardous waste
Batteries
Glass (also from public collection points)
Organic/food waste (from September 2017)
Garden waste
Bulky waste (on demand)
Small combustibles
Hazardous waste
WEEE and cables
White goods
Bulky waste
Metals
Paper
Cardboard
Glass
Garden waste
PVC
Tyres
Construction and demolition waste
Wood for recycling
Impregnated wood
Plastic
Textiles
Waste for landfilling

D2.7 – Compendium of waste management practices in pi lot cit ies and best practices in touristic cit ies
40
Other options available for households to give away certain types of waste
Other options for giving away reusable products and items:
There are many second‐hand and antiques shops in Copenhagen receiving clothes, books, furniture and
other reusable items, reselling them either for charity (e.g. Red Cross, Save the Children) or as customary
revenue based business.
In Denmark beverage packaging like beer‐ and soft drink bottles/cans are included in a deposit system and
not regarded as a part of the waste management system. Beverage cans and bottles are collected separately
at supermarkets and grocery stores where people bring it and get back their deposits. The deposit system
is state‐controlled and regulated through the Danish Environmental Protection Act.
Composition of residual waste
The fractional composition of residual waste in Copenhagen was last measured in 2015:
Table 8: Composition of residual waste in Copenhagen (2015)
Fraction % Fraction %
Advertisements 2.07 Milk cartons (carton/plastic) 1.82
Aluminum foil and containers 0.49 Newsprints 2.14
Animal excrements and bedding (straw) 1.15 Non‐recyclable glass 0.39
Animal derived food waste 9.07 Non‐recyclable plastic 5.33
Ash 0.39 Office paper 0.46
Batteries 1.16 Other clean cardboard 0.33
Beverage cans (aluminum) 0.40 Other clean paper 0.86
Books, phone books 0.09 Other combustibles 1.32
Brown glass 1.03 Other metals 0.93
Cat litter 1.79 Other non‐combustibles 0.69
Ceramics 0.72 Paper and carton containers 1.03
Cigarette butts 0.31 Plastic bottles 0.75
Clear glass 1.03 Plastic products (toys, hangers, pens) 0.89
Cotton, bandages 0.22 Plastic‐coated aluminum foil 0.74
Diapers, sanitary towels, tampons 9.81 Rubber 0.09
Dirty cardboard 0.98 Shoes, leather 0.67
Dirty paper 1.37 Soft plastic 5.16
Disposable sanitary products (cloths, gloves) 0.40 Soil 0.45
Food cans (tinplate/steel) 0.15 Stones, concrete 1.02
Green glass 1.03 Textiles 3.59
Hard plastic 0.29 Vacuum cleaner bags 1.16
Juice cartons (carton/plastic/aluminum) 0.54 Vegetable food waste 28.53
Kitchen towels 1.99 Wood 0.57
Magazines 0.58 Yard waste, flowers 4.02
Waste treatment in Copenhagen:
Treatment of residual waste
Waste combustion is an integrated part of the Danish energy system. Residual waste from the City of
Copenhagen is incinerated at two local CHP plants; Amager Ressource Center in Copenhagen and
Vestforbrænding located in the greater Copenhagen area (Glostrup municipality) producing district heating and
power for the supply network.
D2.7 – Compendium of waste management practices in pi lot cit ies and best practices in touristic cit ies
41
Waste for landfilling is deposited at AV Miljø with is also located in the greater Copenhagen area (Hvidovre
municipality).
Treatment of recyclables
All recyclables are exported from the City of Copenhagen to other locations in Denmark or outside the country
for further treatment. The recycled fractions are:
WEEE and cables
White goods
Metals
Paper
Cardboard
Glass
Rigid PVC
Tyres
Construction and demolition waste
Wood for recycling
Rigid plastic
Textiles
Management of street bins and street sweeping
Waste collected from street bins is considered a part of MSW. Street bin waste is sent for incineration without
further segregation.
Waste from street bins and street sweeping is not under the waste authority’s administration, but falls under
another department in The Technical and Environmental Administration in the City of Copenhagen.
Some seasonal variations are seen in street sweeping waste as leaves make up a large share in autumn and road
salt alike during winter. Apart from this, street sweeping waste mainly consists of grit. Litter is considered part
of the street sweeping waste and therefore not included in the definition of MSW as presented in the Glossary
of this report.
Table 9 shows further waste management activities in Copenhagen.
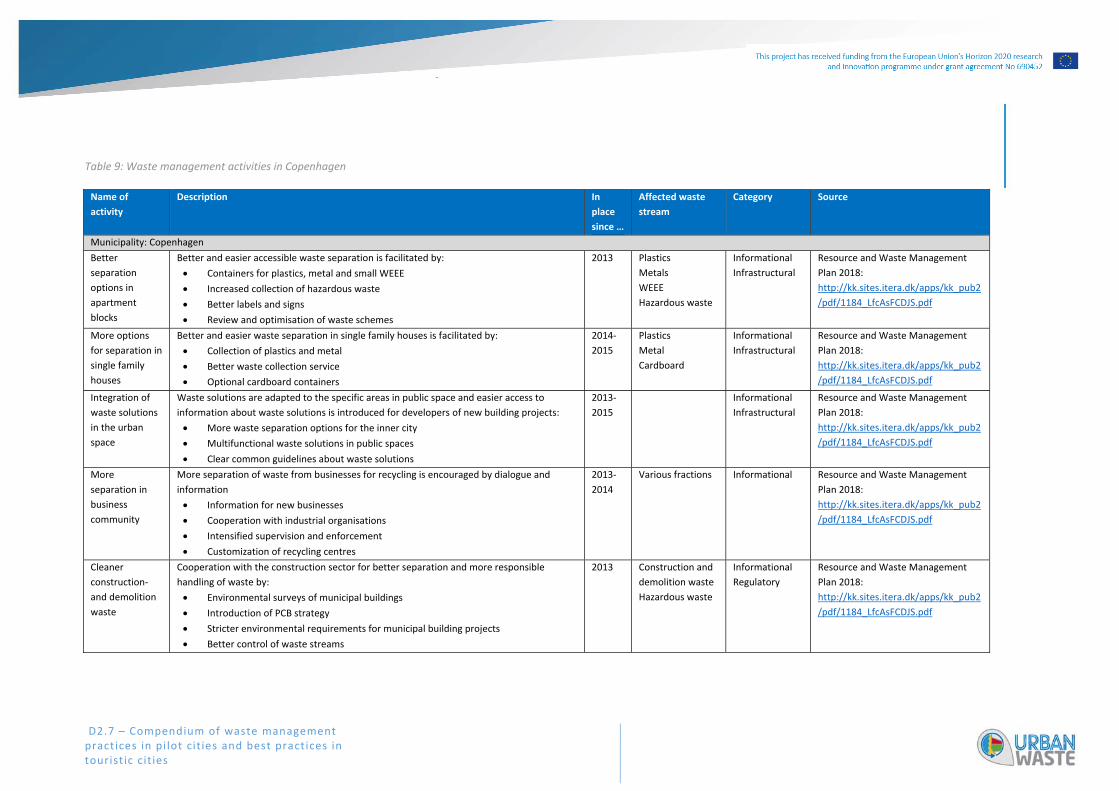
D2.7 – Compendium of waste management practices in pi lot cit ies and best practices in touristic cit ies
Table 9: Waste management activities in Copenhagen
Name of
activity
Description In
place
since …
Affected waste
stream
Category Source
Municipality: Copenhagen
Better
separation
options in
apartment
blocks
Better and easier accessible waste separation is facilitated by:
Containers for plastics, metal and small WEEE
Increased collection of hazardous waste
Better labels and signs
Review and optimisation of waste schemes
2013 Plastics
Metals
WEEE
Hazardous waste
Informational
Infrastructural
Resource and Waste Management
Plan 2018:
http://kk.sites.itera.dk/apps/kk_pub2
/pdf/1184_LfcAsFCDJS.pdf
More options
for separation in
single family
houses
Better and easier waste separation in single family houses is facilitated by:
Collection of plastics and metal
Better waste collection service
Optional cardboard containers
2014‐
2015
Plastics
Metal
Cardboard
Informational
Infrastructural
Resource and Waste Management
Plan 2018:
http://kk.sites.itera.dk/apps/kk_pub2
/pdf/1184_LfcAsFCDJS.pdf
Integration of
waste solutions
in the urban
space
Waste solutions are adapted to the specific areas in public space and easier access to
information about waste solutions is introduced for developers of new building projects:
More waste separation options for the inner city
Multifunctional waste solutions in public spaces
Clear common guidelines about waste solutions
2013‐
2015
Informational
Infrastructural
Resource and Waste Management
Plan 2018:
http://kk.sites.itera.dk/apps/kk_pub2
/pdf/1184_LfcAsFCDJS.pdf
More
separation in
business
community
More separation of waste from businesses for recycling is encouraged by dialogue and
information
Information for new businesses
Cooperation with industrial organisations
Intensified supervision and enforcement
Customization of recycling centres
2013‐
2014
Various fractions Informational Resource and Waste Management
Plan 2018:
http://kk.sites.itera.dk/apps/kk_pub2
/pdf/1184_LfcAsFCDJS.pdf
Cleaner
construction‐
and demolition
waste
Cooperation with the construction sector for better separation and more responsible
handling of waste by:
Environmental surveys of municipal buildings
Introduction of PCB strategy
Stricter environmental requirements for municipal building projects
Better control of waste streams
2013 Construction and
demolition waste
Hazardous waste
Informational
Regulatory
Resource and Waste Management
Plan 2018:
http://kk.sites.itera.dk/apps/kk_pub2
/pdf/1184_LfcAsFCDJS.pdf
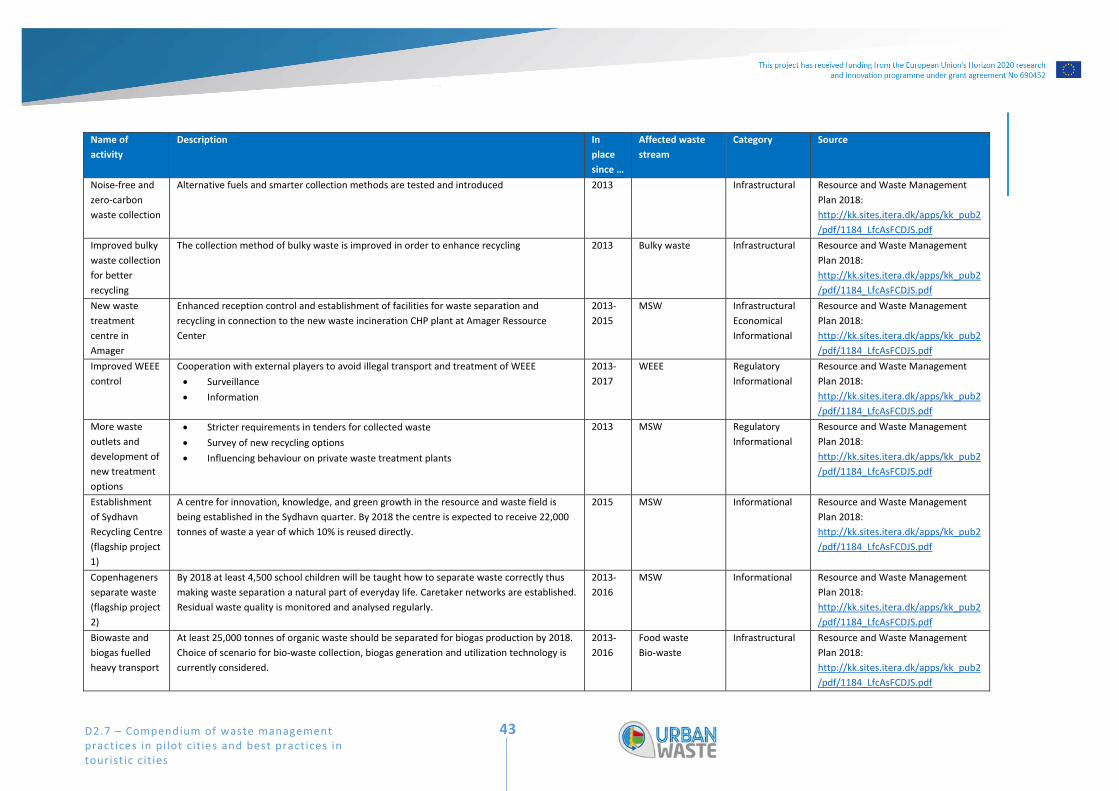
D2.7 – Compendium of waste management practices in pi lot cit ies and best practices in touristic cit ies
43
Name of
activity
Description In
place
since …
Affected waste
stream
Category Source
Noise‐free and
zero‐carbon
waste collection
Alternative fuels and smarter collection methods are tested and introduced 2013 Infrastructural Resource and Waste Management
Plan 2018:
http://kk.sites.itera.dk/apps/kk_pub2
/pdf/1184_LfcAsFCDJS.pdf
Improved bulky
waste collection
for better
recycling
The collection method of bulky waste is improved in order to enhance recycling 2013 Bulky waste Infrastructural Resource and Waste Management
Plan 2018:
http://kk.sites.itera.dk/apps/kk_pub2
/pdf/1184_LfcAsFCDJS.pdf
New waste
treatment
centre in
Amager
Enhanced reception control and establishment of facilities for waste separation and
recycling in connection to the new waste incineration CHP plant at Amager Ressource
Center
2013‐
2015
MSW Infrastructural
Economical
Informational
Resource and Waste Management
Plan 2018:
http://kk.sites.itera.dk/apps/kk_pub2
/pdf/1184_LfcAsFCDJS.pdf
Improved WEEE
control
Cooperation with external players to avoid illegal transport and treatment of WEEE
Surveillance
Information
2013‐
2017
WEEE Regulatory
Informational
Resource and Waste Management
Plan 2018:
http://kk.sites.itera.dk/apps/kk_pub2
/pdf/1184_LfcAsFCDJS.pdf
More waste
outlets and
development of
new treatment
options
Stricter requirements in tenders for collected waste
Survey of new recycling options
Influencing behaviour on private waste treatment plants
2013 MSW Regulatory
Informational
Resource and Waste Management
Plan 2018:
http://kk.sites.itera.dk/apps/kk_pub2
/pdf/1184_LfcAsFCDJS.pdf
Establishment
of Sydhavn
Recycling Centre
(flagship project
1)
A centre for innovation, knowledge, and green growth in the resource and waste field is
being established in the Sydhavn quarter. By 2018 the centre is expected to receive 22,000
tonnes of waste a year of which 10% is reused directly.
2015 MSW Informational Resource and Waste Management
Plan 2018:
http://kk.sites.itera.dk/apps/kk_pub2
/pdf/1184_LfcAsFCDJS.pdf
Copenhageners
separate waste
(flagship project
2)
By 2018 at least 4,500 school children will be taught how to separate waste correctly thus
making waste separation a natural part of everyday life. Caretaker networks are established.
Residual waste quality is monitored and analysed regularly.
2013‐
2016
MSW Informational Resource and Waste Management
Plan 2018:
http://kk.sites.itera.dk/apps/kk_pub2
/pdf/1184_LfcAsFCDJS.pdf
Biowaste and
biogas fuelled
heavy transport
At least 25,000 tonnes of organic waste should be separated for biogas production by 2018.
Choice of scenario for bio‐waste collection, biogas generation and utilization technology is
currently considered.
2013‐
2016
Food waste
Bio‐waste
Infrastructural Resource and Waste Management
Plan 2018:
http://kk.sites.itera.dk/apps/kk_pub2
/pdf/1184_LfcAsFCDJS.pdf

D2.7 – Compendium of waste management practices in pi lot cit ies and best practices in touristic cit ies
44
Name of
activity
Description In
place
since …
Affected waste
stream
Category Source
(flagship project
3)
Prevention and
recycling of
plastic waste
(flagship project
4)
15,000 tonnes or 35% of the plastics from residual waste should be separated and recycled
by 2018 by means of a specialized separation system, development of a roadmap tool,
better collection programmes and information (Life+ project).
2013‐
2014
Plastics Infrastructural Resource and Waste Management
Plan 2018:
http://kk.sites.itera.dk/apps/kk_pub2
/pdf/1184_LfcAsFCDJS.pdf
Amager Bakke Amager Ressource Center has built in recreational elements into its architecture by
constructing a rooftop skiing slope and hiking track and a climbing wall at the CHP plant, in
this way making the waste treatment facility an integral part of the city experiences
2017
Informational Amager Ressource Center:
https://www.a‐r‐c.dk
REnescience Amager Ressource Center has a pilot biogas plant processing unsorted MSW. The pilot
provides data and knowledge for further development and upscaling of biogas production
from unsorted MSW
2009 MSW
Bio‐waste
Infrastructural Amager Ressource Center:
https://www.a‐r‐c.dk
REenscience:
http://www.renescience.com/en
Dansk
Retursystem
Danish Retursystem collects returnable beverage packaging in Copenhagen. In 2016 they
purchased their first biogas fuelled truck to serve the collection route.
2016 Bio‐waste Infrastructural Dansk Retursystem:
https://www.dansk‐
retursystem.dk/en/sustainability/clim
ate‐friendly‐energy/
REN kærlighed
til KBH (“PURE
love for CPH”)
Development of joint solutions and shared experience in cooperation on common issues
concerning waste in the city e.g. public bins and containers, events, information, nudging
etc.
2012 MSW Informational REN kærlighed til KBH:
https://www.facebook.com/renkaerli
ghedtilkbh/
Biogas from
food waste
Food waste from the kitchens at Bella Center Copenhagen, AC Hotel Bella Sky and Hotel
Crowne Plaza Copenhagen Towers is collected and utilized for biogas production.
Food waste
Infrastructural BC Hospitality Group : http://www.bchospitalitygroup.dk/en‐GB/Frontpage.aspx CSR Manager, Mireille Jacobsen : [email protected]
D2.7 – Compendium of waste management practices in pi lot cit ies and best practices in touristic cit ies
4.1.4 Collection of Waste from Tourist Establishments
Like other businesses most tourist establishments like e.g. hotels have made arrangements with private waste
collectors though some are serviced by the municipal waste collection.
In general, all companies have a responsibility to sort their waste properly and make sure that it is treated
environmentally appropriate. The waste from businesses should at least be separated into:
residual waste
paper
cardboard
rigid plastic
glass
garden waste
cooking oil
organic waste (food waste)
hazardous waste
plastic sheeting
metal
WEEE
Companies are allowed to use the municipal recycling centres if the total weight of the waste, vehicle and trailer
combined does not exceed 3500 kg at a time.
The City of Copenhagen does not have the full overview of which types of waste are separately collected from
the different types of tourist establishments.
4.1.5 Description of waste from touristic ships
Approximately 1% of the tourists in Copenhagen arrive by ship.
The harbour management, CPH City & Port Development4, is responsible for the collection of waste from cruise
ships. The collection is provided by private hauliers.
The waste fractions collected from cruise ships are:
Light bulbs
Metals
Glass
Cardboard
WEEE
Hazardous waste
Rigid plastic (mostly PET)
Ashes from waste incineration on board
Information on the composition of waste from touristic ships is not available.
4 http://www.byoghavn.dk/english.aspx
D2.7 – Compendium of waste management practices in pi lot cit ies and best practices in touristic cit ies
46
4.2 Dubrovnik (HR)
Erneszt KOVÁCS
4.2.1 Brief description of the URBANWASTE pilot case area
Dubrovnik‐Neretva County is the southernmost county in the Republic of Croatia, adorned by the blue‐green
landscape, valuable cultural and natural heritage and tremendously rich history. The county covers a total area
of 9,272.37 km2, of which 7,489.8 km2 or 80.78% belongs to the Adriatic Sea, and has the population of 122.568.
The whole area used to be a republic for itself called the Republic of Ragusa, which was an important
Mediterranean force from the 13th century onwards. This maritime society had highly expressed ethical and
human values, with liberty as the highest worth. Ragusa was the first in Europe to abolish slavery (1416). Its
motto was “Non bene pro toto libertas venditur auro” – “Liberty is not well sold for all the gold”. This republic
made one of the first medieval sewer systems (1296), while other major cities across Europe had little or none
awareness for the disposal of this type of waste. Today, 29% of the area is under NATURA 2000 protection and
managed to preserve its beauty with very indented coastline that varies from sheltered bays, sandy beaches of
exotic beauty, steep shoreline with cliffs facing the open sea, islands, forest parks, reserves and its gracefulness
of numerous fortifications, civil structures, religious buildings, summer residences… Our pilot case boasts of with
the World Heritage Site (Old City of Dubrovnik) with its medieval, 6 meters thick and 2 kilometres long walls that
have been popular filming site for Game of Thrones series, the latest episode of the Star Wars franchise and will
become Nottingham Castle in the new Robin Hood blockbuster.
4.2.2 Description of Waste Prevention Actions
Dubrovnik Neretva County has no waste prevention activities in place at the moment and the only actions that
could be considered as such are voluntary agreements and commitments, such as ISO standards and Green Key,
from hotels or other institutions.
4.2.3 Description of Municipal Solid Waste Collection
According to the county’s interpretation and definition of municipal solid waste, it is defined as waste generated
in households and waste that has its composition and quality similar to the waste from households, except
industrial waste and waste from agriculture and forestry. Mixed municipal solid waste, on the other hand, is
household waste and waste from commerce, industry and institutions which has properties and composition
similar to waste from households in which the individual waste streams are not isolated. Municipal solid waste
in the county also includes litter.
Municipal waste collection is within the local authorities’ responsibilities. All local government units in
Dubrovnik Neretva County (22 of them) have a waste management and collection responsibility. There are also
private companies that are authorised and in charge of specific kind of waste collection, such as cooking oils,
electric and electronic waste, etc. All these companies cooperate with the touristic sector (e.g. hotels,
restaurants) since there are no specific industry facilities in the County. These services of municipal waste

D2.7 – Compendium of waste management practices in pi lot cit ies and best practices in touristic cit ies
47
collection extend beyond solely household waste collection to similar establishment producing waste similar to
household waste (commercial activities, office buildings, schools, government buildings, small businesses etc.).
The collection frequency and intensity increases with the high touristic season (June – September) and adapts to
the required situation.
Unfortunately, tracking of the created volumes of waste and the identification of their generators is not yet
possible, as the County has no such technology (e.g. containers with optical codes, chip readers) installed on its
territory. The weighed amounts of waste are not at the County’s disposal either.
The Department for Environmental and Nature Protection of Dubrovnik Neretva County issues municipal waste
management licences, as well as licences for special categories of waste to private companies. For hazardous
waste the licences are issued by the Croatian Ministry for Environment and Nature Protection. From 2011 to
2014 the number of companies licensed for municipal and non‐hazardous waste varied between 8 (2011) and
13 (2013) in the County. In 2014, 11 companies had a license for municipal and non‐hazardous waste which is
the same number of companies licensed in 2010. The number of companies licensed for municipal and non‐
hazardous waste has, therefore, not changed significantly from the previous reporting period (2007 ‐ 2010). The
total amount of collected municipal waste in the County in 2011 amounted to 61,332.89 tonnes, 67,955.12
tonnes in 2013 and 64 942.19 tonnes in 2013. If the data from the previous study period (2007 – 2010) is taken
into account, when the amount of collected municipal waste was between 68,000 tonnes and 80,000 tonnes, it
can be concluded that there is a trend of reducing the total amount of collected municipal waste in the County.
The waste streams that are separately collected are listed below. This list comes from the latest Regulation of
categories, types and classification of waste with a waste catalogue and list of hazardous waste, released by the
national Ministry of Environment.
Paper and cardboard
Glass
Biodegradable waste
from kitchens and
canteen
Clothing
Textile
Solvents
Acid
Alkaline
Photographic
chemicals
Pesticides
Fluorescent tubes and
other mercury
containing waste
Discarded equipment
containing fluoro‐
chlorohydrocarbon
Cooking oil and fat
Oil and fat
Paint, inks, adhesives
and resins
Detergents
Cytotoxic and
cytostatic
Medicines
Batteries and
accumulators and
Unsorted batteries
and accumulators
containing these
batteries
Discarded electrical
and electronic
equipment
Wood
Plastic
Metals
Electronic equipment
(e.g., circuit boards)
Packaging waste
Separate collection activities are described and updated yearly in the environmental report released by the
County. The latest available one is from November 2015. It reports on 8 local authorities (out of 22) which have
D2.7 – Compendium of waste management practices in pi lot cit ies and best practices in touristic cit ies
48
implemented a partial selective collection scheme for paper, plastics, glass, textile and metal by setting up bring
banks. However, according to the report, these are not accessible for all the residents. The city of Metković has
also installed wired containers for paper collection and containers for glass and plastic packaging, as well as
metals which is collected by a private concessioner.
14 local authorities (out of 22) do not have any separate collection schemes in place, except for bulky waste.
Separate collection of bulky waste is being provided by a majority of local authorities from once a week to twice
a year, in some cases. Bulky waste is being discharged in landfills where certain parts are being removed and
passed on private concessioners.
Most of the total amount of collected municipal waste generated in the County over the years was disposed in
landfills (more than 90%) and only about 7% of municipal waste was sent for recovery. However, according to
the Croatian Agency for Environmental Protection’s report, an estimate of the total rate of recycling municipal
waste is significantly higher in 2013, at around 15% (there is no more recent data available).
Kerbside collection is applied to mixed municipal waste and separated waste. There is only one recycling yard in
which citizens can personally dispose of certain wastes. This recycling yard – the first one opened in Dubrovnik
Neretva County, started working in July 2016 but it only covers the city of Dubrovnik. There are still no data
available from this facility for this publication. Like elsewhere in Croatia, plastic packaging (PET bottles) can be
returned to shops for a recovery of 0.50 HRK per bottle (€¢ 7). There is no data available on the composition of
residual waste.
The collected residual waste is landfilled and, in terms of statistics, appears in the total landfilled amounts
presented above. The County has one landfill Grabovica, which is not sufficient and which already shows signs
of being outdated and a threat for the environment. By the end of 2017, the County should see a competition of
a brand new regional recycling centre which will provide the entire County with proper waste management
treatment. Furthermore, the centre will include an artificial marshland for remediation of waste waters from
hotels and other touristic facilities, produce fertiliser and let the water into sea once it meets necessary quality
standards.
Since Dubrovnik Neretva County only has landfills as a destination for the waste generated on its territory,
without any official and certified facility for recycling and recovery of certain waste streams it is forced to
transport and export to neighbouring and other counties in Croatia. However, one recycling yard has been
opened in July 2016. Apart from transporting to other counties, one part of the Dubrovnik Neretva County
(Pelješac peninsula) is exporting its waste to another country, where it is disposed in a landfill in a non‐registered
and non‐certified disposal area. Data on the fractions and their destined treatment options are not available for
the publication, as the operation is done by a private company.
When it comes to treatment options for waste coming from street bins and street sweeping, the local
authorities are responsible for its management and it is classified into 4 categories:
Road waste (dust, dirt, mud …) which occurs as a result of weather conditions and the traffic
Seasonal waste (leaves, twigs …) which occur due to weather conditions or human activities and is
associated with certain seasonal variations
Random waste (empty cigarette boxes, cigarette butts, matches, tram tickets, oil residues from
vehicles …) as the result of traffic of pedestrians and vehicles and littering in general
Unusual waste which is usually bulky waste that occasionally and irresponsibly appears in the streets
after being rejected.
D2.7 – Compendium of waste management practices in pi lot cit ies and best practices in touristic cit ies
49
This waste stream and the categories are affected by seasonal variations what reflects in a nearly 400% increase
of mixed municipal waste in the summer season, like in the city of Korčula in July and August, or less – 150% in
the municipality of Mljet. The city of Dubrovnik has a seasonal increase of 50%.
4.2.4 Collection of Waste from Tourist Establishments
The waste from tourist establishments is covered by municipal waste collection. The hotels and restaurants can
also contract authorised private companies that handle specific kinds of waste and these companies can further
pass on the collected waste to specific facilities for its recovery or disposal. All the major recovery and disposal
facilities are located in other parts of Croatia while there is none in Dubrovnik Neretva County. The data that we
have available on specific waste fractions are from the Croatian Registry of Environmental Pollution of the
Croatian Environment Agency. This data is taken with caution since 2015, as these companies must report the
quantities of particular waste only when they cross the threshold of 20 tonnes of non‐hazardous waste, and 0.5
tonnes of hazardous waste in the current year. As long as they do not reach the threshold, the companies are
not required to report it.
4.2.5 Description of waste from touristic ships
Waste from cruise ships is under the responsibility of the Luka Dubrovnik d.d. company (the Port of Dubrovnik).
This company is concessionaire of the port area and the waste collection is part of the activities of the concession.
The collected waste is managed as the waste they produced. Until 2016, Luka Dubrovnik d.d. delivered the
collected waste to the official communal company of city of Dubrovnik as municipal waste. Same as all other
waste from city of Dubrovnik, these waste have been further sent to landfill Grabovica (data reported in the
Registry of Environmental Pollution). From 2016 onwards, Luka Dubrovnik began to collect waste from the cruise
ships separately and deliver it to authorized companies for certain categories of waste. The County does not have
any official data or information for now because the data on waste types and amounts are reported to the
Registry of Environmental Pollution in early 2017.

D2.7 – Compendium of waste management practices in pi lot cit ies and best practices in touristic cit ies
50
4.3 Florence (IT)
Claudia DE LUCA
4.3.1 Brief description of the URBANWASTE pilot case area
Regione Toscana is full partner in URBANWASTE, but the analysis of urban metabolism and the implementation
of the strategies will take place in the city of Florence. Florence is located in a basin surrounded by hills and
bisected by the Arno River. The historical centre contained in medieval walls gathers the most important cultural
heritage of the city. The historical centre was declared a Word Heritage Site by UNESCO in 1982.
Within an area of around 100 km², Florence counts 377.2075 inhabitants although in 2015 Florence was visited
by 9 million of tourists of which 76% were foreigners. The largest number of tourists come from the United States
of America, followed by those from the United Kingdom. However, the flow of Chinese tourists is in constant
growth. The type of tourism is mainly cultural: museums, churches and works of art are the main attractions of
the city. The Uffizi museum alone has welcomed almost 2 million visitors in 2015. The period of greatest influx
of tourist is from April to October, but there are many tourists also in other months. There are different types of
tourists who visit the city of Florence: family, individual or organized tour. The residence time varies too: there
are weekend tourists, transit tourist and visitors staying one week or more. The residence time is on average 2.5
days.
4.3.2 Description of Waste Prevention Actions
Green Public Procurement (GPP)
In order to make the GPP targets more compelling, the Tuscany Region has issued the Regional Law n. 37/2012
on "Green purchases and guidelines for sustainable purchases in the public administration. Amendments to the
Regional Law n. 38 of the 13 July 2007". The article 3bis reads as follows: In order to enhance the protection of
the environment, the Region promotes the integration of public procurement with environmental concerns and
initiatives to orient citizens and operators of the public administration towards an environmentally sustainable
behaviour, in compliance with European regulations and the national transposing law;
The same Article 3 further introduces an important provision: To promote and encourage the advancement of a
responsible behaviour towards the environment, in all cases where incentives are provided by the Region to local
authorities, for actions that envisage procurement procedures for the acquisition of works, supplies and services
involving green purchases, in the call the financing mechanism is subjected to a minimum percentage of at least
35% of green purchases.
5 ISTAT 2014 http://www.istat.it/storage/urbes2015/firenze.pdf
D2.7 – Compendium of waste management practices in pi lot cit ies and best practices in touristic cit ies
51
Eco‐labels and similar
No hotel in Florence has been awarded by the EMAS certification, while two hotels have received the Greenkey
award: The Westin Excelsior Florence, St Regis Florence.
According to the GreenLeader Program of TripAdvisor, 1 hotel received the Bronze Green Lead, while 3 hotels
received the Silver Green Lead, and other 3 the Gold Green Leave. The prevention actions most commonly
identified are:
Heating temperature set to save energy
Education for guests on green practices
Composts biodegradable products (e.g.
packaging)
Linen reuse program
Recycles
Tracks energy use
Locally produced toiletries
Water‐efficient bathroom fixtures
Staff training on green practices
ISO 14001 Certified
Efficient ventilation system
Electric car charging station
Air conditioning temperature set to save
energy
Towel reuse program
Local plants in garden
Energy saving guest room controls
Energy‐efficient lightbulbs
Efficient laundry dryers
Composts food waste
Toiletries w/ recycled packaging
Composts biodegradable products (e.g.
packaging)
Further waste prevention actions
Further improvements have been made in national legislation, and in particular with the so‐called environmental
provision attached to the stability law for the year 2016 (L.221 / 2015) on "Environmental conditions to promote
green economy measures and for the limitation of the excessive use of natural resources".
The Tuscany Region has financially supported projects for the reduction and prevention (of waste production).
In particular, from 2007 to 2010, 221 projects have been selected for funding, being distributed as follows:
106 for the construction of 220 fountains and providers of high quality water;
52 related to the distribution of 20,000 domestic composters;
23 to 30 interventions in school canteens and 10 eco festival;
15 for the construction of eco‐centres (centres for the reparation, exchange and distribution of unsold
material)
25 for other reduction interventions (communication, environmental education, reducing paper in
public offices);
Dedicated resources amounted to approx. 7.5 million Euros.
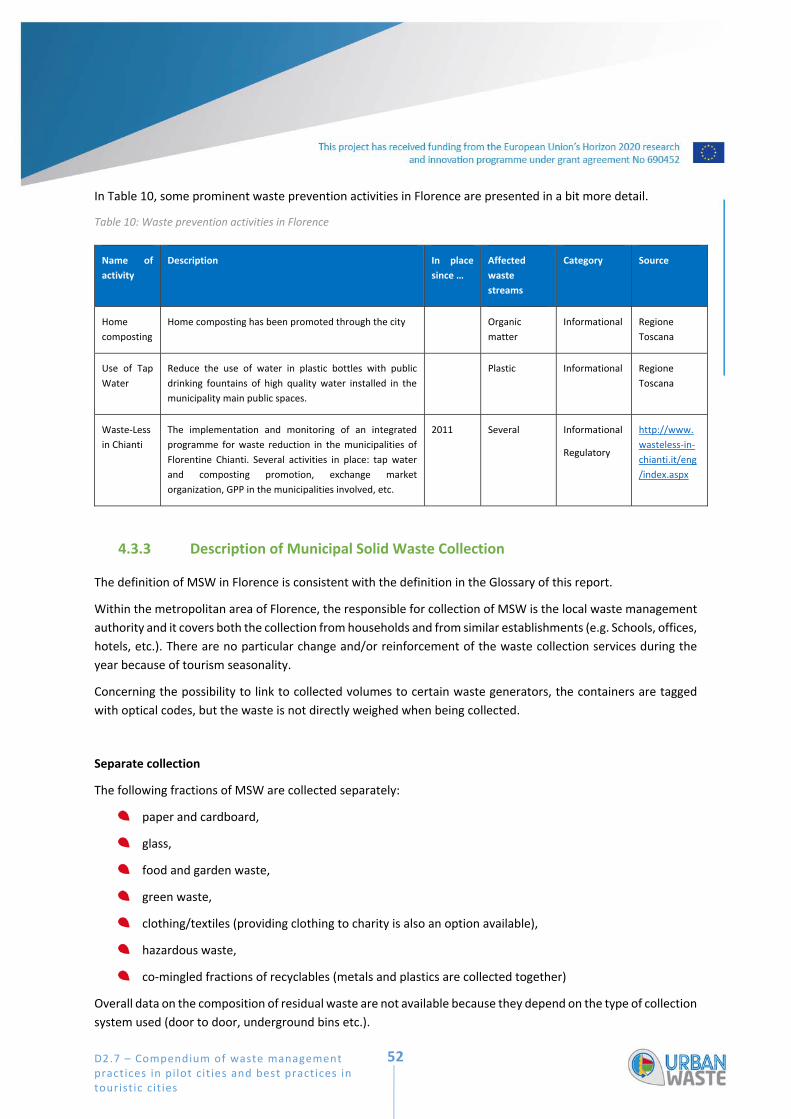
D2.7 – Compendium of waste management practices in pi lot cit ies and best practices in touristic cit ies
52
In Table 10, some prominent waste prevention activities in Florence are presented in a bit more detail.
Table 10: Waste prevention activities in Florence
Name of
activity
Description In place
since …
Affected
waste
streams
Category Source
Home
composting
Home composting has been promoted through the city Organic
matter
Informational Regione
Toscana
Use of Tap
Water
Reduce the use of water in plastic bottles with public
drinking fountains of high quality water installed in the
municipality main public spaces.
Plastic Informational Regione
Toscana
Waste‐Less
in Chianti
The implementation and monitoring of an integrated
programme for waste reduction in the municipalities of
Florentine Chianti. Several activities in place: tap water
and composting promotion, exchange market
organization, GPP in the municipalities involved, etc.
2011 Several Informational
Regulatory
http://www.
wasteless‐in‐
chianti.it/eng
/index.aspx
4.3.3 Description of Municipal Solid Waste Collection
The definition of MSW in Florence is consistent with the definition in the Glossary of this report.
Within the metropolitan area of Florence, the responsible for collection of MSW is the local waste management
authority and it covers both the collection from households and from similar establishments (e.g. Schools, offices,
hotels, etc.). There are no particular change and/or reinforcement of the waste collection services during the
year because of tourism seasonality.
Concerning the possibility to link to collected volumes to certain waste generators, the containers are tagged
with optical codes, but the waste is not directly weighed when being collected.
Separate collection
The following fractions of MSW are collected separately:
paper and cardboard,
glass,
food and garden waste,
green waste,
clothing/textiles (providing clothing to charity is also an option available),
hazardous waste,
co‐mingled fractions of recyclables (metals and plastics are collected together)
Overall data on the composition of residual waste are not available because they depend on the type of collection
system used (door to door, underground bins etc.).

D2.7 – Compendium of waste management practices in pi lot cit ies and best practices in touristic cit ies
53
Paper, organic, multi‐material and unsorted waste are collected through:
Underground bins (historical centre)
Up loader with volumetric access control (urbanized area)
Door to door/proximity (urban area with low density)
Bulky and Green waste are collected through:
Collection centre
Service on demand
WEEE, expired drugs and batteries are collected through:
Collection centre
Eco‐van (an equipped vehicle)
Waste Treatment
Figure 2: Urban waste collection, storage and treatment in Florence
Figure 2 considers the collection, selection‐storage and treatment systems and responsibility of the waste
management system in Florence, while Figure 3 is better explaining how the different materials are treated. As
one can see, most of the materials are following 4 different pathways:
energy recovery (mostly in relation to light multi‐material and non‐recyclable plastics)
recycling (paper, glass, and plastic)
composting and anaerobic treatment (organic matter)
landfill
Urban waste and similar
Collection
•Road collection;
•Door to door;
•Eco‐stations, Collection Centers;
•Eco‐tappe – Eco‐van;
•Micro‐ collection;
•Collection call.
Selection ‐ Storage –pre‐treatment
•Treatment and transfer pole
•TMB (mechanical biological treatment)
•third‐party plants.
Recovery – Treatment
RAEE: Co‐ordination Centre
Wood: Supply Chain Consortium RILEGNO, Ferrous Materials: Recovery of matter
Multi‐material: REVET SPA, Sector Consortia: COREPLA, CNA, CIAL, Coreve
Biodegradable: Composting Plant
Textiles: material recovery and reuse
Paper and cardboard: Supply Chain Consortium COMIECO
RUP: Consortia Filiera, COBAT.
C & D waste: treatment plants
Print Cartridges: 3 Recovery
Vegetable Oil: Recovery of Matter / cogeneration
Mixed packaging and plastic packaging: Recovery of matter ‐ energy recovery.
UW: landfill
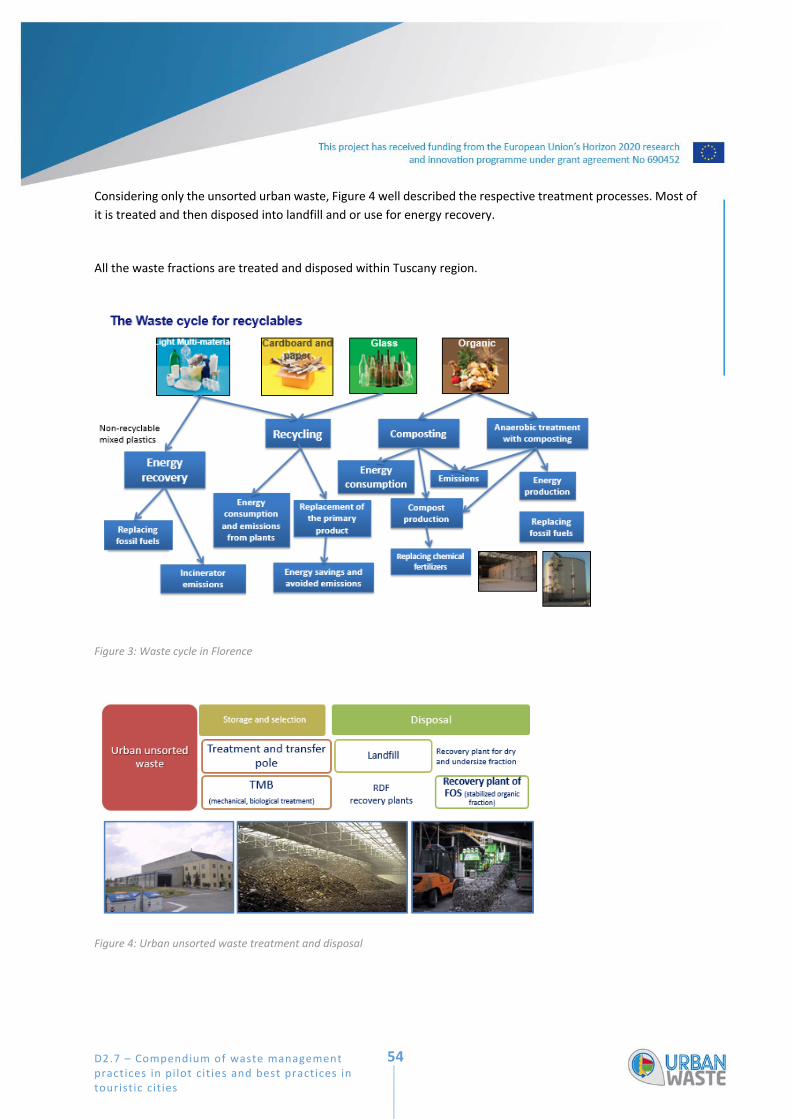
D2.7 – Compendium of waste management practices in pi lot cit ies and best practices in touristic cit ies
54
Considering only the unsorted urban waste, Figure 4 well described the respective treatment processes. Most of
it is treated and then disposed into landfill and or use for energy recovery.
All the waste fractions are treated and disposed within Tuscany region.
Figure 3: Waste cycle in Florence
Figure 4: Urban unsorted waste treatment and disposal

D2.7 – Compendium of waste management practices in pi lot cit ies and best practices in touristic cit ies
55
Street sweeping waste
In Florence, the definition of “street sweeping waste” is coherent with the definition provided in the Glossary of
this report. “Street sweeping waste” consist of:
waste that accumulates from street sweeping and
the contents of public waste bins.
The responsibility to collect this waste is also upon the local waste management authority and no significant
seasonal variation in composition of this waste is visible in Florence.
4.3.4 Collection of Waste from Tourist Establishments
The municipal waste collection system explained previously also includes the collection of waste from tourist
establishments.
4.3.1 Description of waste from touristic ships
Florence is not a coastal city and the pilot case therefore has no port or waste from tourist ships.

D2.7 – Compendium of waste management practices in pi lot cit ies and best practices in touristic cit ies
56
4.4 Kavala (GR)
Marie KAZERONI
4.4.1 Brief description of the URBANWASTE pilot case area
Kavala as a metropolitan area has 70 501 inhabitants6 and its area is 350,61 km².
Kavala is the principal seaport of eastern Macedonia, and is well connected to other main touristic destinations
of the northern‐east part of Greece, since it combines an airport and a port, and is also easy to reach by car
because of the connection to “Egnatia” highway. Kavala aims to enhance tourism and become a main touristic
destination for tourists of Eastern Europe. The type of tourists who visit Kavala are either business tourists, transit
tourists travelling through Kavala’s port, family tourists and cultural tourists, for weekend stays or longer stays.
The tourism in Kavala is a seasonal tourism limited to the summer period, the high season being between May
and September. It contributes significantly to the income of the local population.
The municipality of Kavala is currently and gradually shifting its waste management practices to new practices
stated in the recently approved “Regional solid waste management plan”, so the practices described below might
change in a short future.
4.4.2 Description of Waste Prevention Actions
The only waste prevention action in Kavala is home composting, as detailed in Table 11.
Table 11: Waste prevention activities in Kavala
Name of activity Description In place
since …
Affected
waste
streams
Category Source
Domestic
composting
Collective composters have been allocated
in some of the residences in Kavala
December
2014
Organic
waste
Infrastructural Survey on data availability
4.4.3 Description of Municipal Solid Waste Collection
Definition of municipal solid waste (MSW)
The municipal solid waste is defined by the pilot case Kavala in the same way as presented in the Glossary of this
report, that is to say all types of solid waste collected by municipalities or on behalf of them, including waste
originating from households and similar establishments.
Responsibility for the collection of MSW and organization of the waste collection
6 Data from 2011

D2.7 – Compendium of waste management practices in pi lot cit ies and best practices in touristic cit ies
57
Only the municipal authority is responsible for the collection of MSW and owns part of the equipment for
collection and transfer of wastes. The Waste Management Authority (DIAAMATH) provides part of the
equipment necessary for the collection and transfer of the waste streams to the collection centres.
The municipal waste collection covers waste from households and similar establishments. All waste streams are
collected by the municipality, except hazardous waste which is collected by private actors.
Changes of waste collection services during the year
There is a change in waste collection services during the year because of tourism. From May to September, which
corresponds to the highest touristic period in Kavala, there is an increase of the number of employees and of the
trucks schedule for waste collection.
Identification of the bins
All the bins have an ID number and GIS coordinates so they can be linked to a specific location. The waste is not
directly weighted on site when collected, thus, the mass of waste produced cannot be linked to specific waste
generators.
Collection systems used for the different types of waste fractions
The current waste management practices include separate collection for paper, cardboard, glass, metal (steel
and aluminium packages), and plastic. They are sorted at source.
Paper, cardboard, metal and plastic are collected as one recyclable stream in blue bins.
Glass is collected in the red glass bin. Besides, there is a dense network of glass bring banks in the
municipality (bell containers), and are particularly strengthened in the areas of the municipality that
have a strong presence of restaurant and bars.
At residence level, food and garden waste is collected in brown bins.
All the other waste streams are collected in green bins, which correspond to the residual municipal
waste.
There is no door to door collection in Kavala but only collection points: the green bins and blue bins consist in
containers located on the streets. However, the collection points are bins that are situated at every
neighbourhood and the city has numerous collection points. This not a classical door‐to‐door collection system
though.
“Bring it yourself” systems are also available for bulky waste, batteries, electronic waste, tires, motor oils and car
batteries, waste cooking oil:
Small electrical and electronic equipment (WEEE) are collected in special bins in schools and public
services’ buildings. WEEE can also be collected in the garage of the Municipality, being is led there by
the producers or the cleaning department.
There are specific bins in some neighbourhoods of Kavala where waste cooking oil is collected.
There are 8 specific large containers for people to depose their bulky waste.
Other options available for certain types of waste
Clothing can also be given to charities that are from private or community initiatives.
Composition of residual waste

D2.7 – Compendium of waste management practices in pi lot cit ies and best practices in touristic cit ies
58
The average qualitative composition of the municipal solid waste in the prefecture of Kavala in presented in
Table 12:
Table 12: Average composition of the MWS in Kavala in 2008
WASTE STREAM PERCENTAGE
Organic food waste
with waste > 40 mm
and waste < 40 mm
43,61%
24,13%
19,48%
Paper ‐ Cardboard 13,26%
Plastic 18%
Metal 2,42%
Glass 5,98%
Textiles – Rubber – Leather – Wood 6,11%
Toilet napkins 6,06%
Dirt‐ash 3,68%
Hazardous waste 0,45%
Other waste 0,44%
TOTAL 100.0%
Waste treatment
Treatment of residual waste
The residual waste is landfilled in Kavala landfill unit which is located 10 km away from the city of Kavala.
Treatment of separately collected waste fractions
The recyclable waste fractions are collected in the same bin (Paper, cardboard, metal and plastic). This waste
stream is separated with magnetic separation and human separation in order to sort out the recyclable fractions.
The recyclable fractions are either directly recycled or sold for recycling, out of Kavala, in a different region
(Thessaloniki or Serres).
Glass is transferred to private actors in charge of the recycling. This stream is exported out of Kavala since it is
recycled in Larissa (a different region).
Street sweeping waste
Street sweeping waste is understood as the waste accumulated from street sweeping, together with the content
of public street bins and litter. There is bigger amount of litter during the summer due to the tourists’ presence.
The Municipality of Kavala is responsible for street bins and street sweeping.

D2.7 – Compendium of waste management practices in pi lot cit ies and best practices in touristic cit ies
59
4.4.4 Collection of Waste from Tourist Establishments
The collection of the waste from tourist establishments is done by the Municipality of Kavala as these
establishments are considered as “similar establishments” and the waste collection operated by the municipality
concerns both households and similar establishments.
4.4.5 Description of waste from touristic ships
In 2015, there were 139 647 tourists in Kavala, with 8.7% of them arriving by ship (12 915). Waste from touristic
ships is managed by a private subcontractor of the Port of Kavala. The private subcontractor collects waste as a
single waste stream and transfers it to Kavala landfill.
D2.7 – Compendium of waste management practices in pi lot cit ies and best practices in touristic cit ies
60
4.5 Lisbon (PT)
Arie ROMEIN
4.5.1 Brief description of the URBANWASTE pilot case area
Made a ‘municipium’ by Julius Caesar, Lisbon is one of the oldest cities in Western Europe. After the reconquest
from the Moors by crusaders in 1147 the city has developed as the major political, economic and cultural centre
of Portugal7. As the country’s capital city, it is the seat of Government and the residence of the Head of State.
The municipality of Lisbon is part of a larger Metropolitan Area (MA), a type of administrative entity in Portugal.
Next to Lisbon, there is one other MA, Porto. Both were created as such in 1991. In 2004, the Lisbon Great
Metropolitan Area (LGMA) was assigned the status of a public collective person of associative nature. It is a union
that is composed of 18 municipalities, one of which is Lisbon itself, with a territorial scope that aims to reach
their common public interests. Its territory is almost the same as the NUTS II Lisbon Region.
LGMA is the largest population concentration in Portugal. It houses 26.7% of the national population on 3.3% of
the country’s territory, i.e. 2 821 876 people on 3015.24 km². The 18 municipalities of LGMA are geographically
divided into two clusters of nine each, separated by the Tagus River. North of the river they form the Lisbon
District and south of the river the Setúbal District. Lisbon District is the smallest of the two in surface (46%) but
the largest in population (72% in 2011). This difference is mainly explained by the population densities of some
municipality of the Lisbon District that are the highest in the LGMA: 19.4% of LGMA’s inhabitants live in Lisbon
municipality on 3.3% of its territory. These figures raise to 30.7% and 4.9% if we add the two adjacent ones
Amadora and Odivelas to it8.
The administrative structure of LGMA is composed by three organs:
Assembleia Metropolitana (Metropolitan Assembly): legislative organ, composed by the chosen
representatives in the Municipal Assembly of the City Halls, in odd number, over the triple of the
number of the towns that it integrates, in a maximum of 55.
Junta Metropolitana (Metropolitan Board): executive organ, composed by the presidents of the 18
‘municipal chambers’.
Conselho Metropolitano (Metroplitan Council): the consultative organ composed by representatives of
the State and by the members of the Junta Metropolitana.
Besides the political capital and major demographic concentration, LGMA is also Portugal’s major economic
centre of gravity. This metropolitan area is called a global city because of its importance in finance, commerce,
media, entertainment, arts, international trade, education and tourism. Most of the headquarters of
multinationals in the country are located in the Lisbon area9. Its active population of about 1.3 million people
holds 32.7% of the national employment and produces over 36% of the country’s GDP (2011). Both this
contribution to the national GDP and its GDP per capita are highest of all Portuguese regions.
As to tourism, the historic scenery and soulful atmosphere of Lisbon, most in particular in Lisbon municipality as
its historic centre, made the city with 1,740,000 tourists the 7th‐most‐visited one in Southern Europe ‐ after
7 https://www.goepic.pt/st_location/lisbon/ 8 http://www.wow.com/wiki/Lisbon_Metropolitan_Area 9 https://en.wikipedia.org/wiki/Lisbon

D2.7 – Compendium of waste management practices in pi lot cit ies and best practices in touristic cit ies
61
Istanbul, Rome, Barcelona, Madrid, Athens and Milan ‐ in 200910. Six years later, in 2015, its growth rate for
foreign visitors was the fourth highest in Europe, resulting in an estimated 3.56 million foreign visitors spending
€1.620 billion11. Data about numbers of guests of ‘Local Accommodations’ like B&B and Airbnb in the city of
Lisbon is available for 2013 and 2014 only, but it is not clear if their numbers are included in the overall statistics
on tourism. Regarding all these data, it should be taken into account that Lisbon has a clear seasonal variation in
tourism, with May and August to October as months of high season.
4.5.2 Description of Waste Prevention Actions
Several waste prevention actions are being implemented in the URBANWASTE pilot case of Lisbon, for example:
Repair and reuse of second‐hand goods for charity (action done with some partners such AMI).
Project "RE‐FOOD": is a 100% voluntary, solidarity‐based project aimed at re‐seizing food surpluses and
re‐feeding those who need it most. The mission is to eliminate food waste and end hunger at the level
of each neighbourhood, including in this effort community members. Started on March 9th, 2011
(http://www.re‐food.org/pt).
Project "Ugly Fruit": The aim is to combat the waste of more than 30% of the fruit produced in Portugal
rejected by the aspect, despite being tasty and having food quality, creating a market for the so‐called
"ugly fruit" (http://frutafeia.pt/pt).
"The Food Bank against hunger" is an initiative of the "Portuguese Federation of Food Banks Against
Hunger", which aims to fight against waste, recovering food surpluses, to lead to those who have food
shortages, mobilizing people and companies, which on a voluntary basis, associated with this cause
(http://www.bancoalimentar.pt/).
"European Week of Waste Prevention": Annually, in November, a "Waste Prevention Week" is
celebrated, with a series of actions addressing this theme. Every year, a theme is proposed for the week:
in 2013 it was "Reuse"; in 2014 "Food waste"; in 2015 is "Dematerialization" / "Day without purchases"
and in 2016 was "Packaging waste reduction". (http://www.ewwr.eu/).
Further information related with to waste prevention actions can be found on the website of Lisbon Municipality
(http://www.cm‐lisboa.pt/viver/higiene‐urbana/prevencao‐de‐residuos/iniciativas‐e‐campanhas).
As regards statements or voluntary agreements to reduce waste, Lisbon received the European Green Capital
Award after adopting a door‐to‐door waste collection scheme. According to the website of the Interreg IVC
project R4R (Regions for Recycling)12, “[T]he city has become a national example and benchmark in selective and
mixed collection […] The municipality’s selective collection rate of 33% is, however, still far from the overall
national target of 55% by 2020”. However, no information on such statements or voluntary agreements specific
for the tourist industry of hotels, restaurants and other facilities has been provided, other than “the statements
are defined by the EU Commission”.
10 https://www.goepic.pt/st_location/lisbon/ 11 http://www.algarvedaily news.com /news/5794‐lisbon‐many‐more‐tourists‐but‐nobody‐knows‐what‐they‐are‐doing 12 http://www.regions4recycling.eu/pertners/Lisbon_City_Council

D2.7 – Compendium of waste management practices in pi lot cit ies and best practices in touristic cit ies
62
4.5.3 Description of Municipal Solid Waste Collection
The area of Lisbon as URBANWASTE pilot case is the Lisbon municipality, governed by the Lisbon City Council.
Nevertheless, its embeddedness in the LGMA is reflected by some data, for instance the data provided by ‘Lisbon
Tourism’ for the whole of the metropolitan area. Further, the main company that is responsible for collection,
transporting and treating of municipal waste, VALORSUL, has the entire northern half of the LGMA as its service
area.
In 2014, the municipality of Lisbon generated a total of 291,704 tonnes of waste. Per capita this was 564 kg, an
amount above the EU and Portuguese figures (see section 3.3). The municipality itself (Lisbon City Council) is
responsible by law (of September 1997) for the collection of municipal waste in its own area, with the exception
of clothing and textiles, and for the transportation to waste treatment and recovery centres. That includes waste
produced by households, by so‐called similar establishments like schools, offices, public institutions, tourist
establishments like hotels, and businesses more in general with a maximum production of 1,100 litres a day.
Furthermore, the municipality is also responsible for emptying street bins and street sweeping.
Besides the legal responsibility of the municipality, there are some private companies operating waste collection
for specific types of waste. This includes, for example, construction and demolition waste: The Lisbon City Council
is responsible for the collection of construction and demolition waste up to 1 m3, but for larger amounts the
producer can choose to pay the City Council for collection or to settle a contract with a private collection
company. Collection from major waste generators, i.e. businesses that generate more than 1,100 litres a day like
supermarkets, is also being done by private companies and collection in the area Parque das Nações (Park of the
Nations) takes place by pneumatic or vacuum technology. This is being done by the Swedish company ENVAC,
the global leader in vacuum waste collection industry according to its own website.
In November 1994, the company VALORSUL was created for treatment of municipal waste of North Lisbon
Metropolitan Area. VALORSUL is responsible to carry out conception, construction and management of all the
necessary installations to recover or disposal municipal waste produced. According to its website, VALORSUL
‘valorises’ more than one fifth of domestic waste produced in Portugal. The municipality is paid by VALORSUL
according to the amount of some separately collected (!) municipal waste fractions (paper and cardboard, glass
and packages) delivered to its waste treatment and recovery centres.
The major systems for separate waste collection in Lisbon are door‐to‐door collection (introduced in 2003) and
to types of bring‐in systems ‐ bring collection points and civic amenity sites or household waste recycling centres.
In addition, underground containers are located across the city and public space facilities are operational. The
containers are not tagged with e.g. a chip or optical code to define their availability to users (customers) in a
specific location or specific types of customers.
Most large fractions of waste that are separated are collected by means of various systems (Table 13). Paper and
cardboard, packages (metals and plastics are collected together) and glass are collected by four different
systems: door‐to‐door, bring‐to collection points, civic amenity sites and underground containers. For both paper
and cardboard as well as packages, the major system used was (in 2015) still the bring‐to collection points, but
this is being substituted gradually by door‐to‐door collection. Door‐to‐door collection of both glass and food
waste is only available for businesses, so households depend for glass on bring‐to collection points, civic amenity
sites and underground containers while they can bring organic waste only to certain civic amenity site. Smaller
fractions of clothing, textiles, cooking oils and hazardous waste are only collected by one specific system. i.e.
either public space facilities or certain civic amenity sites.

D2.7 – Compendium of waste management practices in pi lot cit ies and best practices in touristic cit ies
63
The food waste collections have specific routes in the catering sector, namely restaurants, hotels, canteens,
markets and other food retail and the final destination is for anaerobic digestion. The brown food waste bins are
locked to avoid contamination with waste from other producers. Attending local context and climate, this waste
collection is performed six times a week to avoid unpleasant smells.
The collection by request allows the collection of certain types of waste that cannot be collected by the
conventional ways. It enables also the differentiated treatment and valorisation of a waste fraction, instead of
being mixed in the residual waste collection or dumped away in the streets. This collection system helped to
increase the percentage of selectively collected waste. It is a widely spread and a frequent/daily service in the
Municipality of Lisbon, which involves more than 90 requests per day. This service must be done within a period
of 24 hours and is certified by quality standards (ISO 9000). The municipality offers a high density net of a bring
bank system to collect glass packages, mainly with green igloo bins.
In addition, other options are available to households like donating clothing to charities or collection boxes for
certain types of waste like batteries or worn shoes at retailer establishments. Unfortunately, specific data about
these alternatives is still missing.
Table 13: Lisbon: Waste collection system by fraction (Lisbon Municipality)
Fraction Collection system
Paper and cardboard ‐ door‐to‐door collection system
‐ bring bank system / bring collection points13
‐ civic amenity sites
‐ underground containers
Package ‐ door‐to‐door collection system
‐ bring collection point
‐ civic amenity sites
‐ underground containers
Glass ‐ door‐to‐door collection; only restaurants and bars
‐ bring collection points
‐ civic amenity sites
‐ underground containers
Organic (food waste / bio‐waste) ‐ door‐to‐door collection; only restaurants and bars
‐ can be delivered to certain civic amenity sites
clothing/textiles ‐ public spaces facilities
cooking oils ‐ public spaces facilities
hazardous waste. ‐ civic amenity site
13 The EC Capital Factsheet on separate collection (2015) speaks of Bring collection points, the City Council as URBANWASTE partner of Bring bank. The author considers these synonyms.

D2.7 – Compendium of waste management practices in pi lot cit ies and best practices in touristic cit ies
64
Table 14 presents some features of three of the major collection systems that are operational in Lisbon. As can
already be seen in Table 13, each system collects various fractions of separated waste. Paper and cardboard,
glass, as well as plastic and metal packages, actually, are collected by all three different types of collection
systems. Organic waste is only collected by door‐to‐door collection and batteries can be brought to collection
points. The door‐to‐door collection system of glass and organic waste is only available for businesses, usually the
tourist facilities of hotels and restaurants. Furthermore, for fractions that are collected door‐to‐door from both
households and businesses, businesses are served more frequently than households.
Table 14: Features of the door‐to‐door, bring collection points and civic amenity site separation systems (EC – Capital factsheet on separate collection14)
Door‐to‐door Bring collection points Bring‐in civic amenity sites
Fractions collected:
Paper & cardboard
Glass (only bu)
Packaging
Organic waste (only bu)
Fractions collected:
Paper & cardboard
Glass
Packaging
Batteries
Fractions collected:
Paper & cardboard
Glass
Packaging
Frequency:
Paper & cardboard 1 d/w* (hh)
1‐5/w (bu)
Glass 1‐3 d/w (bu)
Packages 1‐2d/w (hh)
1‐2d/w (bu)
Organic waste 6‐7d/w (bu)
Number of collection points#
All major fractions 303
Not all fractions 148
Glass only 878
Number of sites
28
Collected quantities (kg/cap/yr)
Paper & cardboard: 19.54
Glass: 1.82
Packages: 11.48
Organic waste: 0.47
Residual waste: 254.65
Collected quantities (kg/cap/yr)
Paper & cardboard: 4.54
Glass: 15.32
Packages: 3.30
Organic waste: PM
Residual waste: 0.01
Collected quantities (kg/cap/yr)
Paper & cardboard: 4.98
Glass: 1.61
Packages: 2.28
Source of funding
Municipal tax and waste budget
Tax based on water consumption: 0.17€/m3
(hh), 0.80€/m3 (bu)
Source of funding
Municipal tax and waste budget
Source of funding
Municipal tax and waste budget
Cost to consumer
Indirect via water bill
Cost to consumer
Free
Cost to consumer
Free
bu businesses
hh households
* days per week
# 2015
14 Retrieved January 2017 from http://www.municipalwasteeurope.eu/sites/default/files/PT%20Lisbon%20Capital% 20factsheet.pdf
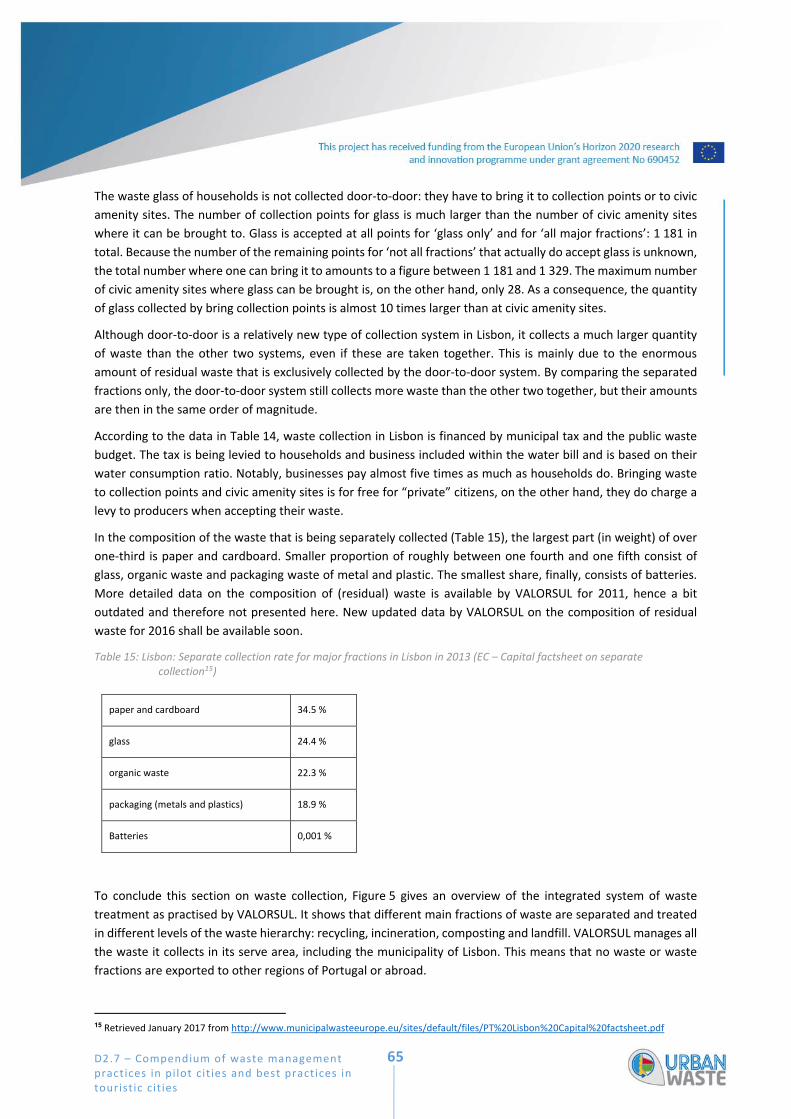
D2.7 – Compendium of waste management practices in pi lot cit ies and best practices in touristic cit ies
65
The waste glass of households is not collected door‐to‐door: they have to bring it to collection points or to civic
amenity sites. The number of collection points for glass is much larger than the number of civic amenity sites
where it can be brought to. Glass is accepted at all points for ‘glass only’ and for ‘all major fractions’: 1 181 in
total. Because the number of the remaining points for ‘not all fractions’ that actually do accept glass is unknown,
the total number where one can bring it to amounts to a figure between 1 181 and 1 329. The maximum number
of civic amenity sites where glass can be brought is, on the other hand, only 28. As a consequence, the quantity
of glass collected by bring collection points is almost 10 times larger than at civic amenity sites.
Although door‐to‐door is a relatively new type of collection system in Lisbon, it collects a much larger quantity
of waste than the other two systems, even if these are taken together. This is mainly due to the enormous
amount of residual waste that is exclusively collected by the door‐to‐door system. By comparing the separated
fractions only, the door‐to‐door system still collects more waste than the other two together, but their amounts
are then in the same order of magnitude.
According to the data in Table 14, waste collection in Lisbon is financed by municipal tax and the public waste
budget. The tax is being levied to households and business included within the water bill and is based on their
water consumption ratio. Notably, businesses pay almost five times as much as households do. Bringing waste
to collection points and civic amenity sites is for free for “private” citizens, on the other hand, they do charge a
levy to producers when accepting their waste.
In the composition of the waste that is being separately collected (Table 15), the largest part (in weight) of over
one‐third is paper and cardboard. Smaller proportion of roughly between one fourth and one fifth consist of
glass, organic waste and packaging waste of metal and plastic. The smallest share, finally, consists of batteries.
More detailed data on the composition of (residual) waste is available by VALORSUL for 2011, hence a bit
outdated and therefore not presented here. New updated data by VALORSUL on the composition of residual
waste for 2016 shall be available soon.
Table 15: Lisbon: Separate collection rate for major fractions in Lisbon in 2013 (EC – Capital factsheet on separate collection15)
paper and cardboard 34.5 %
glass 24.4 %
organic waste 22.3 %
packaging (metals and plastics) 18.9 %
Batteries 0,001 %
To conclude this section on waste collection, Figure 5 gives an overview of the integrated system of waste
treatment as practised by VALORSUL. It shows that different main fractions of waste are separated and treated
in different levels of the waste hierarchy: recycling, incineration, composting and landfill. VALORSUL manages all
the waste it collects in its serve area, including the municipality of Lisbon. This means that no waste or waste
fractions are exported to other regions of Portugal or abroad.
15 Retrieved January 2017 from http://www.municipalwasteeurope.eu/sites/default/files/PT%20Lisbon%20Capital%20factsheet.pdf

D2.7 – Compendium of waste management practices in pi lot cit ies and best practices in touristic cit ies
66
Figure 5: The waste treatment scheme of VALORSUL (VALORSUL)
4.5.4 Collection of Waste from Tourist Establishments
The collection of waste from tourist establishments is covered by the municipal waste collection systems.
Actually, the door‐to‐door collection system of glass and organic waste is only available for businesses, including
tourist facilities like hotels and restaurants as major producers of these waste fractions. However, collection from
businesses that generate more than 1 100 litres (1.1 m3) a day is also being done by private companies. These
major waste generators include for instance hypermarkets but also the largest among tourist venues like hotels
and restaurants.
The separation of the sub‐stream of municipal waste collected from tourist establishments is part of the general
‘separation regime’, i.e. it is about the same major fractions. These are paper and cardboard; glass; metal and
plastic packages; organic waste, including food; clothing and textiles; hazardous waste and used cooking oils. By
far most of these fractions are collected from tourist establishments are collected by the door‐to‐door system,
and treated by the company VALORSUL. The waste collection service does not change according to the seasonal
fluctuations of touristic flows during the year.

D2.7 – Compendium of waste management practices in pi lot cit ies and best practices in touristic cit ies
67
4.5.5 Description of waste from touristic ships
Waste produced on board of touristic ships is not included in the municipal waste figures. Actually, this waste is
not considered municipal waste because these ships do not dispose into the municipal waste system. Hence,
data on its amount and composition is not available.
The port of Lisbon receives all types of cruise ships, from the smallest to the largest in the world, that bring more
than 400 000 passengers per year to the city16, but it is unknown how many of these leave the ships to spend
some time in Lisbon. Lisbon City Council defines cruise passengers as visitors rather than tourists because they
do not sleep in the city. The contribution of cruise passengers to municipal waste generation is unknown.
The contribution to municipal waste generation by passengers that embarked or disembarked in Lisbon is
unknown as well: However, their number was 42 536 in 2015, almost negligible compared to the estimated 3.56
million tourists and the almost 550 000 inhabitants that produce waste almost all year round.
16 http://www.portodelisboa.pt/ portal/page/portal/PORTAL_PORTO_LISBOA_ING/CRUZEIROS
D2.7 – Compendium of waste management practices in pi lot cit ies and best practices in touristic cit ies
68
4.6 Nice (FR)
Marie KAZERONI
4.6.1 Brief description of the URBANWASTE pilot case Métropole Nice Côte d’Azur
The pilot case is the French Metropole “Nice Côte d’Azur” (MNCA) which is composed by 49 municipalities. Its
total population is 2014 was 537 769 inhabitants, on a territory representing over 1 400km². The Metropole has
several touristic attractions including costal municipalities (located between Cagnes‐sur‐Mer and the Cap d’Ail),
mountain stations around the Mercantour natural park (Isola 2000, Auron, Saint‐Dalmas‐le‐Selvage). The tourism
is a very important sector for the economy of the Metropole has it represents 30% of the Metropole’s wealth
and 13% of the employment. Besides, Business tourism is also important thanks to the “business friendly” style
of the Metropole.
4.6.2 Description of Waste Prevention Actions
Table 16 presents the main waste prevention actions implemented on the territory of the Metropole Nice Côte d’Azur, either by the metropole itself, or by other actors. Some of these actions are no longer implemented, other actions are still ongoing or being developed.
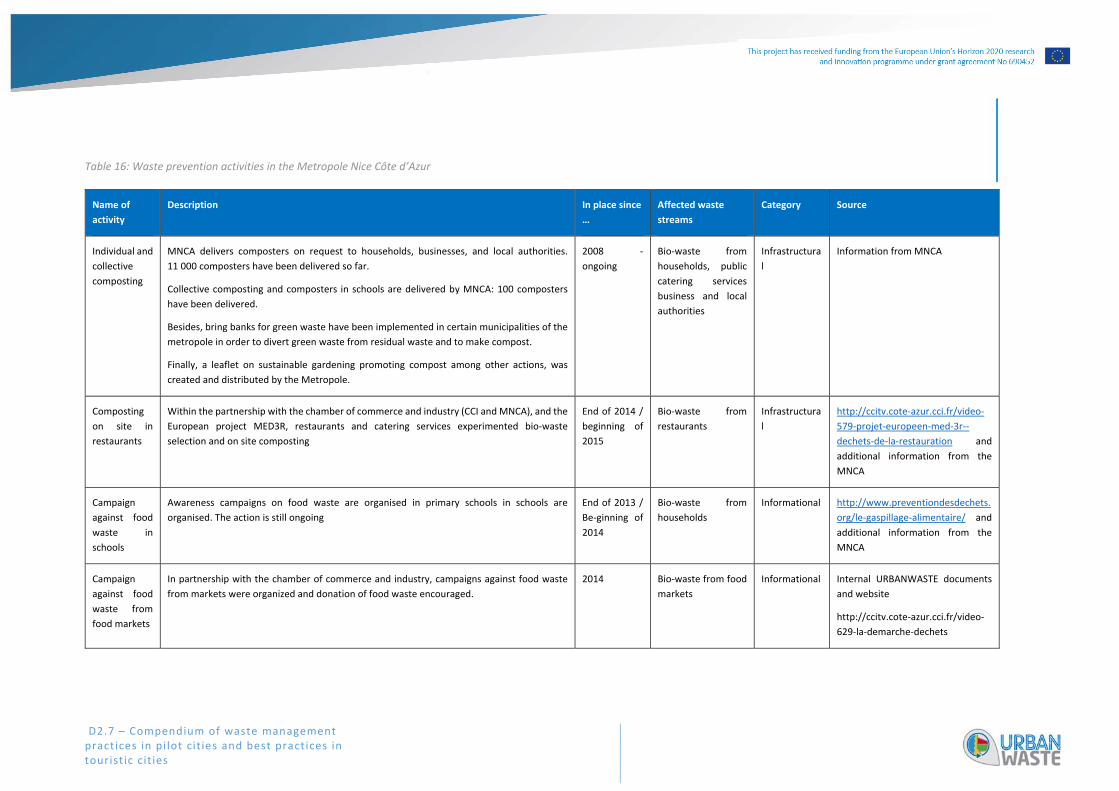
D2.7 – Compendium of waste management practices in pi lot cit ies and best practices in touristic cit ies
Table 16: Waste prevention activities in the Metropole Nice Côte d’Azur
Name of
activity
Description In place since
…
Affected waste
streams
Category Source
Individual and
collective
composting
MNCA delivers composters on request to households, businesses, and local authorities.
11 000 composters have been delivered so far.
Collective composting and composters in schools are delivered by MNCA: 100 composters
have been delivered.
Besides, bring banks for green waste have been implemented in certain municipalities of the
metropole in order to divert green waste from residual waste and to make compost.
Finally, a leaflet on sustainable gardening promoting compost among other actions, was
created and distributed by the Metropole.
2008 ‐
ongoing
Bio‐waste from
households, public
catering services
business and local
authorities
Infrastructura
l
Information from MNCA
Composting
on site in
restaurants
Within the partnership with the chamber of commerce and industry (CCI and MNCA), and the
European project MED3R, restaurants and catering services experimented bio‐waste
selection and on site composting
End of 2014 /
beginning of
2015
Bio‐waste from
restaurants
Infrastructura
l
http://ccitv.cote‐azur.cci.fr/video‐
579‐projet‐europeen‐med‐3r‐‐
dechets‐de‐la‐restauration and
additional information from the
MNCA
Campaign
against food
waste in
schools
Awareness campaigns on food waste are organised in primary schools in schools are
organised. The action is still ongoing
End of 2013 /
Be‐ginning of
2014
Bio‐waste from
households
Informational http://www.preventiondesdechets.
org/le‐gaspillage‐alimentaire/ and
additional information from the
MNCA
Campaign
against food
waste from
food markets
In partnership with the chamber of commerce and industry, campaigns against food waste
from markets were organized and donation of food waste encouraged.
2014
Bio‐waste from food
markets
Informational Internal URBANWASTE documents
and website
http://ccitv.cote‐azur.cci.fr/video‐
629‐la‐demarche‐dechets
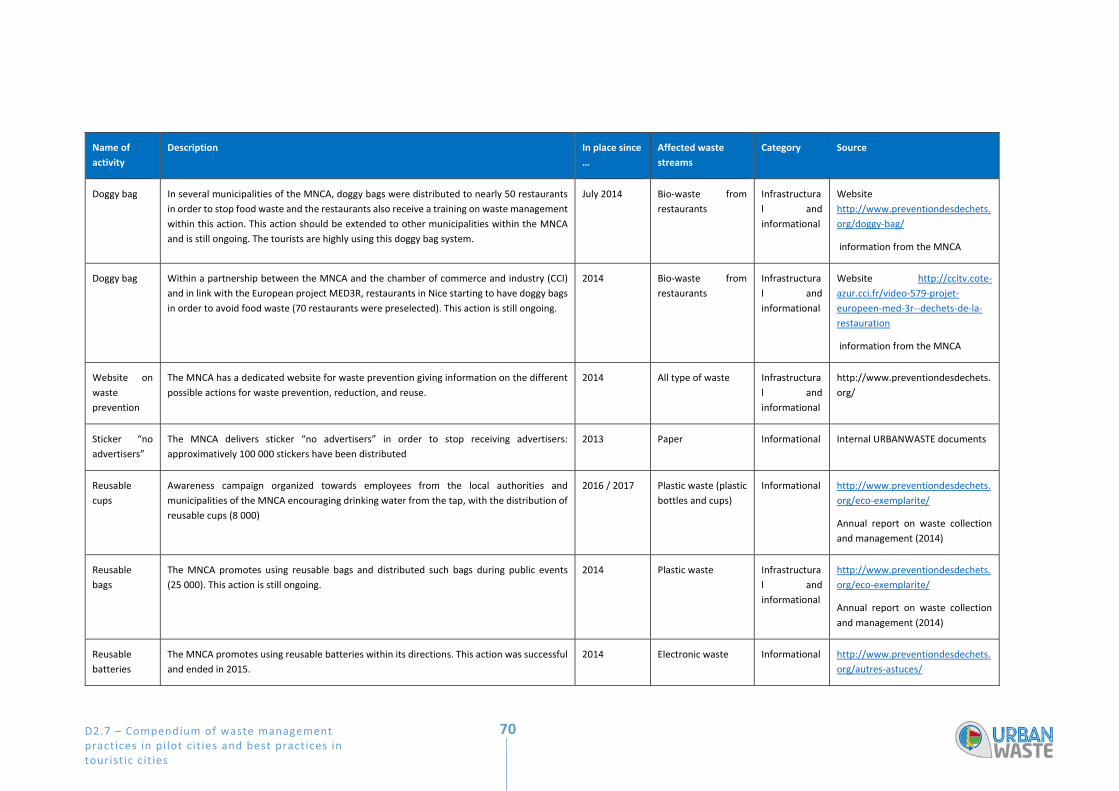
D2.7 – Compendium of waste management practices in pi lot cit ies and best practices in touristic cit ies
70
Name of
activity
Description In place since
…
Affected waste
streams
Category Source
Doggy bag In several municipalities of the MNCA, doggy bags were distributed to nearly 50 restaurants
in order to stop food waste and the restaurants also receive a training on waste management
within this action. This action should be extended to other municipalities within the MNCA
and is still ongoing. The tourists are highly using this doggy bag system.
July 2014 Bio‐waste from
restaurants
Infrastructura
l and
informational
Website
http://www.preventiondesdechets.
org/doggy‐bag/
information from the MNCA
Doggy bag Within a partnership between the MNCA and the chamber of commerce and industry (CCI)
and in link with the European project MED3R, restaurants in Nice starting to have doggy bags
in order to avoid food waste (70 restaurants were preselected). This action is still ongoing.
2014 Bio‐waste from
restaurants
Infrastructura
l and
informational
Website http://ccitv.cote‐
azur.cci.fr/video‐579‐projet‐
europeen‐med‐3r‐‐dechets‐de‐la‐
restauration
information from the MNCA
Website on
waste
prevention
The MNCA has a dedicated website for waste prevention giving information on the different
possible actions for waste prevention, reduction, and reuse.
2014 All type of waste Infrastructura
l and
informational
http://www.preventiondesdechets.
org/
Sticker “no
advertisers”
The MNCA delivers sticker “no advertisers” in order to stop receiving advertisers:
approximatively 100 000 stickers have been distributed
2013 Paper Informational Internal URBANWASTE documents
Reusable
cups
Awareness campaign organized towards employees from the local authorities and
municipalities of the MNCA encouraging drinking water from the tap, with the distribution of
reusable cups (8 000)
2016 / 2017 Plastic waste (plastic
bottles and cups)
Informational http://www.preventiondesdechets.
org/eco‐exemplarite/
Annual report on waste collection
and management (2014)
Reusable
bags
The MNCA promotes using reusable bags and distributed such bags during public events
(25 000). This action is still ongoing.
2014 Plastic waste Infrastructura
l and
informational
http://www.preventiondesdechets.
org/eco‐exemplarite/
Annual report on waste collection
and management (2014)
Reusable
batteries
The MNCA promotes using reusable batteries within its directions. This action was successful
and ended in 2015.
2014 Electronic waste Informational http://www.preventiondesdechets.
org/autres‐astuces/
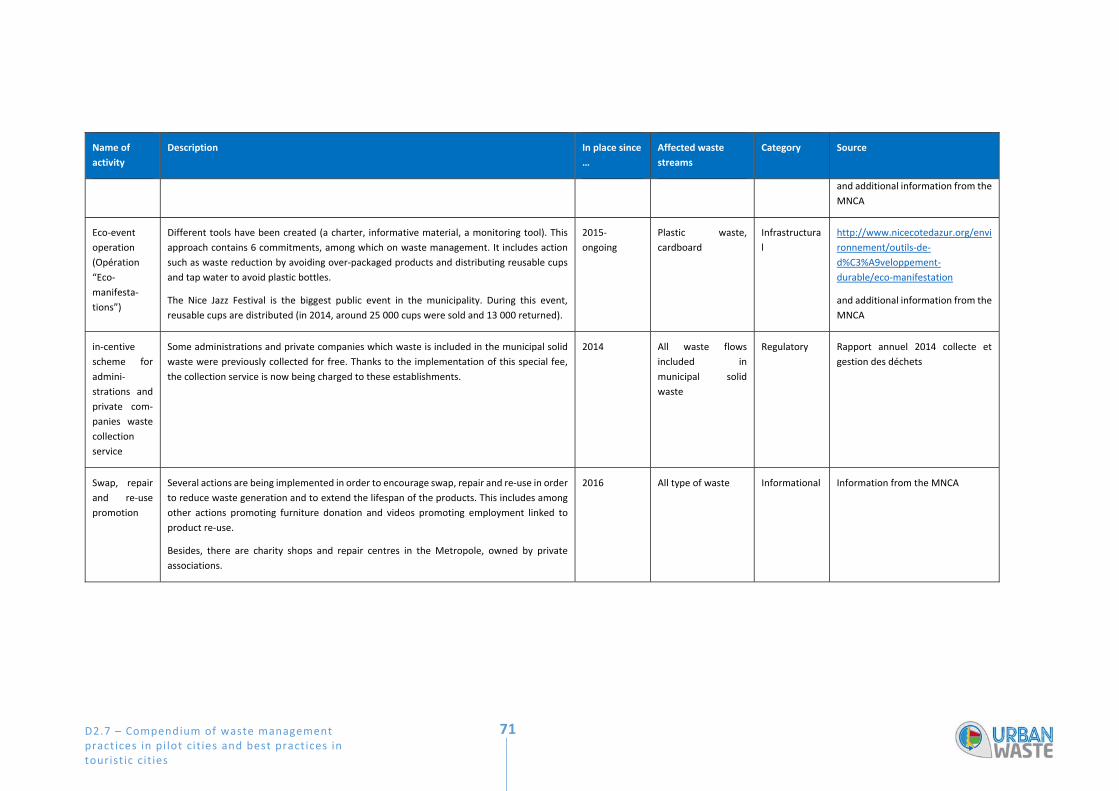
D2.7 – Compendium of waste management practices in pi lot cit ies and best practices in touristic cit ies
71
Name of
activity
Description In place since
…
Affected waste
streams
Category Source
and additional information from the
MNCA
Eco‐event
operation
(Opération
“Eco‐
manifesta‐
tions”)
Different tools have been created (a charter, informative material, a monitoring tool). This
approach contains 6 commitments, among which on waste management. It includes action
such as waste reduction by avoiding over‐packaged products and distributing reusable cups
and tap water to avoid plastic bottles.
The Nice Jazz Festival is the biggest public event in the municipality. During this event,
reusable cups are distributed (in 2014, around 25 000 cups were sold and 13 000 returned).
2015‐
ongoing
Plastic waste,
cardboard
Infrastructura
l
http://www.nicecotedazur.org/envi
ronnement/outils‐de‐
d%C3%A9veloppement‐
durable/eco‐manifestation
and additional information from the
MNCA
in‐centive
scheme for
admini‐
strations and
private com‐
panies waste
collection
service
Some administrations and private companies which waste is included in the municipal solid
waste were previously collected for free. Thanks to the implementation of this special fee,
the collection service is now being charged to these establishments.
2014 All waste flows
included in
municipal solid
waste
Regulatory Rapport annuel 2014 collecte et
gestion des déchets
Swap, repair
and re‐use
promotion
Several actions are being implemented in order to encourage swap, repair and re‐use in order
to reduce waste generation and to extend the lifespan of the products. This includes among
other actions promoting furniture donation and videos promoting employment linked to
product re‐use.
Besides, there are charity shops and repair centres in the Metropole, owned by private
associations.
2016 All type of waste Informational Information from the MNCA

D2.7 – Compendium of waste management practices in pi lot cit ies and best practices in touristic cit ies
Some hotels in the Metropole Nice Côte d’Azur have implemented waste prevention actions in the context of
sustainable certification such as the eco‐label “Green Key” or the TripAdvisor Green Leaders program. In the city
of Nice, at least 14 hotels involved in such programs have been identified. Among the waste prevention actions
implemented, the most common ones are:
Reusable dinnerware and cutlery (the hotels involved in the TripAdvisor Green Leaders program commit
to have at least 90% of crockery and cutlery reusable)
Completed waste assessment of building (the hotels have evaluated the amount and type of waste they
create, in order to plan how to reduce it)
Refillable toiletries dispensers (the hotels involved in the TripAdvisor Green Leaders program commit
to have at least dispensers in over 90% of guest room bathrooms, this action helps reducing the amount
of waste generated, especially from packaging)
Among the identified hotels, at least 3 hotels do compost on‐site or at on offsite composting facility,
from food waste, yard waste and biodegradable products.
4.6.3 Description of Municipal Solid Waste (MSW) Collection
Definition of municipal solid waste
The MNCA defines “municipal solid waste” the same way as presented in the Glossary of this report, that is to
say waste originating from households and similar establishments that produce waste similar to household waste
and dispose the waste at the same facilities used for municipally collected waste. Litter is not part of MSW, it is
handled by the urban cleaning service.
Responsibility for the collection of MSW
The local waste management authority is responsible of MSW collection together with partners from the private
sector, depending on the municipalities of the Metropole and on the respective waste flows. In general, the
municipal waste collection covers households and similar establishments.
Regarding residual waste, the collection is managed by each operational centre on its territory of action, and is
either realized by the local authority public establishment in charge of the collection or by a private company
through a public procurement contract.
Packaging waste is also collected either by the local authority public establishment in charge of the collection
(34% of the municipalities) or by a private company through a public procurement (66% of the municipalities).
Regarding glass and papers, these are collected by private companies through a public procurement except in
one municipality where it is collected by the local authority public establishment in charge of the collection.
Changes of waste collection services during the year
During the summer, the waste collection is reinforced but not because of the tourists but because employees
from the collection services are on holiday.

D2.7 – Compendium of waste management practices in pi lot cit ies and best practices in touristic cit ies
73
Identification of the bins
All the bins used for packaging waste collection are tagged with a chip that locates the bins. This includes both
bins for door to door collection, collection points’ bins and bring stations’ bins, which represent more than 57 000
bins tagged. Only the geolocation can be associated to the bins, and not the weight of the bins because the bins
are not weighed when being collected.
Collection systems used for the different types of waste fractions
Depending on the type of waste fraction, different collection systems are used:
Residual waste: door to door collection in the urban areas and concentration points for the collection
in the most rural areas. In some areas, there are also bring banks (123) which are either buried or half‐
buried
Packaging waste (cardboard, plastic, recyclable metals): door to door collection in the urban areas and
concentration points and brings banks in the less urban areas
Paper: door to door collection for schools and administration, otherwise bring banks (buried or semi‐
buried waste container or aerial waste container)
Glass: bring banks (buried or semi‐buried waste container or aerial waste container) for households and
door to door collection for certain business establishments (hotels, restaurants, bars)
Other options available for certain types of waste
In the Metropole of Nice Côte d’Azur, there are 13 civic amenity sites where private individuals can bring bulky
waste (furniture, domestic electrical goods), garden waste, wood, but also hazardous waste such as batteries
and accumulators, oils.
The eco‐organisation “Corepile” in charge of the EPR scheme related to batteries and accumulators provides
containers to collect batteries in public areas like the town hall, hospitals, etc.
They are also several centres similar to charity shops and repair centres, such as the examples in the city of Nice:
“Falabrac Nice”, in Nice, sells second hand clothes and has a repair centre project
“ACTES Resources”, in Nice, collects for free second hand objects and furniture and resell them
Composition of residual waste
Data on composition of residual waste is not available.
Waste treatment
Treatment of residual waste
The residual waste is treated in four different ways:
90% of the residual waste is incinerated with energetic recovery
2,3% of the residual waste is landfilled
1,8% of the residual waste is composted
2,5% of the residual waste is transformed in refuse‐derived fuel with energetic recovery

D2.7 – Compendium of waste management practices in pi lot cit ies and best practices in touristic cit ies
74
Treatment of separately collected waste fractions
Packaging waste goes to the sorting centre where the different recycling flows are separated (cardboard, plastic,
tin).
72,7% of the packaging waste in recycled
27,3% are impurities, 97% of these impurities are incinerated, and 3% landfilled
Glass and paper flows are recycled to 100%.
Export of waste fractions out of the area of the MNCA
84% of the waste collected from households and similar establishments is treated within the MNCA. 16% of the
waste is treated out of the area of the MNCA. These waste fractions concern wood and scrap metal which are
recycled, and bulky waste which is partly recycled and partly treated with energetic recovery.
Further, clinker and smoke purification residues (RPIFHW) are sent to authorised landfilling centres out of the
MNCA.
Street sweeping waste
Street sweeping waste is understood as defined in the project Urban‐Waste, that is to say it refers to
waste that accumulates from street sweeping when cleaning large areas, and it also includes public
waste bins. This includes flows such as cans, papers, plastic, garden waste. The street sweeping waste
is incinerated.
The urban cleaning service is in charge of the management of street bins and street sweeping, thus the
waste management service has no information on a significant seasonal variation in the generated
quantities of street sweeping waste.
4.6.4 Collection of Waste from Tourist Establishments
The waste collection of tourist establishments is covered by the Metropole Nice Côte d’Azur. As mentioned
previously, certain businesses (e.g. hotels, restaurants, bars) have a specific door to door collection for glass
waste.
4.6.5 Description of waste from touristic ships
The port of Nice does not have a specific infrastructure to handle waste from touristic ships. Usually, touristic
ships on cruise journeys empty their waste at the beginning or at the end of the cruise journey. Nice is not a
starting or final destination of cruise journeys but rather an intermediate stop. Thus, the cruise ships stopping in
the port of Nice for a halt do not dispose their waste there.
There are public bins on the public space of the port but this bins are street bins and there are not meant for
touristic ships to dispose their waste.
Finally, for smaller touristic ships (e.g. yachts) or touristic ships with Nice as final destination, the chamber of
commerce is in charge of the waste collection and has a contract with a private company who implements the
waste collection from the ships.

D2.7 – Compendium of waste management practices in pi lot cit ies and best practices in touristic cit ies
75
4.7 Nicosia (CY)
Mattias ERIKSSON
4.7.1 Brief description of the URBANWASTE pilot case area
Nicosia (Lefkosia), the capital of Cyprus, one of the oldest cities in our part of the world, today is a sophisticated
and cosmopolitan place in the Eastern Mediterranean, rich in history and culture, combining its historic past with
the amenities of a modern city. The heart of the city, within the 16th century Venetian Walls, has a number of
interesting museums and art galleries, Byzantine churches and a number of mediaeval and neo‐classical buildings
while the narrow streets retain the romantic atmosphere of the past.
Since 1974, the people of Cyprus are experiencing the tragedy of a divided country, with the Green Line cutting
in two the heart of the capital city Nicosia which still remains the last divided city in Europe. The regeneration of
the divided historic centre of Nicosia constitutes a priority for Nicosia Municipality with a focus on the protection
and reuse of its architectural and cultural heritage, as an asset of major cultural, economic and social significance.
Outside the Walls, the new city with its modern facilities is a cosmopolitan centre of a modern European capital.
There are several administrative levels with the name Nicosia. The largest is the district which includes several
municipalities. A few of these municipalities lie within the metropolitan area of Nicosia, where Nicosia
municipality is the second largest one in terms of inhabitants. The tourist area is mainly located in the old town
within the venetian city walls, which is partly located in the municipality of Nicosia. Nicosia Municipality has
55 014 inhabitants (statistical service, 2011 census). There is no metropolitan authority as such for Greater
Nicosia and various roles, responsibilities and functions for the wider area are undertaken by the Nicosia District
administration, bodies such as the Nicosia Water Board and, to some extent, Nicosia municipality.
4.7.2 Description of Waste Prevention Actions
In order to promote sustainable tourism there are several initiatives with minimum standards and labels that
include waste among other indicators. One of these are the Cyprus Tourism Organisation Guidelines provides
minimum standards for sustainability in hotel establishments. In their guidelines for minimum standards in hotel
establishments the Travel Foundation include as evaluation criteria concerning waste generation the amount of
waste produced in kg per guest and night. At the beginning of their sustainability initiative, they propose to
identify the different waste streams each hotel produces. These are likely to include glass, paper and card, cans,
food waste and other general waste. Over a period of seven days, all waste generated (and if possible, each
waste stream separately) shall be weighed in kilograms (kg). To identify the volumes of waste of each type the
hotel is producing – and where waste should be collected in different coloured bags according to the different
hotel operations such as the kitchens, the gardens, rooms etc., or by type of waste (plastics, card and paper,
glass, cans, food, general waste etc.). This differentiation shall help to find out which to focus waste reduction
measures first. A similar initiative is taken by the Cyprus Tourism Organization in cooperation with Cyprus
Sustainable Tourism Initiative and Travel Foundation (non‐profit British organization) that created a project with
title ‘waste mapping’ that aims to reduce hotel’s food waste and improve the management of their waste.
Other initiatives for sustainable tourism in Nicosia is the website www.bookdifferent.com that associate a carbon
footprint (CO2 per room per night) to each hotel in their list. Also hotels with the green key label is listed so that
D2.7 – Compendium of waste management practices in pi lot cit ies and best practices in touristic cit ies
76
guests can base their choice of hotel on some environmental indicators. In the list 18 of the 71 listed hotels got
the green footprint indicating the lowest level of greenhouse gas emissions in this comparison. Two of the hotels
were labelled with the green key.
Nicosia Municipality is also performing a number of activities to reinforce citizen’s awareness, enhance their
willingness to reduce their waste and participate to recycling programs. The municipality therefore, organizes
cleaning campaigns, participates to volunteer campaigns, published press releases, prepare and disseminate
informational leaflets and announcements and use of posters in important key areas such as bus stations.
Τhe contribution of immigrants towards achieving the goals of sustainable waste management in Cyprus
Nicosia Municipality, lead partner of the consortium for the Programme “New Channels for Integration” has
organized a discussion forum of the Network of Cooperation involving immigrant organizations, NGO’s and Local
Authorities under the title “Τhe contribution of immigrants towards achieving the goals of sustainable waste
management in Cyprus: The role of effective information and involvement at the level of the local community”.
The forum brought together more than 30 participants representing several immigrant communities that live
and work in Nicosia as well as Local Authorities and NGO’s. During the event, Nicosia’s policies regarding waste
management and the framework of actions for the Programme period of 2014‐2020 were presented by Michael
Lagos, Municipal Health Inspector of Nicosia Municipality. During the same occasion, a project regarding waste
reduction, reuse and recycling funded by the EU Program LIFE+ under the title “RETHINK” was presented by
George Kirkos, project manager.
The participants had the opportunity to inform themselves about waste management as well as express their
views and opinions during the fruitful discussion following the presentations. Project Manager Roula Thoma,
European Affairs Officer of Nicosia, mentioned that “the EU considers waste management a priority and local
authorities all over Europe are required to adopt measures in order to achieve sustainable waste management.
But for a policy to be implemented successfully, the whole society must be actively involved. We believe that the
contribution of immigrants towards achieving the goals of sustainable waste management policies is important”.
The discussion forum took place within the framework of the project “Integration programmes by Local
Authorities” co‐funded by the Asylum, Migration and Integration Fund of the EU and the Republic of Cyprus. The
programme “New Channels for Integration” is implemented for the 5th consecutive year with the aim to assist
the integration of third country nationals in the local community through various actions and services. The
consortium includes the Municipality of Nicosia (lead partner), the Municipalities of Agios Dometios, Egomi and
Lakatamia, the Nicosia Municipality Multifunctional Foundation and the consultants Losadeal ltd and NVK Advent
Consulting Ltd.
Table 17 summarizes the activities described above.
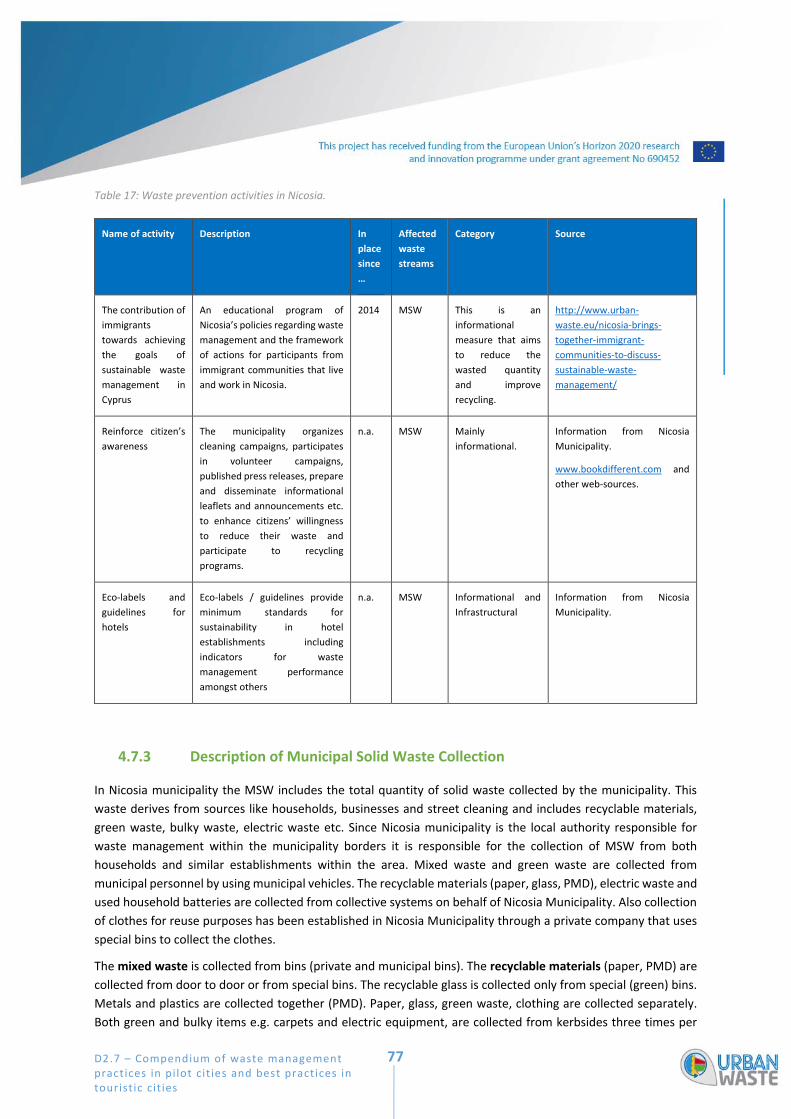
D2.7 – Compendium of waste management practices in pi lot cit ies and best practices in touristic cit ies
77
Table 17: Waste prevention activities in Nicosia.
Name of activity Description In
place
since
…
Affected
waste
streams
Category Source
Τhe contribution of
immigrants
towards achieving
the goals of
sustainable waste
management in
Cyprus
An educational program of
Nicosia’s policies regarding waste
management and the framework
of actions for participants from
immigrant communities that live
and work in Nicosia.
2014 MSW This is an
informational
measure that aims
to reduce the
wasted quantity
and improve
recycling.
http://www.urban‐
waste.eu/nicosia‐brings‐
together‐immigrant‐
communities‐to‐discuss‐
sustainable‐waste‐
management/
Reinforce citizen’s
awareness
The municipality organizes
cleaning campaigns, participates
in volunteer campaigns,
published press releases, prepare
and disseminate informational
leaflets and announcements etc.
to enhance citizens’ willingness
to reduce their waste and
participate to recycling
programs.
n.a. MSW Mainly
informational.
Information from Nicosia
Municipality.
www.bookdifferent.com and
other web‐sources.
Eco‐labels and
guidelines for
hotels
Eco‐labels / guidelines provide
minimum standards for
sustainability in hotel
establishments including
indicators for waste
management performance
amongst others
n.a. MSW Informational and
Infrastructural
Information from Nicosia
Municipality.
4.7.3 Description of Municipal Solid Waste Collection
In Nicosia municipality the MSW includes the total quantity of solid waste collected by the municipality. This
waste derives from sources like households, businesses and street cleaning and includes recyclable materials,
green waste, bulky waste, electric waste etc. Since Nicosia municipality is the local authority responsible for
waste management within the municipality borders it is responsible for the collection of MSW from both
households and similar establishments within the area. Mixed waste and green waste are collected from
municipal personnel by using municipal vehicles. The recyclable materials (paper, glass, PMD), electric waste and
used household batteries are collected from collective systems on behalf of Nicosia Municipality. Also collection
of clothes for reuse purposes has been established in Nicosia Municipality through a private company that uses
special bins to collect the clothes.
The mixed waste is collected from bins (private and municipal bins). The recyclable materials (paper, PMD) are
collected from door to door or from special bins. The recyclable glass is collected only from special (green) bins.
Metals and plastics are collected together (PMD). Paper, glass, green waste, clothing are collected separately.
Both green and bulky items e.g. carpets and electric equipment, are collected from kerbsides three times per

D2.7 – Compendium of waste management practices in pi lot cit ies and best practices in touristic cit ies
78
year (during organised campaigns). Additionally, there is a temporary green point where the citizens have the
opportunity to transfer the different streams of household waste to which are there collected from the municipal
workers without any charge. The special bins for clothes are also located at this green points. For the collection
of batteries there are special plastic columns in public and municipal buildings and in banks. The businesses /
companies which produce or handle hazardous waste maintain contracts with private companies for the
separate collection and special treatment of their waste. A normal composition of the collected waste is
displayed in Table 18.
Table 18: Illustration of the composition of waste produced in Cyprus (Department of Environment evidences 2010)
MATERIAL COMPOSITION % per weight
Biodegradable organic waste & green waste 37,29%
Paper and cardboard 24,59%
Other 14,89
Plastic 13,01%
Glass 3,79%
Metal 3,5%
Wood 2,94%
The municipal solid waste that is collected by municipal garbage trucks or from some collective system’s (private
companies) vehicles from households and business are picked up at least once or twice a week. The non‐
recyclable part of municipal solid waste is then transferred to Kotsiatis landfill which is situated outside the
municipality boundaries area. Recyclable materials, green waste, electric and electrical equipment, household
batteries, used clothing, textiles and bulky items that are collected separately are transferred to appropriate
facilities of private units for special treatment and handling. The glass is transferred to Vasilikos Plant (also
outside the municipality boarders) and converted through a fragmentation process to dust that is used for the
production of cement. Other recyclable materials like paper, plastics and metal are sorted in different types and
packed on pallets in order to be exported to materials recovery facilities abroad. Also old batteries and some
quantities of electric and electrical equipment are exported.
The recyclable materials such as paper, plastic and metal beverage boxes are collected separately from door to
door or from bins located in private or public points. The recyclable glass is collected from special bins. Since the
different streams of recyclable materials must be separated from the other types of waste from households or
businesses in order to be collected from the collective systems (sorted at source), Nicosia Municipality has
operated a temporary drop off point (green point) where the citizens have the opportunity to transfer the
different streams of household waste to without charge. The drop of point is operated by municipality workers
to promote the households and businesses to improve the waste management by reducing, reusing and recycle
their waste.
D2.7 – Compendium of waste management practices in pi lot cit ies and best practices in touristic cit ies
79
Waste from street sweeping and street bins contains recyclable materials such as pieces of paper, plastic, metal,
few glass, and organic waste including food waste, dust and leaves. The only seasonality of this waste is the
leaves that appear during autumn in some main streets outside the walled city, but no data of the quantities of
this organic waste stream is available.
4.7.4 Collection of Waste from Tourist Establishments
Waste from tourist establishments is collected and treated together with other waste streams arising from
businesses and households in Nicosia municipality. Since the waste management of tourist activities is integrated
in that of the non‐tourist activities, and since there are no tracking systems in place for individual bins, there are
no specific statistics describing these waste flows. However, the waste collection service is reinforced during the
year according to the touristic flows. According to official statistics, Nicosia has less tourism traffic during summer
months, but the quantity of municipal solid waste collected is slightly higher during summer. This is probably
because there is increased traffic in the centre of the city (walled city) by locals spending time in the area. Also,
the slightly increased quantity of solid waste might be due to the fact that there is an increased number of
tourists in organized tours visiting the city for a couple of hours even though their main place of stay might be in
the coastal cities.
4.7.5 Description of waste from touristic ships
Nicosia is not a coastal city and the pilot case therefore has no port or waste from tourist ships.

D2.7 – Compendium of waste management practices in pi lot cit ies and best practices in touristic cit ies
80
4.8 Ponta Delgada (PT)
Juliane GROßE, Gisela MC. NASCIMENTO
4.8.1 Brief description of the URBANWASTE pilot case area
The pilot case Ponta Delgada comprises the municipal area. Ponta Delgada is the administrative capital of the
Autonomous Region of the Azores in Portugal. It is located in the south of São Miguel Island, the largest and most
populated island in the archipelago. The municipality has a population of nearly 70,000 inhabitants and an area
of 232.99 km2. Ponta Delgada has more than half of the supply of the Azores hotel beds, 4.900 of a total of 8.900,
with more than 600,000 overnight stays per year. The core touristic season spans from June to September.
Tourists arrive to Ponta Delgada – obviously – either by plane or ship.
Figure 6: Location of the pilot case Ponta Delgada
4.8.2 Description of Waste Prevention Actions
The waste prevention actions are mainly driven by PEPGRA – Azores Strategic Plan on Waste Prevention and
Management. The plan includes a series of strategic objectives, each one with several programmed
actions/measures. The Objective 1 is on waste prevention and includes the disclosure of the new regional
program on waste prevention. This plan is still not available, but the measures listed as follows have already been
put in to place (based on the old PEGRA ‐ Azores Strategic Plan on Waste Management).

D2.7 – Compendium of waste management practices in pi lot cit ies and best practices in touristic cit ies
81
Table 19: Waste prevention activities in Ponta Delgada taken on in 2016 (or previous), based on PEGRA ‐ Azores Strategic Plan on Waste Management (previous version)
Name of
activity
Description In place
since …
Affected
waste
streams
Category Source
Eco‐fee on
plastic bags
Eco‐fee on plastic bags (0,05 €/bag) in large
commercial establishments – all Azorean islands;
measure will be extended to all commercial
establishments during 2017
2016 (or
previous)
Plastic
waste
Economic PEGRA
Ecofreguesia
(‘Eco‐town’)
contest
Promotion of the Ecofreguesia contest – an
environmental award on the cleaner parish; it
includes prevention actions (parishes need to
develop, take act on prevention measures to be
able to score) – all Azorean islands
2016 (or
previous)
Waste
prevention
general
Informational PEGRA
Eco Escolas
(‘Eco‐schools’)
program
A voluntary programme designated for schools; is
promoted by ABAE, a Portuguese NGO17, partner
of the FEE (Foundation for Environmental
Education) ‐ all Azorean islands;
2016 (or
previous)
Waste
prevention
general
Informational PEGRA
European
Waste
Prevention
Week
(EWWR)
all Azorean islands; 2016 (or
previous)
Waste
prevention
general
Informational PEGRA
Reciclar é
valorizar
(‘Recycling is
valuing’)
Waste prevention and sorting programme
developed only in Ponta Delgada, since 2014; it’s
a door‐to‐door information and awareness
programme that aims to change people’s waste
behaviour.
It’s based in an American methodology that uses
– after a previous evaluation and sorting criteria
– well informed (on waste management) people
from the neighbourhood, to influence next door
neighbours;
2016 (or
previous)
Waste
prevention
general
Informational PEGRA
Besides the measures of PEGRA the following additional waste preventions measures could be identified in Ponta
Delgada (see Table 20):
17 non‐profit and non‐political organization
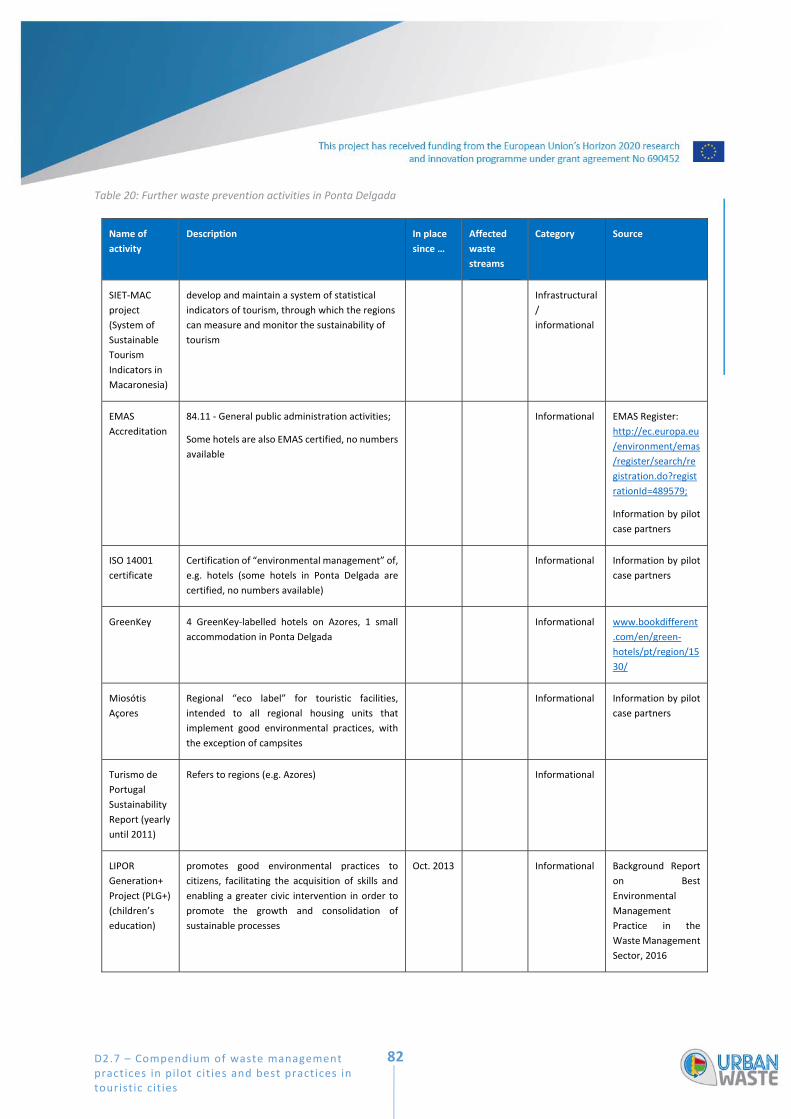
D2.7 – Compendium of waste management practices in pi lot cit ies and best practices in touristic cit ies
82
Table 20: Further waste prevention activities in Ponta Delgada
Name of
activity
Description In place
since …
Affected
waste
streams
Category Source
SIET‐MAC
project
(System of
Sustainable
Tourism
Indicators in
Macaronesia)
develop and maintain a system of statistical
indicators of tourism, through which the regions
can measure and monitor the sustainability of
tourism
Infrastructural
/
informational
EMAS
Accreditation
84.11 ‐ General public administration activities;
Some hotels are also EMAS certified, no numbers
available
Informational EMAS Register:
http://ec.europa.eu
/environment/emas
/register/search/re
gistration.do?regist
rationId=489579;
Information by pilot
case partners
ISO 14001
certificate
Certification of “environmental management” of,
e.g. hotels (some hotels in Ponta Delgada are
certified, no numbers available)
Informational Information by pilot
case partners
GreenKey 4 GreenKey‐labelled hotels on Azores, 1 small
accommodation in Ponta Delgada
Informational www.bookdifferent
.com/en/green‐
hotels/pt/region/15
30/
Miosótis
Açores
Regional “eco label” for touristic facilities,
intended to all regional housing units that
implement good environmental practices, with
the exception of campsites
Informational Information by pilot
case partners
Turismo de
Portugal
Sustainability
Report (yearly
until 2011)
Refers to regions (e.g. Azores) Informational
LIPOR
Generation+
Project (PLG+)
(children’s
education)
promotes good environmental practices to
citizens, facilitating the acquisition of skills and
enabling a greater civic intervention in order to
promote the growth and consolidation of
sustainable processes
Oct. 2013 Informational Background Report
on Best
Environmental
Management
Practice in the
Waste Management
Sector, 2016

D2.7 – Compendium of waste management practices in pi lot cit ies and best practices in touristic cit ies
83
Ponta Delgada reports furthermore that house composting it is still not an official prevention measure in Ponta
Delgada; however, many of the households in the rural area of the municipality actual do it, because subsistence
farming has always been present.
“Green public procurement guidelines” are an area still not very developed in Portugal. The new public
procurement code already has some guidelines about green procurement, but these guidelines have to be
developed and specified, so that purchase of goods and services can be made in a simple and clear way. At the
city hall, due to its environmental management system, a green procurement code is in use since 2009. This
document includes some of the most important (in terms of quantity or danger) goods and services with
environmental impact.
The inter‐municipal waste management company produces quarterly reports on waste management and waste
variation and gives regular sector data to the regional government (data that is used to control and monitor the
PEPGRA objectives).
4.8.3 Description of Municipal Solid Waste Collection
In Ponta Delgada, the same definition of “municipal solid waste” (MSW) is used as presented in the Glossary of
this report. MSW includes thereby all types of solid waste that are collected by the municipality (Câmara
Municipal de Ponta Delgada, Environment and Urban Services). They include waste originating from households
and similar establishments (e.g. commercial activities, office buildings, institutions such as schools and
government buildings and small businesses) that produce waste similar (quantity and quality) to household
waste and dispose waste at the same facilities used for municipally collected waste. The waste collection of
“similar establishments” is called “domestic kind of like waste” in Ponta Delgada and includes also hotels and
touristic establishments.
The collection of MSW is entirely under the responsibility of the municipality (Câmara Municipal de Ponta
Delgada, Environment and Urban Services)18. It covers households as well as similar establishments (“domestic
kind of like waste”, e.g. hotels, touristic establishments). The Hygiene and Cleaning Service (HCS) of the City
Council is responsible for the collection and transportation of solid waste in all parishes of the municipality.
Routing of undifferentiated waste and packaging waste (paper/cardboard, plastic, metal and glass) collected
selectively is carried out for the entity responsible for its treatment and final destination (Association of
Municipalities of the Island of S. Miguel). In order to guarantee a quality collection service, the HCS provides
residents with containers for the disposal of undifferentiated waste and promotes the distribution of eco‐points
throughout the municipality, in order to encourage the practice of separating packaging waste.
The waste collection is reinforced during the touristic core season between June and September.
There is no possibility to link collected volumes/mass of waste to waste generators as bins/containers are neither
tagged, nor is the waste directly weighted when collected.
Certain fractions of MSW are collected separately, mainly through kerbside collection, these are: Paper and
cardboard, glass, plastics, metals, green waste (trees, grass and bushes), batteries, domestic waste on great
format (refrigerator, washing machines, furniture, etc.) and bulky waste:
18 Except for touristic ships (see chapter 4.8.5)

D2.7 – Compendium of waste management practices in pi lot cit ies and best practices in touristic cit ies
84
Bulky waste and plastic/metal: kerbside collection;
Green and great format waste: kerbside collection after dial‐up to the municipal services;
Paper/cardboard: kerbside collection, on some commercial areas;
Glass: kerbside collection, on restaurants and coffee shops;
Paper/cardboard, glass, plastics and metals: Bring‐it‐yourself system (eco‐points);
Cooking oils: kerbside collection and bring‐it‐yourself system.
Besides these waste collection services, no further possibilities exist to give away specific types of waste, such as
clothing to charities or return certain types of waste (e.g. batteries, worn shoes, worn clothes …) to retailers.
Only for packaging waste there is the “Green Dot System / SOCIEDADE PONTO VERDE (SPV)”, a non‐profit‐making
company with the mission to promote the selective collection, take‐back and recycling of packaging waste in
Portugal (ACR+ “Good Practices in collection and closed‐loop glass recycling in Europe”, 2012).
Regarding the further treatment of the separately collected waste fractions, bulky waste ends on landfill, just
as great format waste, which – after screening/separation of different components – also ends as landfill or is
further screened. Paper and cardboard, plastic, metal, batteries and glass are stored and reduced in volume until
final shipment to the mainland of Portugal. Green waste (trees, grass and bushes), however, is composted and
cooking oil is transferred into biodiesel production.
The residual waste of Ponta Delgada was in 2016 composed of the
following fractions19:
>80 % mixed municipal waste (20 03 01)
8 % biodegradable waste (20 02 01)
2 % bulky waste (20 03 07)
3 % metals (20 01 40)
4 % paper and cardboard (20 01 01)
<1% plastics (20 01 39)
<1% municipal wastes not otherwise specified (20 03 99)
Regarding street sweeping waste, the definition in Ponta Delgada is partially consistent with the definition used
in the URBANWASTE project. The local definition of “street sweeping waste” includes grit, dust, abraded particles
of the roadbed, interspersed with organic components of soil, roadside greenery and leaves as well as waste
from collection containers/bins along the roadside and in parks and public squares. Regarding seasonal variation,
there is a higher emergence of street sweeping waste during festivities, particularly in waste collected in
containers/bins along the roadside and in parks or public squares. The management of street bins and street
sweeping is also under the responsibility of the municipality (Câmara Municipal de Ponta Delgada, Environment
and Urban Services).
19 According to the European List of Waste
Figure 7: Composition of residual waste (Ponta Delgada, 2008)

D2.7 – Compendium of waste management practices in pi lot cit ies and best practices in touristic cit ies
85
4.8.4 Collection of Waste from Tourist Establishments
The collection of waste from tourist establishments is covered by the municipal waste collection (“similar
establishments”), therefore the same waste collection and treatment principles as described above apply. During
the touristic core season between June and September the waste collection is reinforced.
4.8.5 Description of waste from touristic ships
The collection of waste from touristic ships underlies – other than the before discussed waste – the Azores
Seaports, SA (Portos dos Açores), who use the collection services of the private company Varela. The waste from
touristic ships is also collected separately according to the following waste fractions
Residual waste,
Paper,
Tetra pak®,
Glass;
which proceed after collection to further treatment.
According to the Câmara Municipal de Ponta Delgada, data on the composition of waste from touristic ships is
currently not existing.
Estimated, about 10% of the tourists arrive by ship, however, this number needs to be verified according to the
Câmara Municipal de Ponta Delgada.
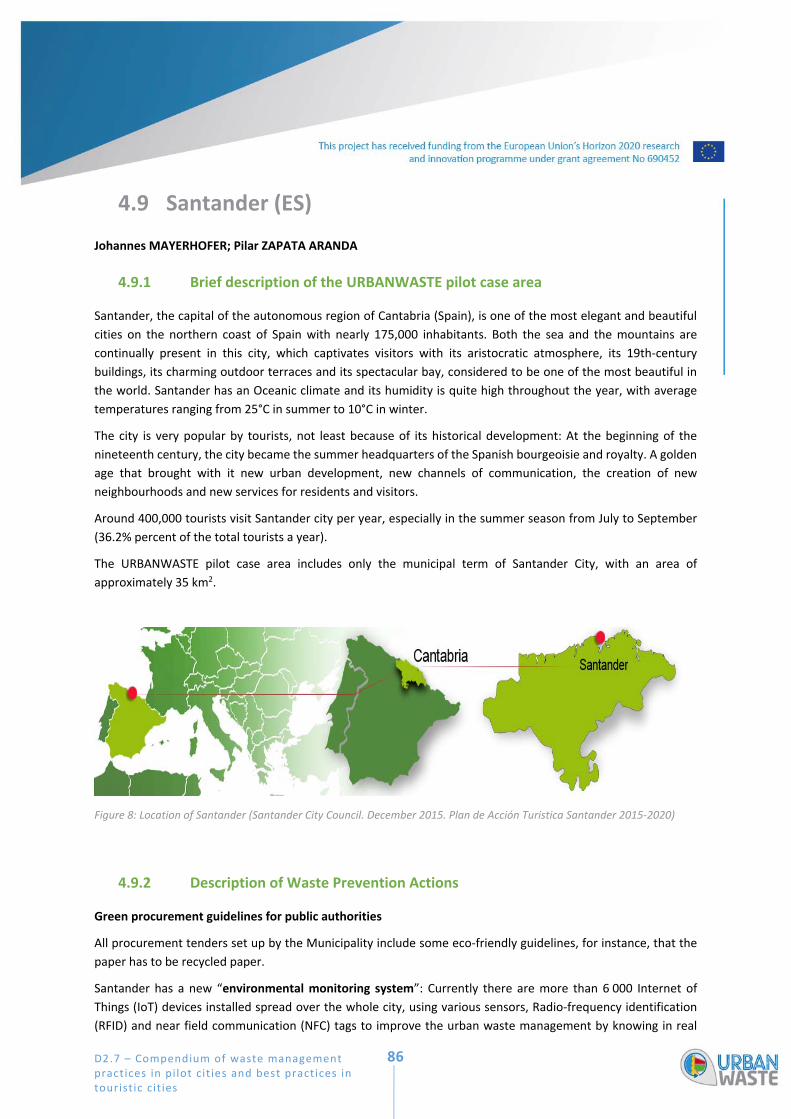
D2.7 – Compendium of waste management practices in pi lot cit ies and best practices in touristic cit ies
86
4.9 Santander (ES)
Johannes MAYERHOFER; Pilar ZAPATA ARANDA
4.9.1 Brief description of the URBANWASTE pilot case area
Santander, the capital of the autonomous region of Cantabria (Spain), is one of the most elegant and beautiful
cities on the northern coast of Spain with nearly 175,000 inhabitants. Both the sea and the mountains are
continually present in this city, which captivates visitors with its aristocratic atmosphere, its 19th‐century
buildings, its charming outdoor terraces and its spectacular bay, considered to be one of the most beautiful in
the world. Santander has an Oceanic climate and its humidity is quite high throughout the year, with average
temperatures ranging from 25°C in summer to 10°C in winter.
The city is very popular by tourists, not least because of its historical development: At the beginning of the
nineteenth century, the city became the summer headquarters of the Spanish bourgeoisie and royalty. A golden
age that brought with it new urban development, new channels of communication, the creation of new
neighbourhoods and new services for residents and visitors.
Around 400,000 tourists visit Santander city per year, especially in the summer season from July to September
(36.2% percent of the total tourists a year).
The URBANWASTE pilot case area includes only the municipal term of Santander City, with an area of
approximately 35 km2.
Figure 8: Location of Santander (Santander City Council. December 2015. Plan de Acción Turistica Santander 2015‐2020)
4.9.2 Description of Waste Prevention Actions
Green procurement guidelines for public authorities
All procurement tenders set up by the Municipality include some eco‐friendly guidelines, for instance, that the
paper has to be recycled paper.
Santander has a new “environmental monitoring system”: Currently there are more than 6 000 Internet of
Things (IoT) devices installed spread over the whole city, using various sensors, Radio‐frequency identification
(RFID) and near field communication (NFC) tags to improve the urban waste management by knowing in real

D2.7 – Compendium of waste management practices in pi lot cit ies and best practices in touristic cit ies
87
time the locations and the status of rubbish bins and containers and also the fill level. This system also includes
GPS/GPRS tracking in order to optimize the waste logistics of urban waste. Environmental sensors on board of
municipal vehicles further gather information about e.g. air quality, temperature and humidity. “Cuida
Santander” App integrates all these information and citizens/visitors can use it to report events and incidences
in the city by uploading pictures and comments. Each report is classified and forwarded to the corresponding
municipality service which is in charge of managing the issue. The App serves as Communication channel from
citizens to Santander City council.
By this effort, also known as “SmartSantander”, city waste‐management bills were supposed to be cut 20 percent
in 2013 (Matlack, 2013). No confirmation could be found on this.
Table 21: Waste prevention activities in Santander.
Name of activity Description In place
since …
Affected
waste
streams
Category Source
“Cuida Santander”
App
App for citizen (also tourists) to check
information about waste and bulk waste
pickup, recycling services, schedules and other
services. The App is a Communication channel
from citizens to Santander City council.
August
2014
MSW Technical,
Informational
Santander City
Council
Awareness
campaigns
Workshop at the beach, Municipal webs,
newspapers, video on municipal buses
NA MSW Dissemination,
(Informational)
Santander City
Council
4.9.3 Description of Municipal Solid Waste Collection
Responsibility for the collection of MSW
As local administration, Santander City Council has different competences. The competence of the Santander
City Council is at City level. The Santander city council administers various municipal services such as local
transport, tourism, waste management, water supply and energy among others. Thus, the municipality is also
responsible for the collection of municipal solid waste (MSW). The waste management as public utility service is
provided by a local waste management enterprise through a public tender. The current service provider working
on behalf of the municipality is ASCAN‐GEASER.
The definition of MSW in Santander is consistent with the definition in the Glossary of this report. Litter is also
part of the definition of MSW. Santander waste collection covers both households and similar establishment.
Collection System
Separate collection is established in Santander for paper/ cardboard, glass, plastics, residual waste, metals, green
waste, debris, clothing/textiles, furniture, mattresses and other household effects, batteries, motor oil, kitchen
oil and paints and varnishes.

D2.7 – Compendium of waste management practices in pi lot cit ies and best practices in touristic cit ies
88
Organic waste is included in the residual waste. Residual waste is collected and transported to the regional
waste treatment plant in Meruelo. Management of organic waste is not a competence of municipality.
While paper/cardboard, glass, plastics and residual waste are separately collected in special bins from
households by a local waste management enterprise on behalf of the municipally authority (kerbside collection),
other wastes such as metals, debris, motor and kitchen oil, paints and varnishes can be disposed separately at
several “collection points”. There are also some specific bins spread over the city to collect clothing for charities
or for the collection of batteries.
Further, door‐to‐door collection is offered by the municipality also for furniture from households or cardboards
from shops. Both services have to be previously requested by users calling to a specific telephone number or
through the mobile app “Cuida Santander”. This app, being the new way of communication between citizens and
the Santander City council, allows the users to request certain services related to the collection of goods or to
report incidents on cleaning or related to the collection of waste.
There are several “clean points” located throughout the city area to encourage and facilitate waste separation
among citizens. Clean points are recycling stations were people can bring their household waste to. There are
two categories of clean points: fixed (placed permanently in the same address) and mobile ones (following
different periodic routes in the city). Currently in Santander there are four mobile clean points that provide
weekly services through four periodic routes and 24 stops for Mobile Points. The residues that are collected in
the mobile clean points are: oil, used clothing, varnishes and paints, batteries, lamps and fluorescents, medicines,
cleaning products, mobile phones, phytosanitaries, toner and disposable printing (Ayuntamiento de Santander,
https://youtu.be/MY4M0Uio0fQ). In 2016, 82,228 kilos of household waste were collected via the mobile clean
points, which is an increase of 1.46 percent over 2015 and confirms the growth of the selection and recycling by
the Santander people (Ayuntamiento de Santander, https://youtu.be/VqHi9F3jTRw).
The amount of collected waste is weighed daily at the end of each collection route. The municipal managers,
thus, have data on the amounts of waste produced by each route in the city every day. On “bin”‐level (due to
the tagging of bins with RFID and NFC tags) the following parameters are known: location, fill level, type of waste,
temperature, model, last emptying date. The amount of waste in each bin is not available as the bins are not
weighed when they are emptied. Currently, Santander City Council publishes some information relating to trash
bins and litter bins in the city (e.g. location, state of conservation, type of waste and capacity) on the Open Data
Portal http://datos.santander.es/dataset/?id=residuos.
Because Santander is a tourist destination mainly in summer season, during these months there is a
reinforcement of the waste collection by strengthening the workforce and increasing the number of work shifts.
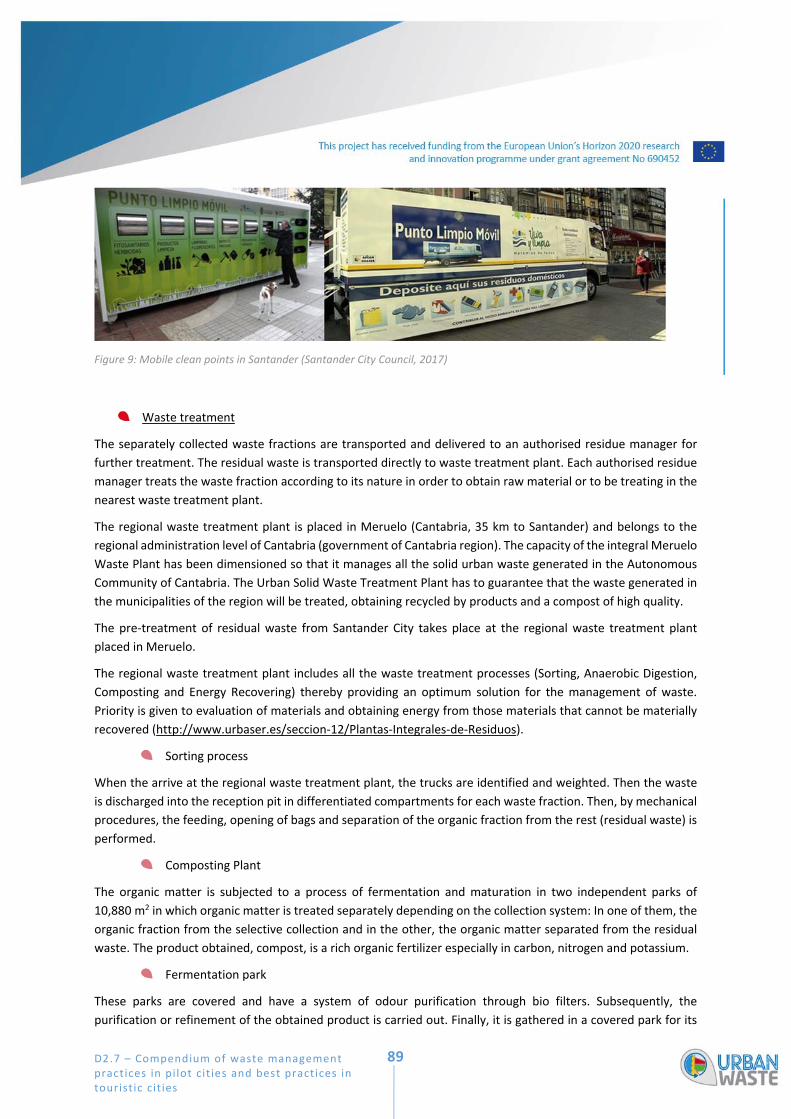
D2.7 – Compendium of waste management practices in pi lot cit ies and best practices in touristic cit ies
89
Figure 9: Mobile clean points in Santander (Santander City Council, 2017)
Waste treatment
The separately collected waste fractions are transported and delivered to an authorised residue manager for
further treatment. The residual waste is transported directly to waste treatment plant. Each authorised residue
manager treats the waste fraction according to its nature in order to obtain raw material or to be treating in the
nearest waste treatment plant.
The regional waste treatment plant is placed in Meruelo (Cantabria, 35 km to Santander) and belongs to the
regional administration level of Cantabria (government of Cantabria region). The capacity of the integral Meruelo
Waste Plant has been dimensioned so that it manages all the solid urban waste generated in the Autonomous
Community of Cantabria. The Urban Solid Waste Treatment Plant has to guarantee that the waste generated in
the municipalities of the region will be treated, obtaining recycled by products and a compost of high quality.
The pre‐treatment of residual waste from Santander City takes place at the regional waste treatment plant
placed in Meruelo.
The regional waste treatment plant includes all the waste treatment processes (Sorting, Anaerobic Digestion,
Composting and Energy Recovering) thereby providing an optimum solution for the management of waste.
Priority is given to evaluation of materials and obtaining energy from those materials that cannot be materially
recovered (http://www.urbaser.es/seccion‐12/Plantas‐Integrales‐de‐Residuos).
Sorting process
When the arrive at the regional waste treatment plant, the trucks are identified and weighted. Then the waste
is discharged into the reception pit in differentiated compartments for each waste fraction. Then, by mechanical
procedures, the feeding, opening of bags and separation of the organic fraction from the rest (residual waste) is
performed.
Composting Plant
The organic matter is subjected to a process of fermentation and maturation in two independent parks of
10,880 m2 in which organic matter is treated separately depending on the collection system: In one of them, the
organic fraction from the selective collection and in the other, the organic matter separated from the residual
waste. The product obtained, compost, is a rich organic fertilizer especially in carbon, nitrogen and potassium.
Fermentation park
These parks are covered and have a system of odour purification through bio filters. Subsequently, the
purification or refinement of the obtained product is carried out. Finally, it is gathered in a covered park for its

D2.7 – Compendium of waste management practices in pi lot cit ies and best practices in touristic cit ies
90
maturation and commercialization. This plant is equipped with a dump equipment with loading and unloading
of the material, all automated. The generated leachates are collected in a raft and the inorganic products or
refuse are sent to the controlled Landfill.
Energy Recovery Plant
In order to complete the cycle of waste utilization, the recycling and composting processes have been expanded,
installing an Energy Recovery system in which the rejection materials of the previous non‐exploitable processes
will be used as fuel and representing approximately 40% of the total waste. This residual fraction would
otherwise have to be deposited in a landfill.
The Energy Recovery Plant is designed to treat an approximate volume of 12 tonnes / hour for 7500 hours / year,
equivalent to a total of 98,000 tonnes / year. The expected electric production is 9,900 Kw.
The process of energy recovery from waste is designed to comply with the limits of Directive 2000/76 / EC of
4th December on the incineration of waste.
4.9.4 Collection of Waste from Tourist Establishments
Waste from tourist establishments like hotels, restaurants, camping sites or public structures such as museums,
etc. are collected and treated together with waste streams collected from households. During the summer time,
there is a reinforcement of the waste collection by strengthening the workforce and increasing the collection
frequency from once a day to twice a day. The reinforcement of the waste collection is in particular focussed on
some special collection routes covering most touristic zones in the city during summer time such as the Sardinero
Area.
Because of the “SmartSantander” initiative (described in Chapter 4.9.2), the Ayuntamiento of Santander has
detailed information about waste collection available at the level of collection routes and at waste bin level, thus
being able to obtain very specific statistical information. Data on different collection zones (e.g. the touristic
Sardinero zone with lots of hotels and restaurants near beaches) in different periods of the year can be compared
and analysed.
4.9.5 Description of waste from touristic ships
Amounts of waste from touristic ships are not included in municipal waste figures of the city, because these
waste streams are not under the responsibility of Santander City council. Based on MARPOL 73/78, the
International Convention for the Prevention of Pollution from Ships, the port authority has the competence of
waste management in the port area.

D2.7 – Compendium of waste management practices in pi lot cit ies and best practices in touristic cit ies
91
4.10 Syracuse (IT)
Marie KAZERONI
4.10.1 Brief description of the URBANWASTE pilot case area
The Municipality of Syracuse is one of the URBANWASTE pilot cases. The municipality has 123 248 inhabitants
and its area covers 207,78 km². Syracuse was declared by UNESCO in 2005 heritage of humanity. The city is visited
by more than 1 300 000 tourists every year.
The Municipality of Syracuse aims to promote a “Zero Waste” strategy in the city and to improve the solutions
and policies for the effective sustainable urban development. This includes extending “door to door” collection
and the waste streams collected (paper, plastic, bio‐waste) to all the city, since it is not yet implemented in the
city centre. The Municipality of Syracuse also wants to enhance communication activities on the practices of
existing local waste management.
The impact of tourism on waste management in Syracuse is generated by the catering activities and shops, which
were multiplied in the last years with the increase of tourism. The increase in the quantity of waste produced
because of the touristic activities is especially important during the summer. Indeed, the highest touristic period
is from May to October.
4.10.2 Description of Waste Prevention Actions
The municipality of Syracuse has implemented different prevention actions detailed in Table 22. The actions
mainly concern organic waste composting. Currently there are no agreements with the tourist facilities to
decrease the amount of waste, but there are agreements with environmental groups for the promotion of home
composting.
Table 22: Waste prevention activities in Syracuse
Name of
activity
Description In
place
since …
Affected
waste
streams
Category Source
Domestic
composting
Free distribution of domestic composters on
request was implemented in Syracuse.
2013 800 composters have been distributed to
citizens and 10 to schools.
The action was related to other instruments:
‐ Inclusion of a discount in the garbage fee by
15% and 20% in 2016 (waste tax incentive);
‐ Controls on the use of compost.
2013 Organic
waste
Infrastructura
l
Informational
Economic
Survey and additional
information from the pilot
city
Domestic
composting
“Good composting" communication campaign 2014 Organic
waste
Informational Survey
D2.7 – Compendium of waste management practices in pi lot cit ies and best practices in touristic cit ies
92
Name of
activity
Description In
place
since …
Affected
waste
streams
Category Source
Community
vegetable
gardens
and
composting
Administration allocated garden lots for a total
of 140 community gardens, each of 73 m²,
associated with a community compost to get
free mulch to use for the gardens.
Some lots have been allocated to the
educational sector.
n.a. Organic
waste
Infrastructura
l
http://www.siracusaoggi.it/si
racusa‐una‐compostiera‐per‐
gli‐orti‐sociali‐a‐giorni‐la‐
graduatoria‐per‐altri‐40‐
lotti/
Course for
volunteer
environ‐
ment
inspector
The municipality has organised some courses
open to everyone willing to be an
“environment inspector”, as a volunteer. This
action includes themes such as the reuse.
2016 All flows Informational http://www.lacivettapress.it/
it/index.php?option=com_co
ntent&view=article&id=1900
:a‐termine‐il‐corso‐di‐
ispettore‐ambientale‐
volontario&catid=63&Itemid
=172
Reduction
of plastic
waste in
schools
Three schools in the municipality were chosen
as pilot projects to reduce plastic waste from
school canteens by using a lunch box instead of
plastic dinner ware.
2015 –
in pro‐
gress
Plastic
waste
Infrastructura
l
http://www.siracusanews.it/
siracusa‐ridurre‐a‐zero‐i‐
rifiuti‐in‐plastica‐nelle‐
mense‐scolastiche‐progetto‐
pilota‐in‐tre‐scuole/
Reuse
There are some charity shops in the
municipality of Syraruse, such as “Seconda
Manina” for children clothes (private initiative)
where people can sell and buy second hand
clothes or the local project “io dono” which is a
reuse and barter solidarity project led by an
association (furniture, electronic device,
objects, etc.).
2014 –
in pro‐
gress
Textile
All type of
flows
Infrastructura
l
http://www.secondamanina.
it/siracusa
https://www.facebook.com/I
ODONOSIRACUSA
4.10.3 Description of Municipal Solid Waste Collection
Definition of municipal solid waste
The municipality of Syracuse defines municipal solid waste as solid urban waste composed by household waste
and bulky waste.
Responsibility for the collection of MSW and its organisation
The municipality of Syracuse is responsible for the collection of MSW, which is collected by a private company
(IGM Rifiuti Industriali). The local waste management authority together with partners from the private company
(IGM Rifiuti Industriali) have the responsibility for the collection of MSW.
Furthermore, the private company covers also other similar establishments producing waste similar to household
waste like schools, hotels, tourist establishments. The collection of the waste is strengthened in the Isle of Ortigia
(Pilot), one of the central districts from Syracuse where there is a strong presence of tourists.
All the waste streams included in MSW are collected by this private company (IGM).

D2.7 – Compendium of waste management practices in pi lot cit ies and best practices in touristic cit ies
93
Changes of waste collection services during the year
There is no change of timetables and frequency of collection during the summer, which is the highest touristic
period. The only difference is the cleanliness of the beaches that is intensified from May to October
Identification of the bins
The bins do not have a weighting system and are not tagged with a chip which would allow to link the amount
of waste to a specific waste generator.
Collection systems used for the different types of waste fractions
The fractions of MSW collected separately are paper and cardboard. This stream is managed with a door to door
collection. This door to door collection is not yet implemented in the whole municipality: the historical centre
Ortigia and the marine quarter do not have a door to door collection. Instead, there are many collection points
in the historical centre for separate collection of 3 streams, which are paper and cardboard, plastic, and glass.
In 2017, the Municipality of Syracuse should implement door to door collection in the whole municipality for the
following five waste streams:
paper and cardboard,
plastics,
metal and aluminium,
glass and
organic waste.
Other options available for certain types of waste
The Municipality of Syracuse has a municipal collection centre (MCC), which is an area where citizens can bring
their recyclable materials such as paper, cardboard (even bulky such as cardboard packaging) plastics, metal and
aluminium, bulky waste and hazardous municipal waste.
Since December 2016, the voluntary system of the municipal collection centre is encouraged thanks to a waste
tax incentive: citizens who bring from 100 to 200 kg of separated waste per year have automatically a discount
of 20% on the variable part of the waste tax. The discount can reach up to 40% in a year if the citizens bring more
than 200 kg of recyclable materials. There are weighting coefficient depending on the type of material for each
kilogram of waste: 1 for paper and cardboard, 0,3 for glass, 1 for plastic and 1 for one aluminium and metal.
Besides the MCC, since 2014 there is a communication campaign called “Don’t fry the environment” which aims
to promote a specific management and collection of vegetable oils and animal fats of households and other
producers. There will be specific containers on streets for the collection of these oils in every neighbourhood of
the municipality that is interested in this specific collection.
Finally, there are also private initiatives and voluntary associations committed to reuse and barter, through
charity shops and specific places receiving for free second hand products as mentioned in the Table 22.
Composition of residual waste
Data the composition of residual waste is not available.

D2.7 – Compendium of waste management practices in pi lot cit ies and best practices in touristic cit ies
94
Waste treatment
There is a single option for the treatment of residual waste, and separate waste streams are managed by a
consortium through a private contract as explained below.
Treatment of residual waste
The residual waste is landfilled.
Treatment of separately collected waste fractions
Municipality of Syracuse has a private contract with the consortium CONAI, a private non‐profit organization.
Separate waste collection fractions are managed by the consortium and send to the related treatment
establishments. In fact, CONAI is responsible for recovery and recycling of packaging, including steel, aluminium,
paper, wood, plastic and glass waste. There are specific supply chain consortia for each of this different types of
waste.
Export of waste fractions out of the area of the MNCA
The consortium CONAI, which is in charge of the treatment of waste fractions collected separately through a
contract with the Municipality of Syracuse, sends each type of material to the related consortia (RiCREA for steel,
CIAL for aluminium, COMIECO for paper and cardboard; RILEGNO for wood, COREPLA for plastic, and CO.RE.VE.
for glass). Each entity manages the material and sends it to the related treatment establishments. All the waste
streams are sent out of the area of the Municipality of Syracuse for treatment, as Sicily has no treatment plants
except for glass, which is treated in other municipalities of Sicily (Marsala and Trapani).
Streets bins and street sweeping waste
The street sweeping waste is defined as waste of any kind or origin which is lying on streets and roads and in
public areas and also private areas subject to public use. The definition also includes waste lying on sea and lake
beaches and on the banks of the waterways. Green waste from green areas (such as gardens, parks, cemeteries)
is also included.
The collection of the street bins and street sweeping is done by a private company (IGM Rifiuti Industriali).
4.10.4 Collection of Waste from Tourist Establishments
Tourist facilities’ waste is collected by the service operated by the same private company as municipal waste
(IGM Rifiuti Industriali). There is no chip or optical code on the bins, so they cannot be linked to a specific location
and the waste is not weighed during collection. Besides, there is no change in the frequency of waste collection
from tourist establishments during the year.

D2.7 – Compendium of waste management practices in pi lot cit ies and best practices in touristic cit ies
95
4.10.5 Description of waste from touristic ships
The touristic ships dispose of their waste by entrusting themselves to the service of their trust business (private
companies). So the waste from touristic ships is not collected by the municipality of Syracuse and there is no
information available on this type of waste. In the Municipality of Syracuse, the port authority (Capitaneria di
Porto) is responsible for the collecting waste from touristic ships.
D2.7 – Compendium of waste management practices in pi lot cit ies and best practices in touristic cit ies
96
4.11 Tenerife (ES) (Municipalities of Adeje, Arona and
Puerto de la Cruz)
Johannes MAYERHOFER; Pilar ZAPATA ARANDA
4.11.1 Brief description of the URBANWASTE pilot case area
Tenerife is an island that has always aroused the interest of different cultures: Phoenicians, Carthaginians,
Greeks, Arabs, Romans, Vikings, and different European countries have coveted their strategic position, such as
Great Britain, Portugal and Germany in many phases of history. Part of this interest is motivated by the
exceptional climate that can be enjoyed all year round in this territory, which since the 18th century has begun
to attract tourism for both sick people and people motivated by the natural beauty and agriculture of the island,
which began to consolidate with the first hotels in the nineteenth century.
In Tenerife, the National Park of the Cañadas del Teide, a UNESCO World Heritage Site, is one of the island’s main
attractions, next to the Anaga Massif, a biosphere reserve. Finally, San Cristobal de la Laguna, its oldest city has
been chosen a world heritage city. The Carnival celebrated on the island, usually in the month of February, is a
world‐wide festival of international tourist interest.
Tenerife is the largest and most populated island of the autonomous community Canary Islands (Spain) with
around 890 000 inhabitants and more than 5,3 Million tourists in 2015 (Tourism Review, 2015).
The three most representative towns have been chosen as the URBANWASTE pilot cases, with the largest number
of tourists on the island (Adeje and Arona in the south, and Puerto de la Cruz in the north) and a wide and varied
range of services and facilities for all its visitors being near the two airports of the island. Below, a short
description of these three URBANWASTE pilot case areas of Tenerife is given:
Arona is a municipality in the south of Tenerife, containing some coastal tourist cities like Los Cristianos,
Playa de las Americas, Las Galletas and Costa del Silencio (Tembel). Playa de las Americas has a part that
belongs to Arona and to Adeje. The city of Arona itself has no coast and is located at 600m altitude
above sea level, approximately 75 km away from the capital of the island, Santa Cruz de Tenerife, and
away 4 km of the coast and the coastal tourist centres (Las Americas, Tembel, Los Cristianos, etc.).
Puerto de la Cruz is a municipality and is a coastal tourist area at the same time, which grew around its
old fishing port, with small neighbourhoods located in the periphery of the population nucleus. "El
Puerto", as it is known in a familiar way, is very close to La Villa de la Orotava, which in the past was
forming one municipality together with Puerto de la Cruz. Puerto de la Cruz is the oldest tourist town at
the Canary Islands (there is evidence of British and German tourism in the seventeenth century), and is
located in the north of the island about 40 km from the capital of the island.
Adeje is a town and municipality in the southwest of the island that has some tourist cities of coast like
Americas, Armeñime, Costa Adeje (La Caleta, Playa Paraiso, Playa del Duque, Playa de Fañabe, San
Eugenio y Torviscas). The capital Adeje (City of Adeje) is located 4 km from the coast at 295 m altitude
and approximately 78 km to the capital of the island.
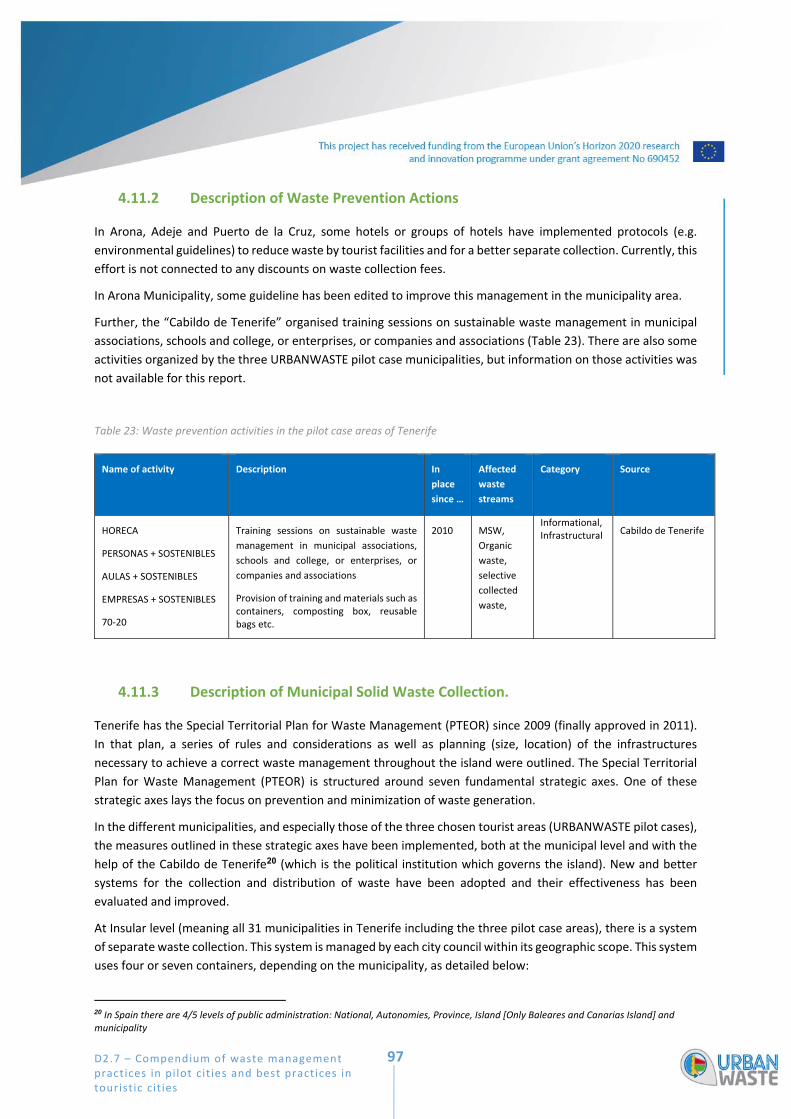
D2.7 – Compendium of waste management practices in pi lot cit ies and best practices in touristic cit ies
97
4.11.2 Description of Waste Prevention Actions
In Arona, Adeje and Puerto de la Cruz, some hotels or groups of hotels have implemented protocols (e.g.
environmental guidelines) to reduce waste by tourist facilities and for a better separate collection. Currently, this
effort is not connected to any discounts on waste collection fees.
In Arona Municipality, some guideline has been edited to improve this management in the municipality area.
Further, the “Cabildo de Tenerife” organised training sessions on sustainable waste management in municipal
associations, schools and college, or enterprises, or companies and associations (Table 23). There are also some
activities organized by the three URBANWASTE pilot case municipalities, but information on those activities was
not available for this report.
Table 23: Waste prevention activities in the pilot case areas of Tenerife
Name of activity Description In
place
since …
Affected
waste
streams
Category Source
HORECA
PERSONAS + SOSTENIBLES
AULAS + SOSTENIBLES
EMPRESAS + SOSTENIBLES
70‐20
Training sessions on sustainable waste
management in municipal associations,
schools and college, or enterprises, or
companies and associations
Provision of training and materials such as containers, composting box, reusable bags etc.
2010 MSW,
Organic
waste,
selective
collected
waste,
Informational, Infrastructural Cabildo de Tenerife
4.11.3 Description of Municipal Solid Waste Collection.
Tenerife has the Special Territorial Plan for Waste Management (PTEOR) since 2009 (finally approved in 2011).
In that plan, a series of rules and considerations as well as planning (size, location) of the infrastructures
necessary to achieve a correct waste management throughout the island were outlined. The Special Territorial
Plan for Waste Management (PTEOR) is structured around seven fundamental strategic axes. One of these
strategic axes lays the focus on prevention and minimization of waste generation.
In the different municipalities, and especially those of the three chosen tourist areas (URBANWASTE pilot cases),
the measures outlined in these strategic axes have been implemented, both at the municipal level and with the
help of the Cabildo de Tenerife20 (which is the political institution which governs the island). New and better
systems for the collection and distribution of waste have been adopted and their effectiveness has been
evaluated and improved.
At Insular level (meaning all 31 municipalities in Tenerife including the three pilot case areas), there is a system
of separate waste collection. This system is managed by each city council within its geographic scope. This system
uses four or seven containers, depending on the municipality, as detailed below:
20 In Spain there are 4/5 levels of public administration: National, Autonomies, Province, Island [Only Baleares and Canarias Island] and municipality
D2.7 – Compendium of waste management practices in pi lot cit ies and best practices in touristic cit ies
98
Mixed waste: grey container
Glass: green container
Paper and paperboard: blue container
Brics, plastic, cupboards, and metal: yellow container
Organic waste: brown (new; available only in some municipalities; also already conducting a pilot
composting experience)
Used food oil: orange containers (Currently, this service is only available in some municipalities but soon
it shall be available in all the municipalities.)
Used clothes: light blue container (only available in some municipalities)
At present, there is a Mechanical Biological Treatment Plant where the bulk waste is separated from the mixed
waste container (grey), separating it into different fractions that are reincorporated into the channels for
separately collected fractions, eliminating the remaining inert waste in landfills, separating the organic part and
bio stabilizing it in an aerobic plant and landfilling the resulting inert material.
In Tenerife, municipal solid waste (MSW) is defined the same way as presented in the Glossary of this report.
The definition of “litter” in the Glossary is quite similar to the one used in Tenerife. In Tenerife, litter is a part of
the fraction of MSW collected by other means, mainly manual collection supported by mechanical collection
(mechanical sweepers).
Municipal Waste Collection
The collection of MSW is under the responsibility of the municipality and cover households as well as similar
establishments (e.g. hotels, other tourist establishment, restaurants, bars, pubs, discotheque, shops, shopping
malls and other establishment related with tourism, also schools, offices, public institutions). The service of
collection of MSW is carried out by private enterprises on behalf of the municipal department of environment.
In Tenerife, several fractions of MSW are separately collected, mainly through kerbside collection: paper and
cardboard, glass, plastics, metals containers (packaging), green waste (tree‐cut, grass and bushes), domestic
waste on great format such as waste of electrical and electronic equipment (WEEE) (refrigerator, washing
machines), and other bulky waste (furniture, mattresses, beds, etc.).
There are other waste fractions, with own legislation, that must be collected by an authorized company for the
management of this fraction: biogenic waste (Hospitals, medical and veterinary clinics and office), some
dangerous and toxic waste (e.g. from car repair shops), remains of dead animals produced in enterprises
(slaughterhouses, fishmongers, malls, food industries), expired drugs and medicines, etc.
All household waste and bulky waste is collected by a private waste management company on behalf of the
local waste management authority, with the exception of the following separately collected fractions: Paper
and paperboard, glass and packaging, as well as fractions such as clothing / textiles and used vegetable oils.
Those fractions are collected by special waste management companies or by the waste management company
hired by the EPR system (extended producer responsibility).
D2.7 – Compendium of waste management practices in pi lot cit ies and best practices in touristic cit ies
99
There also exists one “clean point” (Puntos limpios) each in Arona and Adeje to dispose further waste fractions
in higher amounts. This service is only available for the citizens, for private companies have been set up a loading
and unloading plant (Planta de transferencia) only for several fractions. At the Clean Point it is possible to dispose
a large part of waste fractions (even some dangerous materials) e.g. WEEE, mineral oil, batteries, tonner, bulbs
and fluorescent lamps, cooking oil, paints, construction and demolition waste. Puerto de la Cruz has no waste
collection point, but the citizens can dispose the fractions mentioned above at a logistic centre in the next
municipality of La Orotava.
Besides these waste collection services, citizens can give away used clothes, shoes and textiles using special
containers (light blue; new and not available in all municipalities of Tenerife).
Kerbside collection is established for bulky waste, WEEE, green waste, and great format waste and plastic/metal
after calling a service number provided by municipality, paper/cardboard gets picked up at some commercial
areas, glass at restaurants and coffee shops and also cooking oils.
There also exist further options to give away certain types of waste: Clothing and other products can be given to
non‐governmental and charitable organizations that later prepare them for reuse. These organizations have
social centres where they do these operations: to select, clean, repair, and after these actions, give them to the
poor or needy groups (as it is done in CARITAS (Catholic association)), or sell them and use the benefits for social
groups with special problems (e.g. for abused women, rehabilitated addicts (REMAR), long‐term unemployed,
(ATARETACO), etc.).
Data of the composition of residual waste are not available. A new waste characterization is currently being made
but results were not yet available at the time of drafting this report.
Waste collection is reinforced during the touristic core season (if it is necessary or upon request). In the Canary
Islands, there are almost three high seasons: In wintertime from October/November to February/March, in
summertime from June to September/October and the week around Easter.
Waste treatment
Paper and cardboard, plastics, metals, batteries, paints and dissolvent are previous separated, reduced in
volume, stored and correctly packed until they are finally shipped per container to mainland Spain. Glass is
similarly processed and transported to the near island Gran Canaria for recycling.
Green waste is transported to composting plants. Currently only some municipalities that have a private or public
composting plant. The organic fraction of MSW is only treated in Santa Cruz de Tenerife, the capital of the island,
in a pilot plant within the environmental complex managed by the Cabildo de Tenerife. All the organic matter
collected on the island will be treated in public compost plants distributed throughout the island that are
scheduled to be built soon.
Cooking oil is transferred to plants in Tenerife producing biodiesel and ecological fuel (same for mineral oil).
While chemical and hazardous waste is eliminated or recycled by physical‐chemical methods at the mainland,
WEEE are transport after previous separation and storage to recycling plants on Tenerife island.

D2.7 – Compendium of waste management practices in pi lot cit ies and best practices in touristic cit ies
100
Waste treatment of bulky waste and great format waste covers the following steps: separation, preparation for
recycling, pressing or fragmenting, screening before mechanical separation of different components or materials
and further recycling of the useful fractions or disposal of non‐recyclable inert waste (landfilling).
Used clothing, shoes and textiles are provided for reuse or recycling.
4.11.4 Collection of waste from tourist establishments
The collection of waste from tourist establishments is also covered by municipal waste collection, therefore the
same waste collection and treatment principles as described above apply. However, the waste management tax
for private companies with large waste production is higher than the one for households (there is a municipal
ordinance that regulates these public prices). Some hotels do not use the municipal waste management system
but have contracts with private waste management companies.
In Arona, the collection of waste from tourist establishments is carried out by both the local waste management
authority and private enterprises. In Adeje and Puerto Cruz, only the local waste management authority is
responsible.
4.11.5 Description of waste from touristic ships
The collection of waste from touristic ships is under the responsibility of the port authority of Tenerife. Through
a public tender they have a contract with a private waste management company that is carrying out the
collection of the different fractions of waste produced on tourist vessels and cruise ships. The waste fractions
separately collected are mixed (residual) waste, paper and cardboard, metals and plastics, and glass.
Arona is the only of the three URBANWASTE pilot cases in Tenerife having a port for cruise ships (in Puerto de
los Cristianos). Though, only a small percentage of tourists travel to Arona per ship. The main port of the island
is located in the capital, Santa Cruz de Tenerife, where around 99% (in 2015; data from the Cabildo de Tenerife)
of tourists travelling on ships arrive.
In the port of Arona there further arrive a line of ferries (used by many tourists) and other types of tourist boats
that do occasional or thematic day trips (e.g. Pirate boats, round trips to photograph whales, dolphins and other
marine fauna, ships to look at the seabed, even submarines, and private boats).

D2.7 – Compendium of waste management practices in pi lot cit ies and best practices in touristic cit ies
101
4.12 Waste prevention and management strategies in the
URBANWASTE pilot cases
Through analysing the waste prevention activities and waste management systems in the 11 URBANWASTE pilot
cities, several waste prevention and management strategies could be identified. In different cities the sometimes
the same activities were implemented sometimes in different ways. Within the subsequent section the activities
are structured and summarised to point out the essential contents and main focus of the identified waste
prevention and management activities. The suitability of each of those strategies for the implementation in the
tourist context and therefore for URBANWASTE is discussed. This discussion does not claim to be comprehensive
but should give some impulses for further considerations.
4.12.1 Waste prevention strategies
In the URBANWASTE pilot cases the following waste prevention strategies have been identified:
Changing waste behaviour of citizens
Composting activities at the point of waste generation
Eco‐events
Promotion of re‐use activities
Promotion of tap water for drinking
Reduction of food waste
Reduction of paper waste from advertisements
Resource consciousness in procurement
Taxes on one way packaging
4.12.1.1 Changing waste behaviour of citizens
In several of the URBANWASTE pilot cases (e.g. Nice, Nicosia, Ponta Delgada, Syracuse) awareness‐campaigns
are/were implemented in order to change the waste behaviour of citizens. Those activities are mainly targeted
at citizens in general or at specific groups such as school children or immigrants for example and potentially
affect different fractions of MSW. Examples for such activities include:
Websites with information about waste prevention, reduction and reuse.
Promotion / Information campaigns on specific topics such as, for example, using reusable bags instead
of disposable plastic bags.
Activities in schools to educate children about waste prevention.
Participation in the "European Waste Prevention Week".
D2.7 – Compendium of waste management practices in pi lot cit ies and best practices in touristic cit ies
102
Ecofreguesia (‘Eco‐town’) contest: In all Azore islands, the Ecofreguesia contest – an environmental
award on the cleaner municipality ‐ was promoted. Municipalities need to develop or take act on
prevention measures to be able to score.
Courses for volunteer "environment inspectors": Syracuse municipality has organised some courses
open to everyone willing to be an “environment inspector”, as a volunteer. This action includes themes
such as the reuse.
Suitability for URBANWASTE
This strategy is considered potentially suitable for URBANWASTE: In order to change the waste behaviour of
tourists, awareness campaigns could be used to inform them about what they can do to prevent waste (e.g. use
public drinking water fountains to refill empty plastic bottles, use reusable bags, …).
Level of implementation: Awareness campaigns aimed at changing waste behaviour would have to be
implemented at municipality level, but the distribution of information would have to be carried out mainly via
tourist accommodation establishments or other tourist information points.
Aspects that should be considered when implementing such strategies:
How to reach tourists staying in private accommodation?
4.12.1.2 Composting activities at the point of waste generation
There has to be made a differentiation between home composting as waste prevention measure as less waste
reaches the official waste management system and separate collection of biowaste. In several URBANWASTE
pilot cases (e.g. Nice, Kavala, Syracuse, Florence) different examples for individual and collective composting
activities at the point of waste generation exist. Such activities can be targeted at individual citizens/households,
businesses (restaurants, hotels, catering services, …), schools, local authorities or citizens in a specific resident
area and affect the amount of organic waste that enters the municipal waste management system. Those
activities mainly include the provision of infrastructural solutions as well as information measures:
Composters are distributed on request (for free) to individual households/citizens, businesses (e.g.
restaurants, hotels, catering services), authorities, schools or put up in residence areas/block of flats
etc. by the city/municipality or local waste management authority. There are different technological
options for composters ranging from simple composting boxes / frames (primarily for individual "home
composting") to special composting machines with different degrees of efficiency.
Information/communication campaigns or leaflets to promote composting activities at the point of
waste generation: Such campaigns, amongst others, focus on providing information on how to do
""good composting"", how to use the produced compost, aspects of sustainable gardening etc.
Other activities: In Syracuse, the municipality allocated public space for establishing community
gardens. Organic waste originating in these gardens shall be composted on‐site and used as mulch for
the gardens. Such garden lots can also be allocated to the educational sector.
In Syracuse, the free distribution of technical solutions for composting at the point of waste generation is further
connected to a waste tax incentive (e.g. inclusion of a discount in the garbage fee by 15% to 20%).

D2.7 – Compendium of waste management practices in pi lot cit ies and best practices in touristic cit ies
103
Suitability for URBANWASTE
This strategy is considered potentially suitable for URBANWASTE: On‐site composting at hotels (hotel gardens)
and restaurants seems to be a potentially suitable strategy for URBANWASTE. Information campaigns on
composting (incl. technological solutions) could be targeted to accommodation establishments as well as food
and beverage providers for tourists to increase separate collection of the organic waste produced by tourists and
compost it on‐site. Such measures could further be connected to tax discounts (or other economic incentives)
which are received for implementation of on‐site composting.
Level of implementation: On‐site composting could be implemented at hotel level and for other establishments
providing food and beverage to tourists to catch the organic waste produced by tourists.
Aspects that should be considered when implementing such strategies:
What happens with the end product? Only if the produced compost is used this can be allocated to
waste prevention
How is the product quality (depending on quality of composting process)?
4.12.1.3 Eco‐events
In Nice, an environmental friendly approach for events was developed in order to reduce impacts on the
environment. Different tools have been created (a charter, informative material, a monitoring tool). This
approach contains action such as waste reduction by avoiding over‐packaged products and distributing reusable
cups and tap water to avoid plastic bottles. Waste streams affected by such a “green organisation” of events are
or example plastic waste or cardboard.
The Nice Jazz Festival, for example, is the biggest public event in the municipality. During this event, reusable
cups are distributed (in 2014, around 25 000 cups were sold and 13 000 returned).
Suitability for URBANWASTE
This strategy is considered potentially suitable for URBANWASTE as the “green” organisation of events may affect
the all over amount of waste produced by tourists. Especially the amount of waste of bigger events like sport or
music events attracting thousands of tourists can be highly influenced by the green event concept. But also small
events, even meetings can be oriented according the green event concept. Several aspects of this strategy such
as avoiding over‐packaged products and distributing reusable cups and promoting tap water to avoid plastic
bottles might be relevant for URBANWASTE in any case.
Level of implementation: Bigger Green Events could be implemented at municipality level. But also on hotel
level conferences or seminars can be organised as green event.
4.12.1.4 Promotion of re‐use activities
In several URBANWASTE pilot cases (e.g. Copenhagen, Florence, Nice, Santander, Syracuse) activities exist that
aim to promote the re‐use of (mainly) consumer products, thus affecting different fractions of MSW. The majority

D2.7 – Compendium of waste management practices in pi lot cit ies and best practices in touristic cit ies
104
of those activities is targeted at individual citizens, but measure aiming at the re‐use of construction materials
(e.g. bricks) are targeted to construction and demolition companies. Examples for such activities include:
Consumer products: Several activities are being implemented in order to encourage swap, repair and
re‐use in order to reduce waste generation and to extend the lifespan of the products. This includes
among other:
Establishing swap facilities at local recycling stations to separate items for reuse and
encourage citizens to hand in items that can be re‐used and establishing of exchange markets.
Establishment of repair centres.
Charity shops / second hand shops where people can sell and buy second hand clothes and
other items. This shops can be managed by private initiatives or charity organisations.
Other actions such as promoting furniture donation and videos promoting employment linked
to product re‐use. Besides, there are charity shops and in the Metropole, owned by private
associations.
Construction materials: The re‐use of bricks from demolition sites can be promoted through activities
initiated by local authorities (e.g. Copenhagen).
Re‐usable cups and dishes:
Reusable cups can be used in conference centres, amusement parks, at festivals etc. in order
to prevent waste generation. The cups can be returned for example to a vending machine that
also returns the deposit for the cups to the guests. The cups are washed and sent into
circulation again. Recyclable cups are used for all kinds of beverages (Copenhagen).
Syracuse municipality is carrying out a pilot action in schools to reduce plastic waste from
school canteens by using a reusable lunch box instead of disposable plastic dinner ware.
Reusable bags: In Nice, the use of reusable bags is promoted and reusable bags are distributed during
public events.
Reusable batteries: Nice promotes using reusable batteries within its directions.
Suitability for URBANWASTE
This strategy is considered potentially suitable for URBANWASTE: Activities aimed at re‐use that potentially could
be implemented in URBANWASTE could include, for example:
Swap facilities for products the majority of tourists might only need temporarily such as travel
guidebooks, city maps, bathing and beach gear such as air mattresses, snorkelling gear, etc.
Use of reusable cups and dishes in tourist attractions that provide food and drinks as well as in tourist
establishments (e.g. bars in hotel garden areas)
Providing reusable equipment like furniture, TV, minibar or computers from hotels to people in need or
social organisations instead of disposing them is another potential implementation option for this
strategy
D2.7 – Compendium of waste management practices in pi lot cit ies and best practices in touristic cit ies
105
Level of implementation: Swap facilities could both be installed at hotel or at municipality level. The use of
reusable cups and dishes could be implemented at the level of establishments providing food and drinks to
tourists (restaurants etc. but also hotels) but also on municipality level providing a reusable cup system on a rent
or leasing basis. The provision of reusable equipment from hotels to social organisation should be installed at
hotel level but may be promoted on municipality level.
Aspects that should be considered when implementing such strategies:
How to promote swap facilities among tourist? It is likely that accompanying information campaigns
have to be designed and implemented.
4.12.1.5 Promotion of tap water for drinking
In Florence and Nice different activities exist to promote the use of tap water instead of bottled water for
drinking, thus reducing mainly plastic waste. Those activities are mainly targeted to citizens and employees from
local authorities and municipality administration, but also can be used by tourists (public drinking water
fountains). Existing activities include:
Awareness campaigns to promoting the use of tap water for drinking (Nice).
Distribution of reusable drinking cups to employees from local authorities and municipality
administration in order to promote the use of tap water (Nice).
Installation of public drinking fountains: Through the installation of public drinking fountains providing
high quality tap water in main public spaces the use of plastic water bottles can be reduced (Florence).
Suitability for URBANWASTE
This strategy is considered potentially suitable for URBANWASTE: Through the installation of public drinking
water fountains (and accompanying information measures) tourists could be encouraged to refill their empty
plastic drinking bottles, thus, reducing PET‐bottles waste.
Level of implementation: Municipality level
4.12.1.6 Reduction of food waste
In Copenhagen, Nice and Santander different activities targeted at food waste reduction exist. The target groups
of those activities are citizens (in general), businesses, schools, markets and customers (citizens, tourists).
Through information and dialogue with citizens and businesses local authorities aim at reducing the amounts of
food turning into waste. Initiatives to meet this objective include:
Campaigns for reduction of food waste from households.
Awareness campaigns on food waste in primary schools (education).
Co‐operations between local authorities / interest groups / NOGs / others with businesses (e.g.
hospitals, retailers, markets, ...) to reduce food waste. Encouraging food donation is done as well.
Campaigns against food waste from markets.
D2.7 – Compendium of waste management practices in pi lot cit ies and best practices in touristic cit ies
106
Introduction of "doggy bags": Restaurants provide "doggy bags" to their customers in order to prevent
food waste. Customers can take home their food leftovers with these doggy bags.
Projects with retailers aiming at combating the wastage of perfectly edible food because of aesthetic
reasons by selling “ugly fruits”.
Suitability for URBANWASTE
This strategy is considered potentially suitable for URBANWASTE: Reducing food waste resulting from tourist
activities is useful (as food and beverage provision to tourists was identified to be one of the main hotspots for
waste generation by touristic processes) and seems feasible for URBANWASTE. Experience from Nice shows that
tourists highly use the doggy bags system. Even more the reduction of food waste in the kitchen itself shall be
emphasised as studies showed that high amounts of food waste already could be prevented in the kitchen.
Level of implementation: Measures aiming at reducing food waste from tourism are likely to be implemented
at the level of tourist establishments providing food and drinks to tourists (restaurants, hotels etc. but maybe
also certain tourist attractions). The organisation of information and guidelines for the food service sector at
municipality level assists the implementation of food waste prevention.
Aspects that should be considered when implementing such strategies:
Different reasons for food waste in hotels, restaurants, catering... have to be considered to have tailor
made prevention strategies
4.12.1.7 Reduction of paper waste from advertisements
In Nice, citizens/households can put up "No advertising" stickers at their front doors or mailboxes to show that
they do not want to receive any flyers, leaflets or similar advertisements, thus reducing paper waste. Such
stickers can be distributed to the citizens by local authorities or ordered on request.
Suitability for URBANWASTE
"no advertising" stickers as such seem not suitable for tourists.
However, measures targeted at reducing paper waste from flyers or leaflets for tourists (e.g. with information
about local tourist attractions etc.) are considered to be suitable for URBANWASTE.
Level of implementation: Leaflets, flyers etc. with information about local tourist attractions etc. would mainly
be distributed at accommodation establishments, restaurants, tourist attractions, local tourist information
offices etc. Measures aimed at reducing paper waste from tourist information materials would have to be
implemented at those locations.
Aspects that should be considered when implementing such strategies:
What other options than flyers/brochures are there to inform tourists about local attractions etc.?
Is it possible to have free and easily understandable IT‐solutions as information sources for tourists?

D2.7 – Compendium of waste management practices in pi lot cit ies and best practices in touristic cit ies
107
4.12.1.8 Resource consciousness in procurement
In some URBANWASTE pilot cases (e.g. Copenhagen, Florence, Ponta Delgada) activities for the integration of
waste prevention requirements into municipal procurement policies as well as into the procurement policies of
private businesses to prevent the generation of different types of waste (e.g. plastic waste) exist. For this
purpose, local authorities can enter into partnerships with private players. Usually, some kind of green public
procurement manuals/guidelines are developed. Such guidelines are related to the procurement of (amongst
others): Food and groceries, transport, building and construction materials, sustainable wood, cleaning products,
kid’s products, IT, lighting, kitchen equipment, paper and printed matter ...
Suitability for URBANWASTE
This strategy is considered potentially suitable for URBANWASTE: Within the scope of URBANWASTE it seems
possible to promote resource consciousness in procurement amongst tourist accommodation establishments as
well as food and beverage providers for tourists. Partially this could be reached by promoting environmental
certification labels/schemes.
Level of implementation: Measures aiming at increasing resource consciousness in procurement would have to
be implemented at the level of tourist accommodation establishments as well as food and beverage providers.
Aspects that should be considered when implementing such strategies:
What incentives could be offered to touristic establishments in order to promote green procurement
policies?
4.12.1.9 Taxes on one‐way packaging
In Ponta Delgada, economic (dis‐)incentives are used to change peoples' consumer behaviour: as in all Azores
island, there is an eco‐fee on plastic bags (0,05 €/bag) in large commercial establishments. This measure shall be
extended to all commercial establishments during 2017.
Suitability for URBANWASTE
This strategy is considered not suitable for URBANWASTE: Economic incentives to reuse e.g. plastic bags instead
of buying new ones (fee on plastic bags) could also stimulate tourists, but it is unlikely that such measures are
introduced only because of tourists. Such measures normally have to be implemented on a national level. Rarely
the implementation on islands seems to be also possible.
D2.7 – Compendium of waste management practices in pi lot cit ies and best practices in touristic cit ies
108
4.12.2 Waste management strategies
In the URBANWASTE pilot cases the following waste management strategies have been identified:
Awareness‐raising to change waste separation behaviour (of citizens)
Better control of certain waste streams
Biogas from organic waste
Deposit‐refund schemes for reusable packaging
Improve access to information about waste management system
Improving waste treatment and recycling
Increase waste separation in the business community
Provision of better waste separation options for citizens
Reduce emissions and noise of waste collection (service)
4.12.2.1 Awareness‐raising to change waste separation behaviour (of citizens)
In several of the URBANWASTE pilot cases (e.g. Copenhagen, Nicosia, Ponta Delgada, Tenerife) there are
awareness‐campaigns and education programmes to change waste separation behaviour of citizens (in general)
or specific target groups such as school children or immigrants. Awareness campaigns and similar can be initiated
by different actors such as local (waste management) authorities, interest groups/NGOs, stakeholders from the
waste management system (e.g. Green Dot System / SOCIEDADE PONTO VERDE (SPV), a non‐profit‐making
company with the mission to promote the selective collection, take‐back and recycling of packaging waste in
Portugal), etc. They can be aimed at various target groups (e.g. kids, citizens, immigrants, ...) and affect different
fractions of MSW. Examples existing in the URBANWASTE pilot cases are:
Teaching of school children how waste is separated correctly.
Educational programmes with information about sustainable waste management targeted at
participants from the immigrant community.
Training sessions on sustainable waste management in municipal associations, schools and college, or
enterprises, or companies and association.
Door‐to‐door information and awareness programme designed in a way that people well informed on
waste management issues from the neighbourhood influence next door neighbours (Ponta Delgada).
Some initiatives further aim at the development of joint solutions and shared experience on common issues
concerning waste in the city (e.g. public bins and containers, events, information, nudging etc.) in cooperation
with stakeholders.
Suitability for URBANWASTE
This strategy is considered potentially suitable for URBANWASTE: Information on correct waste separation could
be adapted to create an easily understandable "waste guide" for tourists.

D2.7 – Compendium of waste management practices in pi lot cit ies and best practices in touristic cit ies
109
Level of implementation: "Waste guides" for tourists etc. could be part of the information package tourists
receive in their accommodation establishment.
Aspects that should be considered when implementing such strategies:
Only effective if there are public bins for different waste fractions available in the pilot case and visible
to tourists.
4.12.2.2 Better control of certain waste streams
Copenhagen initiated measures aiming at a better control of certain (hazardous) waste streams (primarily of
construction and demolition waste as well as WEEE). Such measures are targeted at stakeholders from
construction/demolition and waste management.
Construction and demolition waste: Hazardous substances should be separated from the construction
waste so the clean building materials can be reused and recycled. Local authorities can ensure the best
possible management of demolition waste through cooperation with the construction sector and
surveys of own buildings. This can be reached, for example, by:
Environmental survey of municipal buildings
Introduction of strategies for different hazardous wastes such as PCB for example
Stricter environmental requirements for municipal construction projects
Better control of waste streams
WEEE: Local authorities in Copenhagen survey WEEE streams and make a special effort to avoid illegal
treatment and export of WEEE (surveillance and information).
Suitability for URBANWASTE
This strategy is not considered to be suitable for URBANWASTE as construction and demolition waste related to
touristic processes or the control of potentially hazardous waste streams by local authorities are not in the main
focus of URBANWASTE.
4.12.2.3 Biogas from organic waste
Copenhagen pursues the strategy to use organic waste for biogas production. Biogas can be used to fuel heavy
transport or waste management vehicles. Usually, separately collected organic waste is used for biogas
production. In Copenhagen, for example, food waste from a conference centre and selected hotels is collected
and used for biogas production. In Copenhagen further exists a pilot biogas plant that can also process unsorted
MSW. This pilot provides data and knowledge for further development and upscaling of biogas production from
unsorted MSW.
Separate collection of food waste (either separately collected from restaurants, canteens etc. or from
households together with green garden waste) is currently existing in Copenhagen, Dubrovnik, Florence, Kavala
and Lisbon.

D2.7 – Compendium of waste management practices in pi lot cit ies and best practices in touristic cit ies
110
Suitability for URBANWASTE
This strategy is considered potentially suitable for URBANWASTE: (Enforcing) The separate collection of organic
waste/food waste from establishments providing food and drink to tourists (restaurants, hotels, …) to use it for
biogas production could be an option to deal with organic/food waste from tourism. Food and beverage
provision for tourists has been identified as one of the touristic processes with major implications on waste
management.
Level of implementation: Municipality level (The implementation of this strategy would be under the
responsibility of the local waste management authority).
Aspects that should be considered when implementing such strategies:
Are there already biogas plants existing in the (surroundings of the) pilot case area where the organic
waste/food waste could be treated? Transport distance?
Is the installed capacity sufficient to treat an increased amount of food waste?
What happens to the residues?
Is composting the better option
4.12.2.4 Deposit‐refund schemes for reusable packaging
Deposit‐refund systems are a market‐based instrument creating an incentive to return a product. There is a
surcharge on products with reusable packaging when purchased and a refund is given when the reusable
packaging is returned. This strategy is mainly affecting packaging waste streams (glass, metals, plastics) and
targeted at consumers. From all URBANWSTE pilot cases Copenhagen is the only pilot case that indicated to have
such deposit‐refund schemes in place.
Suitability for URBANWASTE
This strategy is not considered to be suitable for URBANWASTE. Although this system could be used by tourists
as well it mainly has to be used by local citizens and businesses. Compared to local citizens and businesses, the
contribution of tourists to waste reduction achieved with this system is small. Additionally this strategy could
only be implemented on national level.
4.12.2.5 Improve access to information about waste management system
In Santander, citizens (and also tourists) have access to information about waste and bulk waste pickup, recycling
services, schedules and other services by using the app "Cuida Santander". This App further acts as a
communication channel from citizens to Santander City council.

D2.7 – Compendium of waste management practices in pi lot cit ies and best practices in touristic cit ies
111
Suitability for URBANWASTE
This strategy is considered not to be suitable for URBANWASTE: Normally tourists are not responsible for their
waste as it is disposed into the collection bins either by hotel personal or by the renter. The percentage of tourists
affected by such an app is very low.
4.12.2.6 Improving waste treatment and recycling
Copenhagen further currently pursues the strategy of improving waste treatment and recycling (mainly of bulky
waste and recyclables). Related measures include, for example:
Collection of bulky waste in fractions in order to enhance recycling of, for example, wood and other
materials.
Development of new treatment/recycling options (technologies) to drive development towards even
better exploitation of resources.
Establishment of new, innovative and eco‐efficient waste treatment centres that presents options for
separation and recycling. Recycling centres can be designed to be multifunctional, being a spot where
people can organise various events such as weekend outings for their families, flea markets, and waste
art exhibitions.
More reception control and fines at incineration plants: divert waste streams from incineration to
sorting/recycling. The City of Copenhagen, for example, wants to divert plastic waste away from
incineration to separate collection and reprocessing into a quality allowing for the manufacture of new
plastics."
Suitability for URBANWASTE
This strategy is not considered to be suitable for URBANWASTE. The establishment of new treatment / sorting /
recycling facilities could, in theory, be an option for pilot cases with less advanced waste management systems.
However, it has to be doubted that such measures will be implemented within the scope of URBANWASTE.
4.12.2.7 Increase waste separation in the business community
Waste separation (different fractions of MSW) in the business community can be stimulated by various measures
as the examples of Copenhagen and Nice show.
Technological measures to increase waste separation from businesses can be, for example, the
customization of recycling centres to meet the requirements of the business community.
Better waste separation in the business community can also be reached by intensified supervision and
enforcement of legal requirements.
Separation of waste from businesses for recycling can further be encouraged by dialogue and
information. This can include providing information about multifunctional waste solutions for new
businesses and cooperation with industrial organisations or advising businesses about better separation
of plastic waste (Copenhagen).

D2.7 – Compendium of waste management practices in pi lot cit ies and best practices in touristic cit ies
112
In Nice, an incentive scheme was implemented. The waste of some administrations and private
companies covered by the municipal solid waste was previously collected for free. With this special fee,
the collection service is now being charged to these establishments. The cost of the tax paid is
modulated according to the type of bins that are collected: the bins for recycled waste (packaging and
glass) have a lower fee than the bin for the residual waste. In this sense, this incentive scheme aims to
do a better waste separation, and to produce less residual waste.
Suitability for URBANWASTE
This strategy is considered potentially suitable for URBANWASTE: Especially information about multifunctional
waste solutions could be a support for hotels that are not concerned with waste management issues so far. Legal
requirements or economic incentive schemes would theoretically be options as well, but it is doubtable if such
measures could be implemented within the URBANWASTE project.
Level of implementation: Information campaigns could be targeted for example to all tourist establishments in
a given area. Legal regulations regarding waste management or incentive schemes could have the same target
group/area.
Aspects that should be considered when implementing such strategies:
Are there already information initiatives / materials for e.g. hotels? Do they work? Why do they not
work? What are the barriers for hotels?
4.12.2.8 Provision of better waste separation options for citizens
Copenhagen and Syracuse demonstrate that better separation of different fractions of MSW by citizens can be
reached by various (mainly technological) measures, such as:
Better separation options in block of flats and more options for separation in single family houses by
providing containers for (more) different waste fractions, better labels and signs.
Establishment of additional waste collection points/recycling hubs/"bring banks" in order to improve
separate collection of recyclables.
Establishment of collection points for green waste (from gardens) (e.g. at local recycling stations).
Improve waste collection service: Citizens can voluntarily order containers for additional waste
fractions.
As the descriptions of the 11 URBANWASTE pilot cases (Chapters 4.1 to 4.11) reveal, separate collection of
different fractions of MSW exists in all pilot cases. Differences, however, exist regarding which fractions are
separately collected (e.g. if there is a collection of recyclables only for single material streams such as glass,
metals, plastics etc. or if there is a collection of co‐mingled fractions of at least two recyclables) and the collection
systems used for specific waste fractions (door‐to‐door collection; brings‐systems such as collection points/bring
branks or recycling centres/civic amenity sites).
D2.7 – Compendium of waste management practices in pi lot cit ies and best practices in touristic cit ies
113
Separate collection of recyclables (single stream or co‐mingled) does exist in all URBANWASTE pilot cases.
Organic waste (meaning food and garden waste from households and/or green waste from private and public
gardens) is currently collected separately in all pilot cases except Nice and Syracuse.
As “food and beverage provision for tourists” can be considered as one of the waste relevant hotspots in touristic
processes (in addition to “accommodation”), food waste will be one of those waste fractions URBANWASTE is
focussing on. Separate collection of food waste (either separately collected from restaurants, canteens etc. or
from households together with green garden waste) is currently existing only in Copenhagen, Dubrovnik,
Florence, Kavala and Lisbon.
Suitability for URBANWASTE
This strategy is considered potentially suitable for URBANWASTE: Having many public bins for different waste
fractions available and visible might be an incentive also for tourists to do proper waste separation.
Level of implementation: Such measures would have to be implemented on municipality level, but the idea of
designing an "attractive" and "easy to understand" waste collection system could also be adopted for hotels as
well. Especially separate collection of food waste can be implemented easily at least at the hotel and restaurant
level
Aspects that should be considered when implementing such strategies:
Bins for different waste fractions have to be visible for tourists and not "hidden" in order to provide an
undisturbed scenic picture of a touristic hotspot etc.
4.12.2.9 Reduce emissions and noise of waste collection (service)
The City of Copenhagen will reduce emissions of CO2 and noise nuisances from collection vehicles. This will be
done through trials of alternative fuels and smarter collection methods as well as through stricter requirements
in tenders for collected waste. To receive this goal, the city further tries to also influence private sorting and
treatment plants.
Suitability for URBANWASTE
This strategy is not considered to be suitable for URBANWASTE as the reduction of emissions and noise of waste
collection (service) is not directly influenced by touristic processes.
4.12.3 Other initiatives with implications on waste generation and management
Eco‐labels and similar environmental certifications
Eco‐labels and guidelines for hotels provide minimum standards for sustainability in hotel establishments
including indicators for waste management performance amongst others. Among the waste prevention actions
implemented, the most common ones are:
Reusable dinnerware and cutlery

D2.7 – Compendium of waste management practices in pi lot cit ies and best practices in touristic cit ies
114
Waste assessment of building
Refillable toiletry dispensers
On‐site composting or composting at an offsite composting facility of the establishment’s food waste,
yard waste and biodegradable products.
In the URBANWASTE pilot cases Copenhagen, Dubrovnik, Florence, Nice, Nicosia, Ponta Delgada and Tenerife
the following eco‐labels, environmental guidelines and environmental management systems are used by tourist
establishments:
Eco‐labels: Green Key, The Nordic Swan, Green Globe, Det Økologiske Spisemærke (Organic Food Label,
DK), Miosótis Açores21
Environmental guidelines: TripAdvisor Green Leaders program
Environmental Management System: EMAS (Ponta Delgada for public administration), ISO 14001
4.12.4 Policy instruments for implementing waste prevention and management strategies
To assist future implementation of waste prevention and management strategies in the pilot cities the relevant
policy instrument will be explained in more detail based on examples of activities from the URBANWASTE pilot
cases for each instrument.
4.12.4.1 Information instruments
Public information and motivation measures aim at changing consumers’ lifestyle and behaviour as well as at
stakeholders from production, retail and the service sector in order to change production processes and the
range of products they offer or range of services they provide. Such instruments include, for example,
information programmes, awareness campaigns or education programmes and inform about consumer
behaviour, resource availability or ecological production technologies (Reisinger and Krammer, 2007).
In the URBANWASTE pilot cases several activities representing information instruments exist, aiming to:
Change citizens’ waste generation behaviour (information about waste prevention activities everyone
can implement to reduce the generation of specific waste streams such as food waste, paper waste
from advertisements or plastics (plastic bottles))
Change citizens’ waste separation behaviour
Inform citizens about the existing waste management system
Inform citizens and other stakeholders about how to do “good” (home) composting
Promote repair, reuse and donation of consumer products
21 Regional “eco label” for touristic facilities, intended to all regional housing units that implement good environmental practices, with the exception of campsites

D2.7 – Compendium of waste management practices in pi lot cit ies and best practices in touristic cit ies
115
The types of information instruments in place in the URBANWASTE pilot cases are various, including for
example:
Awareness campaigns for citizens (in general) or specific target groups (e.g. immigrants)
Education programmes
Training sessions on sustainable waste management for different target groups such as municipal
association, schools and colleges, or enterprises, or companies and associations
The distribution of information is implemented by the means of, for example:
Leaflets, brochures, other information material sent by (e‐)mail
Door‐to‐door information
On‐site training sessions and seminars
IT‐based solutions (e.g. “Cuida Santander” app, websites, …)
Awareness campaigns and similar can be initiated by different actors such as local (waste management)
authorities, interest groups/NGOs, stakeholders from the waste management system (e.g. Green Dot System /
SOCIEDADE PONTO VERDE (SPV), a non‐profit‐making company with the mission to promote the selective
collection, take‐back and recycling of packaging waste in Portugal), etc. They can be aimed at various target
groups (e.g. kids, citizens, immigrants, ...).
4.12.4.2 Regulatory instruments.
Regulatory instruments are designed to create a regulatory framework that promotes sustainable production
and a sustainable lifestyle. Free market development or the freedom of choosing an individual lifestyle shall not
be restricted but rather directed in the direction of more efficient resource use and less negative consequences
for health and the environment (Reisinger and Krammer, 2007).
Regulatory “command and control” instruments include quality standards, obligations and prohibitions/bans.
Quality standards allow the markets to operate on conditions which are known to all market participants and
apply equally to all market participants. Obligations (such as the obligation to use the best available technology
or to fulfil waste reduction targets, landfill or recycling targets etc.) shall promote environmentally‐friendly
behaviour and define legal responsibilities for certain actors (principle of producer responsibility) (Reisinger and
Krammer, 2007). Producer responsibility is a concept applied to some waste streams (e.g. for packaging
materials) and requires the producer to ensure that post‐consumer products are disposed of safely. This leads
to a clear distinction of competences between establishing the targets (authorities) and fulfilling the targets
(producers). A negative consequence could be that parallel collection systems are established, meaning one
collection system organised by the producers and another one organised by the local waste management
authority (Salhofer et al., 2010). Bans on toxic substances or other prohibitions (e.g. threshold limits, …) shall
prevent that dangerous substances are put into circulation (Reisinger and Krammer, 2007).

D2.7 – Compendium of waste management practices in pi lot cit ies and best practices in touristic cit ies
116
Selected examples from the URBANWASTE pilot cases for regulatory instruments with implications on waste
management22:
Increased control of certain waste streams:
In Copenhagen, local authorities survey WEEE streams and make a special effort to avoid illegal
treatment and export of WEEE (surveillance and information). Further, hazardous substances should be
separated from the construction and demolition waste so that clean building materials can be reused
and recycled. For this purpose, those waste streams are controlled more strictly, strategies for different
hazardous wastes such as PCB are introduced and stricter environmental requirements for municipal
construction projects are applied.
Stricter rules for reception control at incineration plants to divert waste streams from incineration to
sorting/recycling:
The City of Copenhagen wants to divert plastic waste away from incineration to separate collection and
reprocessing into a quality allowing for the manufacture of new plastics. Therefore, more and stricter
reception control and fines at incineration plants are applied.
Less exemptions from the obligation to pay waste taxes/fees:
In Nice, some administrations and private companies covered by municipal solid waste collection that
previously were collected for free are now being charged a special fee for the collection service.
4.12.4.3 Economic instruments
Economic instruments include both fiscal instruments and market development instruments. Fiscal instruments
are, for example, fees, taxes (e.g. landfill taxes), pay as you throw schemes (“polluter pays principle”) or deposit‐
refund schemes (Salhofer et al., 2010). The aim of fiscal instruments is the internalization of external costs or
external benefits in such a way that the resulting resource utilization corresponds to the economic optimum
(Reisinger and Krammer, 2007).
With market development instruments the state cannot only help to eliminate market barriers, but can also
actively guide market development. By applying public procurement policies, it can act, for example, as a
customer and thus create markets for low‐waste products or products from recycled materials. Further, it can
also contribute to the organization of markets for second‐hand goods and exchange platforms, as well as of
repair networks and provide financial support (Reisinger and Krammer, 2007).
Examples from the URBANWASTE pilot cases for fiscal instruments with implications on waste prevention and
management:
Eco‐fee on plastic bags:
In Ponta Delgada, economic (dis‐)incentives are used to change peoples' consumer behaviour: as in all
Azores island, there is an eco‐fee on plastic bags (0,05 €/bag) for large commercial establishments. This
measure will be extended to all commercial establishments during 2017.
Deposit‐refund schemes for reusable packaging:
Deposit‐refund systems are a market‐based instrument creating an incentive to return a product. There
22 No regulartory instruments aimed at waste prevention could be identified.

D2.7 – Compendium of waste management practices in pi lot cit ies and best practices in touristic cit ies
117
is a surcharge on products with reusable packaging when purchased and a refund is given when the
reusable packaging is returned. Such a system is currently existing in Copenhagen.
Deposit‐refund system for reusable cups used in amusement parks and similar:
In Copenhagen, recyclable cups are used for all kinds of beverages served within Tivoli (amusement
park) in order to prevent waste generation. The cups can be returned for example to a vending machine
that also returns the deposit for the cups to the guests. The cups are washed and sent into circulation
again.
Waste tax incentive to promote home composting:
In Syracuse, the free distribution of domestic composters on request was connected to other
instruments such as a discount in the garbage fee by 15% and 20% in 2016 (waste tax incentive).
Differentiated taxation / fee structure as incentive for better waste separation:
In Nice, an incentive scheme using different fees for different waste streams was implemented. The cost
of the fee paid is modulated according to the type of bins that are collected: the bins for recycled waste
(packaging and glass) have a lower fee than the bin for the residual waste. In this sense, this incentive
scheme aims to do a better waste separation, and to produce less residual waste.
Examples for market development instruments in the URBANWASTE pilot cases:
Public Procurement
Acting as a client of (big) infrastructure projects and as a consumer, the public administration can have a great
influence on the development of the economic system. In‐house regulations and internal procurement rules
make it possible to promote waste prevention and recycling without imposing any obligations on industry or
other consumers. According to Reisinger and Krammer (2007), the main obstacles why environmental criteria in
public procurement have so far not been used more widely are:
the expectation that environmentally friendly products are more cost‐intensive,
the negative image, which is associated with the concept of waste, or the fear that new environmental
problems are created with waste recycling,
insufficient support in the management of the tender (including time and money) or too little
importance for the company strategy,
the lack of training of the employees responsible for tenders on how to implement environmental
criteria in accordance with the award directives (greater risk of complaints).
Waste prevention and recycling measures where the public sector acting as a consumer can set a good example
include (Reisinger and Krammer, 2007):
Use of reusable containers and other reusable packaging,
Use of reusable dishes at public events,
Double‐sided use of (printing) paper,
Use of reusable hand towels,
Quotas for a minimum proportion of recycled building materials in public construction.
D2.7 – Compendium of waste management practices in pi lot cit ies and best practices in touristic cit ies
118
Green public procurement policies/guidelines exist in the URBANWASTE pilot cases Copenhagen, Florence and
Ponta Delgada.
The City of Copenhagen has set a paradigm for environmental and climate requirements that must be
integrated in any tender document from the municipality. Copenhagen is part of Partnership for Green
Public Procurement which is based on shared obligating green purchasing goals. The goals are
automatically adapted into the city’s tendering requirements.
Florence: In order to make the Green Public Procurement targets more compelling, the Tuscany Region
has issued the Regional Law n. 37/2012 on "Green purchases and guidelines for sustainable purchases
in the public administration.
Ponta Delgada: “Green public procurement guidelines” are an area still not very developed in Portugal.
The new public procurement code already has some guidelines about green procurement, but these
guidelines have to be developed and specified, so that purchase of goods and services can be made in
a simple and clear way. At the city hall, due to its environmental management system, a green
procurement code is in use since 2009.
4.12.4.4 Voluntary agreements
Voluntary agreements are agreements between some part of industry and the authorities (Salhofer et al., 2010)
or self‐commitments of individual industry branches (Reisinger and Krammer, 2007). According to Salhofer et al.
(2010) such agreements represent softer regulations than producer responsibilities. Examples for this type of
instruments are, amongst others, certifications based on specific standards (e.g. EMAS, ISO 14001) or eco‐labels,
which the producer is allowed to use only if he fulfils certain requirements.
In comparison to regulatory “command and control” instruments, voluntary agreements have the following
advantages (Reisinger and Krammer, 2007):
Less resistance to the introduction.
The monitoring effort may be less.
Less interference into the market.
More flexible implementation.
There is a stronger motivations of stakeholders to not only obey rules but to act proactively.
Can be used to communicate a specific business image.
The disadvantages of voluntary agreements are that there is less protection against free riders and voluntary
agreements are not enforceable, so it is not ensured whether they are actually fulfilled (Reisinger and Krammer,
2007).
Tourist establishments in the URBANWASTE pilot cases (Copenhagen, Dubrovnik, Florence, Nice, Nicosia, Ponta
Delgada and Tenerife) have the following certifications based on specific standards (e.g. EMAS, ISO 14001) or
eco‐labels:

D2.7 – Compendium of waste management practices in pi lot cit ies and best practices in touristic cit ies
119
Eco‐labels: Green Key, The Nordic Swan, Green Globe, Det Økologiske Spisemærke (Organic Food Label,
DK), Miosótis Açores23
Environmental guidelines: TripAdvisor Green Leaders program
Environmental Management System: EMAS (Ponta Delgada for public administration), ISO 14001
Exact numbers on how many tourist establishments in a given pilot case have such environmental certifications
or eco‐labels are not available for all pilot cases. More details on the number of hotels with eco‐labels etc. (if
available) can be found in the descriptions of Chapters 4.1 to 4.11.
4.12.4.5 Provision of infrastructure
Providing attractive and easy to use infrastructure can foster the prevention of waste. In the URBANWASTE pilot
cases the following examples for the provision of infrastructure with implications on waste prevention and
management exist:
Distribution of technological solutions for on‐site composting:
In Florence, Kavala, Nice and Syracuse on‐site composting is supported by the local
administration/authority. For this purpose, technological composting solutions are distributed on
request (for free) to individual households/citizens, businesses (e.g. restaurants, hotels, catering
services), authorities, schools or put up in residence areas/block of flats etc. by the city/municipality or
local waste management authority. There are different technological options for composters ranging
from simple composting boxes / frames (primarily for individual "home composting") to special
composting machines with different degrees of efficiency.
Installation of drinking water fountains:
In Florence, public drinking fountains are installed. Through the installation of public drinking fountains
providing high quality tap water in main public spaces the use of plastic water bottles can be reduced.
Installation of attractive and tailor‐made waste collection infrastructure:
An attractive and easy to use waste collection system is a key requirement to promote separate
collection ‐ and, thus, recycling activities in a subsequent step – and reduce the amounts of residual
waste.
Installation of better separation options in block of flats and more options for separation in single
family houses by providing containers for (more) different waste fractions, better labels and signs.
Establishment of additional waste collection points/recycling hubs/"bring banks" in order to
improve separate collection of recyclables as well as organic waste (food and garden waste) / green
waste from gardens.
Customization of recycling centres to meet the requirements of the business community.
Provision of infrastructure for reuse activities:
Copenhagen: Installation of swap facilities (e.g. at local recycling stations)
23 Regional “eco label” for touristic facilities, intended to all regional housing units that implement good environmental practices, with the exception of campsites
D2.7 – Compendium of waste management practices in pi lot cit ies and best practices in touristic cit ies
120
Nice: Initiation of repair networks
D2.7 – Compendium of waste management practices in pi lot cit ies and best practices in touristic cit ies
121
5. Best Practices for Waste Management
in Tourist Cities
Beside the review of existing waste prevention and management examples in the pilot cities an international
review on best practice examples related to the tourism sector was performed‐ The following examples are based
on a secondary literature research, with following search terms: Waste management tourism; waste prevention
in tourism; standards and certifications in tourism; best environmental practices in hotels/tourism; best practice
waste management measures in tourism;
The focus of the desktop research was also laid on case studies, which have dealt with similar topics. The best
practice examples mentioned below have been selected mainly for their “visibility”. There might have been other
good examples that however could not be found.
5.1 Best practices for waste management suitable for
URBANWASTE
5.1.1 Eco‐tourism certification scheme and labelling
Certification schemes play an important role in improving the environmental performance of the tourist industry.
In this way they partly make great demands on a waste management system of the stakeholders involved.
Certification can be differentiated into Environmental Management System, EMS, certification (e.g. EMAS; ISO
14001) that essentially associated with monitoring and reporting of environmental performance, and
environmental standards that cover requirements for implementation of specific environmental management
practices or compliance with particular environmental specifications. However, there remains a variety of rigour
criteria, and their verification, across standards. The most rigorous standards are the EU Ecolabel (EU Flower),
the Nordic Swan and the Austrian Ecolabel that include extensive mandatory criteria related to respectable
environmental practices and performance levels (Styles et al., 2013). Many other standards are typically less
quantitative and/or less transparent, and differ of their level of implementation.
Table 24 summarizes several sustainability standards and eco‐tourism labels of European countries. A brief
description and references of waste management requirements are given beside.
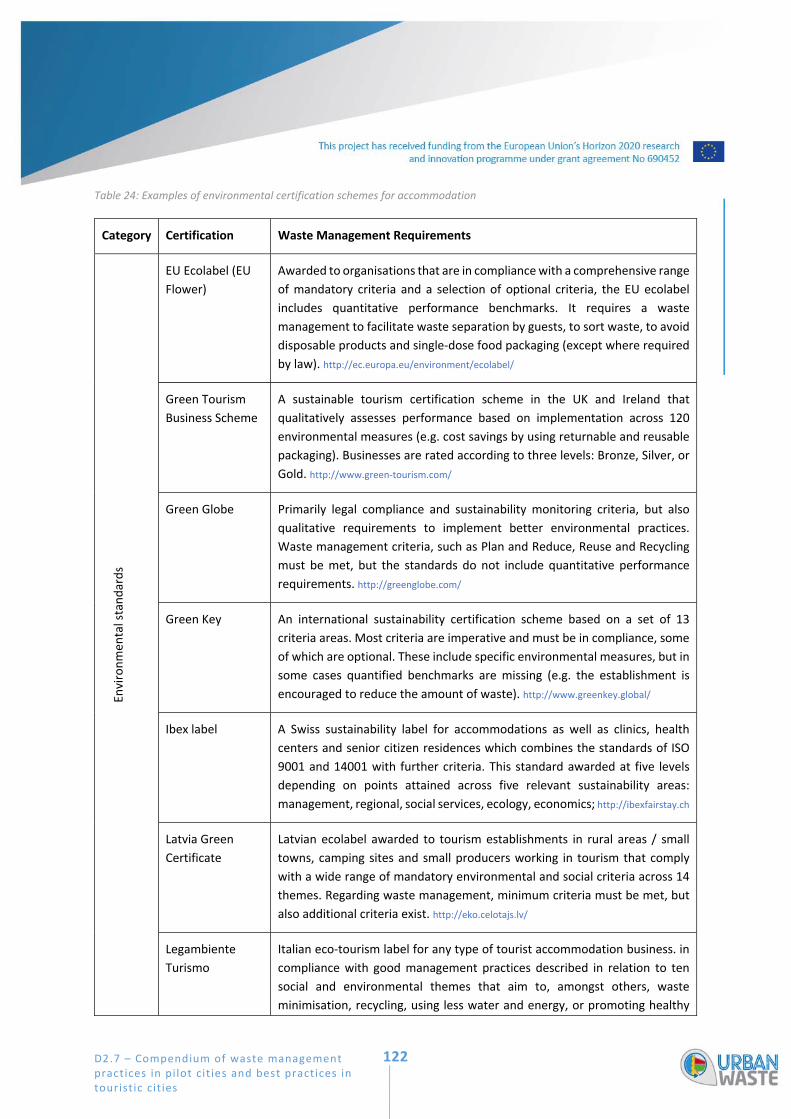
D2.7 – Compendium of waste management practices in pi lot cit ies and best practices in touristic cit ies
122
Table 24: Examples of environmental certification schemes for accommodation
Category Certification Waste Management Requirements
Environmen
tal standards
EU Ecolabel (EU
Flower)
Awarded to organisations that are in compliance with a comprehensive range
of mandatory criteria and a selection of optional criteria, the EU ecolabel
includes quantitative performance benchmarks. It requires a waste
management to facilitate waste separation by guests, to sort waste, to avoid
disposable products and single‐dose food packaging (except where required
by law). http://ec.europa.eu/environment/ecolabel/
Green Tourism
Business Scheme
A sustainable tourism certification scheme in the UK and Ireland that
qualitatively assesses performance based on implementation across 120
environmental measures (e.g. cost savings by using returnable and reusable
packaging). Businesses are rated according to three levels: Bronze, Silver, or
Gold. http://www.green‐tourism.com/
Green Globe Primarily legal compliance and sustainability monitoring criteria, but also
qualitative requirements to implement better environmental practices.
Waste management criteria, such as Plan and Reduce, Reuse and Recycling
must be met, but the standards do not include quantitative performance
requirements. http://greenglobe.com/
Green Key An international sustainability certification scheme based on a set of 13
criteria areas. Most criteria are imperative and must be in compliance, some
of which are optional. These include specific environmental measures, but in
some cases quantified benchmarks are missing (e.g. the establishment is
encouraged to reduce the amount of waste). http://www.greenkey.global/
Ibex label A Swiss sustainability label for accommodations as well as clinics, health
centers and senior citizen residences which combines the standards of ISO
9001 and 14001 with further criteria. This standard awarded at five levels
depending on points attained across five relevant sustainability areas:
management, regional, social services, ecology, economics; http://ibexfairstay.ch
Latvia Green
Certificate
Latvian ecolabel awarded to tourism establishments in rural areas / small
towns, camping sites and small producers working in tourism that comply
with a wide range of mandatory environmental and social criteria across 14
themes. Regarding waste management, minimum criteria must be met, but
also additional criteria exist. http://eko.celotajs.lv/
Legambiente
Turismo
Italian eco‐tourism label for any type of tourist accommodation business. in
compliance with good management practices described in relation to ten
social and environmental themes that aim to, amongst others, waste
minimisation, recycling, using less water and energy, or promoting healthy
D2.7 – Compendium of waste management practices in pi lot cit ies and best practices in touristic cit ies
123
food and typical local produce and products. http://legambienteturismo.it/en/home/
Nordic Swan Nordic Ecolabelled hotels have to be in compliance with a comprehensive
range of mandatory criteria and a selection of optional criteria. The label also
includes quantitative performance benchmarks (e.g. limit value for hotels is
set at 0.20 kg unsorted waste per hotel guest). http://www.nordic‐ecolabel.org/
Travelife
Sustainability
System for Hotels
An international tour operator (supply chain) driven sustainability
certification depending on performance across a range of environmental and
social criteria. From 2014 onwards all Travelife audits are now undertaken
against the new criteria that are more extensive and demanding. http://travelifecollection.com/awards
Sustainable Tourism Education Program
Designed by Sustainable Travel International, the Sustainable Tourism Education Program, abbreviated STEP, is
based on a framework that addresses all aspects of sustainability for tourism businesses or destinations and
serves as a practical tool for assessment, benchmarking and education. The focus of the program particularly is
on improving business systems and greening workplace practices. Based on a comprehensive set of sustainability
criteria and indicators, STEP provides a number of online tools that help businesses manage and improve their
environmental issues and impacts, e.g. energy‐use, waste‐reduction, water consumption, sustainable sourcing
and carbon footprint.
The process includes, amongst others, education and training programs, a self‐assessment framework for
measuring and benchmarking up to a globally recognized eco‐certification. The latter requires independent,
third‐party verification of business practices.
5.1.2 Best practice of local and accommondation activities
Over the last few decades tourism has developed into one of the world’s most important industrial sectors, but
such a rapid growth has been coupled with substantial and irreversible direct and indirect environmental,
economic and social impacts, especially on communities where tourism has established. Solid waste is a generally
identified and ever increasing aspect of tourism, therefore waste management is an increasing complex
challenge facing the municipalities or those responsible in the affected areas (Budeanu, 2005; Ezeah et al., 2015).
In context to a sustainable tourism, it would be necessary to start by the places where waste is produced and
that are in many cases hotels.
The hotel industry can considerably reduce their waste generation by implementing and following a waste
management system that is designed by the concepts of reduce, reuse and recycle (Greenhotelier, 2004).
Approximately 54 percent of a hotel's solid waste can delivered to recycling or reuse processes (Alexander, 2002),
Bohdanowicz (2005) also estimated those waste fractions by 50‐60 percent in accommodation facilities.
Hotels are often limited not only by barriers to sorting and recycling their waste, but also by the waste
management infrastructure in their locality, commonly owned and operated by the local authority, especially if
there no other purchaser for waste fractions that are not collected and treated by the local system.

D2.7 – Compendium of waste management practices in pi lot cit ies and best practices in touristic cit ies
124
Styles et al. (2013) identified that “a relevant starting point for waste prevention, sorting and recycling is to
record on‐site waste generation by category and source”. In addition, it may be useful to consider local reuse
and recycling options, or rather seek opportunities for product reuse before waste is sent for recycling, e.g.
returning packaging to suppliers. To implement a successful waste sorting and recycling plan, it demands a
committed management to coordinate technical and human resource requirements across all departments,
including educational measures, such as staff trainings, and time allocation (Table 25).
Table 25: Best practice measures to separate and recycle waste for accommodations (Styles et al., 2013)
Department Measure Description
All (management
led)
Develop waste inventory and
identify options
Survey of all areas and processes to identify types and
sources of on‐site waste generation. Identify waste
recycling and packaging return options available
locally
Monitoring and reporting Continuously monitor and periodically report waste
generation and collection by fraction
Procurement Procurement selection Select products and packaging made from recycled
and recyclable material
Housekeeping Waste bins Install separated waste collection bins in rooms
Waste collection in rooms Separate waste during room cleaning into fractions
collected separately from accommodation premises
Back‐of‐house waste
management
Separate waste arising from public areas, maintenance
of outdoor and indoor facilities, and other back‐of‐
house areas into appropriate fractions for recycling
and correct disposal
Catering Green procurement Consider packaging volume, production impact and
recyclability when assessing products for green
procurement
Separation Install and train staff to use conveniently located bins for separate collection of glass, plastics, and paper and cardboard in kitchen and dining areas.
Reception and
public areas
Collection Points Install collection points for paper and magazines,
batteries and other hazardous waste

D2.7 – Compendium of waste management practices in pi lot cit ies and best practices in touristic cit ies
125
Below, some examples of best practices for waste management in the hotels are given:
Hilton Slussen Hotel, Sweden
The Hilton Slussen in Stockholm sorts waste into 26 different fractions. Since the introduction of a sorting and
recycling scheme in 1997 more than 125 tonnes per month sent to landfill were reduced by 76 %, to 0.3 kg per
guest‐night. In addition to cardboard which were recycled and wooden pallets which were diverted for heating
buildings outside Stockholm, other combustible materials were sent to generate district heating for apartments.
Also candle stumps were donated to day care centres and to a church to be made into new candles for sale.
Further, separated organic waste is used for biogas production, food residues are sent to farmers outside
Stockholm for anaerobic digestion (Baker, 2006; Styles et al., 2013).
The Savoy, United Kingdom
The Savoy hotel in London implemented a comprehensive waste recycling programme in accordance Fairmont
Hotel's Sustainability Partnership Program, upon reopening in 2010 following a major refit (Fairmont hotels and
resorts, 2016a). This included extensive and ongoing staff training, e.g. in form of daily staff briefings incorporate
environmental management topics, and the introduction of a waste separation, reuse and recycling system.
Consequently, over 95 % of non‐food waste is now diverted from landfill, and unsorted waste generation could
be reduced to approximately 0.3 kg per guest‐night. Separated organic waste amounting to a further 344 tonnes
per year is used for energy recovery.
The whole waste of the hotel is separated into eight fractions: cardboard and paper, glass, wood, plastic and
metal, cork, organic oil, batteries, and electrical. Already housekeeping staff recover recyclable waste from room
bins, while a waste management company undertakes further separation after collection (Fairmont hotels and
resorts, 2016b; Styles et al., 2013).
Following, some key actions of The Savoy’s waste management programme are given:
purchasing department reduces packaging as part of green procurement;
instigation of 'Food waste to Renewable Energy Scheme' that sends separated organic waste for heat
and electricity generation by PDM Group;
installation of an 'Oilsense' management and collection system for used cooking, to enable efficient
reuse as biodiesel;
an integrated pest management programme, operated by Ecolab Pest Control, minimizes hazardous
waste generation;
redistribution of household goods and unclaimed lost property items to charity
Tower Hotel, United Kingdom
In 2006 the Tower Hotel in Perthshire (Scotland) installed an automated composting system that consumes less
than 4 kWh per day and converts organic waste to compost in around 14 days (compared with 12 – 18 months
for the basic compost heaps it replaced). The output material is screened for size, greater fractions are returned
for further composting while finer material is stored for maturation for a further two months before use on the
hotel grounds. Through this procedure 2.5 m3 (1.25 tonnes) of vegetable waste from the hotel kitchen and 6 m3
(1.25 tonnes) of garden waste could be processed to produce 1.5 tonnes of compost in the first year after
installation (HUB4, 2007; Styles et al., 2013).
D2.7 – Compendium of waste management practices in pi lot cit ies and best practices in touristic cit ies
126
5.1.3 Best practice of municipal or regional waste management
A universally transferable best practice model of municipal or regional waste management could not be
identified, because each area is dependent of its own characteristic limitations. Common barriers or waste
management problems of such locations are (Santamarta et al., 2014):
Reduced number of facilities for treatment or disposal
Significant variations in waste arising based on tourism season
High population density
Difficult to achieve economies of scale
Limited territory to locate landfills
Transportation of waste to the mainland (islands)
According to Practical Action Nepal (2008) and Santamarta et al. (2014), some examples of generally valid
requirements for a sustainably waste management system are minimisation and separation/segregation of
waste at source, an effective collection system, the establishment of recycling and treatment plants, greater
participation of local communities, support of public‐private partnerships and short‐term and long‐term
planning.
As mentioned above, the on‐site composting systems of the Tower Hotel may be seen as a leading
implementation of a closed‐cycle principle. Two further examples of sustainable waste management measures
are presented subsequently:
Selective collection of organic waste for recycling in tourist areas (SCOW)
This European project from 2013 to 2015, funded by the Cross Border Cooperation in the Mediterranean (ENPI
CBCMED) Programme, aims to develop low cost, technically simple and high quality bio‐waste collection and
recycling models in territories with touristic areas and agricultural activity in Mediterranean zones.
SCOW’s goal is to define and built up an innovative and sustainable bio waste management system through
effective collection and waste treatment into decentralised small‐scale composting plants, situated near the bio‐
waste production areas, and, at the same time, where the compost could be applied.
Amongst others the project includes following outputs:
Database of Good Practices
Technical study of the key elements and management options
Guidelines defining the SCOW management model and monitoring protocols
Handbook on small‐scale composting facilities management / Vademecum
Database with the result indicators of the implemented management models.
Recovery of used cooking oil
Another opportunity to selectively grade incurring wastes is the separation of useful organic fractions such as
cooking oils, fats and grease before organic waste is send to anaerobic digestion or composting. Oils can be
stored in secure containers for collection by waste disposal contractor specialising in the production of biodiesel,
or animal feed, soap or cosmetics production. Oils traps, fitted in kitchen drains, can also be another option for
recovery (Styles et al., 2013).

D2.7 – Compendium of waste management practices in pi lot cit ies and best practices in touristic cit ies
127
5.2 Best practices for waste prevention suitable for
URBANWASTE
The first step for waste prevention measures in accommodations and touristic destinations is to elaborate an
inventory of the waste types and sources. This should help to locate avoidance potentials of waste generation in
different departments. Table 26 gives an overview of items to prevent, items to select and actions to avoid waste
in accommodation. Following different best practice guidance and guidelines addressing (food‐) prevention
measures in tourism sector are given.
Table 26: Best practice to prevent, select and take actions to avoid waste in accommodation (International Tourism Partnership, 2008; The Travel Foundation, 2016)
Prevent Select Do
Bought‐in bottled water
Single‐use hygiene products
Single‐portion food products
Disposable plates, cups and
cutlery
Excessive use of paper napkins
Items with unnecessary or
excessive packaging
offering newspapers and
magazines
refillable amenity dispensers
in guest bathrooms
food sold in bulk packaging
where appropriate
cloths instead of disposable
paper towels
durable coasters instead of
paper ones
electrical resistance or
refillable burners instead of
disposable heating fuel
cartridges for buffet lines
cloth bags or baskets instead
of plastic bags to collect and
return towels, linens and guest
laundry
refillable printer and copier
cartridges
rechargeable batteries
provide guests with filtered tap water
provide guests with reusable glasses and cups in rooms
put condiments and food
servings in refillable containers
purchase chemicals in bulk and
dispense them from refillable
pump bottles or containers
give preference to vendors that supply their products in
returnable and reusable
containers
minimise the use of hazardous
chemicals (e.g., drain cleaning
chemicals, solvents and bleach)
provide electronic information
and newspapers
print double sided
disposable plastic
identify reuse possibilities

D2.7 – Compendium of waste management practices in pi lot cit ies and best practices in touristic cit ies
128
Cyprus Tourism Organisation, Cyprus Sustainable Tourism Initiatives and The Travel Foundation (2013): Waste
Mapping Guidance for Hotels in Cyprus: Saving money and improving the environment (CYP)
This guidance document addresses hotel operators and other organisations working in the Cypriot tourism
industry to highlight the financial and environmental benefits of undertaking waste mapping as part of their on‐
going business operations. Waste mapping is designed to identify the sources, types and quantities of waste that
can be attributed to tourism. The mapping approach allows them to examine where and how waste arises and
present this visually in a way that can help to identify hidden costs of waste (e.g. purchasing costs). The process
should help to prioritise areas where simple actions can be taken to minimise waste, save money and achieve
lasting sustainable waste management (Owen et al., 2013).
Some of these simple recommendations to reduce food waste mentioned in the Waste Mapping Guidance are
given in table Table 27.
Table 27: Quick win opportunities for hotels
Hotel area Example ‘quick win’ opportunities Benefits of taking action
Food & beverages Display food in smaller trays enabling
additional items to be stored appropriately in
the kitchen, thereby extending the shelf‐life of
the product, and enabling unused food to be
chilled for use the following day/ meal
Reducing food waste has financial
benefits as outlined above.
Removing individual portions and
sachets can often save money as
well as reducing waste.
Data on the number of portions
remaining can be fed into future
menu planning and identify those
meals that do not sell as
frequently as others.
Providing smaller plates and serving spoons for
guests as research has identified that this can
cut food waste by 20%.
Ask whether the customer actually wants
accompaniments for meals, e.g. bread, salad
garnish, vegetables rather than simply serving
them automatically.
Remove individual portions and sachets of
condiments and replace with dispensers,
pourers and shakers.
Monitor stock control and overproduction of
waste regularly, for example at the end of each
sitting the number of portions remaining can
be recorded.

D2.7 – Compendium of waste management practices in pi lot cit ies and best practices in touristic cit ies
129
Further, other options to reduce food waste are mentioned in the Guidance:
Composting food waste such as vegetable peelings and other food preparation waste is ecologically
worthwhile than disposing of waste to landfill. Composting food waste on site also has the benefit of
producing a valuable product that can be used in the hotel gardens as a plant fertiliser.
Donation of unused, over produced (surplus) food to charities. Local charities, soup kitchens or other
organisations often accept and allocate food donations for people in need.
Cyprus Tourism Organisation, Cyprus Sustainable Tourism, Travel Foundation (2013):
Guidelines for meeting the Cyprus Tourism Organisation minimum standards for sustainability in hotel
establishments (CYP)
This programme builds a framework of mandatory minimum standards for sustainability to support Cyprus as a
destination in becoming a leader in sustainable tourism.
Launched by the Travel Foundation in 2013, these guidelines will encourage hotels in Cyprus to take steps
towards improving their sustainability performance and cover some measures to manage and prevent (food‐)
waste partitioned in different departments where waste streams are generated such as housekeeping, laundry,
food and beverage, purchasing, maintenance and security.
In Table 28 several tips for waste prevention in hotels are listed.
Table 28: Food waste prevention measures allocated to different departments
Department Waste
Reception and
office‐ based stuff
Only print what you need and if needed, double sided
Use email rather than printed communication
Housekeeping Use bins that do not require a plastic bag liner. If one is needed (e.g. bathroom bin),
only replace when soiled or damaged
Collect any recyclables from guest rooms (paper, cans, glass, plastic) separately to
general waste
Use refillable amenity dispensers
do not replace half used toilet rolls until checkout and then use these back of house
Food and
beverages
Avoid disposable / single use items: plates, cups, cutlery, plastic straws, aprons, hats,
heating fuel cartridges etc.
Use reusable placemats, tray covers, coasters and linen napkins
Use storage containers instead of plastic wrap, foil etc.
Separate waste into reusable, returnable and recyclable items: cardboard, paper,
plastic glass, metals, used cooking oil, fruit and vegetable waste
Bulk purchase to reduce packaging and work with suppliers to reuse or return
packaging
Purchasing Buy reusable kitchenware, crockery and durable cups

D2.7 – Compendium of waste management practices in pi lot cit ies and best practices in touristic cit ies
130
Buy cleaning solutions in concentrated form
Avoid purchasing single‐use disposable items
Buy rechargeable batteries instead of disposable
UNITED AGAINST WASTE (AUT)
United Against Waste (UAW) was launched in 2014 in form of a cross‐border cooperation platform. Companies
from the food service market as well as the federal government, the provinces, science and NGOs are pursuing
an ambitious goal: reduction of avoidable food waste in kitchens by half by 2020.
In the KÜCHENPROFI[T] advisory service, independent kitchen professionals assist in optimizing the use of goods.
Two information brochures and a kitchen poster provide plenty of inspiration and tips on how to save food waste
in the kitchen every day. Numerous examples of practical solutions are also available online, some of these tips
are summarized in Table 29. Likewise, UAW implemented an online tool for waste analysis: A quick test allows
the calculation of the avoidable food waste in our company and a comparison with the branch average with only
a few inputs. Interested hoteliers and other stakeholder of the gastronomy can take the opportunity of
borrowing equipment for waste ascertainment to analyze food waste in their company and find out where their
savings potential lies (UAW, 2017).
Table 29: UNITED AGAINST WASTE‐ practical solutions for food waste prevention in gastronomy
measures for solutions description
Menu card /
food offer
Adaption of the
food portion
Weight the individual components of the dishes and analyse the
leftovers to adapt standard portions.
Food size selection
for guests
Introduce different portion sizes and choose the right wording for it.
Free food seconds Serve smaller portions and offer instead seconds for free.
Variable side dish Guests should have a choice of salad, vegetables or other side dishes.
Boxes for leftover Guests can take leftovers to their home.
buffet Adjustment of the
container size
Use lower or separable containers, thereby you can offer less food at
the end of the buffet.
Beverages from
vending machines
and tap systems
Through the use of coffee machines or beverage dispenser each guest
can take as many drinks as needed.
Clear description of
the dishes
Mark the dishes at the buffet with their ingredients and spices as clearly
as possible, so the guests have to try less, they just take what tastes
them

D2.7 – Compendium of waste management practices in pi lot cit ies and best practices in touristic cit ies
131
Reduction of edible decoration
Avoid salad, fruit and vegetables as optical decoration, with decorative
oils, pasta or preserving glasses, you can create a delightful buffet
without having to throw away valuable food.
Fresh food preparation by front‐cooking
Prepare certain hot dishes right in front of the guest.
This makes it easier to dispense appropriate portions.
preparation
of food
Separating and
optimized
utilisation
Insert containers in the kitchen to separate useable from not utilizable
ones.
Into the cool box Vacuum utilizable preparation residues and freeze them for later
processing.
Information for
personnel
Conduct internal trainings: e.g. kitchen staff learn to use as much as
possible of the food
food over‐
production
Less food pre‐
production
Reduce the amount of pre‐production and produce only more if it is
really necessary.
Leftover creations Process not distributed food into new dishes (e.g. vegetables side
dishes for a stew
food donation Numerous charitable institutions are organisations are grateful for
prepared food.
Food for employees Offer prepared but not distributed food to your personnel.
Preservation of
food
By vacuuming and freezing, sous vide cooking or cook & chill, food
usually can be served without a loss of quality at a later time.
food
management
Storage place
management
“First in, first out” ‐ check the food stock daily and continuously adjust
the menu. Use the food that is first purchased or whose shelf life is
limited.
Awareness and
education
Awareness raising training courses for kitchen and service staff to avoid
food waste, to improve efficient use of food products and to visualize
that food is precious.
Food & beverage‐
controlling
Input‐output analysis of dishes, selection of food according to weather
and season or production planning based on bed occupancy rate are
only a few measures which help to match supply and demand in a
better way.
D2.7 – Compendium of waste management practices in pi lot cit ies and best practices in touristic cit ies
132
Fair Hotel reducing packaging waste, Italy
The main objective of the Fair Hotel project is to reduce the production of waste packaging in the hotels and
enhance the hotel offer in an environment friendly way. Origin of the initiative was the high amounts of waste
in Piemonte Region, where 2.270.000 tons of urban waste have been produced (522 kg/inhabitant), more than
30% of the whole waste was represented by packaging. At the monitoring phase various waste streams were
identified and determined, on this basis of "standard experience", there have been individuated 12 meaningful
actions to minimize waste of packaging in hotels. On average more than 210/kg/year of plastic waste, 49 /kg/year
of paper waste and 47/kg/year of polylaminate material could be avoided in the participated hotels.
http://www.prewaste.eu/index.php?option=com_k2&view=item&id=153:fair‐hotel‐reducing‐packaging‐waste&Itemid=83
“Menu Dose Certa”, Portugal
Intermunicipal Waste Management of Greater Porto (LIPOR), responsible for the management, recovery and
treatment of the Municipal Waste produced in the eight associated municipalities around Porto, won the
Portuguese Sustainable Development Awards for its campaigns on waste prevention in 2009. One of the main
goals of LIPOR s is the reduction of annual waste generation by 100 kilos per person. The city of Espinho, part of
greater Porto and with one of the highest bio waste generation, was selected for the pilot “Menu Dose Certa” or
Right Serving Menu. The pioneering project aims to support restaurants in creating menus that avoid food waste.
By this way LIPOR’s ambitions are to reduce food waste by 48,5 kilos per year per restaurant client by 2011 and
attempts to change attitudes and behaviours by raising awareness on the problem of food waste.
http://ec.europa.eu/environment/waste/prevention/pdf/MenuDoseCerta_Factsheet.pdf
D2.7 – Compendium of waste management practices in pi lot cit ies and best practices in touristic cit ies
133
6. Concluding Remarks
A comparative policy review of national waste management strategies and targets in the European Union (EU)
showed that there is no separate field of policies and instruments for waste generated by tourism neither on
European level nor on the national level of EU member states. On the everyday level of implementation, specific
practices to manage tourist waste, if existing at all, are usually designed and implemented at city or even local
level and are linked to features of the local societal and geographical context.
Currently there are no waste related activities targeted at waste from ships. As several pilot cities are important
destinations for touristic ships (cruise ships, yachts etc.), this could be focused on and developed when
developing strategies in URBAN WASTE’s works package 4.
The identified waste prevention and management strategies existing in the URBAN WASTE pilot cities, as well as
international best practice examples, consist of well‐known policy instruments mainly based on information and
awareness building as well as provision of infrastructure (e.g. bins for separate collection of food waste). Also
regulatory instruments (e.g. ban of plastic bags), economic instruments and voluntary agreements (e.g. use of
returnable containers) could be identified.
Both, waste management and prevention practices in pilot cities as well as international best practice focus on
nutrition of tourists. Most measures deal with food waste prevention as well as food waste management like
selective collection of organic waste for recycling in tourist areas and subsequent composting activities, either
at the point of waste generation or central as well as the production of biogas from organic waste. Besides the
measures implemented in some of the pilot cities, international best practice examples included the aspect of
separate collection and use of cooking oil. Through the installation of public drinking water fountains (and
accompanying information measures) tourists could be encouraged to refill their empty plastic drinking bottles,
thus, reducing PET‐bottles waste.
Besides activities dealing with food and food waste as two additional general issues, the organisation of events
and in general the promotion of re‐use activities seem to be promising topics to reduce tourist waste generation.
Both bigger events, like sport or music events, as well as small events, even meetings, can be oriented according
the Eco‐event concept. Activities aimed at re‐use that potentially could be implemented in URBANWASTE could
include on the specific tourist side swap facilities for products the majority of tourists might only need
temporarily or at the side of operators the use of reusable dishes and the donation of reusable equipment.
The promotion of resource consciousness in procurement amongst tourist accommodation establishments as
well as food and beverage providers for tourists is another positive example identified. Partially this could be
reached by promoting environmental certification schemes.
Most identified international best practice examples connected to tourist waste management also refer to eco
labelling and connected guidelines. The hotel industry can considerably reduce their waste generation by
implementing and following a waste management system
One interesting aspect to be highlighted from international best practice examples as first step for waste
prevention the elaboration of an extended inventory of waste types and sources is recommended. This should
help to locate avoidance potentials of waste generation. An overview of items to prevent, items to select and
actions to avoid waste in accommodation is the basis for subsequent waste prevention.

D2.7 – Compendium of waste management practices in pi lot cit ies and best practices in touristic cit ies
134
7. References
Bio by Deloitte (2014), Comparative Study on EU Member States’ legislation and practices on food donation. Final report. Retrieved January 2017: http://www.eesc.europa.eu/resources/docs/ executive‐summary_comparative‐study‐on‐eu‐member‐states‐legislation‐and‐practices‐on‐food‐donation.pdf
Căilean, D. & Teodosiu, C. (2016), An assessment of the Romanian sold waste management system based on sustainable development indicators. Sustainable Production and Consumption, 8, 45‐56
Cecere, G. & Corrocher,N. ( 2016), Stringency of regulation and innovation in waste management: an empirical analysis on EU countries. Industry and Innovation, 23, 625‐646
Crotti, R. & Mishrahi, T. (Eds.) (2015), The travel and tourism competitiveness report 2015: Growth through shocks. Geneva: World Economic Forum.
EC (2005), EU waste policy. The story behind the strategy. Retrieved December 2016: http://ec.europa.eu/environment/waste/strategy.htm
EC (2008), Directive 2008/98/EC of the European Parliament and of the Council. Retrieved December 2016: http://eur‐lex.europa.eu/legal‐content/EN/TXT/PDF/?uri=CELEX:32008L0098&from=EN
EC (2010), Being wise with waste: the EU’s approach to waste management. Retrieved December 2016: http://ec.europa.eu/environment/waste/pdf/WASTE%20BROCHURE.pdf
EC (2011), Report from the Commission to the European Parliament, the Council, the European Economic and Social Committee and the Committee of the Regions on the Thematic Strategy on the Prevention and Recycling of Waste. Retrieved January 2017: http://ec.europa.eu/environment/ waste/pdf/Progess%20report.pdf
EEA (2013), Managing municipal solid waste – a review of achievements in 32 European countries. EEA Report | No 2/2013. Retrieved December 2016: http://www.eea.europa.eu/publications/managing‐municipal‐solid‐waste
EEA (2015), Waste prevention in Europe – the status in 2014. EEA Report | No 6/2015. Retrieved December 2016: http://www.eea.europa.eu/publications/waste‐prevention‐in‐europe‐2015
EEA (2016), Municipal waste management across European countries. Retrieved December 2016: http://www.eea.europa.eu/themes/waste/municipal‐waste/municipal‐waste‐management‐across‐european‐countries
EEA (2016a), Municipal waste management. Country Fact Sheet Croatia. Retrieved December 2016: http://www.eea.europa.eu/publications/managing‐municipal‐solid‐waste
EEA (2016b), Municipal waste management. Country Fact Sheet Cyprus. Retrieved December 2016: http://www.eea.europa.eu/publications/managing‐municipal‐solid‐waste
EEA (2016c), Municipal waste management. Country Fact Sheet Greece. Retrieved December 2016: http://www.eea.europa.eu/publications/managing‐municipal‐solid‐waste
EEA (2016d), Municipal waste management. Country Fact Sheet Portugal. Retrieved December 2016: http://www.eea.europa.eu/publications/managing‐municipal‐solid‐waste
EEA (2016e), Municipal waste management. Country Fact Sheet Spain. Retrieved December 2016: http://www.eea.europa.eu/publications/managing‐municipal‐solid‐waste
EEA (2016f), Municipal waste management. Country Fact Sheet France. Retrieved December 2016: http://www.eea.europa.eu/publications/managing‐municipal‐solid‐waste
EEA (2016g), Municipal waste management. Country Fact Sheet Italy. Retrieved December 2016: http://www.eea.europa.eu/publications/managing‐municipal‐solid‐waste
EEA (2016h), Municipal waste management. Country Fact Sheet Denmark. Retrieved December 2016: http://www.eea.europa.eu/publications/managing‐municipal‐solid‐waste
EEA (2016i), Municipal waste management. Country Fact Sheet Sweden. Retrieved December 2016: http://www.eea.europa.eu/publications/managing‐municipal‐solid‐waste
EEA (2016j), Municipal waste management. Country Fact Sheet The Netherlands. Retrieved December 2016: http://www.eea.europa.eu/publications/managing‐municipal‐solid‐waste
EEA (2016k), Municipal waste management. Country Fact Sheet Switzerland. Retrieved December 2016: http://www.eea.europa.eu/publications/managing‐municipal‐solid‐waste
D2.7 – Compendium of waste management practices in pi lot cit ies and best practices in touristic cit ies
135
EEA (2016l), Municipal waste management. Country Fact Sheet Belgium. Retrieved December 2016: http://www.eea.europa.eu/publications/managing‐municipal‐solid‐waste
EEA (2016m), Municipal waste management. Country Fact Sheet Austria. Retrieved December 2016: http://www.eea.europa.eu/publications/managing‐municipal‐solid‐waste
EEA (2016n), Municipal waste management. Country Fact Sheet Germany. Retrieved December 2016: http://www.eea.europa.eu/publications/managing‐municipal‐solid‐waste
Fusions (2015), Review of EU legislation and policies with implications on food waste. Final Report of 7FP project FUSIONS / Reducing Food Waste through Social Innovation. Retrieved January 2017:
https://www.eu‐fusions.org/index.php/download?download=161:review‐of‐eu‐legislation‐and‐policies‐with‐implications‐on‐food‐waste
Matlack, C. (2013): Spain's Santander, the City That Runs on Sensors. BloombergBusinessweek. https://www.bloomberg.com/news/articles/2013‐05‐16/spains‐santander‐the‐city‐that‐runs‐on‐sensors. Last accessed: 19.01.2017
Reisinger, H., Krammer, H.‐J. (2007): Weissbuch Abfallvermeidung und ‐verwertung in Österreich. Report, Bd. REP‐0083. Umweltbundesamt, Wien.
Salhofer, S., Unger, N., Bilitewski, B.(2010): Waste Prevention and Minimization: Concepts, Strategies and Means, Solid Waste Technology & Management. John Wiley & Sons, Ltd, pp. 181‐192.
Sharp, V., Giorgi, S., Wilson, D.C., 2010. Delivery and impact of household waste prevention intervention campaigns (at the local level). Waste Management & Research 28, 256‐268. Tourism Review multilingual marketing & publishing team (2015): Tenerife tourism estimates 5.3 million visitors in 2015.
http://www.tourism‐review.com/tenerife‐tourism‐board‐estimates‐over‐5‐million‐visitors‐news4815 (accessed 17.01.15).
Vittuari, M., Gaiani, S., Politano, A., Aramyan, L., Gheoldus, M., Schneider, F. (2015): D3.1 Review of current EU Member States legislation and policies addressing food waste. Report of the project FUSIONS (contract number: 311972) granted by the European Commission (FP7)
Weißenbacher, J. & Seyring, N. (2016), Detailed assessment of Waste Management Plans ‐ first batch, final report. Luxembourg (Publications Office of the European Union).
WFD (2008): Waste Framework Directive: Directive 2008/98/EC of the European Parliament and of the Council of 19 November 2008 on waste and repealing certain Directives. http://eur‐lex.europa.eu/legal‐content/EN/TXT/?uri=CELEX:32008L0098
D2.7 – Compendium of waste management practices in pi lot cit ies and best practices in touristic cit ies
136
The content of this [report/study/article/publication…] does not reflect the official opinion of the European Union.
Responsibility for the information and views expressed in the [...] / [therein] lies entirely with the author(s).
Recommended