The California Solar Energy Cluster
Brett Gibson | Kelli Moles | Meredith Sanger-Katz | Chiara Salghini | Julia Taylor
May 6, 2011
The Microeconomics of Competitiveness Professor Michael E. Porter
Faculty Advisor: Professor Christian Ketels
Harvard Business School & Harvard Kennedy School

1
1. Executive Summary
Historically, the United States and California have been two of the world’s most prosperous
economies. As manufacturing declined in the latter half of the 20th century, the US upgraded to a
knowledge-based services economy, but the US and California’s governments failed to invest in the
changing business environment, allowing infrastructure and social institutions to deteriorate immensely
while government spending ballooned and partisan bureaucracy limited effective policy implementation.
California, the sunshine state, is microcosm of the US’s main issues, with persistent unemployment
and a looming budget deficit, despite having the third highest corporate tax rate in the nation. Historically,
California provided a competitive business environment for the world’s best clusters in entertainment,
fashion, high tech, and venture capital to develop, branding the state as a hotbed of innovation and
entrepreneurship. However, the extremely high cost of business has resulted in a slow but steady exodus of
enterprises.
California’s 40-year old solar energy cluster had a global first-mover advantage and strong
incentive plan to boost local demand and drive cluster innovation. Though it has dedicated solar research
and universities, strong support from related clusters, and a foothold on the new thin-film market, the
cluster is bordering on decline due to increased global manufacturing competition, a labor shortage of
‘green job’ workers, and uncoordinated technology start-ups. The following recommendations address the
issues we have identified at the national, state, and cluster level:
US government
• Reform education by replicating high-performing charter schools to reform teacher pay, close the achievement gap, and raise overall student proficiency
• Provide tax incentives to increase private savings rate in order to reduce the deficit • Create bi-partisan infrastructure investment plan to address internal infrastructure (like drinking
water) and later improve access to international markets (like aviation and high-speed rail)
California government
• Implement ESL & skills training to help immigrants and workers retrain for new jobs • Increase contribution to pension fund or add consumption/VAT taxes to cover budget shortfall • Reduce burden for SMEs by eliminating $800 new business fee and tax on factory equipment • Simplify solar permitting process & provide incentives for improving energy transmission
Firms and IFCs
• Partner with UC Advanced Solar and the workforce development IFC to address both high and low skill talent shortages through very specialized employee training programs
• Increase R&D investment in thin-film & technologies to shift from traditional PV manufacturing • Create a ‘solar incubator’ IFC that provides centralized support functions for solar entrepreneurs
to share innovations and connect with venture capital firms for financing

2
2. The United States Competitiveness
Performance and prosperity The United States, with a $14.7 trillion GDP is the most prosperous
large economy in the world (CIA, 2011). A relatively mature economy, its real GDP growth averaged
approximately 2.2% between 2003 and 2010 (CIA, 2011). US has generally been a hallmark of stability
due to the US dollar’s role as a safe-haven currency, downside risks to the global economy, and concerns
about the stability of the euro zone. With a population of just over 300 million, the country maintains a
high level of output per capita; in 2010, the US is estimated to have per capita GDP of $47,561, the sixth
highest in the world (EIU, 2011). Purchasing power in the United States is strong, with the US ranking 1st
out of 225 countries as ranked by the CIA World Factbook (CIA, 2011).
Increases in labor productivity of about 1.5% per year from
2001-2010 outpaced most other advanced economies, 1.1% in Japan,
0.9% in the UK and 0.6% in Germany, while the BRIC countries
such as China at 9.5% and India at 5.3%, outperformed the rest (EIU,
2011). Increased labor productivity is largely due to the ease of
hiring and firing in the US labor market, which ranks 1st in low labor market rigidity (ISC, 2010).
Contrastingly, strict European labor laws can force firms to retain unnecessary employees. GDP per hour
worked is increasing slowly at 2.2% annually from 1995-2006, on par with the OECD average (OECD,
2007).
The US unemployment rate is elevated at 8.8% as of March 2011, compared to a 5.70%
unemployment rate from 1948 to 2010 (Trading Economics, 2011). After increasing for the last quarter of
the 21st century as women entered the workforce, the number of people participating in the workforce has
declined over the past decade from 67% in 2001 to 64% in 2011 (EIU, 2011). This decrease is primarily
due to a decline in men’s labor force participation. Incomes of men over 50 have increased due to an
increase in social security and pension benefits, causing some early retirement. Additionally, less skilled
jobs had higher salaries historically and access to Social Security disability benefits has increased (Mather
Source: Economic Intelligence Unit

3
and Lee, 2008). The population is aging as the ‘baby boomer’ generation reaches retirement, with the
median age of the population expected to increase from 35.5 in 2000 to 39.1 in 2035 (US Census, 2011).
These changing demographics could further strain the US labor market and social institutions as a smaller
number of workers will have to support the growing number of retirees.
Over the last fifty years, the US has seen a dramatic shift from a focus on manufacturing to a focus
on providing services. At the end of World War II, the services economy counted for just 10% of non-farm
employment, compared with 38% for manufacturing. Today, service sector workers outnumber workers
who produce goods by a ratio of five to one (American Workplace, 2011). With a focus on high-value
added services industries and robust competition from low-wage countries, the US workforce must
continue to upgrade its knowledge capabilities to maintain its high wages.
Most of the gains in economic development have gone to the top portion of the population, and
inequality continues to increase. The US ranked 40th out of 136 countries for high inequality, further
supported by an increase the US Gini Coefficient from 0.40 in 1980 to 0.45 in 2011 (CIA, 2011).
Additionally, wealth is highly concentrated at the top. As of 2007, the top 1% of households owned 34.6%
of all privately held wealth, and the next 19% had 50.5%, which means that just 20% of Americans owned
a staggering 85% of all privately held wealth (Domhoff, 2011). This inequality amplifies the burden on the
social institutions. Instead of spending money on education and innovation, the US government must spend
significantly on welfare programs.
Macroeconomic competitiveness Another key US issue is
the twin current account and budget deficits which continue to
increase. As shown on the chart, the US is exposed to both a negative budget balance of -10.04% of GDP
and a negative current account balance of -2.68% of GDP. The current account deficit has grown to $507
billion in 2010 (EIU, 2011). The sustained deficit over the last two decades is facilitated by borrowing to
fund US consumption and was further exacerated by 2000-2010 tax cuts and increased government
spending. Gross external debt has increased from $6.4 trillion in 2003 to $14.4 trillion in 2010 (US
Source: Economic Intelligence Unit
EIU, 2010

4
Treasury, 2010). Servicing this debt is very costly and exposes the US to risk that creditors will increase
interest rates on loans.
On most human development indicators the US is strong, with an overall ranking of 19th on the GCI.
However, many social institutions underperform, such as the healthcare system, social security, and
education. While the US spends more on health care expenditures than any country in the world, access to
healthcare services ranks 63rd, which further contributes to inequality. Political institutions in the US are
largely ineffective, with an overall ranking of 41st in the GCI. Especially troublesome is the government’s
wasteful spending and ineffectiveness in reducing poverty and inequality. Political gridlock and partisan
fighting prevents the US from creating a coordinated strategy for competitiveness (Porter, 2008).
Microeconomic competitiveness Overall, the US has a microeconomic competitiveness ranking of
11th in the GCI, bolstered
by the strength of US
private sector competition,
with company operations
and strategy ranking 8th.
By maintaining a high
level of national R&D
spending, the US has
established and retained a reputation as a technology and innovation leader. The US devotes more money to
R&D as a share of GDP than almost all other developed countries with the exception of Japan (Center for
American Progress, 2011). Organizational practices are also strong with a high level of staff training,
willingness to delegate authority, and use of incentive compensation. The US private sector is one of the
most sophisticated in the world, with highly developed clusters and a strong private sector international
presence, ranking 14th in the GCI. Other key factors of the US’s microeconomic position are highlighted in
the diamond analysis below.

5
The national business environment: US diamond analysis
Factor conditions Overall the US has strong factor/input conditions, ranking 11th by the GCI.
Human capital The US attracts the best scientists and engineers to study at its institutions for higher
education. According to US News and World Report’s 2010 rankings, 20 out of the top 50 of the world’s
best universities are headquartered in the US (US News & World Report, 2010).
Innovation and access to capital A strong environment for innovation and access to risk capital has long
been a pillar of competitiveness for the United States. In utility patents per million of population, the US is
ranked third by the GCI. For the first quarter of 2011, 66% of all global VC dollars went to US companies.
Europe placed second with 16%, while China followed closely with 15% (Primack, 2011). This, combined
with a culture that encourages risk-taking and entrepreneurship, are key factor conditions in the US.
Infrastructure Deterioration The US has very poor infrastructure policy and lacks a point
person for leadership and planning for American infrastructure. America’s infrastructure
has an overall grade of “D” and will require a $2.2 trillion investment over the next five
years (American Society, 2011). The table to the right shows the 2009 grades across
infrastructure categories, with rail, roads, drinking water, waterways, levees, and
wastewater all reciving a D minus. The World Economic Forum also lowered of
America’s infrastructure rating from 7th to 23rd (World Economic Forum, 2011).
Education In primary and secondary education, the US has fallen dramatically from its top ranking due to
an extremely broken public education system. In the OECD report showing the results of the latest PISA
tests, the United States ranked 14th out of 34 countries (Cook, 2010). In the most recent World Economic
Forum Global Competitiveness report, the quality of math and science education in the US has dropped to
55th, and primary enrollment in school is also poor at 78th in the GCI (World Economic Forum, 2011). For
the US to keep its competitive edge in innovation, math and science will be crucial.
American Society of Engineers

6
Demand conditions
Consumer protection The US is ranked 14th by the GCI for demand conditions and is particularly strong
in consumer protection regulation. In many industries, the US sets the safety standards for industries
worldwide. According to the Toy Industry Association, the US toy safety standards and regulations are
among the most stringent in the world (Toy Industry, 2011).
Buyer sophistication Strong buyer sophistication, ranked 10th by the GCI is also a strong demand
condition. Additionally, the government is a large buyer of advanced technology products, ranked 7th by
the GCI.
ICT promotion The government has had limited success in ICT promotion, currently ranked 31st in the
GCI, due to continued underinvestment in infrastructure, the weakest area for the US. While the
government promotion of ICT has not been strong, the US still ranked 20th out of 183 countries in the
Digital Opportunity index reported in the World Information Society Report in 2007 (International
Telecom Union, 2007).
Related and supporting industries Related and supporting industries are strong with an overall rank of 7th
in the GCI. The US has advanced cluster development and high cluster overlap. The US ranks 3rd in the
GCI for advanced cluster development, indicating extensive collaboration among and within clusters. The
US also has high availability of advanced machinery and access to high quality suppliers, ranked 4th, 12th,
and 14th respectively on the GCI, enabling firms to have a broad range of suppliers to choose from.
Context for firm strategy and rivalry
Labor practices The US ranks 22nd in the GCI in context for firm strategy and rivalry. Labor markets are
very efficient, characterized by the ease and affordability of hiring workers. According to the World Bank,
the US has the highest flexibility in the hiring and firing of workers and the rigidity of working hours
(World Bank Report, 2010). Labor productivity in the US is also strong, and has outpaced other advanced
economies since the recession, continuing to show positive productivity growth. Labor productivity growth

7
(measured as output per hour) was only 0.8% in 2008, but accelerated to 2.4% in 2009, eventually reaching
2.8% 2010 (The Conference Board, 2011).
Administrative burden The US ranked 5th in the Ease of Doing Business Report (World Bank Group,
2011). Getting credit (6th), protecting investors (5th), and enforcing contracts (8th), are all strong factors for
starting businesses in the United States. However, a complex and bureaucratic government system makes
paying taxes (62nd) and dealing with construction permits (24th) difficult (World Bank Group, 2011).
Investor and IP protection Additionally, the US provides stable investor protection (5th) and strong
intellectual property protection (23rd), which encourages inflows of foreign direct investment in firms and
technology innovations.
High taxes and subsidies Weaknesses include the distortive effect of high taxes and subsidies on
competition, business impact of rules of FDI, and restrictions on trade. The US effective tax rate of 35% is
the highest in the OECD, and the average rate of the G-7 is also lower comparatively at 28.8% (Chen,
2010). Many of the weaknesses stem from ineffective and distortive regulation. EIU ranked the US 24th
out of 26 in the “functioning of government” category for full democracies (EIU, 2010).
Issues to address In summary, US competitiveness declining, falling from 5th in the GCI in 2001 to 18th as
of 2010. The US should protect its strengths in fostering innovation, flexible labor policies, and a strong
environment for business, but first must rectify the large trade deficit. Foreign governments may not
continue to finance this deficit at reasonable rates. Yet, the federal government must invest in key priorities
like education and infrastructure to keep pace with global economic development.
3. California Competitiveness and Business Environment
Profile and economic performance California is the eighth largest economy in the world and the
largest state economy in the nation, with a GDP of $1.9 trillion in 2009 (Bureau of Economic Analysis,
2010), and it accounts for about 13% of the nation’s output (Legislative Analyst’s Office, 2011). In 2009,
per capita real GDP for California was $46,992, which was 12.9% more than US per capita real GDP and
declined 3.4% from the previous year (Bureau of Economic Analysis, 2010). Though California has

8
household income of $61,017 and per capita income of $22,711, it decreased 2.5% from 2009 and is likely
to continue due to increasing low-wage jobs (US Bureau of Economic Analysis, 2011).
California is the 49th most expensive state at 139 on the cost of living index (US Census Data, 2011)
and one of the most expensive places to do business, ranking sixth overall with the third highest corporate
tax rate in the nation. California workers, on average, earn 12% more than the national average because the
minimum wage is higher ($8.00) than the US’s ($7.25) due to favorable worker regulations (CA.gov, 2011).
Labor is also more productive than the US, with output per worker 13% above the national average (Public
Policy Institute of CA, 2011). From 1999-2009, the average annual growth rate for California real GDP
was 2.4%, and average wage growth was 3.6%.
California, with 12% of the American population, benefits from a diverse population with double
the percentage of foreign-born persons than the US (26.2% to 11.1%) (US Census, 2011). Thirteen percent
of the population lives below the poverty line, which is on par with the US (US Census Bureau, 2011).
Labor and employment California suffers from a labor shortage, but new job growth is actually in
the lower-wage segment. Most of the jobs leaving the state are higher salary, which in turn significantly
impacts the state tax revenue. To illustrate, the average pay of growing employment sectors is $42,214
whereas the average pay of declining employment sectors is $68,671 (The Agenda for Economic Recovery,
2011). California has a steady influx of immigrants who contribute to the labor force, but the influx of
immigrants outpaces job growth, further exacerbating the unemployment problem. As of March 2011, the
unemployment rate was 12.0%, an 18 month low from a high of 12.5% (Bureau of Labor Statistics, 2011).
Innovation and research California ranks fourth in the US for patent filings, with 58.5 patents
filed per 100,000 workers, 20% less than Delaware’s leading 82.1 patents filed per 100,000 workers
(Kauffman Foundation, 2007). The publicly-funded University of California outpaces the country, with
10.9% of the US patent filings for research, three times as high as MIT, the next closest university
(Kauffman Foundation, 2007). The state’s leading export is high-tech products, attesting to the strength of
Silicon Valley and the university research and development system.

9
Fiscal policy crisis California has a budget deficit over $20 billion, with education, health, and
social services dominating spending despite massive reductions and multiple attempted recovery plans.
Though media has drawn the comparison between debt-ridden California (rated A-/negative) and Greece
(rated BB-/watch negative), Standard & Poor’s 2011 report found that California’s budget imbalance is
significantly lower, and the state’s crisis is one of policy more so than debt (Standard and Poor’s, 2011).
Social performance: social institutions Due to the budget crisis, California’s social institutions
teeter on the brink of collapse. California’s three main pension funds face a $500B shortfall after a recent
decline of 23-25% (Stanford Institute, 2010). The reduction in social services combined with continued
housing foreclosures resulted in an exodus of the middle-class, expected to reach 200,000 people in 2011
(Agenda for Economic Recovery, 2011). Though California pays teachers the highest average salary in the
US at $66,064, it as 49th worst state for basic education proficiency, worse than all OECD countries
(Legislative Analyst’s Office, 2011). California does not fare much better with healthcare, with only 50%
of non-elderly persons having insurance coverage and 25% lacking any type of coverage at some point in
2009 (Legislative Analyst’s Office, 2011).
Political soundness Despite the budget crisis, political gridlock and hyper-democracy paralyzes
state leaders. Lawmakers are constrained by a California voter initiative that requires two-thirds vote to
raise taxes, and partisan politics have resulted in policy volatility. The current governor, Jerry Brown, is
attempting to decentralize government programs by shifting them to the local level, creating opportunity for
public-private partnerships.
Microeconomic
competitiveness: national business
environment California is home to
many sophisticated clusters and is the
nation’s leading agricultural producer,
Institute for Strategy and Competitiveness
10
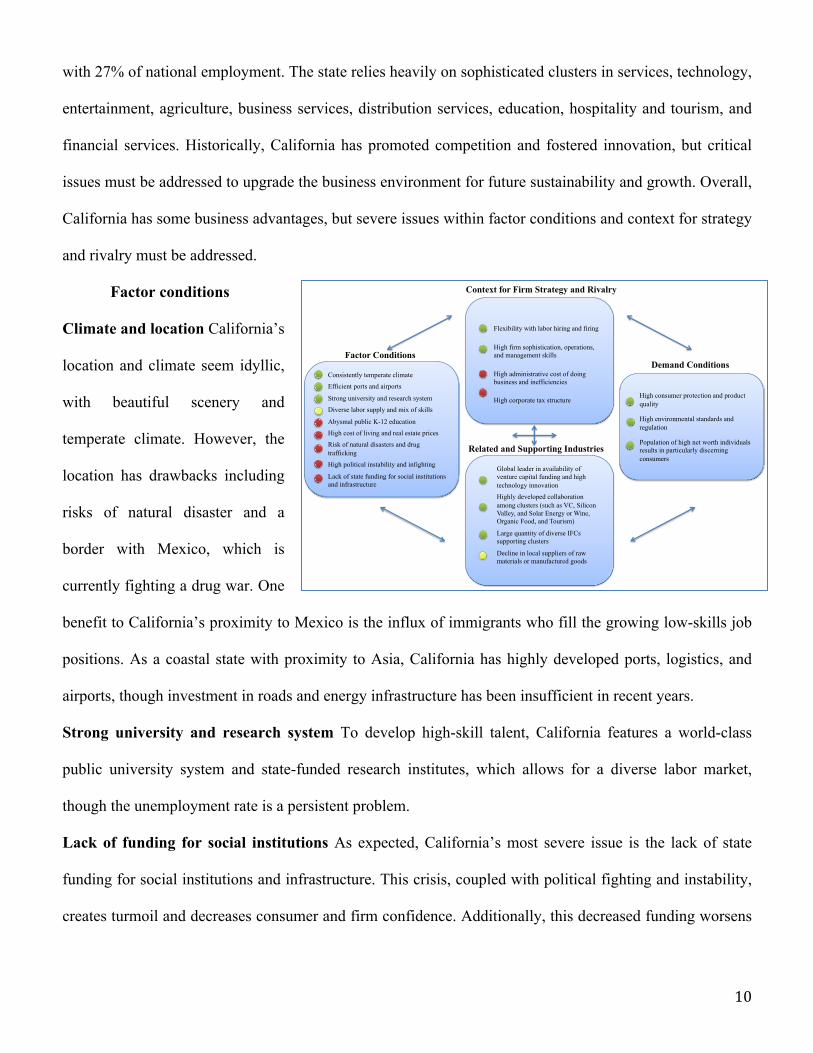
with 27% of national employment. The state relies heavily on sophisticated clusters in services, technology,
entertainment, agriculture, business services, distribution services, education, hospitality and tourism, and
financial services. Historically, California has promoted competition and fostered innovation, but critical
issues must be addressed to upgrade the business environment for future sustainability and growth. Overall,
California has some business advantages, but severe issues within factor conditions and context for strategy
and rivalry must be addressed.
Factor conditions
Climate and location California’s
location and climate seem idyllic,
with beautiful scenery and
temperate climate. However, the
location has drawbacks including
risks of natural disaster and a
border with Mexico, which is
currently fighting a drug war. One
benefit to California’s proximity to Mexico is the influx of immigrants who fill the growing low-skills job
positions. As a coastal state with proximity to Asia, California has highly developed ports, logistics, and
airports, though investment in roads and energy infrastructure has been insufficient in recent years.
Strong university and research system To develop high-skill talent, California features a world-class
public university system and state-funded research institutes, which allows for a diverse labor market,
though the unemployment rate is a persistent problem.
Lack of funding for social institutions As expected, California’s most severe issue is the lack of state
funding for social institutions and infrastructure. This crisis, coupled with political fighting and instability,
creates turmoil and decreases consumer and firm confidence. Additionally, this decreased funding worsens
Consistently temperate climate
Efficient ports and airports
Strong university and research system
Diverse labor supply and mix of skills
Abysmal public K-12 education
High cost of living and real estate prices
Risk of natural disasters and drug trafficking
High political instability and infighting
Lack of state funding for social institutions and infrastructure
Factor Conditions
Flexibility with labor hiring and firing
High firm sophistication, operations, and management skills
High administrative cost of doing business and inefficiencies
High corporate tax structure
Context for Firm Strategy and Rivalry
High consumer protection and product quality
High environmental standards and regulation
Population of high net worth individuals results in particularly discerning consumers
Demand Conditions
Global leader in availability of venture capital funding and high technology innovation
Highly developed collaboration among clusters (such as VC, Silicon Valley, and Solar Energy or Wine, Organic Food, and Tourism)
Large quantity of diverse IFCs supporting clusters
Decline in local suppliers of raw materials or manufactured goods
Related and Supporting Industries

11
the already failing K-12 school system. Failed education plus a high cost of living has caused middle-class
flight from the state.
Context for firm strategy and rivalry
High firm sophistication Many of the world’s largest and most advanced companies are headquartered in
California across a variety of industries, including Google, Hewett-Packard, Cisco, Intel, McKesson,
Safeway, Chevron, Walt Disney, and Apple. With the support of the advanced US economy, companies in
California have efficient operations, best in class human capital practices and training, and top management
talent from leading business schools around the world. As a leader in high-tech innovation, California’s
technology firms have grown to some of the highest market capitalization values in the world.
Flexible labor hiring and firing but other restrictive regulations California benefits from the US’s at-
will employment laws, and firms have liberal hiring and firing rights, however the hourly minimum wage is
higher than the national average, at $8.00 compared to the US’s $7.25 (CA.gov, 2011). California requires
rest breaks at a minimum of every four hours and pays double the rate for overtime when the workday
exceeds 12 hours, which contributes to a higher cost structure (Department of Industrial Relations, 2011).
High cost of doing business and corporate tax Compared to other states, California’s corporate tax rate is
significantly higher. In 2010, Colorado and Arizona’s corporate income tax rates, 4.63% and 6.97%,
respectively, are much lower than California’s 8.84%, while Nevada has no corporate income tax. In terms
of sales tax, Arizona’s sales tax rate is 5.6% and Colorado’s is 2.9%, lower than California’s 8.25% (Tax
Foundation, 2011). These tax structures, difficulty navigating the state government, and expensive real
estate prices are slowly driving entrepreneurs to friendlier states. Large companies cannot relocate as easily,
giving California a false sense of private sector security.
Demand conditions
High consumer protection, environmental standards California benefits from robust US policies on
consumer safety. With the strongest environmental program in the nation, California has a mandate to
increase use of renewable energy to 30% by 2020 (CA.gov, 2011). Additionally, the California

12
Environmental Quality Act requires forms to identify the environmental impacts of their actions and to
mitigate those impacts if feasible (CA.gov, 2011). Lastly, California’s consumer protection agency is
undergoing a new initiative to reduce the average enforcement timeline from 36 to 18 months (State of
California, 2010) and released a comprehensive guide for consumers that addresses 26 categories of
consumer issues from mental health to the automotive industry (State of California, 2010).
Population of discerning high net worth individuals California is the global leader in ultra high net
worth individuals, with over 9,800 individuals that have $30M or more in assets. The next two states, New
York and Texas, have 7,327 and 5,283 respectively (FINRA, 2011). Specifically, Californians are
particularly sophisticated in world-class clusters like fashion, wine, entertainment, and technology.
Sophisticated consumers force the private sector to upgrade product and services offerings through
innovation.
Related and supporting industries
Leader in venture capital funding, high technology innovation The Silicon Valley umbrella cluster
continues to lead high-tech innovation and development. It accounts for one-third of venture capital
investment in the United States (Wesoff, 2009), employs nearly one million high-tech workers (over one-
sixth of all US high-tech workers), and its high-tech exports ranked first nationwide (Team California,
2011). High-tech goods represent nearly 50% of California’s annual exports (Team California, 2011).
Similarly, venture capital has an equally strong position in California, which was the top state to receive
venture-backed funding in 2010, with 50% of the total US venture-backed investment of $12B
(Pricewaterhouse, 2011). Over 1,200 venture-backed deals in 2010 occurred in California, which is equal to
the total number of deals in the next top nine states (Wesoff, 2009).
High collaboration among and within clusters California has extensive collaboration and overlap among
clusters. Within California’s advanced clusters, strong IFCs that facilitate information sharing, such as
California Wine Growers Association or the Hollywood Foreign Press Association, indicate a high level of
coordination among competing firms in the same cluster.

13
Decline in local suppliers of manufactured goods Though ‘green’ jobs appear to be growing (a marginal
percentage of overall jobs) and agriculture remains strong, California manufacturing jobs declined by 21%
from 2000-2005, on par with the national rate of decline (Milken Institute, 2009).
Issues to be addressed In summary, though California is sustained by developed and integrated clusters, it
must rectify its failing social institutions, lower the cost of doing business, and lower unemployment in
order to remain a competitive location. The business environment has deteriorated significantly as the state
government has become increasingly ineffective and volatile.
4. Recommendations for US and California to Address Critical Issues
US recommendations President Obama has articulated many recommendations improve US long-term,
but has found them impossible to implement due to a divided Congress mired in political gridlock. (Porter,
2008). The US plan for competitiveness should be based around its core strength in innovation.
Reform education The US must ensure its citizens receive sufficient education to compete in the
increasingly competitive global economy. Access to tertiary education can be increased by leveraging
technology (more online courses) and encouraging private organizations to fund scholarships. At the
secondary level, the highest performing charter schools should be replicated nationally to reform teacher
salaries, to close the US ‘achievement gap’ between race and socioeconomic status, and to raise the overall
bar for student proficiency.
Reform tax code and wasteful government spending The President should also simplify the tax code and
reexamine subsidies, including those to agribusiness, to reduce the distortive impact on markets (Porter,
2008). Additionally, he should foster an increased private savings rates to help reduce the deficit by
implementing a tax incentive or policy with a minimum private savings requirement for individuals of a
certain income level. The federal government should streamlined by cutting redundant employees and
inefficient spending, and shifting tax dollars to education, healthcare, and defense.
Invest in infrastructure Lastly, the US government must eliminate its partisan politics to invest in
upgrading the country’s entire infrastructure. Continued decades of underinvestment due to lobbying from

14
special interest groups and no short-term political payoff for infrastructure spending has left the most
developed country in the world with a decaying infrastructure. A staggered investment plan should address
clean drinking water, energy transmission, and roads first and then focus on other logistics that improve
access to international markets, like national high-speed rail, inland waterways, and aviation.
California recommendations California’s critical issues – unemployment, near-collapse of social
institutions, high corporate taxes and costs of doing business, and high cost of living – will require focus
and strategic action at the state and municipal level.
Reduce unemployment To address unemployment, California should focus on a worker-training program
to help unemployed workers upgrade or retrain for new jobs. Specifically, California should leverage its
extensive college and community college network to provide English classes for non-native speakers.
Because over 25% of the population is foreign-born, the state should place a particular focus on English as
a Second Language (ESL) programs for immigrants so that they can become productive employees. The
governor should form partnerships with the private sector to provide specific skills training at trade schools
and community colleges through tax credit programs.
Reform K-12 education To improve the K-12 public educational system, California should follow the
US’s lead and scale charter organizations that have outperformed the US average. Often, charter
organizations are exempt from teachers’ union contracts, allowing California to implement a pay-for-
performance salary system instead of paying the highest salaries in the nation. Though charter schools are
publicly funded (and won’t reduce education spending), their unique instructional and business models
increase the effectiveness of per pupil spending.
Address budget crisis, increase government revenue To address the near collapse of social institutions
due to the state budget crisis, several short-term actions should be explored. The government should
consider increasing the contribution employees make to their pension fund and adding consumption and
VAT taxes to cover the shortfall. Additionally, state services should be realigned so there is more
accountability at the local level where there is more flexibility to pass new laws and raise taxes. The

15
Governor should develop committees comprised of leaders from both the public and private sectors to serve
as an innovative solution committee with a strong mandate to make specific recommendations to engage
the private sector in mutually beneficial solutions for the state crisis, such as creating public private
partnerships to run prisons.
Reduce administrative burden and costs for small/medium business California must make its policies
business friendly to stem the trend of businesses underperforming or leaving the state, especially to
promote small and medium business development. In the short-term, California could increase R&D tax
credits, eliminate the $800 fee that new businesses are required to pay in California, and eliminate the tax
on factory equipment. Longer-term, policymakers should review current regulations to eliminate
unnecessary administrative burdens and overlaps in government agencies and streamline bureaucratic
reporting and permitting processes through state-wide common forms and fully-integrated online
applications. California must ensure it creates a sustainable competitive environment for private business as
opposed to relying on the allure of its brand, location, and history, which will continue to fade over time.
5. Global and U.S. Solar Energy Industry
Overview of solar energy Solar energy converts solar radiation into electricity or thermal heat
through two methods: 1) photovoltaic cells (“Solar PV”) and 2) solar thermal plants (also known as
concentrated solar power or CSP). Solar PV technology, with 90% of the global market (SBI Energy, 2010),
features two main types of technologies, Crystalline Silicon and Thin-Film. Crystalline Silicon cells
represent about 81% of solar cells manufactured today (Frost and Sullivan, 2009) because they have a
relatively high conversion efficiency rate of 15-21% and finessed high-volume manufacturing process
(Barclays Capital, 2010). As of 2009, thin-film technology represented 18% of the PV solar market (Frost
and Sullivan, 2009), but it is expected to increase significantly because it eliminates expensive poly-silicon,
thought it currently has a lower conversion efficiency rate (6% to 11%) (Barclays Capital, 2010).
Concentrated PV, which overlaps significantly with Concentrated Solar Power (CSP), is the third
type of technology, converting solar rays into heat that can be used in homes, buildings and heat spaces. In

16
2009, concentrated PV represented less than 1% of solar installed global capacity (Frost and Sullivan,
2009). Though CSP has a high efficiency rate of 40.8%, it is not a scalable technology because the systems
require a cooling mechanism; large-scale operations are financially viable but do not produce enough
energy (Frost and Sullivan, 2009). There were only two commercial CSP installations in the US in 2009,
and the US had total trade flows of only $3.8M (Solar Energy Industries, 2010); thus, the global focus is on
solar PV technologies.
The cost of solar energy generation is still too high to compete in a free-market without government
subsidies. Traditional energy forms like coal and natural gas cost 10 and 6 cents per kWh respectively
(Barclays Capital, 2010). Even within the renewable energy category, nuclear, wind, and hydro energy are
less expensive than solar, costing around 10 cents per kWh (Barclays Capital, 2010 and US Dept of Energy,
2001). Comparatively, the average cost of solar energy PV generation is over double traditional energy
sources and at least 50% higher than other renewables, at 15-30 cents per kilowatt hour for PV and 12-19
cents per kWh for CSP (Frost and Sullivan, 2009). The
ultimate goal for the solar energy industry is to achieve
grid parity, the point at which the cost to generate solar
energy is equal to the cost of other traditional energy
sources. Experts generally agree that grid parity will be reached by 2015 during
peak energy times, meaning residential consumer prices must fall from 23-32
cents to 8-10 cents per kWh, representing over a 50% decrease in price (Frost and Sullivan, 2009).
The cost of solar system components is also declining due to learning and innovations in the
manufacturing process, allowing companies to achieve greater economies of scale. Module prices,
comprising 40-60% of the total installation cost, are expected to fall at a CAGR of -3.9% from 2009-2016
due to the increased global supply of polysilicon and caps on the incentives in Spain (Frost and Sullivan,
2009). Inverters are the 2nd most expensive component, accounting for 10-18% of the total cost at
approximately six cents per watt (Frost and Sullivan, 2009).
Barclays Capital, 2010

17
Solar energy production
value chain The solar energy
value chain has five main
components: silicon production, wafer manufacturing, cell manufacturing, module manufacturing and
assembly, and system integration. The initial complex steps require high technological precision, which
results in a low number of companies conducting these activities (less than 100) (Barclays Capital, 2010).
Contrastingly, assembly and integration are low-value added steps, resulting in lower barriers to entry and a
proliferation of global companies with 5,000 integrators (Barclays Capital, 2010). Major players in the
industry exist at individual steps along the value chain, such as Hemlock Semiconductor Group, a US based
company with the leading global share of polysilicon production. However, vertical integration has
increased in the last five years, especially through the middle manufacturing components of the value chain
as firms improve manufacturing efficiency. For example, most cell manufacturers now also produce
modules, such as the three major players in cell production, Suntech Power (China, US Headquarters in
California), First Solar (US – Arizona), and Sharp Corporation (Japan) (Frost and Sullivan, 2009).
Looking at location market share, China has 48% of the wafer production global market share
compared to the US at 3% (Solar Energy Industries, 2010). In module assembly, the US has a 29% market
share, second only to the Philippines at 39% (Solar Energy Industries, 2010). Europe dominates the inverter
market, given that the top five companies with 69% of all inverter sales are located in Europe (Solar Energy
Industries, 2010). Based on worldwide revenues in 2009, Sharp Corporation (Japan) and First Solar (US –
Arizona) are the global leaders with 15.7% and 15.0% market share respectively (Frost and Sullivan, 2009).
Yingli (China), Suntech (China), Solarworld (Germany), and Sunpower (US – California) are close behind
with 11%-14.2% market share (Frost and Sullivan, 2009). Sharp held 18% of the Californian market share
in 2009 and broke the solar efficiency record at 36% (Frost and Sullivan, 2009). In terms of manufacturing
capacity, First Solar led with 10.7% of market share, but the majority of manufacturing capacity (70%) is
conducted in Asia (top manufacturers and respective products listed under China cluster).
Barclays Capital, 2010

18
Global solar energy industry The global solar energy industry has grown rapidly over the last 15
years, with demand, represented by ‘PV installed capacity,’ increasing 51% p.a. on average from 2000-
2009 (GreenTechMedia, 2010). Europe (with Germany leading), China, and 29 of the US states (with
California leading) have renewable portfolio standards that include a solar energy component. These
programs feature a mix of incentives including feed-in-tariffs (especially among European Union members),
tax exemptions, and grant programs; some schemes are exorbitantly expensive, bringing into question a
nation’s ability to support the subsidies. For example, Spain, one of the largest solar markets in the world,
experienced a drastic decline after it could not maintain high feed-in-tariffs in 2008 (Frost and Sullivan,
2009).
Despite impressive growth over the last decade, the global manufacturing market has recently
experienced an overcapacity of supply due to the global financial crisis, lack of project financing, and the
Spain feed-in-tariff market crash. However, the manufacturing market largely recovered in 2010 and is still
forecasted to increase in the next few years (GreenTechMedia, 2010). The PV segment of the solar market
generated $13.4 billion in 2009 and is forecasted to grow at a CAGR of 26.7% through 2016 (Frost and
Sullivan, 2009). Thirty-six solar companies are listed on various stock exchanges around the world, with 17
listed in the US (Barclays Capital, 2010).
United States solar energy industry The US market grew 67% from $3.6B in 2009 to $6.0B in
2010 (Solar Energy Industry Assoc, 2010). On-grid solar PV installations doubled in 2010 to 878 MW,
which is 102% growth over 2009 (Solar Energy Industry Assoc, 2010). However, Germany and Italy
outpaced the US, and the total global market grew at 130% from 2009-2010 (Solar Energy Industry Assoc,
2010). Thus, the US market share of PV global installations actually fell from 6.5% in 2009 to 5% in 2010
(Solar Energy Industry Assoc, 2010). Furthermore, US cumulative installed PV capacity per capita is 4.2W
on average, while cloudy Germany has 25 times this number, at 100W per capita as of 2009
(GreenTechMedia, 2010). The federal government has a robust renewable and solar energy program to
support national demand, supplemented by states’ renewable portfolio standards. Due to these programs

19
and the huge market potential in the US, solar industry analysts predict that the US will be the global
dominant demand market over the next decade (Barclays Capital, 2010).
On the supply side, the US has over 2,000 solar companies, but employs fewer people per capita
than Germany. California employs 30 solar workers for every 100,000 residents (93,000) in 2010 (Solar
Energy Industry Assoc, 2010), lower than Germany’s 49 solar workers for every 100,000 residents
(40,000) (Landler, 2008). That number is expected to grow 26% by August 2011 (Solar Energy Industry
Assoc, 2010) due to a shortage of solar installers for California Solar Initiative’s ‘one million roofs’ goal
(Interstate Renewable, 2010). Historically, US companies’ 39 manufacturing facilities, 50% of which are in
California, conducted most activities along the value chain (Solar Energy Industry Assoc, 2010).
The US is a net exporter of solar products, with net export value of $723M in 2009 (Solar Energy
Industry Assoc, 2010). Though US PV manufacturing has increased with a year-over-year growth rate of
97% (wafers), 81% (cells), and 62% (modules) from 2009-2010, increasing cost pressures from China is
expected to impact continued growth (Solar Energy Industry Assoc, 2010). The US still commands a 40%
global market share over high-grade polysilicon, the main input for Crystalline Silicon PV solar panels,
exporting $1.2B in 2009 (Solar Energy Industry Assoc, 2010). Though US PV imports are dominated by
Crystalline Silicon panels (95% in 2008 (SBI Energy, 2010)), US exports of emerging thin-film products
grew from 8% to 44% of total solar exports, a CAGR of 98% from 2005-5008 (SBI Energy, 2010),
indicating a new dominant segment for the US. The global demand for thin-film panels, expected to reach
30% of production by 2013, highlights a new priority for the California cluster (GreenTechMedia, 2010).
Global competing solar energy clusters
Germany With over 90 Gw of installed capacity, 55% of global PV demand, and extremely favorable
feed-in-tariffs, the German market is the largest in the world (Barclays Capital, 2010 and GreenTechMedia,
2010). In 2008, Germany had over 15,000 businesses with approximately 100 manufacturing facilities;
however, Germany fell to fourth in PV manufacturing rank, losing significant share to China and Taiwan
(SBI Energy, 2010 and Roney, 2009). The cluster employed 53,000 people in 2008, up from 17,000 in

20
2003, and more than 2 billion Euros were invested in renovation of solar facilities (SBI Energy, 2010) to
upgrade manufacturing infrastructure. Germany is a key thin-film market for the US, as First Solar, the
global leader in thin-film, generated 65% of its $2 billion in revenue from Germany’s CdTe purchases (a
specific type of thin-film) (GreenTechMedia, 2010).
China The China cluster is the fastest growing cluster in the world, with a 170% CAGR in PV production
from 2003-2008 (SBI Energy, 2010). China’s share of global PV manufacturing increased from 1% in 2001
to 27% in 2008 (SBI Energy, 2010) and is expected to surge to 60% in 2012 (Barclays Capital, 2010).
China exports 95% of its production largely to Germany and the US, capturing 40% of the California PV
panel market in 2009 (Woody, 2010). In
terms of company performance,
Chinese public solar companies
outperformed the rest in 2009, with
average returns at 121%, compared to -
43% for European and -37% for US
companies (Barclays Capital, 2010). China’s main advantage is a lower
manufacturing cost structure relative to the European and US manufacturers
(Barclays Capital, 2010). Leading Chinese manufacturers are valued at $10.6B in market capitalization,
with revenues of $11.2B in 2008 (Barclays Capital, 2010). Per the chart, nine of the top ten PV panel
manufacturers in the world are based in China, but only two produce thin-film (Barclays Capital, 2010).
Japan Until 2003, Japan had the largest PV market but was surpassed by Germany in 2004. Japan’s
advantage is technology innovation as the global leader in solar energy patents (26%, of total). Japan has
15.70 solar patents per million residents, lower than California’s 16.78 solar patents per million but much
higher than the US at 4.69 per million (World Intellectual Property, 2010). In the past, it dominated the
manufacturing market with Sharp Corporation, but share has declined to 14% in 2009 (Interstate
Barclays Capital, 2010

21
Renewable, 2010). In light of the 2011 earthquake, Japan’s cluster may stall as the country focuses on
reconstruction.
6. California Solar Energy Cluster: History and Performance
Cluster history California is home to the United States’ first and largest solar energy cluster. With
the federal Energy Tax Act in 1978 as a catalyst, the first three solar companies launched in California:
ARCO Solar, Solar One, and LUZ. Commercial utility companies entered the industry in 1993, with
California-based Pacific Gas and Electric installing the first grid-supported PV system in the country. The
state government responded by deregulating California utilities and adding incentives for grid-tied PV
installations in 1996. In 2006, California adapted the robust German solar program to increase local
demand. This program coupled with the ‘green energy’ trend and access to venture capital further
supported growth of existing companies and new technology start-ups.
Current cluster performance Despite a historical first-mover advantage, the California solar
energy cluster is on the brink of decline if it does not upgrade activities. While it will remain the dominant
US solar cluster, it is losing international competitiveness relative to Germany and China. The German
government implemented an aggressive feed-in tariff that later served as the California model. But the
German market had already surpassed California, drawing solar companies, especially PV manufacturers,
into the country. China has emerged quickly as a leading PV manufacturer with a clear cost advantage.
Though California’s manufacturing revenues increased significantly in 2010, the Chinese cluster will force
California (and Germany) to transition to different products in order to survive. Per the chart, which
compares the US and California to China’s manufacturing costs, China has a cost advantage in every aspect
of C-Si cell manufacturing except for polysilicon pricing. However, China has perfected the low-cost, high-
scale manufacturing process for PV, a 25-year old commodity technology (Greentech Solar, 2011), which
allows California to adopt a stronger position in technological innovations.
California dominates the US market, with 69% of PV grid-tied capacity (2009), 63% of domestic
shipments (2008), and the highest number of solar projects in 2011 (79,351) (1,10). California has 20.8W

22
of cumulative installed PV capacity per capita, five times higher than the US national average of 4.2W but
only 20% of Germany’s 100W per capita installation (Interstate Renewable, 2010). Photovoltaic and Semi-
Conductor materials are among the fastest growing export segments in California, ranking in the top 25
commodity exports with $852M exported and a CAGR of 14% from 2007-2009 (US Census, 2011).
However, California’s main contribution to US solar exports internationally, PV Modules, are at a trade
deficit or neutral for the nation as a whole.
California is home to 30% of US solar companies, including 20% of crystalline silicon and 57% of
thin-film plants. Employment in the cluster is increasing as well, with 35,000 solar-related jobs (31% of the
US total), up from approximately 17,000 in 2008 (Centers of Excellence, 2008 and Solar Energy Industries
Assoc, 2010). The major global players are SunPower, manufacturer of high-efficiency technologies,
MEMC, leader in wafer manufacturing, Evergreen Solar, manufacturer of ‘string ribbon’ technology, and
Nanosolar and Miasole, thin-film producers (Barclays Capital, 2010). California has an early stronghold on
thin-film production. Nearby First Solar (located in Arizona) had a first-mover global advantage in thin-
film, creating the catalyst for spillover into California firms in the last five years.
California solar energy
cluster map The core of the
California Solar Energy cluster is
two-fold: 1) traded products and 2)
local services. The demand for local
services is driven by state subsidies
that bolster local demand, whereas the
demand for traded products is local,
national, and global. Cluster competitiveness depends on traded products, although high local demand
fosters supply-side innovation.

23
On the right-hand side, the three solar customer segments purchase the same solar products but the
size and installation of the systems differs by customer. Additionally, different government programs
support each segment to address demand limitations, such as the 20-year payback period for residential
systems (Frost and Sullivan, 2009). The related and supporting clusters play an important role in
developing the cluster’s core solar activities due to investments in early-stage technologies and on
increasing statewide renewable energy. The supporting structural institutions are at the bottom of the map,
like the Federal government, California state government, and IFCs, and the new UC educational program.
The government has a large role in creating local demand and continuing to grow the solar industry.
7. California Solar Energy Cluster: Diamond Model Analysis
Business environment Historically, the solar cluster benefitted from California’s location and
business environment as well as a first-mover advantage in the 1970s that provided a long history of
development. However, the technological and manufacturing playing field has leveled in the last five years,
and the California cluster has failed to upgrade its competitive business environment
Factor conditions
Natural endowment: high solar
radiation California receives 320-
240 sunny days per year and ranks
in the top three states for solar
radiation (Dsire Solar, 2011). This
natural endowment attracted the
first solar energy companies to
California in the 1970s, but
neighboring Arizona is equally as
sunny as California and has similar RPS standards (15% by 2025). Arizona has a much lower corporate tax
structure, as mentioned previously, which contributes to the risk of solar businesses leaving California (Tax

24
Foundation 2011). Several solar energy clusters have emerged in overcast areas such as Germany, calling
into question the necessity of a sunny climate. However, choosing California initially for this reason
provided the catalyst for the state government to develop a robust incentive plan once companies began to
flock to California’s sunny climate.
High quality scientific and technological infrastructure California has a strong solar advanced education
and investment in research and innovation. The state attracted four
federally-funded Department of Energy renewable energy labs with
solar programs. Additionally, the California government provided a
$2.25M five-year grant to found the Advanced Solar Technologies
Institute (UC Solar) in 2010, a multi-campus coordinated research
institute (UC Solar, 2011). UC Solar’s goal is to create innovative
solar technologies and bring them to market quickly; it has already
licensed over 25 solar technologies (UC Solar, 2011). This focus on solar-specific education and research
has resulted in impressive solar patent numbers. California is second only to Japan in global solar energy
patents with 21% (Clean Energy Patent Growth Index, 2010). In the US, California represented 39% of
solar energy patents from 2007-2009, up from 24% from 1995-1997 (Etsy and Porter, 2011). California has
16.78 solar patents per million, higher than Japan, the leader by absolute numbers (15.7), and the US (4.69)
(World Intellectual Property Organization, 2010).
Human resources: shortage of ‘green collar’ talent California’s workforce has an undifferentiated level
of university and advanced degree education attainment at 30% and 10%, respectively, of the workforce, on
par with the US’s average (US Census Bureau, 2011). Comparatively, Germany stands at 25% of the
population obtaining tertiary education (OECD, 2011). However, the California solar labor shortage is not
with engineers. Instead California is facing a drought of solar installers. In order to reach the CSI one
million solar roofs initiative, California will require more than 10,000 additional certified installers.
(Greenbiz, 2009). To combat this shortage, the state government has launched a $25M Clean Energy
Clean Energy Patent Growth Index, 2010

25
Workforce Training program, focused on providing certification in solar installation through community
colleges and other training programs (Go Solar California, 2011).
Complex solar permitting process and poor energy transmission The California solar permit process
adds an average of $2,500 in costs to each residential installation and streamlining could provide a $1
billion stimulus over 5 years (Zeller, 2011). Within California, the formula for permit fees varies by county,
and companies employ full-time workers just to manage the permitting process. A national or statewide
permit standardization process could make solar power price-competitive for 50% of homes in two years
(Zeller, 2011). Furthermore, California is constrained by inadequate transmission line, limiting the state
from reaching its 20% RPS requirements due to insufficient infrastructure (Barclays Capital, 2010).
Context for firm strategy and rivalry
Robust but potentially unstable state government solar program The California Solar Initiative (“CSI”)
is the largest PV incentive program in the US, with $2.25B in funding over ten years that supports the
development of 3 GW of PV installations (Barclays Capital, 2010). The Renewable Portfolio Standards
(“RPS”) are the most aggressive in the nation with a 20% renewable energy target by 2010 and 33% target
by 2020 (California Public Utilities, 2010). The strength of California’s program has resulted in continued
market growth since 2006. However, the severe state budget crisis calls into question the stability of an
expensive incentive scheme, which may cause companies to relocate to a more stable political environment.
Innovative GoSolar California firm coordination initiative California addressed the lack of coordination
amongst firms performing different activities with GoSolar California. This government-founded initiative
is a “one-stop shop" for solar companies and consumers through a central website. GoSolar coordinates
governments, financing partners, contractors, new homebuilders, and real estate professionals.
High labor costs As addressed in the California analysis, California has a higher minimum wage than the
US. Internationally, China’s average minimum wage is approximately $1.09 per hour (average $175 per
month) (Chen, 2010). Germany has no regulated minimum wage, but most solar workers report an average
of $14, which is equal to the minimum wage currently debated by the government (Williamson, 2008).
26
China’s manufacturing cost advantage is due to much lower labor costs, which is not a tactic available to
competing Western clusters.
Demand Conditions
High buyer sophistication and willingness to pay for ‘green energy’ Californians value environmentally
friendly products and alternative energy, contributing to the ‘green energy’ craze of the last decade. The
government’s aggressive approach to solar incentives has heightened awareness about solar, further
contributing to Californian’s willingness to pay. According to replicated studies, 20% of Californians are
willing to pay up to a 30% premium for solar energy to be part of a collective movement (Farhar, 1996).
High environmental standards and regulation California sets the national standard in environmental
policy and regulation, beginning with the 1970 California Environment Quality Act, which requires
businesses to disclose and mitigate all environmental impact. In addition to the renewable portfolio
standards, California has a ‘scoping plan’ that requires a return to 1990 emissions levels by 2020, with the
Million Solar Roofs initiative as a key component of the plan (Center for Sustainable Energy, 2011).
Related and supporting industries
Extremely high collaboration among clusters California’s Silicon Valley and venture capital clusters
have played an important role in the growth of California’s solar energy cluster. The Silicon Valley cluster
continues to be the leading hub for high-tech innovation, accounting for 32% of US venture capital
investment (Pricewaterhouse, 2011) and 50% of California’s annual exports (Team California, 2011).
Silicon Valley veterans are founding many solar start-ups such as Solyndra, Nanosolar, and MiaSolé.
Venture capital has an equally strong position in California, which received the most venture-backed
funding in the US (50%) (Team California, 2011). With the 2001 technology recession, firms began
investing in California solar companies, creating a dynamic interaction between Silicon Valley’s interest in
solar technology and venture capital support. In 2008, six out of top ten largest US VC investments were in
solar companies ($1.1B), and five out of the six companies are in California (Wesoff, 2009). The California

27
solar energy cluster developed out of these two related clusters; the capital and technology spillovers have
spurred its growth for the past decade and set the tone for a new focus on solar technological breakthroughs.
Collaboration within the cluster: IFCs have limited information sharing The 13 California solar IFCs
address multiple issues individually from employment to technology innovation, but few are effective at
sharing best practices. The IFC that is most effective in creating shared research and innovations across the
sector is Intersolar, the largest and most prestigious North American solar conference in San Francisco.
Instead, California solar has relied on the state’s renewable energy competitiveness initiative, California
Renewable Energy Transmission Initiative (RETI), which identifies transmission projects needed for
energy goals, supports energy policy, and facilitates permitting. Specifically, RETI assesses renewable
energy zones to identify cost effective and environmentally friendly locations. Instead of relying on the
umbrella cluster of renewable energy, the solar cluster needs a complementary competitiveness initiative
that unites the fragmented IFCs and establishes a platform for communicating and sharing best practices.
7. Risks and Recommendations for California Solar Energy Cluster
Cluster risks Based on the diamond analysis, the California solar energy cluster has failed to continuously
upgrade its competitiveness, allowing for other clusters in Europe and Asia to develop rapidly. Four risks
that follow from the previous analysis that are particularly threatening to the California cluster include:
Reduced competitiveness in traditional PV manufacturing The California cluster has already
experienced a reduced market share for traditional PV solar cells, with Chinese companies capturing 40%
the PV solar cell sales in California in 2009 (Woody, 2010). In particular, China’s Suntech accounted for
18% of module sales in California (SBI Energy, 2010).
Fragmentation of solar technology start-ups Though strong venture capital investment and Silicon
Valley spillover to the solar cluster has greatly increased its competitiveness in new solar technologies, the
increase in entrepreneurs and solar start-ups competing for venture capital funding results in a non-
transparent environment. Small companies with highly skilled technology engineers risk duplicating
research efforts without a broader platform to share information among the smaller firms. Without a

28
collaborative focus on innovation, California faces the additional risk of never reaching grid-parity, which
is imperative to create a subsidy-free market and requires a technological breakthrough.
Incentive program stability and company relocation The state is facing a crippling budget crisis, calling
into question its ability to sustain its solar program, which is expected to cost $2-3 billion in the next
decade (Solar Energy Industries Assoc, 2010). Industry experts are predicting that California’s incentives
will be unsustainable over the next decade, which, if true, could result in a Spain-like crash in the market,
causing firms to relocate to a market with strong local demand and stable incentive program.
Infrastructure (transmission and permitting process) Furthermore, meeting the state’s aggressive RPS
goals will be challenging with current infrastructure limitations, specifically the lack of transmission lines
and the highly inefficient and variable permitting process. Though the solar incentives are tempting for
companies, the deterrents of bureaucratic red tape, high fees and labor costs to obtain a project approval,
and an outdated energy infrastructure can offset the benefit of subsidies.
Recommendations for firms and IFCs The following recommendations address issues facing the
cluster business environment to stem decline and reposition the cluster as a technology and innovation hub.
Reduce reliance on PV manufacturing, shift activities to innovation To address loss of manufacturing
competitiveness and imminent need for grid-parity, California firms should prioritize production and
investment in thin-film and promote a demand for all solar innovation. As discussed previously, California
has a strong position in the global thin-film market, and most of the venture-backed solar funding is in next
generation technologies. California is well positioned to coordinate a innovation competitiveness initiative
(detailed below) as the new global technological leader.
Launch start-up competitiveness initiative via IFCs Though the cluster has 13 solar IFCs, most lack
private-sector collaboration. First, firms facing a shortage of ‘green’ labor should work with the solar
workforce development IFC and the governor’s green job initiative to create specific training for a pipeline
of talent and additional jobs. For high-skilled labor and multi-firm research needs, firms should formalize a
partnership with the UC Advanced Solar Institute to highlight group research requests. To address the low

29
coordination amongst the solar start-ups, one new IFC should pool resources to create economies of scale
for innovation and eliminate research redundancies. Specifically, the venture capital cluster should fund a
‘solar incubator’ that provides centralized support functions for solar technology entrepreneurs and shares
technology and research across teams and start-ups. This incubator will provide a coordinated platform for
increased innovation and maximize effectiveness of venture capital by testing technologies
Recommendations for government
Overhaul state permitting process California’s immediate priority should be simplifying and
standardizing the solar permitting process. Working with the federal government’s newly announced
standardization plan, the state government should develop an online common form for each segment
(residential, commercial, utility) and transition all municipal governments to this form in the next two years.
Additionally, the formula to calculate permitting costs should be standardized across the state. Firms will
be willing to invest in smaller test projects for new technologies if the barrier to permits and approvals is
reduced, and fewer companies will be incented to move to neighboring states.
Address poor transmission infrastructure Partner with utility companies to invest in improved
transmission and grid-tied solar capabilities, which will enable utilities to reach their 2020 RPS goal.
California should provide tax cuts for utility companies that invest in upgrading transmission grids, and
should convene utility company leaders to create a ten-year milestone plan with rewards for reaching
targets. An added benefit of increased transmission infrastructure is that residential or commercial grid-tied
systems may be able to ‘sell back’ to the grid, lowering the long payback period of a solar system.
Shift incentive programs from a subsidy focus to a focus on market creation Ideally, solar energy will
reach cost efficiency through technological advancements, allowing the government to remove subsidies.
In the meantime, the state should gradually restructure the incentive plan for three purposes: 1) reduce the
risk of incentive instability, 2) increase waning consumer confidence due to the budget crisis, and 3) stop
outflows of government revenue.

30
The incentive plan is overly focused on ‘installation’ and ‘production’ incentives and less on
creating a demand for technological innovation. Two solutions are possible: the state government could
incent private-sector firms to focus on technology by creating rewards and grants instead of compensating
individual residential, commercial, or utility project. The second alternative is replacing subsidies with a
carbon emissions tax that forces a higher demand for innovation and removes the government’s
involvement in selecting technologies. Porter and Esty suggest an initial charge of $5 per ton of greenhouse
gases beginning in 2012 (Esty and Porter, 2011). State regulation should provide governance and
accountability but eliminate involvement in driving the local demand.

31
Required Disclosures
(1) Four of the five team members are US citizens but no one is from California. (2) No non-public access (with the exception of Baker library reports). (3) No team members traveled to California during the project period.
Bibliography Agenda for Economic Recovery. (2011). “California’s Deteriorating Economic Situation.” Retrieved from http://www.economicrecoveryca.org/challenges/detail.php?_c=y754k261zyxnmy&id=y4aza7u2u1xrdz. American Society of Civil Engineers. (2011). “Report Card for America’s Infrastructure.” Retrieved from http://www.infrastructurereportcard.org/. American Workplace. (2011). “The Shift to a Service Economy”. Retrieved from http://jobs.stateuniversity.com/pages/16/American-Workplace-SHIFT-SERVICE-ECONOMY.html. Barclays Capital. (2010). “Solar Energy Handbook.” California Public Utilities Commission. (2010). “33% Renewables.” Retrieved from http://www.cpuc.ca.gov/PUC/energy/Renewables/hot/33implementation.htm. CA.gov. (2011). “Labor Laws and Regulations.” Retrieved from http://www.labor.ca.gov/laborlawreg.htm. Center for American Progress. (2011). “Reorganizing Government to Promote Competitiveness.” Retrieved from http://www.americanprogress.org/issues/2011/03/competitiveness_brief.html. Center for Sustainable Energy California. (2011). Retrieved from https://energycenter.org/. Centers of Excellence. (2008). “Emerging Industry and Occupations Report – Solar Study 2008.” Retrieved from http://coeccc.net/solar/documents/Emerging_solar_08.pdf. Chen, D. and Mintz, J. CATO Institute. “US Effective Corporate Tax Rate on New Investments Highest in the OECD.” Retrieved from http://www.cato.org/pubs/tbb/tbb_62.pdf. CIA World Factbook. (2011). “Country Comparison: GDP.” Retrieved from https://www.cia.gov/. CIA World Factbook. (2011). “The United States GDP Real Growth Rate.” Retrieved from https://www.cia.gov/. CIA World Factbook. (2011). “Country Comparison: Distribution of Family Income, Gini Index.” Retrieved from https://www.cia.gov/library/publications/the-world-factbook/rankorder/2172rank.html. Clean Energy Patent Growth Index. (2010). “2010 Year In Review.” Retrieved from http://cepgi.typepad.com/heslin_rothenberg_farley_/clean_energy_patent_growth_index/. Cook, C. (2010). “Shanghai tops global state school rankings.” Financial Times. Retrieved from http://www.ft.com/cms/s/0/20770bf6-01e7-11e0-b66c-00144feabdc0.html#axzz1LKLPHYU3. Department of Industrial Relations. (2011). Retrieved from: http://www.dir.ca.gov/DLSE/dlse.html.

32
Domhoff, G., W. (2011) “Who Rules America.” University of California. Retrieved from http://sociology.ucsc.edu/whorulesamerica/power/wealth.html. DSire Solar. (2011). “Solar Set-Asides in Renewables Portfolio.” Retrieved from http://www.dsireusa.org/solar/solarpolicyguide/?id=21. Economist Intelligence Unit. (2011). EIU. Economic Intelligence Unit. (2010). “Economic Intelligence Unit’s Index of Democracy 2010.” Retrieved from http://graphics.eiu.com/PDF/Democracy_Index_2010_web.pdf. Esty, D. and Porter, M. (2011). “Pain at the Pump? We Need More.” The New York Times. Retrieved from http://www.nytimes.com/2011/04/28/opinion/28esty.html. Farhar, B.C. and Houston, A.H. (1996). “Willingness to Pay for Electricity from Renewable Energy.” National Renewable Energy Lab. Retrieved from: https://www.etde.org/etdeweb//servlets/purl/399985-OpPqii/webviewable/399985.pdf. FINRA Investor Education Foundation. (2011). “US Financial Capability Study.” Retrieved from http://www.usfinancialcapability.org/survey_data.html. Frost and Sullivan. (2009). “Global Solar Power Markets.” Go Solar California. (2011). “The California Solar Initiative”. Retrieved from http://www.gosolarcalifornia.ca.gov/csi/index.php. Greenbiz. “California Kicks off $75M Green Jobs Training Program.” (2009). Retrieved from http://www.greenbiz.com/news/2009/09/03/california-kicks-75m-green-jobs-training-program. GreenTechMedia. (2010). “2010 Global PV Demand Analysis and Forecast.” Retrieved from http://www.gtmresearch.com/report/2010-global-pv-demand-analysis-and-forecast. Greentech Solar. (2011). “Solar Summit 2011: Is US PV Manufacturing Doomed to Failure?” Retrieved from http://www.greentechmedia.com/articles/read/solar-summit-is-u.s.-pv-manufacturing-doomed-to-failure. Interstate Renewable Energy Council. (2010). “U.S. Solar Market Trends”. Retrieved http://irecusa.org/wp-content/uploads/2010/07/IREC-Solar-Market-Trends-Report-2010_7-27-10_web1.pdf. International Telecom Union. (2007). “World Information Society Report.” UN Conference on Trade and Development. Retrieved from http://www.itu.int/osg/spu/publications/worldinformationsociety/2007/WISR07_full-free.pdf. Kauffman Foundation. (2007). “U.S.-based Global Intellectual Property Creation.” Retrieved from http://www.kauffman.org/uploadedFiles/WIPO_103107.pdf. Legislative Analyst’s Office. (2011). “California’s Economy and Budget in Perspective.” Retrieved January 5, 2011 from http://www.lao.ca.gov/reports/2011/calfacts/calfacts_010511.aspx.

33
Milken Institute. (2009). “A More Prosperous California.” Retrieved from http://www.milkeninstitute.org/publications/publications.taf?function=detail&ID=38801202&cat=resrep. Landler, M. (2008). “Germany Debates Subsidies for Solar Industry.” The New York Times. Retrieved from http://www.nytimes.com/2008/05/16/business/worldbusiness/16solar.html?pagewanted=2&ei=5124&en=7816e306c4840eec&ex=1368676800&partner=permalink&exprod=permalink. OECD Productivity Database. (2007). “Growth in GDP per hour worked.” Retrieved from www.oecd.org/statistics/productivity. Organization for Economic Cooperation and Development: Education. (2011). “Education at a Glance 2010: OECD Indicators.” Retrieved from http://www.oecd.org/document/52/0,3746,en_2649_39263238_45897844_1_1_1_1,00.html#hto. Perry, F. N. (2010). “2010 California Green Innovation Index.” Next10.org. Retrieved from http://www.next10.org/next10/pdf/GII/Next10_GII_2010.pdf. Porter, M. (2008). “Why America Needs an Economic Strategy.” Businessweek. Retrieved from http://www.businessweek.com/magazine/content/08_45/b4107038217112.htm. PricewaterhouseCoopers. (2011). “Money Tree Report.” Retrieved from https://www.pwcmoneytree.com/MTPublic/ns/index.jsp. Primack, D. (2011). “Bubblicious? Global VC deal sizes keep rising.” CNN Money. (2011). Retrieved from http://finance.fortune.cnn.com/2011/05/03/bubblicious-global-vc-deal-sizes-keep-rising/?section=magazines_fortune. Public Policy Institute of California. (2011). “The California Economy.” Retrieved from http://www.ppic.org/content/pubs/report/R_111JKR.pdf. Wang, U. (2011). “Japan’s Quake to Shake the Solar Market?” Renewable Energy World. Retrieved from http://www.renewableenergyworld.com/rea/news/article/2011/03/japans-quake-to-shake-the-solar-market. Roney, J.M. (2009). “Solar Cell Production Climbs to Another Record in 2009”. Renewable Energy Word. Retrieved from http://www.renewableenergyworld.com/rea/news/print/article/2011/02/solar-cell-production-climbs-to-another-record-in-2009. Rose Institute of State and Local Government. (2011). “Kosmont Cost of Doing Business Survey.” Retreived from http://rosereport.org/kosmont/. “US Solar Energy Market - 2nd edition.” SBI Energy. (2010). Solar Energy Industry Association. (2010). “U.S. Solar Market Insight: 2010 Year in Review.” Retrieved from http://www.seia.org/galleries/pdf/SMI-YIR-2010-ES.pdf. Solar Energy Industries Association. (2010).“Trade Flows and Domestic Content for Solar Energy-Related Goods and Services in the U.S.” GTM Research. Solar Energy Industries Association. (2010). “U.S. Solar Energy Trade Assessment 2010.” GTM Research.

34
Stanford Institute for Economic Policy Research. (2010). “Going for Broke: Reforming California’s Public Employee Pension Systems.” Retrieved from http://siepr.stanford.edu/system/files/shared/GoingforBroke_pb.pdf. State of California Department of Consumer Affairs. (2010). “Consumer Protection Enforcement Initiative.” Retrieved from http://www.dca.ca.gov/about_dca/cpei/overview.pdf. Standard and Poor’s. (2011). “Report Examines Credit Profiles of California and Greece. Retreived from http://www.standardandpoors.com/prot/ratings/articles/en/us/?assetID=1245303924319. Tax Foundation. (2011). “Research Areas – Arizona, California.” Retrieved from http://www.taxfoundation.org/research/topic/13.html. Team California. (2011). “California Solar Industry.” Retrieved from http://www.teamca.org/solar_energy.php. The Conference Board. (2011). “The Conference Board Total Economic Database.” Retrieved from www.conference-board.org. Toy Industry Association. (2011). “Safety Standards.” Retrieved from http://www.toyassociation.org/AM/Template.cfm?Section=U_S_Standards. Trading Economics. (2011). “United States Unemployment Rate: April 2011.” Retrieved from http://www.tradingeconomics.com/united-states/unemployment-rate. United States Treasury. (2010). “Gross External Debt Position: December 31, 2010.” Retrieved from http://www.treasury.gov/resource-center/data-chart-center/tic/Documents/debtad10.html. University of California Solar. (2011). Retrieved from http://ucsolar.ucmerced.edu/inventions/uc-santa-barbara. US Bureau of Economic Analysis. (2011). Retrieved from www.bea.gov. US Census Bureau. (2011). Retrieved from http://www.census.gov/hhes/socdemo/education/. US Census Bureau. (2011).“Population profile of the United States.” Retrieved from http://www.census.gov/population/www/pop-profile/natproj.html. U.S. Department of Energy. (2001). “Annual Energy Outlook 2001: With Projections to 2020.” Retrieved from http://www.gcrio.org/OnLnDoc/pdf/aeo2001.pdf. US News and World Report. (2010). “World’s Best Universities.” Retrieved from http://www.usnews.com/education/worlds-best-universities/articles/2010/09/21/worlds-best-universities-top-400-?PageNr=2. Wesoff, Eric. (2009). “Greentech Venture Capital Summary for 2009.” Retrieved from http://seekingalpha.com/article/180424-greentech-venture-capital-summary-for-2009?source=from_friend.

35
Williamson, Hugh. (2008). “Not everyone is happy in east Germany’s Solar Valley.” Financial Times. Retrieved from: www.ft.com/cms/s/0/85555be6-eecf-11dc-97ec-0000779fd2ac.html. Woody, Todd. (2010). “Silicon Valley’s Solar Innovators Retool to Catch Up to China.” The New York Times. Retrieved from http://www.nytimes.com/2010/10/13/business/energy-environment/13solar.html?_r=1&pagewanted=1. World Bank Group. (2011). “Ease of Doing Business in the United States.” http://www.doingbusiness.org/data/exploreeconomies/united-states. World Bank Report. (2010). “Employing Workers in the United States.” Retrieved from http://www.doingbusiness.org/data/exploreeconomies/united-states/employing-workers/. World Economic Forum. (2011). “The Global Competitiveness Report: 2010-2011.” World Intellectual Property Organization. (2010). “World Intellectual Property Indicators.” Retrieved from http://www.wipo.int/export/sites/www/ipstats/en/statistics/patents/pdf/941_2010.pdf. Zeller, T. (2011). “Solar Firms Frustrated by Permits.” Retrieved from http://www.sunrunhome.com/uploads/media_items/solar-report-on-cost-of-solar-local-permitting.original.pdf.
Recommended