Valence Politics and Electoral Choice in Britain, 2010
by
Harold D. Clarke School of Economic, Political and Policy Sciences
University of Texas at Dallas and Department of Government
University of Essex email: [email protected]
David Sanders
Department of Government University of Essex
email: [email protected]
Marianne C. Stewart School of Economic, Political and Policy Sciences
University of Texas at Dallas email: [email protected]
Paul Whiteley
Department of Government University of Essex
email: [email protected]
Version: Revised, JEPOP, January 17, 2011
1
Abstract
Valence Politics and Electoral Choice in Britain, 2010
This paper presents the results of analyses of forces shaping electoral choice in the 2010 British
general election. The analyses are based primarily on data gathered in the Campaign Internet
Panel Survey (CIPS) that was conducted as part of the 2010 British Election Study (BES). Tests
of rival models of electoral choice reveal that, as in earlier British elections, a valence politics
model provides a strong explanation of voting decisions. However, as in those earlier contests, a
model based on the spatial modeling tradition also contributes to understanding how voters made
up their minds in 2010. The paper concludes by reprising major findings and discussing why the
Conservatives failed to secure a majority in a context seemingly ideally suited for them to do so.
2
Valence Politics and Electoral Choice in Britain, 2010
The 2010 British general election was an exciting but inconclusive contest. When voters
awoke on May 7th, they found that they had elected a hung parliament—no party had won a
majority of seats. Over the next few days, the Conservatives and Liberal Democrats constructed
an agreement for a coalition government, thereby forcing Prime Minister Gordon Brown and his
government from office, some 13 years after Labour had taken the reins of power with its
dramatic victory in the May 1997 general election. This paper presents the results of analyses of
forces shaping Labour's reversal of electoral fortune in 2010. The analyses are based primarily
on data gathered in the Campaign Internet Panel Survey (CIPS) that was conducted as part of the
2010 British Election Study (BES).1 Tests of rival models of electoral choice reveal that, as in
earlier British elections, a valence politics model provides a strong explanation of voting
decisions. However, as in those earlier contests, a model based on the spatial theoretical
tradition also contributes to understanding how voters made up their minds in 2010. The paper
concludes by reprising major findings and discussing why the Conservatives failed to secure a
majority in a context seemingly ideally suited for them to do so.
Valence Politics 2010
The valence politics model (Clarke et al., 2004, 2009; see also Clarke, Kornberg and
Scotto, 2009) is inspired by the work of the Stokes (1963, 1992). Unlike spatial models of party
competition (e.g., Downs, 1957; Merrill and Grofman, 1999; Adams, Merrill and Grofman,
2005) that emphasize 'pro-con' issues upon which voters take differing positions, the valence
politics models give ‘pride of place’ to what Stokes called ‘valence issues’, i.e., issues upon
which there is widespread agreement. The economy, a dominant issue in 2010, is a classic
example of a valence issue, with overwhelming percentages of people endorsing vigorous,
3
sustainable economic growth, coupled with low levels of inflation and unemployment. Health
care, education, crime and terrorism are other excellent contemporary examples. Virtually
everyone wants high quality, affordable and accessible health care and education, virtually
everyone wants security from the security threats posed by criminals and terrorists. In the realm
of valence politics, it is not ‘what’, but rather ‘who’, and ‘how’ that matters.
The valence politics model also emphasizes the importance of party leader images and
party identifications. These images and identifications are important because they serve as cues
that enable voters to make sensible political choices in a political world where stakes are high
and the risks of alternative possible courses of action are difficult, often impossible, to calculate.
Leader images and partisan attachments serve as ‘fast and frugal heuristics’ (Gigerenzer, 2008)
for voters who are 'smart enough to know they are not smart enough' to behave in accordance
with the canons of traditional rational choice theory. Pace Butler and Stokes (1969) and other
analysts who have downplayed the impact of leaders in British electoral politics, there is
considerable evidence that voters rely heavily on leader images for information about who is
most likely to 'do the job' (e.g., Clarke et al., 2004). They also rely on their party identifications
for helpful cues, but their partisanship is not 'cast in stone'. Rather, partisan attachments may
change in the face of evidence concerning recent party and leader performance. In the language
of Fiorina’s (1981) well-known ‘running tally’ metaphor, voters update their partisan
attachments emphasizing recent performance and progressively discounting previous
performance. The results of these updating exercises vary; sometimes voters ‘stand pat’, other
times they ‘move on’.
Leader Images
4
Although there were several important events in the long campaign preceding the 2010
election, one of the most significant was the replacement of Tony Blair by Gordon Brown as
leader of the Labour Party and Prime Minister. Brown had thirsted after his party's leadership
for well over a decade and, when he finally attained it, the impact on public opinion was
significant. After the 2005 election, Labour's popularity had declined concomitant with growing
disaffection with Prime Minister Blair, whose steadfast support for British involvement in the
Iraq War had made him increasingly unpopular, both in the country as a whole and, perhaps
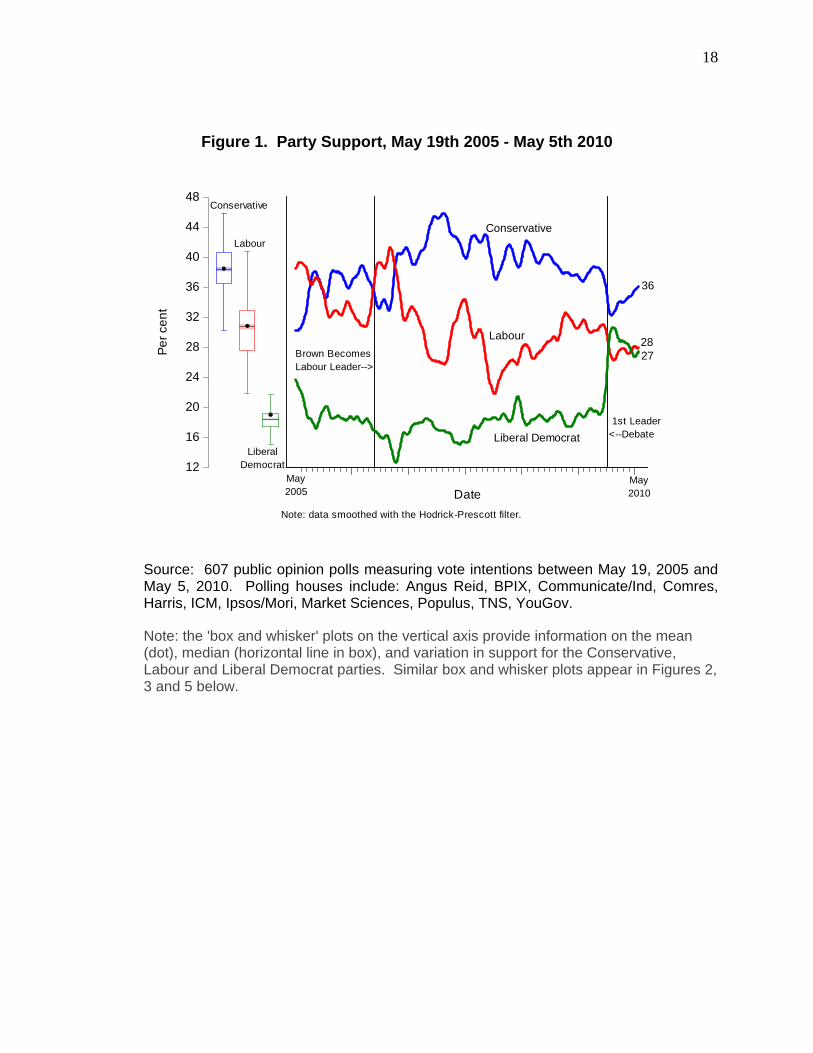
especially, among Labour activists (Clarke et al., 2009, ch. 4). As Figure 1 shows, Blair's exit in
favour of Brown in late June 2007 was accompanied by an immediate, sharp increase in Labour
support, with the party surging ahead of the Conservatives in the polls. The 'Brown bounce'
continued as autumn approached, and a number of 'young Turks' among the new Prime
Minister's advisors advised him to use the opportunity to go to the people to secure a new
mandate for himself and his party. Ever cautious, Brown agonized about calling an election,
before finally rejecting it in early October when a poll of key marginals suggested that a Labour
victory was not a sure thing. Soon afterwards, Labour support eroded concomitant with surging
Conservative popularity. In the event, Labour's lead in the polls was gone for good.
(Figure 1 about here)
Although Labour consistently trailed the Conservatives after the autumn of 2007, the
party's fortunes did revive a year later. The failure of Lehman Brothers on September 15, 2008
shocked economies throughout the world. Britain was no exception, and the deepening financial
crisis presented Mr. Brown and his party with enormous problems and a possible political
opportunity. As Chancellor of the Exchequer between 1997 and 2007, Brown had presided over
a lengthy period of economic expansion. He was portrayed as the 'Iron Chancellor'—someone
5
whose will and wit enabled him to deliver on his promise to end the cycle of 'boom and bust' that
had bedeviled the British economy throughout the post-World War II era. Playing on this
reputation in the weeks after Lehman's Brothers failure, Brown claimed he was assuming an
international leadership role in addressing the global financial crisis. Labour's support revived
and, as 2008 drew to a close, it appeared that Brown might have turned serious economic
adversity into significant political advantage.
The advantage may have been real but, it was also transitory and insufficient to effect a
long-run reversal of political fortune. Labour did not overtake the Conservatives in the polls (see
Figure 1) and, as the financial crisis continued into 2009, Brown's image as a 'master of the
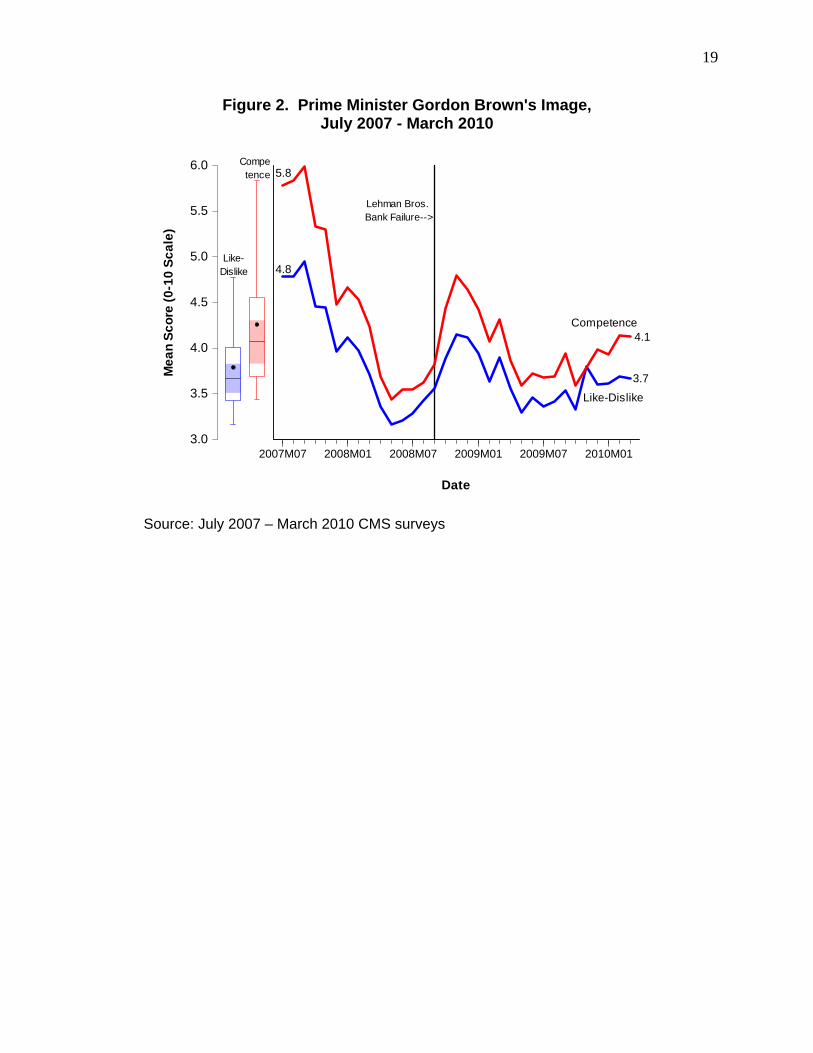
economic universe' became increasingly tarnished. Indeed, as Figure 2 shows, his competence
ratings fell significantly, closely tracking more general feelings about him. When Brown had
become Prime Minister, his mean competence rating (5.8 points on a 0-10 scale) was impressive
and well above his affect score (4.8).2 This gap was consistent with what a number of
commentators had predicted. Brown may have been widely seen as a dour, abrasive person but,
building on his 'Iron Chancellor' image, he also was widely seen as highly competent. However,
as Figure 2 shows, the competence dimension of Brown's image had strong dynamics. It
collapsed in the late autumn of 2007, briefly revived in the wake of the financial crisis a year
later, and then collapsed again. On the eve of the 2010 election, the Prime Minister clearly could
not rely on his erstwhile reputation as a man who could get the job done. Although his
competence score (4.1) in the March 2010 CMS was slightly higher than his affect score (3.8),
both numbers were very mediocre for someone with aspirations to win a general election (Clarke
et al., 2004: ch. 4; 2009: ch. 5). Operating in a political environment where competence counts,
Brown had lost what many observers had surmised would be his electoral trump card.
6
(Figure 2 about here)
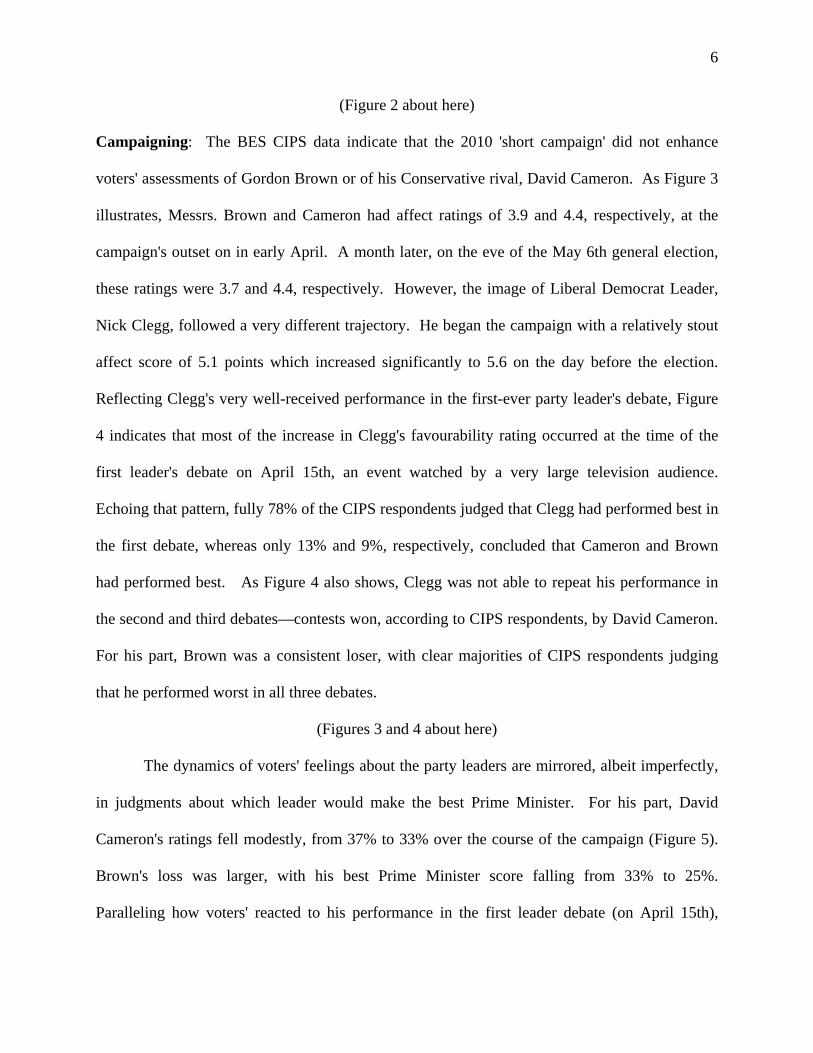
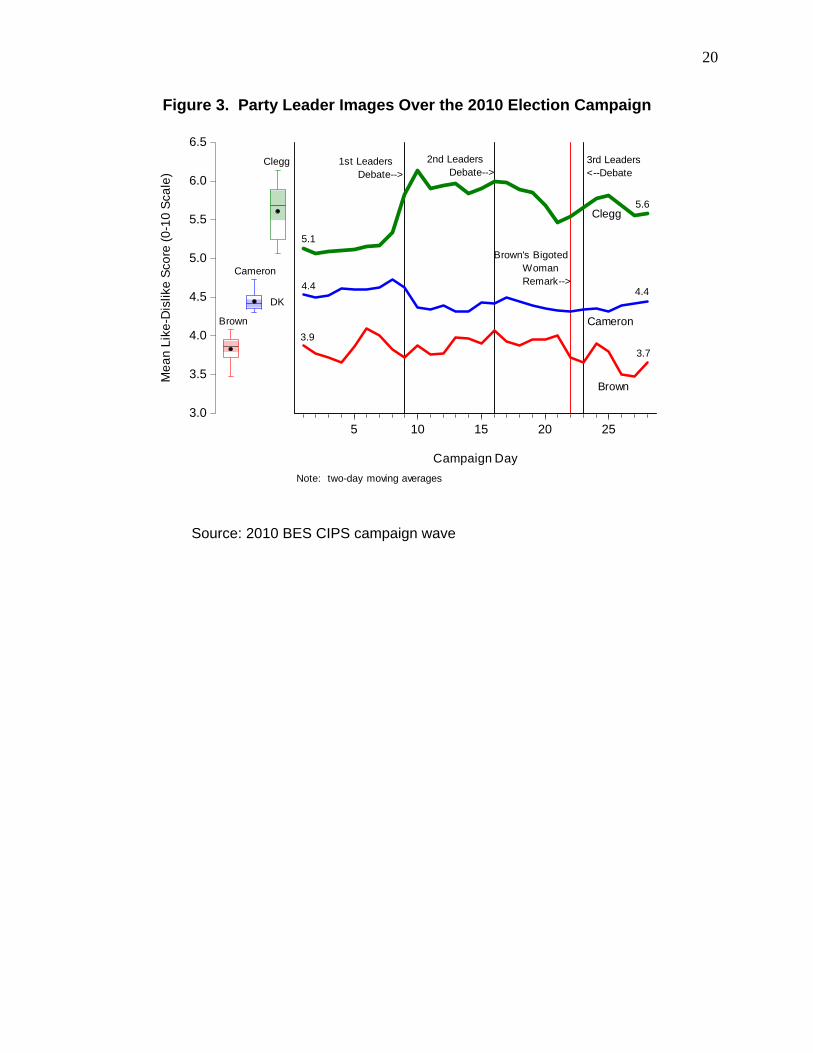
Campaigning: The BES CIPS data indicate that the 2010 'short campaign' did not enhance
voters' assessments of Gordon Brown or of his Conservative rival, David Cameron. As Figure 3
illustrates, Messrs. Brown and Cameron had affect ratings of 3.9 and 4.4, respectively, at the
campaign's outset on in early April. A month later, on the eve of the May 6th general election,
these ratings were 3.7 and 4.4, respectively. However, the image of Liberal Democrat Leader,
Nick Clegg, followed a very different trajectory. He began the campaign with a relatively stout
affect score of 5.1 points which increased significantly to 5.6 on the day before the election.
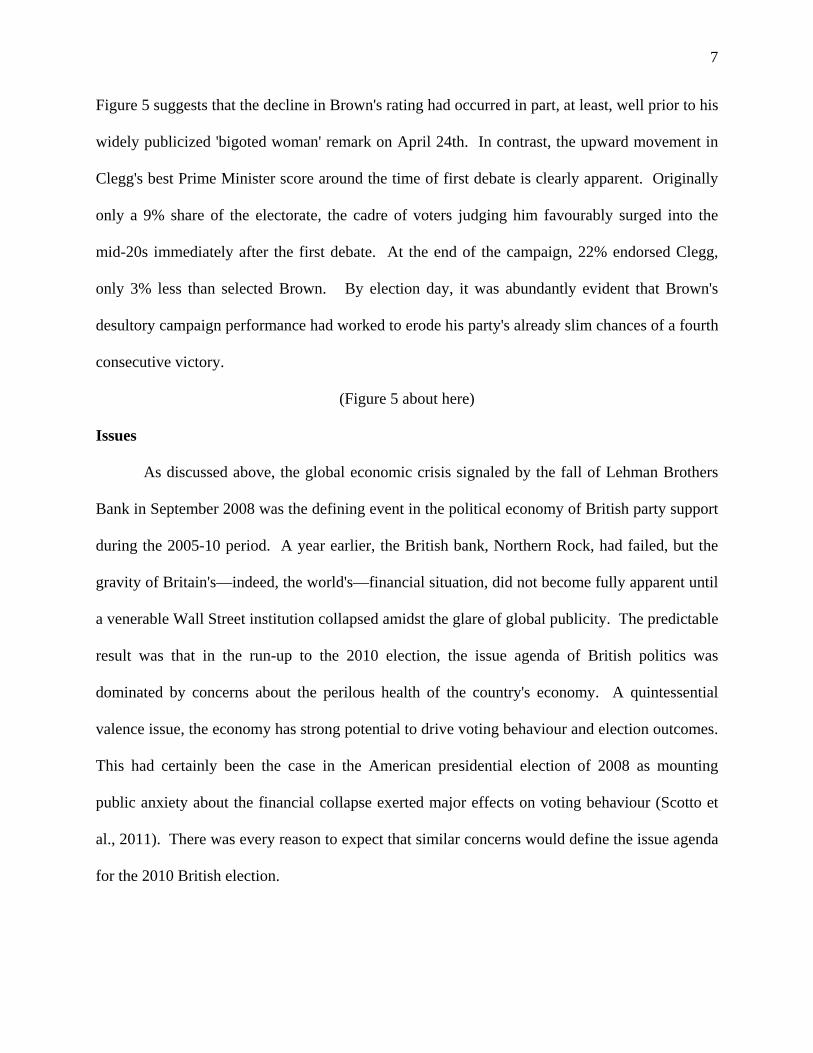
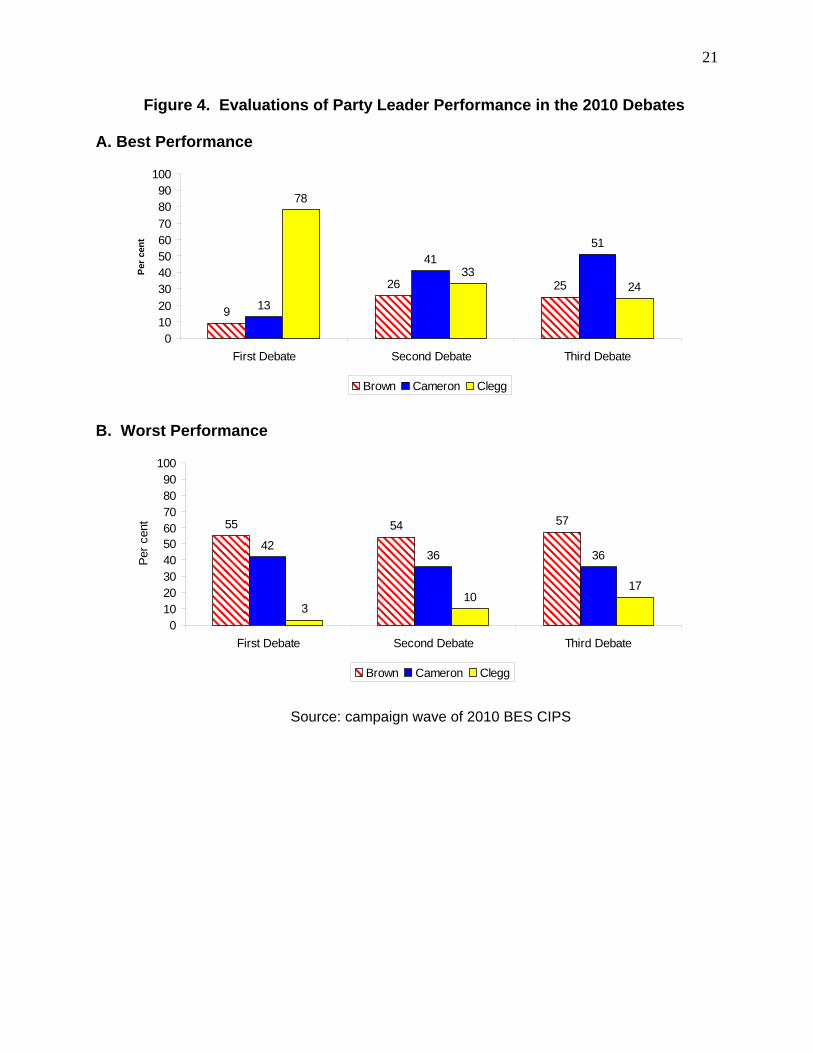
Reflecting Clegg's very well-received performance in the first-ever party leader's debate, Figure
4 indicates that most of the increase in Clegg's favourability rating occurred at the time of the
first leader's debate on April 15th, an event watched by a very large television audience.
Echoing that pattern, fully 78% of the CIPS respondents judged that Clegg had performed best in
the first debate, whereas only 13% and 9%, respectively, concluded that Cameron and Brown
had performed best. As Figure 4 also shows, Clegg was not able to repeat his performance in
the second and third debates—contests won, according to CIPS respondents, by David Cameron.
For his part, Brown was a consistent loser, with clear majorities of CIPS respondents judging
that he performed worst in all three debates.
(Figures 3 and 4 about here)
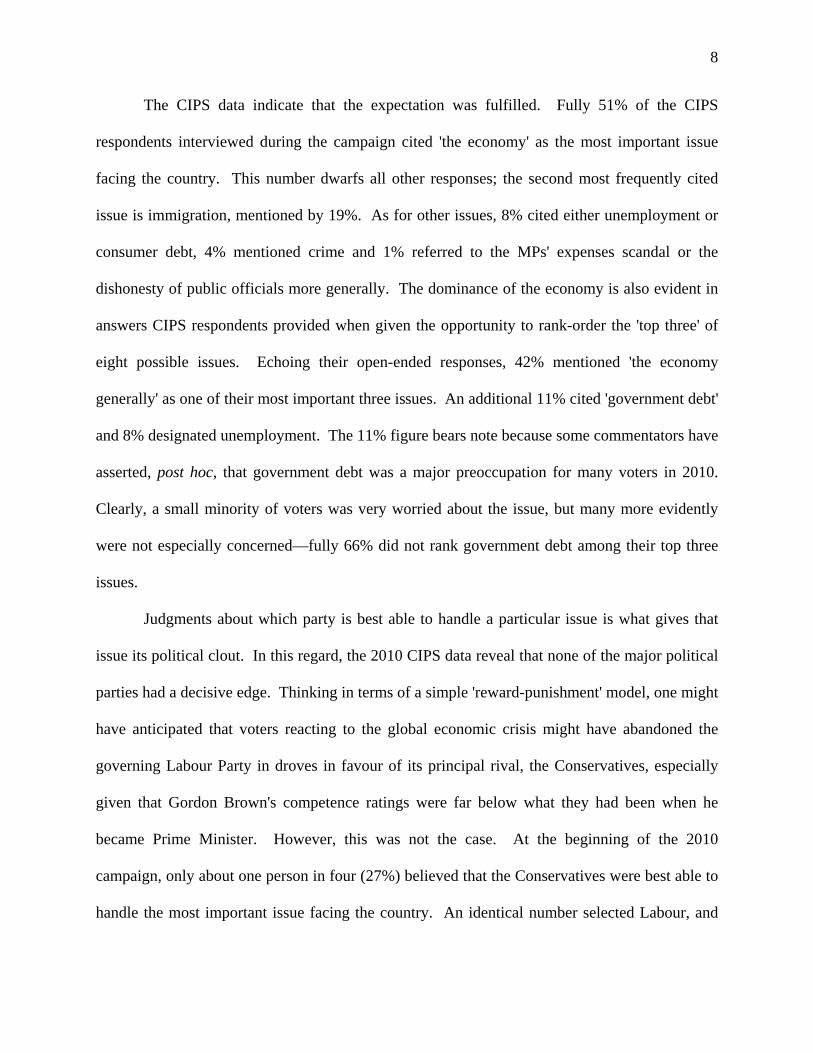
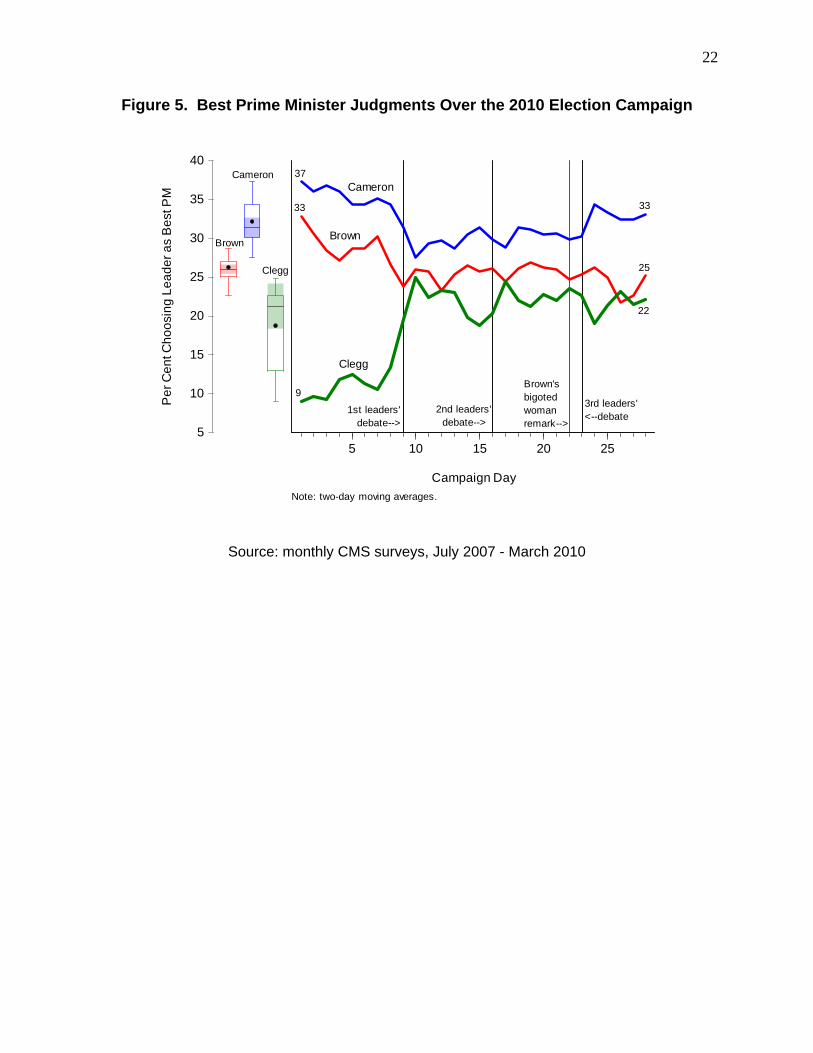
The dynamics of voters' feelings about the party leaders are mirrored, albeit imperfectly,
in judgments about which leader would make the best Prime Minister. For his part, David
Cameron's ratings fell modestly, from 37% to 33% over the course of the campaign (Figure 5).
Brown's loss was larger, with his best Prime Minister score falling from 33% to 25%.
Paralleling how voters' reacted to his performance in the first leader debate (on April 15th),
7
Figure 5 suggests that the decline in Brown's rating had occurred in part, at least, well prior to his
widely publicized 'bigoted woman' remark on April 24th. In contrast, the upward movement in
Clegg's best Prime Minister score around the time of first debate is clearly apparent. Originally
only a 9% share of the electorate, the cadre of voters judging him favourably surged into the
mid-20s immediately after the first debate. At the end of the campaign, 22% endorsed Clegg,
only 3% less than selected Brown. By election day, it was abundantly evident that Brown's
desultory campaign performance had worked to erode his party's already slim chances of a fourth
consecutive victory.
(Figure 5 about here)
Issues
As discussed above, the global economic crisis signaled by the fall of Lehman Brothers
Bank in September 2008 was the defining event in the political economy of British party support
during the 2005-10 period. A year earlier, the British bank, Northern Rock, had failed, but the
gravity of Britain's—indeed, the world's—financial situation, did not become fully apparent until
a venerable Wall Street institution collapsed amidst the glare of global publicity. The predictable
result was that in the run-up to the 2010 election, the issue agenda of British politics was
dominated by concerns about the perilous health of the country's economy. A quintessential
valence issue, the economy has strong potential to drive voting behaviour and election outcomes.
This had certainly been the case in the American presidential election of 2008 as mounting
public anxiety about the financial collapse exerted major effects on voting behaviour (Scotto et
al., 2011). There was every reason to expect that similar concerns would define the issue agenda
for the 2010 British election.
8
The CIPS data indicate that the expectation was fulfilled. Fully 51% of the CIPS
respondents interviewed during the campaign cited 'the economy' as the most important issue
facing the country. This number dwarfs all other responses; the second most frequently cited
issue is immigration, mentioned by 19%. As for other issues, 8% cited either unemployment or
consumer debt, 4% mentioned crime and 1% referred to the MPs' expenses scandal or the
dishonesty of public officials more generally. The dominance of the economy is also evident in
answers CIPS respondents provided when given the opportunity to rank-order the 'top three' of
eight possible issues. Echoing their open-ended responses, 42% mentioned 'the economy
generally' as one of their most important three issues. An additional 11% cited 'government debt'
and 8% designated unemployment. The 11% figure bears note because some commentators have
asserted, post hoc, that government debt was a major preoccupation for many voters in 2010.
Clearly, a small minority of voters was very worried about the issue, but many more evidently
were not especially concerned—fully 66% did not rank government debt among their top three
issues.
Judgments about which party is best able to handle a particular issue is what gives that
issue its political clout. In this regard, the 2010 CIPS data reveal that none of the major political
parties had a decisive edge. Thinking in terms of a simple 'reward-punishment' model, one might
have anticipated that voters reacting to the global economic crisis might have abandoned the
governing Labour Party in droves in favour of its principal rival, the Conservatives, especially
given that Gordon Brown's competence ratings were far below what they had been when he
became Prime Minister. However, this was not the case. At the beginning of the 2010
campaign, only about one person in four (27%) believed that the Conservatives were best able to
handle the most important issue facing the country. An identical number selected Labour, and
9
slightly more (29%) said no party could handle the most important issue or that they 'didn't
know'. Telling also was that less than one person in 10 (9%) thought the Liberal Democrats
were best, with an equal number picking one of the minor parties. Clearly, none of the parties
were strongly positioned on most important issues when the campaign began.
The picture remained much the same at the end of campaign. Neither the Conservatives
nor Labour made any net headway in developing an image of competence on important issues.
Only 26% selected the former party, and 25% selected the latter one. The Liberal Democrats also
failed to make a case. Despite their dramatic surge in the polls after the first leader debate and
the strong popularity of their leader, the Liberal Democrats remained in a very weak position on
issues that mattered to most people. As voters prepared to go to the polls, only 12% selected the
Liberal Democrats as the party best on the issue designated as most important. In 2010 no party
was able to establish widespread issue credibility.
Partisanship
The third key variable in the valence politics model is party identification, conceptualized
as a potentially mutable cueing device that voters use to help them inform their electoral choices.
There is now convincing evidence that party identifications in Britain can manifest substantial
individual- and aggregate-level dynamics (e.g., Clarke et al., 2004; Clarke and McCutcheon,
2009). Although sophisticated panel modeling techniques that take into account random
measurement error are required to make an airtight statistical case for individual-level dynamics
(Clarke and McCutcheon, 2009), simple 'turnover' table analyses of multi-wave panel data tell
the basic story. For example, five-wave BES panel data gathered between 2005 and 2009
indicate that 47% of the electorate maintained stable partisan attachments, with an additional
10% remaining stable nonidentifiers. Of the rest, 26% moved between identification and
10
nonidentification, and nearly one person in five (17%) switched their identifications between
parties one or more times (Sanders et al., 2011).
Although these data reveal considerable individual-level partisan mobility after 2005, the
aggregate picture is quite different. Partisan shares were remarkably similar at the beginning of
the 2005 and 2010 campaigns. In 2005, 33% identified with Labour, 24% with the
Conservatives and 11% with the Liberal Democrats. Five years later, the comparable numbers
were 31%, 25% and 11%, respectively. Again, in both years, 9% identified with one of the
minor parties and 23% were nonidentifiers. The Conservative figures are particularly
noteworthy. Despite having led in the polls—sometimes by very large margins— throughout
most of the post-2005 period, the Conservatives had not been able to achieve a partisan
breakthrough. Their share of identifiers when the 2010 campaign began was almost exactly what
it had been five years earlier.
In sum, the data presented above reveal that none of the parties were especially well-
positioned for victory in 2010. The data for the Conservatives are especially interesting. As just
observed, despite their impressive performance in many vote intention polls conducted over the
inter-election period, the Conservatives had essentially the same percentage of identifiers as had
been the case in 2005. Also, despite a deep recession and a continuing financial crisis, the party
had failed to convince nearly three-quarters of the electorate that it had the wherewithal to deal
with the failing economy or other major issues. And, despite being more warmly received than
his predecessor, Michael Howard, new Conservative leader, David Cameron, had failed to ignite
widespread enthusiasm similar to that which Tony Blair had enjoyed when he led New Labour to
power in 1997. Thus, the three fundamentals that animate the valence politics model—
11
partisanship, party preference on major issues and leader image—were not configured in ways
that would easily secure a Conservative majority in 2010.
Rival Models of Electoral Choice
The emphasis in the preceding discussion on the configuration of variables in the valence
politics model assumes that valence considerations played a crucial role in determining electoral
choice in 2010. Previous work indicates that the valence politics model dominated competing
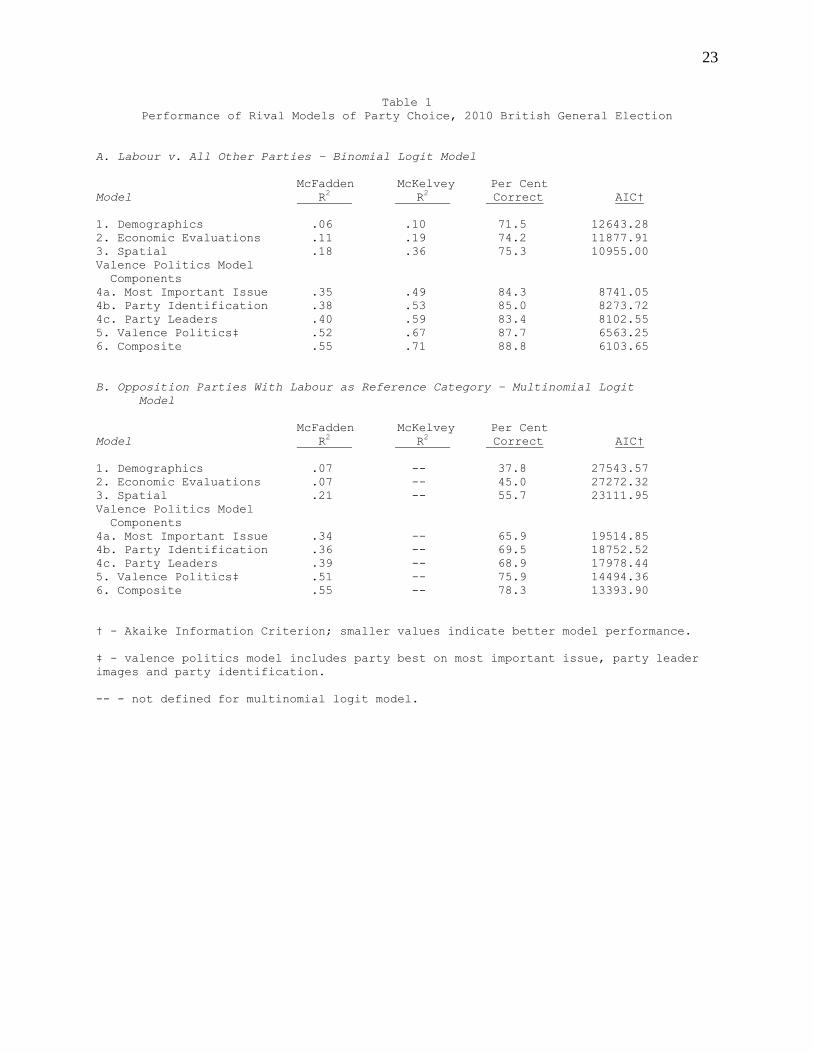
models in its ability to explain voting in the 2001 and 2005 elections. Table 1 documents that
this continued to be true in 2010. As in 2001 and 2005, the valence politics model, which
includes variables measuring partisanship, party preferences on issues designated ‘most
important’ by the voter, and party leader images, outperforms its rivals. Similar to 2001 and
2005, the ‘demographics’ model that includes social class and various other socio-demographic
characteristics fares very poorly, with very small pseudo R2 statistics and relatively weak ability
to correctly classify the choices voters made. A Downsian-style spatial model of party
competition which includes variables measuring perceived proximities between voters and
various parties on 11-point 'tax reduction-public services spending' and 'reduce crime-protect
human rights' dimensions does considerably better. However, the spatial model still lags behind
its valence rival when assessed by these criteria. The superior performance of the valence model
is also testified to by its better (smaller) AIC value (e.g., Burnham and Anderson, 2002).
(Table 1 about here)
It bears emphasis that our analysis of the explanatory power of rival models of electoral
choice does not prompt the conclusion that the valence politics model is all that matters. Rather,
as Table 1 shows, a composite model that includes all of the predictor variables from the several
rival models3 outperforms the valence politics model in terms of pseudo R2 values, per cent of
12
voters correctly classified, and AIC values. The improvements in these statistics over the pure
valence politics model are not large, but they consistently point in the same direction, namely
that there is explanatory ‘value added’ in the non-valence models. This finding for voting in
2010 is consistent with comparable analyses of voting in the 2001 and 2005 British elections
(Clarke et al., 2004: ch. 4; 2009: ch. 5). In all three cases, the valence politics model speaks
loudest but its rivals have something to say as well.
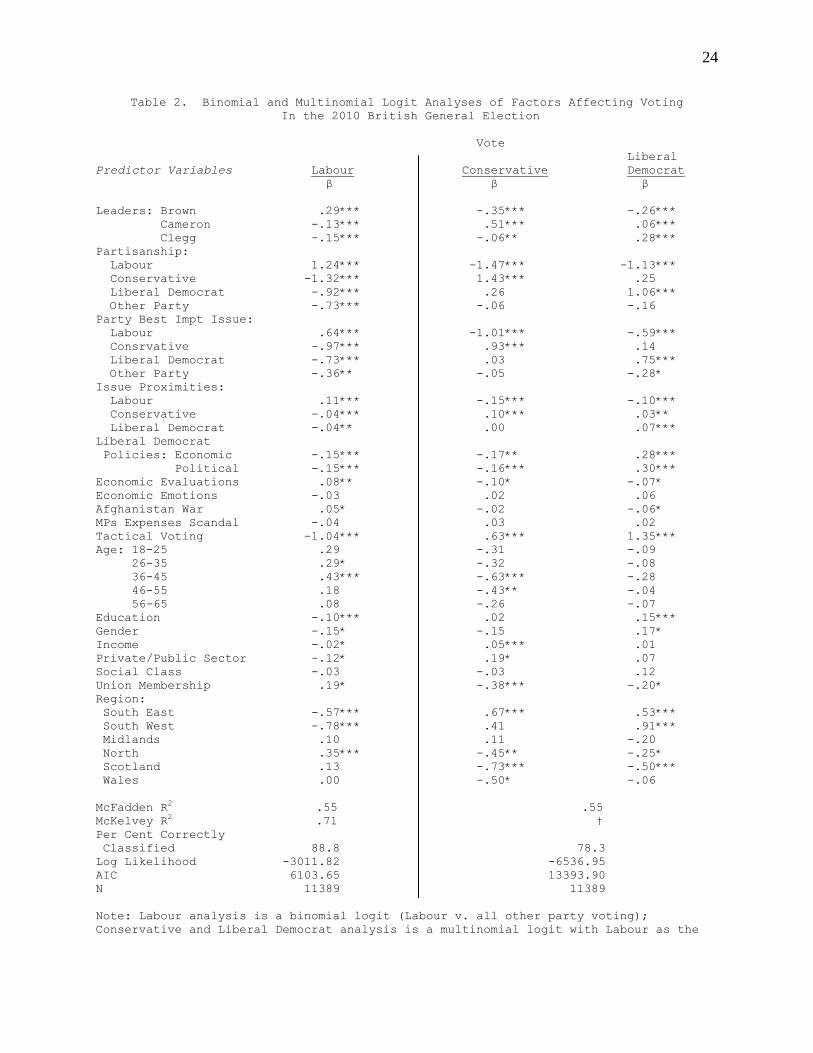
A detailed report of the performance of various predictor variables in the composite
voting models is presented in Table 2. This table summarizes two analyses. The first one, a
binomial logit analysis, is motivated by the idea that voting for a governing party versus any of
its opposition rivals is a fundamental electoral decision. Accordingly, the analysis pits Labour
voting versus voting for any of the opposition parties. The second analysis, a multinomial logit,
provides additional information about factors driving voters' choices by considering voting for
various opposition parties with Labour voting used as the reference category.4 The results of
these analyses are consistent with expectations, with a large majority of predictors in the valence
politics model being statistically significant and correctly signed.5 For example, positive feelings
about Gordon Brown increase the probability of a Labour vote, whereas positive feelings about
David Cameron and Nick Clegg decrease that probability. Similarly, selecting Labour as best on
the most important issue is positively associated with Labour voting, whereas selecting any of
the other parties as best on a most important issue is negatively associated with casting a Labour
ballot. Partisanship works the same way, with Labour identifiers being more likely to vote for
their party, and identifiers with other parties being less likely to do so. Yet another variable in
the valence politics framework, economic evaluations, demonstrates expected effects too.
13
Positive economic evaluations bolster support for Labour, the governing party, and diminish
support for the opposition Conservative and Liberal Democrat parties.
(Table 2 about here)
Key variables in other models also behave as anticipated. Perhaps particularly
noteworthy are spatial variables measuring proximities to various parties on tax-spend and
crime-rights scales. Eight of nine of these variables are statistically significant, and all but two
of the nine are correctly signed. Six additional variables measuring voters’ agreement-
disagreement with issue positions adopted by the Liberal Democrats in their party manifesto are
significant as well, and in every case, correctly signed. As expected, controlling for other
considerations, agreement with the issue position is positively associated with voting Liberal
Democrat and negatively associated with voting for Labour or Conservative.
Still other noteworthy findings pertain to variables measuring opinion on the Afghanistan
War, the MPs’ expenses scandal and tactical voting. Approval of the war has a predictable
positive effect on Labour voting and a predictable negative effect on Liberal Democrat voting.
However, despite the enormous publicity surrounding the scandal, it had no significant direct
effects on electoral choice. Finally, tactical voting is shown to have worked to the advantage of
both the Liberal Democrats and the Conservatives, and to the disadvantage of Labour. The
effects for the Liberal Democrats are similar to those at work in 2001 and 2005, and a similar
negative Labour effect also was evident in 2005. However, the positive Conservative effect is
something not present in either 2005 (when there was no significant effect) or 2001 (when there
was a significant negative effect) (see Clarke et al., 2004, ch. 4; Clarke et al., 2009, ch. 5).
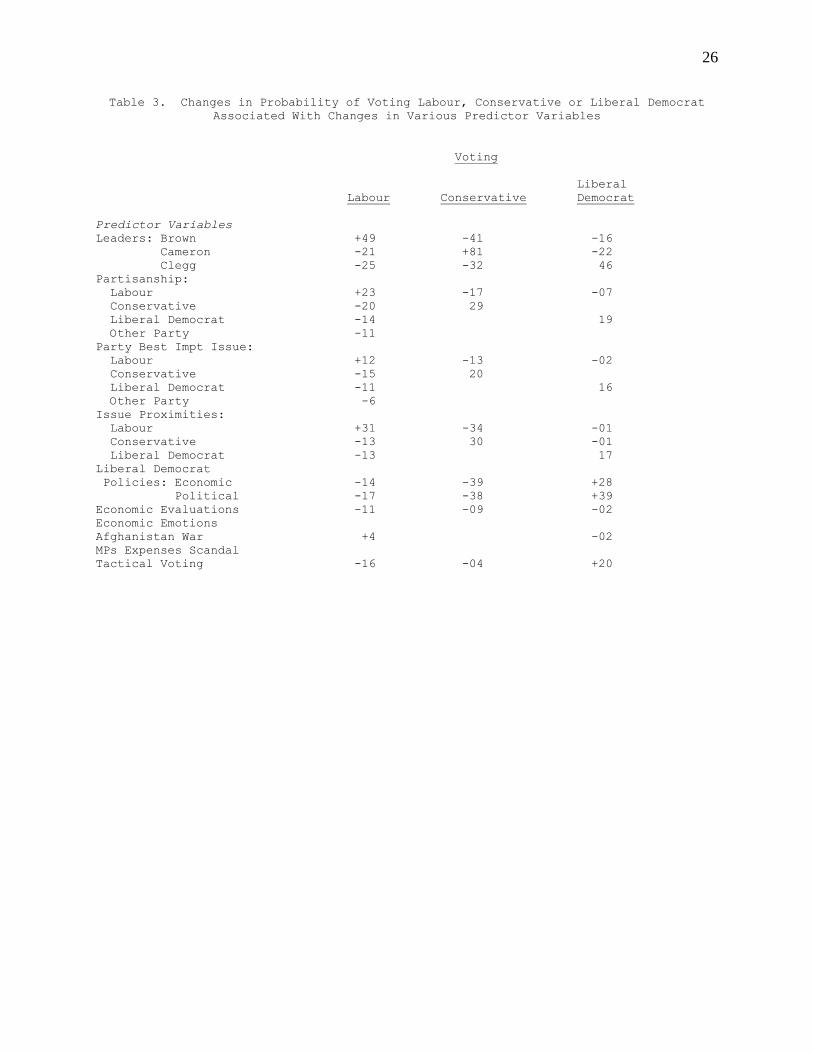
Since the results of logit analyses are difficult to interpret, we calculate how changes in
the values of statistically significant predictors affect the probability of voting for various
14
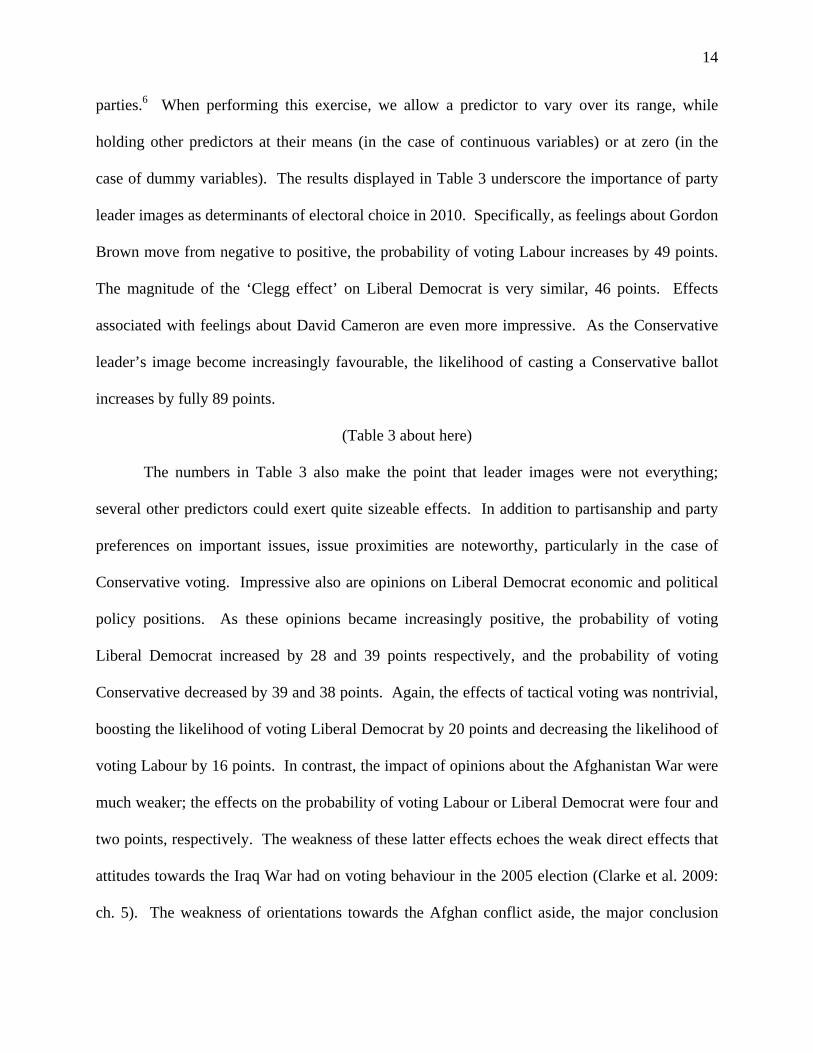
parties.6 When performing this exercise, we allow a predictor to vary over its range, while
holding other predictors at their means (in the case of continuous variables) or at zero (in the
case of dummy variables). The results displayed in Table 3 underscore the importance of party
leader images as determinants of electoral choice in 2010. Specifically, as feelings about Gordon
Brown move from negative to positive, the probability of voting Labour increases by 49 points.
The magnitude of the ‘Clegg effect’ on Liberal Democrat is very similar, 46 points. Effects
associated with feelings about David Cameron are even more impressive. As the Conservative
leader’s image become increasingly favourable, the likelihood of casting a Conservative ballot
increases by fully 89 points.
(Table 3 about here)
The numbers in Table 3 also make the point that leader images were not everything;
several other predictors could exert quite sizeable effects. In addition to partisanship and party
preferences on important issues, issue proximities are noteworthy, particularly in the case of
Conservative voting. Impressive also are opinions on Liberal Democrat economic and political
policy positions. As these opinions became increasingly positive, the probability of voting
Liberal Democrat increased by 28 and 39 points respectively, and the probability of voting
Conservative decreased by 39 and 38 points. Again, the effects of tactical voting was nontrivial,
boosting the likelihood of voting Liberal Democrat by 20 points and decreasing the likelihood of
voting Labour by 16 points. In contrast, the impact of opinions about the Afghanistan War were
much weaker; the effects on the probability of voting Labour or Liberal Democrat were four and
two points, respectively. The weakness of these latter effects echoes the weak direct effects that
attitudes towards the Iraq War had on voting behaviour in the 2005 election (Clarke et al. 2009:
ch. 5). The weakness of orientations towards the Afghan conflict aside, the major conclusion
15
suggested by the data in Table 3 is that several predictors from the valence politics model and its
spatial rival had considerable potential to affect voting decisions in 2010.
Conclusion: The Politics of Doom and Gloom
As is typically the case in British general elections, a wide variety of forces influenced
electoral choice in 2010. At the individual level, the story was a familiar one; valence politics
variables exerted very sizeable effects, with those associated with party leader images being
particularly large. Given the context in which the election was held, the strength of the valence
politics model does not surprise. The contest occurred in the wake of one of the biggest shocks
to the British economy since the Great Depression of the 1930s. A financial crisis, a deep
recession and rising unemployment captured the attention of a worried electorate and prompted
demands for government action. Quintessential valence politics considerations, these economic
concerns did much to define the issue agenda in the run-up to the 2010 election. Knowing
‘what’ they were concerned about, voters focused heavily on the ‘who’ of electoral choice.
Given Labour’s lengthy tenure in office, widespread unhappiness with Prime Minister
Gordon Brown, and the prevailing economic distress, voters clearly were open to—indeed,
searching for—alternatives in 2010. In this regard, the limitations of the Conservatives were
abundantly evident. The Tories had not strengthened their cohort of party identifiers since 2005
and their leader, David Cameron, appeared popular only relative to the exceedingly chilly
reception voters had accorded his three most recent predecessors, William Hague, Iain Duncan
Smith and Michael Howard. But, perhaps most noteworthy was the party's failure to make the
case that it could competently address the country’s economic woes. As discussed above, only
about one person in four thought the Conservatives would do the best job in addressing what that
person designated as the most important issue. In retrospect, this was a political context ideally
16
suited for a major campaign move by a 'third' party led by a popular leader. The first ever
nationally televised leader debate gave Liberal Democrat leader, Nick Clegg, the chance to make
his case. He forcefully seized the opportunity and the electorate responded. But, the ensuing
outburst of ‘Clegg mania’ was not enough. Given the weakness of the Liberal Democrats’
partisan base and their continuing inability to convince voters that they were best suited to
handle the economic crisis, the Liberal Democrat ‘surge’ ultimately receded.
In the end, the Conservatives came close to capturing a majority of seats at Westminster.
But, they failed. We contend that although there is no single explanation for the failure, the
party’s almost single-minded emphasis on what they deemed to be excessive public sector
expenditures and the need for debt reduction probably was an important factor. Starting several
months before the 2010 campaign officially began, David Cameron and Shadow Chancellor,
George Osborne, repeatedly called for massive cuts in public sector spending, coupled with
selective, but possibly significant, tax increases. Even if this bitter fiscal medicine was the
correct prescription for what is ailing the British economy, it was precisely that—bitter medicine.
And, it was touted as a cure for a disease that, rightly or wrongly, was not that widely
recognized; as discussed above, the 2010 BES surveys document that at the time of the election a
large majority of voters did not accord high priority to reducing the government debt per se.
More generally, the British electorate had grown accustomed to New Labour’s optimistic
electoral messages, and a rival party advocating extremely harsh measures to voters already
suffering the pain of a sharp economic down-turn was unlikely to receive a ringing endorsement.
In contrast, if the Conservatives had taken a page from Ronald Reagan’s storied political
playbook for how right-of-centre parties can win elections and provided a dose of ‘hope, growth
and opportunity’ to sweeten their policy prescriptions, the result on May 6th might have been

17
different. In a world of valence politics, a campaign promise of 'doom and gloom' is always a
hard sell.
18
Figure 1. Party Support, May 19th 2005 - May 5th 2010
12
16
20
24
28
32
36
40
44
48
May2005
May2010Date
Per c
ent
Conservative
Labour
Liberal Democrat
Conservative
Labour
LiberalDemocrat
36
2827
1st Leader<--Debate
Brown BecomesLabour Leader-->
Note: data smoothed with the Hodrick-Prescott filter.
Source: 607 public opinion polls measuring vote intentions between May 19, 2005 and May 5, 2010. Polling houses include: Angus Reid, BPIX, Communicate/Ind, Comres, Harris, ICM, Ipsos/Mori, Market Sciences, Populus, TNS, YouGov. Note: the 'box and whisker' plots on the vertical axis provide information on the mean (dot), median (horizontal line in box), and variation in support for the Conservative, Labour and Liberal Democrat parties. Similar box and whisker plots appear in Figures 2, 3 and 5 below.
19
Figure 2. Prime Minister Gordon Brown's Image, July 2007 - March 2010
3.0
3.5
4.0
4.5
5.0
5.5
6.0
2007M07 2008M01 2008M07 2009M01 2009M07 2010M01
Mea
n Sc
ore
(0-1
0 Sc
ale)
Date
Competence
Like-Dislike
Lehman Bros. Bank Failure-->
Compe tence
Like-Dislike
3.7
4.1
4.8
5.8
Source: July 2007 – March 2010 CMS surveys
20
Figure 3. Party Leader Images Over the 2010 Election Campaign
3.0
3.5
4.0
4.5
5.0
5.5
6.0
6.5
5 10 15 20 25
Mea
n Li
ke-D
islik
e Sc
ore
(0-1
0 Sc
ale)
Campaign Day
Clegg
Cameron
Brown
3.7
4.4
5.6
1st Leaders Debate-->
2nd Leaders Debate-->
3rd Leaders<--Debate
Brown
Cameron
Clegg
DK
Note: two-day moving averages
3.9
4.4
5.1Brown's Bigoted Woman Remark-->
Source: 2010 BES CIPS campaign wave
21
Figure 4. Evaluations of Party Leader Performance in the 2010 Debates
A. Best Performance
9
26 2513
4151
78
3324
0102030405060708090
100
First Debate Second Debate Third Debate
Per
cen
t
Brown Cameron Clegg
B. Worst Performance
55 54 57
4236 36
310
17
0102030405060708090
100
First Debate Second Debate Third Debate
Per c
ent
Brown Cameron Clegg
Source: campaign wave of 2010 BES CIPS
22
Figure 5. Best Prime Minister Judgments Over the 2010 Election Campaign
5
10
15
20
25
30
35
40
5 10 15 20 25
Per
Cen
t Cho
osin
g Le
ader
as
Bes
t PM
Campaign Day
Clegg
Cameron
Brown
Cameron
Brown
Clegg
1st leaders' debate-->
2nd leaders' debate-->
3rd leaders'<--debate
Brown'sbigotedwomanremark-->
33
37
9
25
33
22
Note: two-day moving averages.
Source: monthly CMS surveys, July 2007 - March 2010
23
Table 1 Performance of Rival Models of Party Choice, 2010 British General Election
A. Labour v. All Other Parties - Binomial Logit Model McFadden McKelvey Per Cent Model R2 R2 Correct AIC† 1. Demographics .06 .10 71.5 12643.28 2. Economic Evaluations .11 .19 74.2 11877.91 3. Spatial .18 .36 75.3 10955.00 Valence Politics Model Components 4a. Most Important Issue .35 .49 84.3 8741.05 4b. Party Identification .38 .53 85.0 8273.72 4c. Party Leaders .40 .59 83.4 8102.55 5. Valence Politics‡ .52 .67 87.7 6563.25 6. Composite .55 .71 88.8 6103.65 B. Opposition Parties With Labour as Reference Category - Multinomial Logit Model McFadden McKelvey Per Cent Model R2 R2 Correct AIC† 1. Demographics .07 -- 37.8 27543.57 2. Economic Evaluations .07 -- 45.0 27272.32 3. Spatial .21 -- 55.7 23111.95 Valence Politics Model Components 4a. Most Important Issue .34 -- 65.9 19514.85 4b. Party Identification .36 -- 69.5 18752.52 4c. Party Leaders .39 -- 68.9 17978.44 5. Valence Politics‡ .51 -- 75.9 14494.36 6. Composite .55 -- 78.3 13393.90 † - Akaike Information Criterion; smaller values indicate better model performance. ‡ - valence politics model includes party best on most important issue, party leader images and party identification. -- - not defined for multinomial logit model.
24
Table 2. Binomial and Multinomial Logit Analyses of Factors Affecting Voting In the 2010 British General Election
Vote Liberal Predictor Variables Labour Conservative Democrat β β β Leaders: Brown .29*** -.35*** -.26*** Cameron -.13*** .51*** .06*** Clegg -.15*** -.06** .28*** Partisanship: Labour 1.24*** -1.47*** -1.13*** Conservative -1.32*** 1.43*** .25 Liberal Democrat -.92*** .26 1.06*** Other Party -.73*** -.06 -.16 Party Best Impt Issue: Labour .64*** -1.01*** -.59*** Consrvative -.97*** .93*** .14 Liberal Democrat -.73*** .03 .75*** Other Party -.36** -.05 -.28* Issue Proximities: Labour .11*** -.15*** -.10*** Conservative -.04*** .10*** .03** Liberal Democrat -.04** .00 .07*** Liberal Democrat Policies: Economic -.15*** -.17** .28*** Political -.15*** -.16*** .30*** Economic Evaluations .08** -.10* -.07* Economic Emotions -.03 .02 .06 Afghanistan War .05* -.02 -.06* MPs Expenses Scandal -.04 .03 .02 Tactical Voting -1.04*** .63*** 1.35*** Age: 18-25 .29 -.31 -.09 26-35 .29* -.32 -.08 36-45 .43*** -.63*** -.28 46-55 .18 -.43** -.04 56-65 .08 -.26 -.07 Education -.10*** .02 .15*** Gender -.15* -.15 .17* Income -.02* .05*** .01 Private/Public Sector -.12* .19* .07 Social Class -.03 -.03 .12 Union Membership .19* -.38*** -.20* Region: South East -.57*** .67*** .53*** South West -.78*** .41 .91*** Midlands .10 .11 -.20 North .35*** -.45** -.25* Scotland .13 -.73*** -.50*** Wales .00 -.50* -.06 McFadden R2 .55 .55 McKelvey R2 .71 † Per Cent Correctly Classified 88.8 78.3 Log Likelihood -3011.82 -6536.95 AIC 6103.65 13393.90 N 11389 11389 Note: Labour analysis is a binomial logit (Labour v. all other party voting); Conservative and Liberal Democrat analysis is a multinomial logit with Labour as the

25
reference category. Other party voting is included in the multinomial logit analysis but coefficients not displayed in table. *** - p < .001; ** - p < .01; * - p < .05, one-tailed tests for all variables except age, gender and region. † - Not defined for multinomial logit model.
26
Table 3. Changes in Probability of Voting Labour, Conservative or Liberal Democrat Associated With Changes in Various Predictor Variables
Voting Liberal Labour Conservative Democrat Predictor Variables Leaders: Brown +49 -41 -16 Cameron -21 +81 -22 Clegg -25 -32 46 Partisanship: Labour +23 -17 -07 Conservative -20 29 Liberal Democrat -14 19 Other Party -11 Party Best Impt Issue: Labour +12 -13 -02 Conservative -15 20 Liberal Democrat -11 16 Other Party -6 Issue Proximities: Labour +31 -34 -01 Conservative -13 30 -01 Liberal Democrat -13 17 Liberal Democrat Policies: Economic -14 -39 +28 Political -17 -38 +39 Economic Evaluations -11 -09 -02 Economic Emotions Afghanistan War +4 -02 MPs Expenses Scandal Tactical Voting -16 -04 +20
27
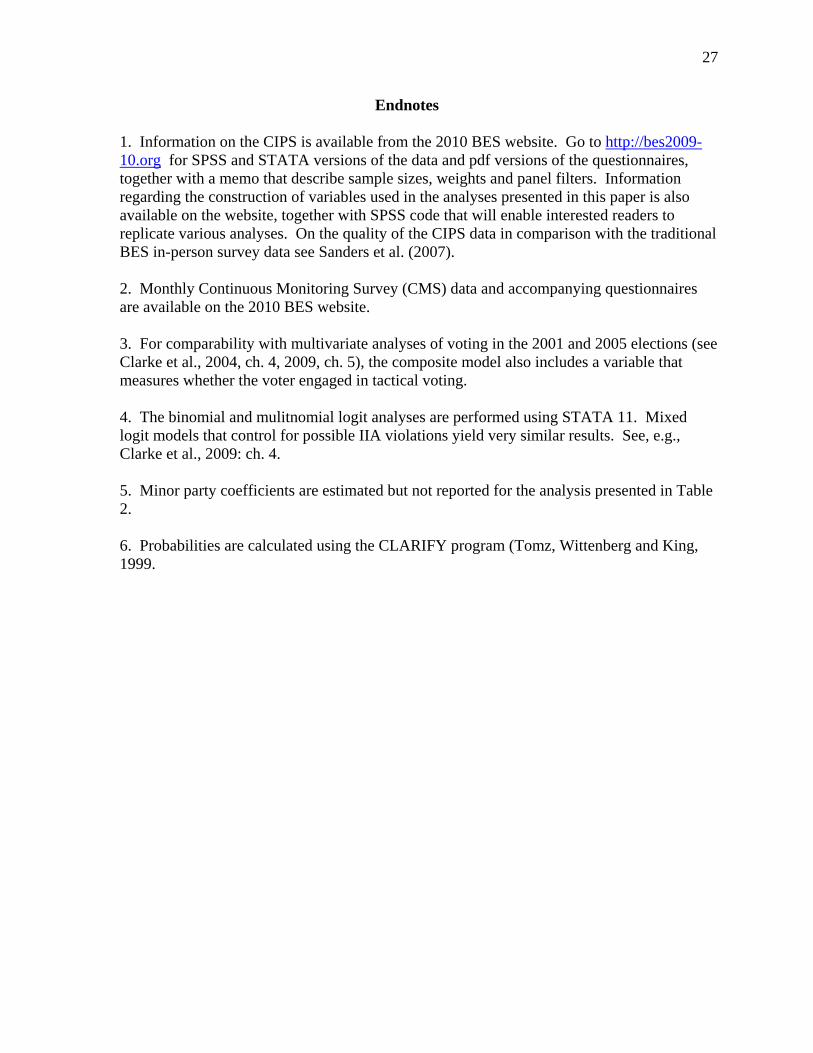
Endnotes
1. Information on the CIPS is available from the 2010 BES website. Go to http://bes2009-10.org for SPSS and STATA versions of the data and pdf versions of the questionnaires, together with a memo that describe sample sizes, weights and panel filters. Information regarding the construction of variables used in the analyses presented in this paper is also available on the website, together with SPSS code that will enable interested readers to replicate various analyses. On the quality of the CIPS data in comparison with the traditional BES in-person survey data see Sanders et al. (2007). 2. Monthly Continuous Monitoring Survey (CMS) data and accompanying questionnaires are available on the 2010 BES website. 3. For comparability with multivariate analyses of voting in the 2001 and 2005 elections (see Clarke et al., 2004, ch. 4, 2009, ch. 5), the composite model also includes a variable that measures whether the voter engaged in tactical voting. 4. The binomial and mulitnomial logit analyses are performed using STATA 11. Mixed logit models that control for possible IIA violations yield very similar results. See, e.g., Clarke et al., 2009: ch. 4. 5. Minor party coefficients are estimated but not reported for the analysis presented in Table 2. 6. Probabilities are calculated using the CLARIFY program (Tomz, Wittenberg and King, 1999.
28
References
Adams, James F., Merrill III, Samuel and Grofman, Bernard. 2005. A Unified Theory of Party Competition. Cambridge: Cambridge University Press. Burnham, Kenneth and Anderson, David. 2002. Model Selection and Multimodel Inference. 2nd edition. New York: Springer. Butler, David and Stokes, Donald. 1969. Political Change in Britain: Forces Shaping Electoral Choice. New York, N.Y.: St. Martin's Press. Clarke, Harold D. and McCutcheon, Allan. 2009. 'The Dynamics of Party Identification Reconsidered'. Public Opinion Quarterly 73:704-28. Clarke, Harold D., Sanders, David, Stewart, Marianne C. and Whiteley, Paul. 2004. Political Choice in Britain. Oxford: Oxford University Press. Clarke, Harold D., Sanders, David, Stewart, Marianne C. and Whiteley, Paul. 2009. Performance Politics and the British Voter. Cambridge: Cambridge University Press. Clarke, Harold D., Kornberg, Allan and Scotto, Thomas J. 2009. Making Political Choices: Canada and the United States. Toronto: University of Toronto Press. Downs, Anthony. 1957. An Economic Theory of Democracy. New York: Harper & Row. Fiorina, Morris. 1981. Retrospective Voting in American National Elections. New Haven: Yale University Press. Gigerenzer, Gerd. 2008. Rationality for Mortals: How People Cope with Uncertainty. Oxford: Oxford University Press. Merrill III, Samuel and Bernard Grofman. 1999. A Unified Theory of Voting: Directional and Proximity Spatial Models. Cambridge: Cambridge University Press. Sanders, David, Clarke, Harold D., Stewart, Marianne C. and Whiteley, Paul. 2007. 'Does Mode Matter for Modeling Political Choice?' Political Analysis 15: 257-85. Sanders, David, Clarke, Harold D., Stewart, Marianne C. and Whiteley, Paul. 2011. 'Downs, Stokes and the Dynamics of Electoral Choice. British Journal of Political Science, 41: forthcoming. Scotto, Thomas, Clarke, Harold D., Reifler, Jason, Sanders, David, Stewart, Marianne C. and Whiteley, Paul. 2011. 'The Dynamic Political Economy of Support for Barack Obama During the 2008 Presidential Election Campaign'. Electoral Studies, 30: forthcoming.
29
Stokes, Donald. 1963. 'Spatial Models of Party Competition'. American Political Science Review 57: 368-77. Stokes, Donald. 1992. 'Valence Politics'. In Dennis Kavanagh, ed. Electoral Politics. Oxford: Clarendon University Press. Tomz, Michael, Wittenberg, Jason and King, Gary. 1992. CLARIFY: Software for Interpreting and Presenting Statistical Results. Cambridge, MA: Harvard University, Department of Government.
Recommended