VALIDITY OF A FUNCTIONAL OBSTACLE COURSE AS A TOOL TO SCREEN
FOR FALL RISKS IN OLDER ADULTS
by
Daniel Gragert
A thesis
submitted in partial fulfillment
of the requirements for the degree of
Master of Science in Exercise and Sport Studies, Biophysical Studies
Boise State University
August 2011

© 2011
Daniel Gragert
ALL RIGHTS RESERVED
BOISE STATE UNIVERSITY GRADUATE COLLEGE
DEFENSE COMMITTEE AND FINAL READING APPROVALS
of the thesis submitted by
Daniel Gragert
Thesis Title: Validity of a Functional Obstacle Course as a Tool to Screen for Fall-
Risks in Older Adults Date of Final Oral Examination: 06 June 2011
The following individuals read and discussed the thesis submitted by student Daniel Gragert, and they evaluated his presentation and response to questions during the final oral examination. They found that the student passed the final oral examination.
Terry-Ann Gibson, Ph.D. Chair, Supervisory Committee Yong Gao, Ph.D. Member, Supervisory Committee Lynda Ransdell, Ph.D. Member, Supervisory Committee The final reading approval of the thesis was granted by Terry-Ann Gibson, Ph.D., Chair of the Supervisory Committee. The thesis was approved for the Graduate College by John R. Pelton, Ph.D., Dean of the Graduate College.
iv
ABSTRACT
INTRODUCTION: There is currently no specific instrument or test to diagnose
fall risks in older adults. A functional obstacle designed and based on current research
and the components of falls has the potential to be an effective method of diagnosing fall
risks in older adults. PURPOSE: The purpose of this study was to determine the
construct validity and reliability of the Modified Functional Obstacle Course (MFOC)
and to examine the instrument’s intra-obstacle measurement parameters. METHODS:
Participants (N = 63) performed a single series of three common fall risk assessments:
Activity Specific Balance Confidence Scale; Dynamic Gait Index and the Tinetti Balance
Test (ABC, DGI, & TBT); and, the new Modified Functional Obstacle Course (MFOC).
The order of tests, per series, was randomized between participants. Participants (N = 30)
from the original sample returned for a single day of testing on the MFOC. DATA
ANALYSIS: Construct validity and reliability was determined by measuring correlation
(r) to the (ABC, DGI & TBT). Intra-obstacle analysis was performed by using principal
component analysis. CONCLUSION: The Modified Functional Obstacle Course
demonstrated a moderate to high construct validity, r(63) = .75 - .76, p < .05, in
correlation to the convergent measures and it demonstrated high test re-test reliability,
r(30) = .99, p < .05 and internal consistency. Principal component analysis demonstrated
five distinct components within the MFOC, which accounted for 78% of the variability in
scores.
v
TABLE OF CONTENTS
ABSTRACT............................................................................................................................. iv
LIST OF TABLES................................................................................................................... ix
LIST OF FIGURES .................................................................................................................. x
CHAPTER I: INTRODUCTION.............................................................................................. 1
Background of the Problem .......................................................................................... 1
Purpose of the Study ..................................................................................................... 4
Need for the Study ........................................................................................................ 4
Hypotheses.................................................................................................................... 6
Limitations .................................................................................................................... 6
Delimitations................................................................................................................. 6
Operational Definitions................................................................................................. 7
Significance of the Study.............................................................................................. 7
Summary....................................................................................................................... 8
CHAPTER II: LITERATURE REVIEW ................................................................................. 9
Societal Impact of Falls ................................................................................................ 9
The Effects of Ageing on Physical Function .............................................................. 10
Balance, Mobility, and Mechanisms Related to Falls................................................. 11
Intrinsic Components ...................................................................................... 11
Extrinsic Components..................................................................................... 15
vi
Interrelationship of Mechanisms (Environmental) ..................................................... 16
Fall-Risk Assessments ................................................................................................ 18
Single-Factorial Assessments ......................................................................... 19
Multi-Factorial Assessments........................................................................... 20
History of Obstacle Courses in Research Literature................................................... 25
Background on Validity Studies ................................................................................. 27
Rationale for Creating an Obstacle Course................................................................. 28
Summary..................................................................................................................... 29
CHAPTER III: METHODS.................................................................................................... 30
Participants.................................................................................................................. 30
Instrumentation ........................................................................................................... 31
Modified Functional Obstacle Course (MFOC) ............................................. 31
Activities Specific Balance Scale (ABC) ....................................................... 36
Tinetti Balance Test (TBT)............................................................................. 36
Dynamic Gait Index (DGI) ............................................................................. 38
Procedures................................................................................................................... 39
Session One (First Day of Testing)................................................................. 41
Session Two.................................................................................................... 41
Data Analysis .............................................................................................................. 42
Summary..................................................................................................................... 42
CHAPTER IV: RESULTS AND CONCLUSION ................................................................. 43
Descriptive Characteristics ......................................................................................... 43
Participants...................................................................................................... 43
vii
Tests (ABC, DGI & TBT) .............................................................................. 44
MFOC ............................................................................................................. 45
Hypotheses Testing..................................................................................................... 46
Construct Validity of the Modified Functional Obstacle Course ................... 46
Reliability.................................................................................................................... 52
Summary..................................................................................................................... 52
CHAPTER V: DISCUSSION................................................................................................. 54
Major Findings............................................................................................................ 54
Unique Contributions of the Study ............................................................................. 64
Limitations .................................................................................................................. 66
Suggestions for Future Research ................................................................................ 67
Conclusion .................................................................................................................. 68
REFERENCES ....................................................................................................................... 69
APPENDIX A......................................................................................................................... 74
Modified Functional Obstacle Course Scoring......................................................... 754
APPENDIX B ......................................................................................................................... 81
Activities-Specific Balance Confidence Scale (ABC)................................................ 81
APPENDIX C ......................................................................................................................... 84
Tinetti Balance Test .................................................................................................... 84
APPENDIX D......................................................................................................................... 87
Dynamic Gait Index Scoring ...................................................................................... 87
APPENDIX E ......................................................................................................................... 93
Recruitment Flyer ....................................................................................................... 93
viii
APPENDIX F.......................................................................................................................... 95
Telephone Script ......................................................................................................... 95
ix
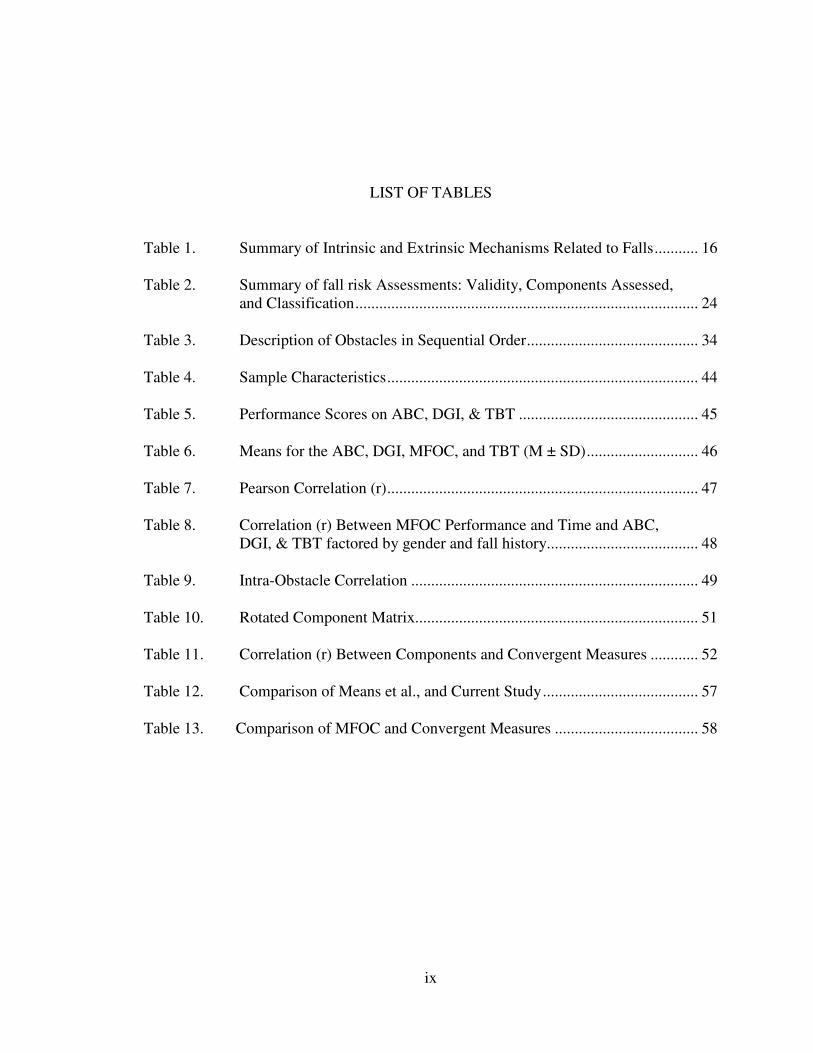
LIST OF TABLES
Table 1. Summary of Intrinsic and Extrinsic Mechanisms Related to Falls........... 16
Table 2. Summary of fall risk Assessments: Validity, Components Assessed, and Classification...................................................................................... 24
Table 3. Description of Obstacles in Sequential Order........................................... 34
Table 4. Sample Characteristics.............................................................................. 44
Table 5. Performance Scores on ABC, DGI, & TBT ............................................. 45
Table 6. Means for the ABC, DGI, MFOC, and TBT (M ± SD)............................ 46
Table 7. Pearson Correlation (r).............................................................................. 47
Table 8. Correlation (r) Between MFOC Performance and Time and ABC, DGI, & TBT factored by gender and fall history...................................... 48
Table 9. Intra-Obstacle Correlation ........................................................................ 49
Table 10. Rotated Component Matrix....................................................................... 51
Table 11. Correlation (r) Between Components and Convergent Measures ............ 52
Table 12. Comparison of Means et al., and Current Study....................................... 57
Table 13. Comparison of MFOC and Convergent Measures .................................... 58
x
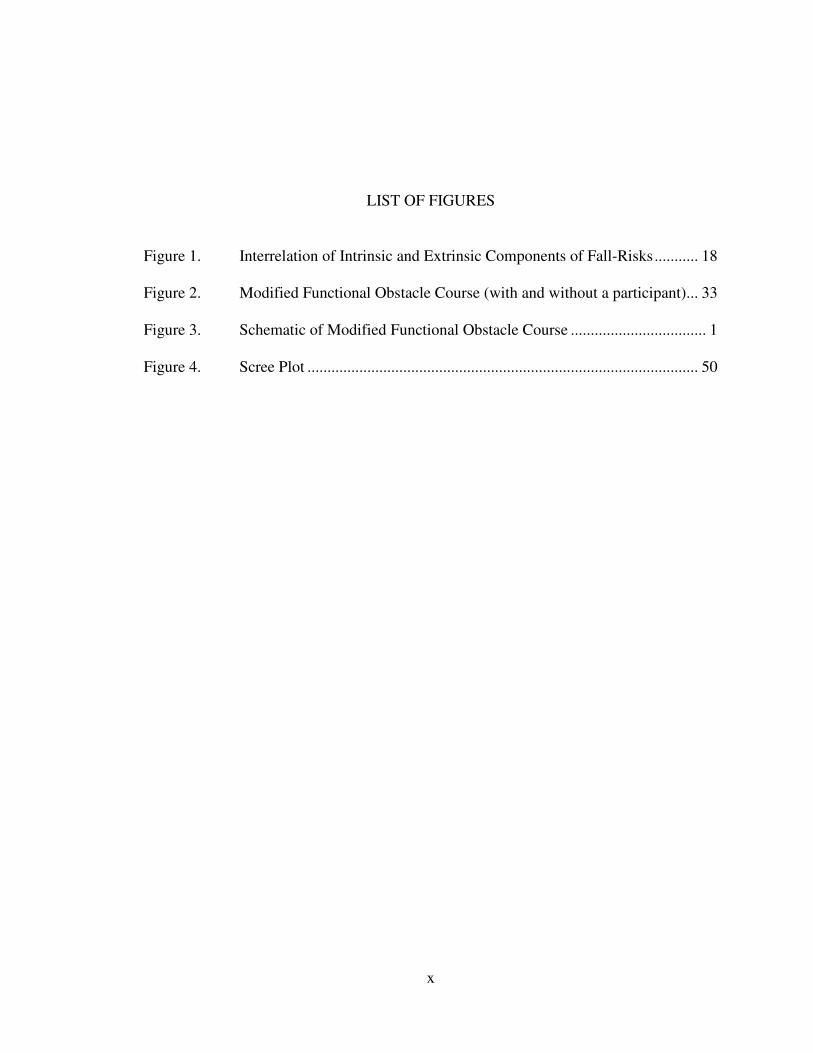
LIST OF FIGURES
Figure 1. Interrelation of Intrinsic and Extrinsic Components of Fall-Risks........... 18
Figure 2. Modified Functional Obstacle Course (with and without a participant)... 33
Figure 3. Schematic of Modified Functional Obstacle Course .................................. 1
Figure 4. Scree Plot .................................................................................................. 50
1
CHAPTER I: INTRODUCTION
Background of the Problem
The post World War II surge of childbirths has created the largest generation of
Americans to date. This group, of approximately 76 million people, will become 65 years
or older in the year 2015 (Brault, 2007). Unfortunately, the latest report by the Center for
Disease Control and Prevention (2008) indicates that one in three adults who are
currently 65 years of age or older have suffered from a fall and the trend is expected to
continue. This problem makes falls a central cause of fatality and serious injuries in older
adults (Lewell, Vaillancourt, & Sosnoff, 2006). The high rate of falls, coupled with the
pending increase in the number of older adults in America, makes diagnosing and treating
fall risks a high priority, for both researchers and clinicians. Furthermore, health care
costs remain high for the treatment of fall-related injuries (Brault, 2008). This creates a
need for individuals who are at risk of falling to receive pre-emptive treatment, in order
to avoid the otherwise costly expense of trauma care.
It is common knowledge that aging is associated with a decrease in physical
function and performance, including a lack of balance and mobility, which increases the
likelihood of an accidental fall (Lexell, Taylor, & Sjostrom, 1998). In addition, aging
commonly decreases sensory capabilities, neurological responses, muscular strength and
power, and cognitive function; all of which contribute to a higher probability of
accidental falls (Huan, 2010). While the severity and actual types of all forms of
2
degeneration vary from individual to individual, physical degeneration is often
accompanied by cognitive degeneration, which has a substantial effect on the risk of falls
(Pfisterer, et al., 2003).
One of the most prevalent and immediate determinants of falling is muscular
degeneration (i.e., Senile Sarcopenia). Less common impairments that affect the rate of
falls are neuromuscular (proprioceptive) atrophy, cognitive degeneration, ocular, and/or
macular degeneration (Lewell, et al., 2006; Sosnoff & Voudrie, 2009). All of these
components play a substantial role in maintaining balance and proper gait. For example,
muscular strength helps prevent fatigue, which can cause falls. Muscular strength also
helps a person maintain proper gait and navigate through environmental hazards. Sensory
awareness is central to making observations about the surroundings, so an individual can
adjust his, or her, gait or path to avoid falling (Lewell, et al, 2006; Sosnoff & Voudrie,
2009). In addition to the physical causes of falls, the risk of falling is confounded by
psycho-social causes (Arnadottir, Lundin-Olson, Gunnardottir & Fisher, 2010). For
example, current research has shown a correlation between low balance self-efficacy and
increases in falls (Simpson, Worsfold, Fisher & Valentine, 2009).
While the degeneration of many physical and psycho-social components often
correlates to age, they always can be reversed or slowed, through appropriately designed
interventions (Shumway-Cook & Woolacott, 2001; Spirduso, Franci, & MacRae, 1995).
Despite these advances in preventive treatment for falls, there is still, however, a lack of
proper diagnostic instruments and/or methods to determine who is in the most need of
these interventions (Oliver, et al., 2004).
3
The interlinking and often varied causes of falls in the elderly make diagnosing
fall risks complicated. The complexity is exacerbated by the numerous and varied types
of assessment tools to diagnose fall risks. These assessments often test specific individual
causes of a fall, as opposed to taking a more holistic approach (Brault, 2008). Each test,
or assessment, looks at one aspect, from physical to psycho-social causes of falls. The
Tinetti Balance Test (TBT) takes the most comprehensive approach and is the most
widely used (Stevens, 2008). The TBT is a series of small functional tests that assess a
participant on both balance and gait; however, it does not assess other contributing
components (Tinetti, 1986). Other popular tests measure postural sway, using
postugraphical analysis equipment and functional mobility tests that measure muscular
strength and performance. There are also various forms of psychological or social tests,
such as the Activities Specific Balance Confidence Scale, that measures self-efficacy and
self-confidence (Simpson, et al., 2009).
Because many of the common assessments currently used to diagnose fall risks
examine a single factor, they exclude other potential risk-factors. This paradigm implies
that fall risks are similar to conventional ailments that can be detected by a single
anomaly, such as lack of strength or cognitive function. However, the causes of falls are
multi-factorial and a single risk factor may not constitute a high risk of falling (Oliver, et
al.,, 2004). The complexity of the interrelation of all fall risks makes any assessment that
examines a single risk factor incomplete. In an attempt to remedy this problem, Means,
Rodell and O’Sullivan (1996; 1998) created a functional obstacle course to test the sum
impact of all determinants of fall risks. They theorized that an obstacle course designed to
replicate everyday environmental hazards would measure a participant’s ability to
4
navigate through these obstacles and, thus, measure the sum impact of all possible
weaknesses in the necessary components of balance. The functional obstacle course was
modified from its original form and has not been validated (Means & O’Sullivan, 2000;
Means, 2005).
Purpose of the Study
Given the problem caused by the single dimensional perspective of current fall
risk screening instruments, there is a need for a tool that provides a more comprehensive
assessment of a person’s risk of falling. A diagnostic tool was created in 1996 by Means,
Rodell, and O’Sullivan to tackle this issue. However, after the researchers performed the
initial validity studies, they later modified the course design to promote the mobility and
safety of the course. The specific tasks, within the course, were not changed, only the
arrangement and dimensions were modified (Means & O’Sullivan, 2000; Means, 2005).
The modifications, although minimal, have not been validated. For the purpose of this
study, the course was further modified to include a new task and to remove a duplicate
task. The purpose of this study was to (a) examine the construct validity of the MFOC, by
measuring the correlation of the MFOC to current assessments, (b) examine the
reliability, and (c) further determine construct validity and intra-obstacle discrimination
via principal component analysis.
Need for the Study
As previously stated, falls are a multi-faceted phenomenon that involve numerous
physiological components and socio-psychological parameters that have resulted in
several, separate tests to diagnose the same problem (Oliver, et al.,, 2004). Until there is a
5
single, unified understanding of fall risks for older adults, research, and diagnostics will
be slow and will yield highly varied results. The benefits of creating a single, unified
measurement that encompasses all causes, both physiological and psycho-social, include:
enabling the academic and professional community to better screen for fall risks and
compare normative results through varied populations. The original functional obstacle
course has previously been shown to correlate to the Tinetti Balance Test (TBT) (Means,
et al., 1996). If a modification of this original course correlates to three assessments that
evaluate the function of various fall related components, it will demonstrate that there is a
common denominator between these components that can be assessed by a single
diagnostic test.
In order to properly diagnose fall risks, an obstacle course must be sufficient in
length, to allow enough time for the observer to note any complications that the
participant may face. The obstacle course must also incorporate truly functional tasks,
such as walking up stairs, or on an uneven surface (Ka-chun, et al.,, 2008). It must
incorporate a quantitative element that correlates to environmental difficulties, such as
how many times a participant needs extra support (e.g, the use of a railing, etc.) (Means,
2005). A functional obstacle course, such as the one created by Means, et al.,(1998)
replicates every-day environmental obstacles; thus, it inherently taxes the physiological
and psycho-social components that play substantial roles in maintaining healthy balance
and mobility.
As previously mentioned, a diagnostic tool that takes a multi-factorial and holistic
environmental approach to examining fall risks will be better suited to make accurate
assessments, thus allowing individuals to receive pre-emptive treatment.
6
Hypotheses
The functional obstacle course will show a high and positive correlation to the (a)
Tinetti Balance Test, (b) Dynamic Gait Index, (c) Activities Specific Confidence Scale,
and demonstrate high test re-test reliability.
Limitations
This study had a relatively small sample size (N = 63) for a validity study. The
sample population may not have been a true sample of the intended demographic because
a convenience sample was used. The individuals who participated lacked general
diversity of ethnicity. Also, because they were recruited solely from the Boise, Idaho
community, it is likely that they were more uniform in their income and education levels.
Delimitations
In order to increase the variation in physical ability and age, participants were
recruited from a wide range of locations. Participants were recruited from exercise
facilities, senior community centers, independent living retirement facilities, current
research studies, and by local physician referrals. Furthermore, participants were required
to be: a) over the age of 65, b) free of cognitive impairments, and c) wholly able to
complete the study with low risks, as required by the Institutional Review Board of Boise
State University.
Assessments that were used to correlate and compare to the functional obstacle
were chosen by their focus on specific aspects of falls (physiological, cognitive, and
behavioral) and by their popularity in pertinent research and medical practice.
7
Operational Definitions
• Fall: When any part of the body involuntarily touches the ground
• Fall-risk: A person who has a high probability of falling within the next six
months
• Assessment: Diagnostic tool to determine fall risks
• Test: A trial of an assessment that results in data collection
• Balance: The ability to maintain a static equilibrium, including: standing
without postural sway and sitting without swaying or leaning
• Mobility: The ability of a person to move freely in a dynamic and changing
environment while maintain safe posture, gait, and balance
Significance of the Study
This study begins the process of trying to determine if an obstacle course, which
is broader in scope and incorporates environmental challenges, could be used in place of
several separate instruments for fall risk screening; these assessments included the
Activity Specific Balance Confidence Scale, Dynamic Gait Index, and Tinetti Balance
Test. These assessments were chosen for their wide use in research and clinical settings
and their reported range of measurement abilities. The obstacle course has the potential to
reduce the number of tests used for the purposes of screening for fall risks and increase
the efficiency of the process, while maintaining and possibly enhancing its efficacy. The
current study differed from previous research by Means, et al., (1996, 1998, 2000) in as it
validated the MFOC against three convergent measures (ABC, DGI, & TBT) as opposed
8
to only a single source. Furthermore, the current study looked at intra-obstacle
discrimination to investigate measurement constructs within the MFOC.
Summary
This chapter outlined the background of the problem and the need and
significance of the current study. Falls are one of the main causes of fatalities and injuries
for adults ≥ 65 years old (Brault, 2008). Currently, there are several assessments that
attempt to diagnose fall risks in older adults, in order to identify those individuals who
need pre-emptive care. However, these assessments do not use a comprehensive
perspective to assess fall risks, despite falls being caused by a number of broad and
intricate mechanisms. A functional obstacle course assesses the sum impact of all fall risk
factors, thus using a holistic perspective to assess fall risks.
9
CHAPTER II: LITERATURE REVIEW
With high and rising medical costs for injuries and the number of fatalities related
to falls in older adults, there is a need to have a comprehensive understanding of how to
identify those at a high risk of falling. If an older adult can be diagnosed as a fall risk and
given preventive treatment, it can potentially cut fatalities, injuries, and reduce the
growing burden on the medical system. Unlike several ailments that are common with
older adults, predicting and labeling an older adult as a fall risk is difficult because of its
broad and multi-factorial aspects. This review will examine: (a) the main components
that contribute to fall risks, both intrinsic and extrinsic, (b) common diagnostic methods
and (c) why an environmental measurement, such as a functional obstacle course, may be
a better means of predicting falls in older adults.
Societal Impact of Falls
Falls are a common concern for people over the age of 65 years old and continue
to place a burden on the American health care system. The Centers for Disease Control
estimate that more than 33% of those over the age of 65 will have an accidental fall in the
next six months (Stevens, 2008). In 2000, there were over 10,000 fatal falls and 2.6
million non-fatal (but medically treated) fall-related injuries. Medical costs in that year
alone exceeded 19 billion dollars (Stevens, Corso, Finkelstein, & Miller, 2006). The
annual costs of fall related injuries and deaths are predicted to soar past $40 billion in the
next ten years (Englander, Hodson & Terregrossa, 1996).
10
A partial reason for the large increase in medical expenses is the large shift in
age-related demographics in the United States. A report released by The Centers for
Disease Control and Prevention and The Merck Foundation (2007) estimated that by
2030, 20% of the American population will be over the age of 65, with a substantial
increase in life expectancy. The average life expectancy for adults in the United States
has increased 25% from 65 to 81 years, from 1968 to 2010, respectively (Cohen, 2010).
This increase in the percentage of the American population who will be older than 65
years and the increase in life expectancy have created a larger opening for possible fall
injuries and fatalities. While medical advancements have increased the average life
expectancy of Americans, little has been done to decrease the negative effects of aging on
older adults. This has caused an inverse correlation between the increase in life
expectancy and the number of reported accidental falls.
The Effects of Ageing on Physical Function
The effects of aging on the general state of health are well researched, but vary
with the individual (Hayes, Wolfe, Truijillo, & Burkell, 2010). There are common
ailments that often contribute to an increased risk of falling, including muscular
degeneration (i.e, senile sarcopenia). Ageing is correlated to a high degree of loss in
muscular density and cross-sectional area (Hayes, et al., 2010). Despite the dramatic
onset of sarcopenia, the cause is still not entirely understood. Along with muscular
degeneration, aging is also associated with neuromuscular degeneration. This causes a
lack of general power within the muscles, which has been shown to be a large
determinant of fall risks (Granacher, Zahner, & Gollhofer, 2008).
11
The decline in physical elements such as muscular strength and size, as well as
neuromuscular degeneration are often accompanied by a decline in cognitive function,
another common result of aging. Often patients with these disorders become easily
confused and disoriented, especially in low light, resulting in falls. This issue is
exacerbated when it is combined with ocular or macular degeneration (Lewell, et al.,
2006, Sosnoff & Voudrie, 2009).
Balance, Mobility, and Mechanisms Related to Falls
The causes of falls have been systematically viewed in relation to balance and
mobility. Balance and mobility (or deficiencies therein) are substantial portions of the
causes of falls; however, new research has shown a more complex interrelation of
varying mechanisms. The exact mechanisms that lead to a high-fall probability,
associated with balance and mobility, in an individual, can be broken into two categories:
intrinsic and extrinsic. Intrinsic mechanisms are those components that control the
anatomical factors related to maintaining dynamic balance (vestibular, sensory, and
motor) ( Spirduso, Francis, & MacRae, 1995). Intrinsic factors are those that operate
outside of the influence of external stimuli. Extrinsic factors are those that have often
been termed as risk factors in the environment, or created by the environment. A majority
of falls are the result of a combination of intrinsic and extrinsic factors
Intrinsic Components
The physiology of balance consists of several complex but interlinking
components. The four primary components of balance consist of the vestibular apparatus,
the ocular system, the nervous system (proprioception), and strength. The vestibular
12
system is central to maintaining both static and dynamic balance. Located in the inner ear
canal, the vestibular apparatus (the main component of the vestibular system) is a conch
shell-shaped organ that detects changes in linear and angular displacement, as well as rate
of change (acceleration). This information is sent directly to the central nervous system,
in order to trigger pertinent motor programs to avoid losing balance (Highstein, Fay, &
Popper, 2004). If a person begins swaying, or otherwise begins to lose balance, the
vestibular apparatus (if functioning properly) notifies the CNS, which instantly corrects
the problem in order to maintain proper stability (Young & Tolbert, 2007). In many
cases, the vestibular apparatus works in conjunction with other sensory organs, such as
the ocular system.
The ocular system gathers information about the environment in order to allow
immediate changes in an individual’s path or gait pattern. Information gathered for
automatic response by the CNS is slightly more complex and works parallel with the
vestibulo-ocular reflex (VOR). In VOR, the vestibular apparatus detects changes in
angular movement and the individual’s line of sight moves in conjunction with the
change (Vaina, Beardsley, & Rushton, 2009).
Vision also functions with the autonomic nervous system to make adjustments
based off of gathered information on changes in depth, velocity, and acceleration. This is
termed optic flow. Optic flow is a process in which we visually gather data on changes of
depth of objects in the environment. This information can be used for cognizant and
attentive processing (e.g., how far an oncoming car is in traffic) or automatic processing.
The latter of the two processes is central in maintaining balance (Vaina, et al., Rushton,
2009).
13
Both the vestibular and ocular system can be said to gather ex post facto
information, whereas the third component, proprioception, gathers information about the
working musculature. Proprioception is the information gathered by mechanoreceptors on
the body’s spatial position in order to maintain balance and make movement more
efficient. As it relates to balance and falls, proprioception is broken into three major
mechanoreceptors: muscle spindles, golgi tendon organs (GTO’s), and free nerve endings
(FNE). Muscle spindles are part of the muscle and are composed of four to six muscle
fibers engrossed in a collagenous layer, which send kinetic or kinematic information to
the CNS to create immediate information processing in an emergency. In many cases, the
CNS sends an action potential to antagonist muscle to contract in order to prevent over
lengthening. In the case of balance, the role is to correct any unintentional shifts in
muscle activation in order to regain equilibrium (Sosnoff & Voudrie, 2009).
Proprioception is a category within the area of the nervous system. Strength, as a
component of balance and mobility, is well understood. Strength is not a mechanism, but
the effect of interrelated mechanisms such as muscular characteristics and nerve
innervations. Muscles produce contractions; however, the strength of these contractions
depends on several physical parameters of the muscle. Muscles need a strong electrical
signal through a series of afferent nerves, which requires a healthy nervous system.
Power, defined as force*velocity, is central in maintaining balance and mobility. It is
limited by the muscle fiber type and the fatigue resistance of the muscle (Guincestre &
Sesboue, 2006).. The ability of a muscle to resist fatigue is limited by the fiber type and
by the metabolic pathways that buffer accumulated hydrogen ions, as result of anaerobic
cellular respiration (Guincestre & Sesboue, 2006).
14
Strength, like proprioception, sensory perception, and the vestibular apparatus
plays a crucial role in maintaining safe balance. However, as previously mentioned, aging
diminishes the efficacy of these systems. It is difficult to predict at what age, or rate,
degeneration will occur, only that aging correlates to this degeneration. As biological
aging increases, the intrinsic components of balance often decrease ( Spirduso, Francis, &
MacRae, 1995).
Thus far, the discussion has covered the four major intrinsic components of
balance, the vestibular, ocular, proprioceptive, and muscular systems and how they
function and relate to one another. The vestibular apparatus detects changes in temporal
position and acceleration and can control line of sight during head rotation, whereas
vision also communicates with the CNS through optic flow. However, falls are not
exclusively caused by impaired balance, nor by impaired physiological components
alone. Interrelated with, or independent of, the above components are the
neurophysiological mechanisms that help individuals process information effectively; this
is termed cognitive function.
Cognitive function includes proper neurophysiological components of mental
function that allows for proper information processing, such as visual recognition
(Nagamatsu, Liu-Ambrose, & Carolan, , 2009). The contributions of cognitive function,
or neurophysiological function, to balance and falls are still being investigated. However,
there is clear information on how impairments in this area can affect the likelihood of
falls. A lack of cognitive function, in these terms, can be best understood through general
dementia. Dementia is often a chronic and progressive deterioration of multiple higher
cortical functions, including memory, orientation, calculation, and recognition. Dementia
15
is most common in older adults, with a high rate of dementia patients institutionalized for
fall related injuries (Verghese, Lipton, Hall, Kuslansky, Katz, & Buschke, 2002).
Ageing has been shown to increase the risk of degeneration for all of the above
intrinsic components. Ageing decreases sensory capabilities, reflexes, muscular strength
and power, and cognitive function, all of which have a substantial effect on the likelihood
of a fall (Huan, 2010).
Extrinsic Components
Falls are often attributed to intrinsic factors and in many cases these factors play a
significant role. However, falls happen in an open environment that is influenced in part
by psycho-social factors and the environment itself. Psycho-social components, as they
relate to fall risks, can be defined as the fear of falling, or balance self-efficacy (Bandura,
1986).
Situational specific self-confidence, or self-efficacy, is a complex model that has
been shown to play a large role in a variety of behaviors (Bandura, 1986). Among these
behaviors, self-efficacy has shown to be a large determinant of fall risks (Arnadottir, et
al., 2010; Pang & Eng 2008). A lower level of self-efficacy is linked to increases in falls.
In several studies, low self-efficacy was a better determinant than physiological
components at identifying those at a higher risk of falling (Arnadottiret al., 2010; Pang &
Eng 2008; Simpson, et al., 2009). Fear of falling (low self-efficacy), diminishes a
person’s ability to safely navigate through environmental obstacles, thus leading to an
increase in falls.
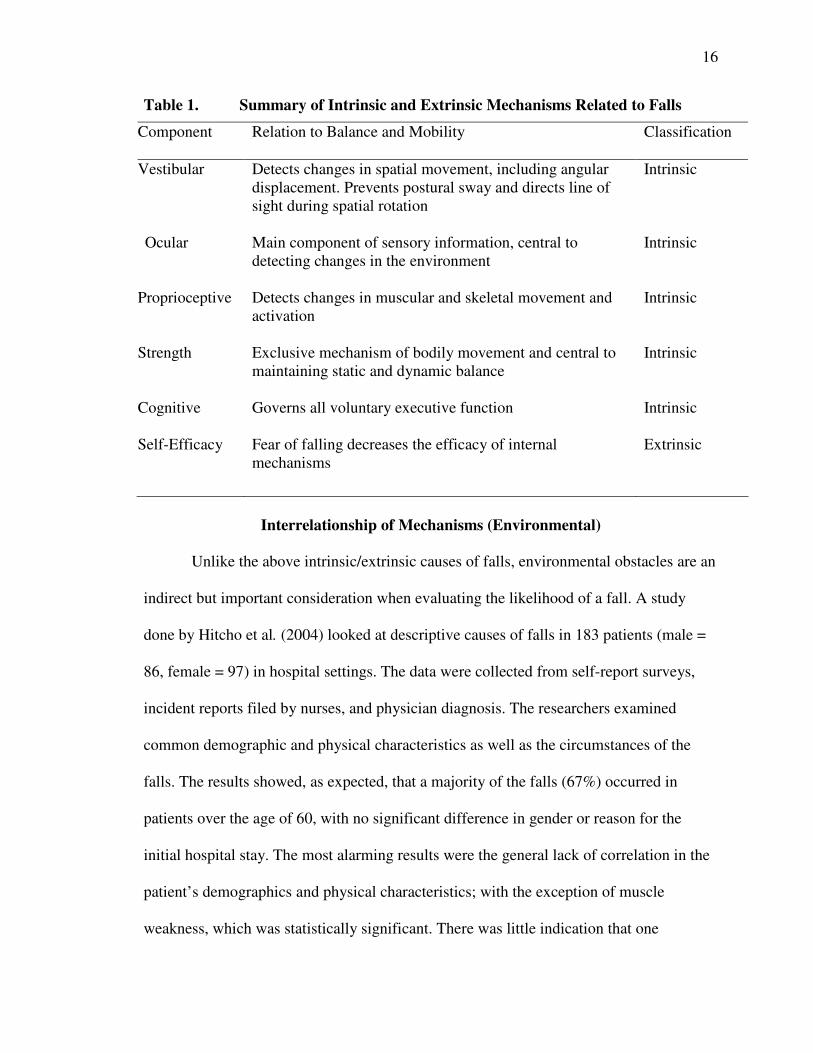
The following table summarizes the intrinsic and extrinsic mechanisms, discussed
above, that relate to falls (Table 1).
16
Table 1. Summary of Intrinsic and Extrinsic Mechanisms Related to Falls
Component Relation to Balance and Mobility Classification
Vestibular Detects changes in spatial movement, including angular displacement. Prevents postural sway and directs line of sight during spatial rotation
Intrinsic
Ocular Main component of sensory information, central to detecting changes in the environment
Intrinsic
Proprioceptive Detects changes in muscular and skeletal movement and activation
Intrinsic
Strength Exclusive mechanism of bodily movement and central to maintaining static and dynamic balance
Intrinsic
Cognitive Governs all voluntary executive function
Intrinsic
Self-Efficacy Fear of falling decreases the efficacy of internal mechanisms
Extrinsic
Interrelationship of Mechanisms (Environmental)
Unlike the above intrinsic/extrinsic causes of falls, environmental obstacles are an
indirect but important consideration when evaluating the likelihood of a fall. A study
done by Hitcho et al. (2004) looked at descriptive causes of falls in 183 patients (male =
86, female = 97) in hospital settings. The data were collected from self-report surveys,
incident reports filed by nurses, and physician diagnosis. The researchers examined
common demographic and physical characteristics as well as the circumstances of the
falls. The results showed, as expected, that a majority of the falls (67%) occurred in
patients over the age of 60, with no significant difference in gender or reason for the
initial hospital stay. The most alarming results were the general lack of correlation in the
patient’s demographics and physical characteristics; with the exception of muscle
weakness, which was statistically significant. There was little indication that one
17
common illness was the main culprit for the falls and even the high correlation between
falls and muscle weakness is questionable due to the extended stay of many of the elderly
patients (i.e., extended bed rest causes muscular atrophy and may not be a true indicator
of the fall). Half of the patients were fully alert at the time of the fall, while others were
confused. Only 30% of the patients were previously labeled as “fall risks.” However,
there is an indication that environmental factors played a contributing role.
The most common environmental causes, according to the previous study by
Hitcho et al. (2004), were issues with the floor surface and lighting. A majority of the
falls that were caused by self-reported “slips” were due to wet surfaces on the floor.
Another 8% of the falls were caused by patients trying to avoid obstacles and a total of
30% of the falls occurred in the late hours of the night and in low-light situations. In
summary, a total of 74% of falls were caused by environmental factors (not all causes are
mentioned here).
In addition to the high rate of falls caused by environmental factors, a high
number of the patients had many of the disorders that have been previously deemed as
contributors to falls. This could possibly indicate that the physical or mental factors that
are associated with falls impede the body’s ability to adapt to changing environmental
surfaces and lighting conditions. Despite limited research, current studies have shown a
correlation to specific environmental hazards (e.g, low lighting, smooth surfaces, uneven
surfaces, stairs) and accidental falls (Gill, Williams, Robinson, & Tinetti, 1999).
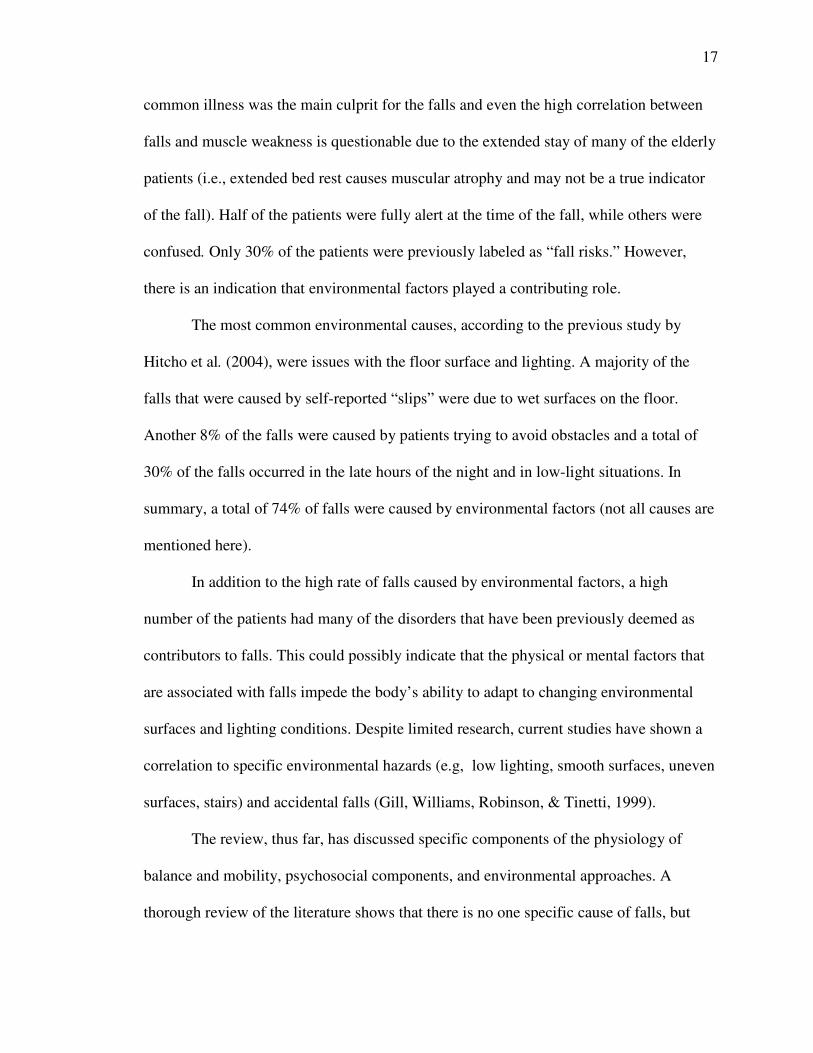
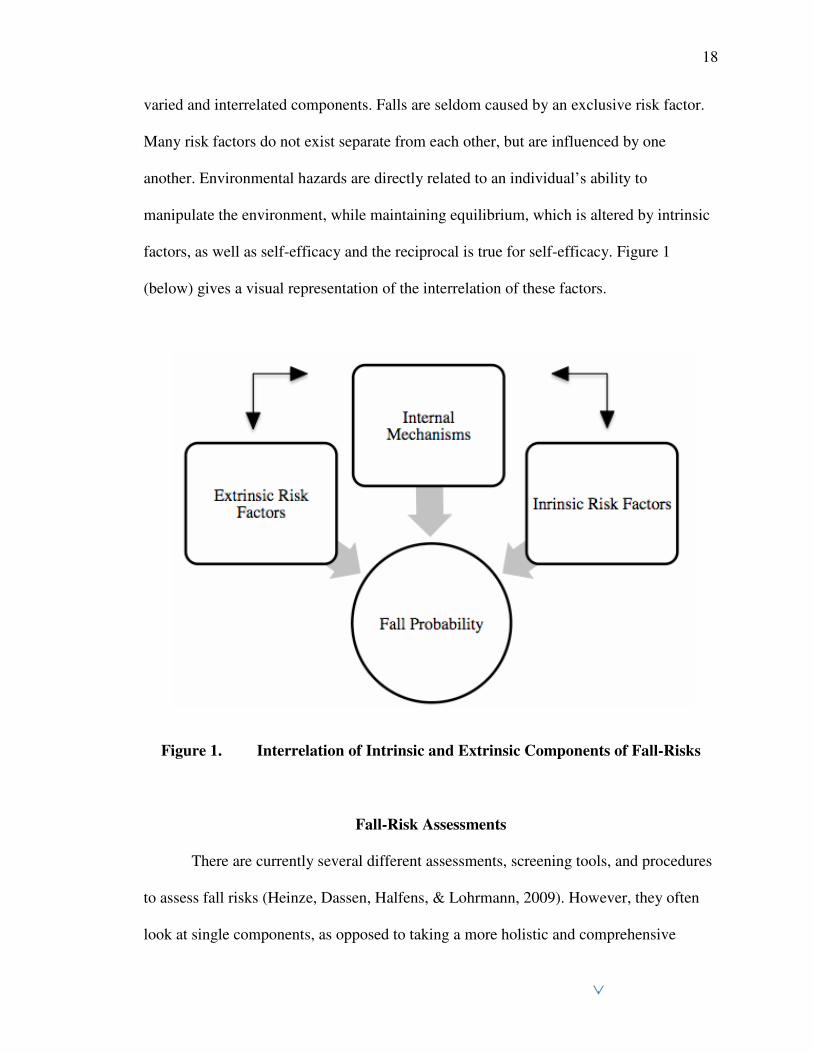
The review, thus far, has discussed specific components of the physiology of
balance and mobility, psychosocial components, and environmental approaches. A
thorough review of the literature shows that there is no one specific cause of falls, but
18
varied and interrelated components. Falls are seldom caused by an exclusive risk factor.
Many risk factors do not exist separate from each other, but are influenced by one
another. Environmental hazards are directly related to an individual’s ability to
manipulate the environment, while maintaining equilibrium, which is altered by intrinsic
factors, as well as self-efficacy and the reciprocal is true for self-efficacy. Figure 1
(below) gives a visual representation of the interrelation of these factors.
Figure 1. Interrelation of Intrinsic and Extrinsic Components of Fall-Risks
Fall-Risk Assessments
There are currently several different assessments, screening tools, and procedures
to assess fall risks (Heinze, Dassen, Halfens, & Lohrmann, 2009). However, they often
look at single components, as opposed to taking a more holistic and comprehensive
19
approach that considers all contributing components. Research to identify more
comprehensive screening tools to assess fall risks is still in the early stages and is slow to
progress because of the complex nature of falls. There are several contributing factors
that can cause accidental falls. The exact mechanisms that each assessment targets can be
difficult to exegete because of the interrelation between mechanisms, including: the fear
of falling (or self-efficacy), which may impede a participant’s ability to perform a variety
of diagnostic tests.
There are, however, popular instruments that have attempted to screen for fall
risks in the older adult population, including: the Activity Specific Balance Confidence
Scale, Dynamic Gait Index, and Tinetti Balance Test. These assessments can often be
labeled as multi-factorial, because they measure multiple components; whereas,
instruments that target a specific component are labeled single-factorial.
Single-Factorial Assessments
Activity Specific Balance Confidence Scale (ABC)
The ABC Scale, based on the theory of self-efficacy, is a 16-item self-report
questionnaire in which respondents rate their level of self-confidence in specific activities
such as “reaching on tiptoes,” “walking in a crowded area,” etc. (Hatch, Gill-Body, &
Portney, 2003). Each of the 16 items is scored on a 0-100% scale, with 100% being fully
confident at performing the task without a fear of falling. All of the individual percentiles
are averaged to create a total score (Myers, Fletcher, Myers, & Sherk, 1998). There is still
little research on the correlation between low scores on the ABC and the risk of falling,
so individual practitioners have to use their own judgment when determining whether a
participant is at risk of falling, depending on their score. Despite the lack of correlative
20
and normative data, the ABC has been subjected to reliability and construct validity
studies and has been shown to have a high test re-test reliability (r = .92) and moderate
construct validity when compared to self-efficacy scales, such as the Physical Self-
Efficacy Scale (r = .63) (Powell & Myers, 1995). The ABC has not been tested for
convergent validity, which would be measured by determining its ability to discriminate
against fallers and non-fallers.
The ABC and similar assessment tools are based on the theory that self-efficacy
can affect physical performance (Powell & Myers, 1995). There will be more detail on
this later in the review, but it is important to note that when examining the determinants
of fall risks, they are not limited to physical components. Of course, there are
confounding variables when examining the psychological determinants, because they are
often preceded by physical limitations. Most often, older adults who have experienced a
fall in the past have a lower self-efficacy than those who have not fallen (Hatch, et al.,
2003). For this reason, a low score on the ABC Scale may correlate to a higher risk of
accidental falls, but this may be attributed to the physical limitations, or circumstances,
that caused the initial fall.
Multi-Factorial Assessments
Dynamic Gait Index (DGI)
The DGI was originally created as a method for assessing an individual’s ability
to safely modify his or her gait during dynamic tasks and was specifically intended as a
research tool to evaluate physical rehabilitation interventions (Whitney, Hudak, &
Marchetti, 2000). The gait tasks of the DGI were chosen from a review of previous
research that had examined changes in gait through various tasks, in pre and
21
postrehabilitation participants (Shumway-Cook & Woollacott, 1995). After its inception,
however, it was shown as a moderate predictor of future falls in the elderly. This was
determined via a convergent validity study. The DGI showed a moderate ability to
discriminate between fallers and non-fallers (Shumway-Cook, Baldwin, Polissar, &
Gruber, 1997; Whitney, et al., 2000).
In the DGI, a participant is asked to walk for set distances while performing or
encountering eight different tasks. The tasks are varied and include activities such as
walking while tilting the head. Participants are scored on set categories of gait
modification, with the total score summed at the completion of the test (Shumway-Cook
& Woollacott, 1995).
Tinetti Balance Test (TBT)
The TBT requires a participant to perform a series of specific tasks that relate to
balance and mobility. The tasks were chosen based on the current research at the time
(the test was designed in 1986). The original authors reviewed common activities that
correlated to falls. During the test, an administrator scores the participant on an ordinal
scale of 0-2 per task. The individual scores are aggregated to create three separate
measures: gait assessment, overall balance, and gait and balance combined; with a
maximum score of 12 (Tinetti, 1986). Validation studies on the TBT have a high
variance. The test has a moderate to high inter-reliability (r = .85) (Raiche, Hebert, &
Price, 2000). The TBT has shown moderate to high convergent validity, when correlated
to the DGI. However, it has only shown low to moderate construct validity (Lewis,
1993).
22
Modified Functional Obstacle Course (MFOC)
The MFOC consists of 12 activity specific obstacles that are designed to replicate
common environmental hazards (Means, et al., 1996). Each obstacle is designed to
challenge the physiological and or behavioral components of balance and ambulatory
mobility (Means, et al., 1996). There has not been an extensive study, to date, that has
reviewed the measurement constructs of each of the obstacles. This makes it difficult to
know, conclusively, what mechanisms related to falls are being measured by the
individual obstacles. Five of the stations have varied floor textures. The authors refer to
these textures as “floating surfaces” and two more floor surfaces have graded surfaces (an
incline and decline). The graded obstacles include stairs (four steps) and a ramp (Means
& O’Sullivan 2000). The test also includes opening and closing a door and standing from
a chair. The entire course is constructed so that a participant can only complete one task
at a time and the order of the obstacles is rigid; the order of the obstacles is the same for
all participants. Participants are scored on a quantitative and qualitative scale. The
quantitative scale is measured via the time to complete the course and the qualitative
score is constructed of the sum of the performance on each of the individual obstacles
(with a range of 0-3, per obstacle). See Appendix A for a complete scoring sheet.
The MFOC was originally designed to measure the efficacy of fall risk
interventions and was intended to measure all factors related to falls (Means, et al., 1996).
The obstacle course has a moderate to high construct validity (r = .78) in
correlation to the TBT. However, the layout of the course was modified after the original
validity study, and a number of the original obstacles (there were originally 18 obstacles)
were removed from the course. This was done to increase the clinical applicability of the
23
course (Means, et al., 1998). The new modified version was correlated to the original and
showed high correlation (r = .88); however, an extensive validity study has not been
performed. The MFOC and its un-modified version were originally designed by Means,
Rodell, and O’Sullivan (1996, 1998; Means & O’Sullivan, 2000; Means, 2005). A
summary of the obstacle course as it relates to other assessments is listed below in Table
2.
24
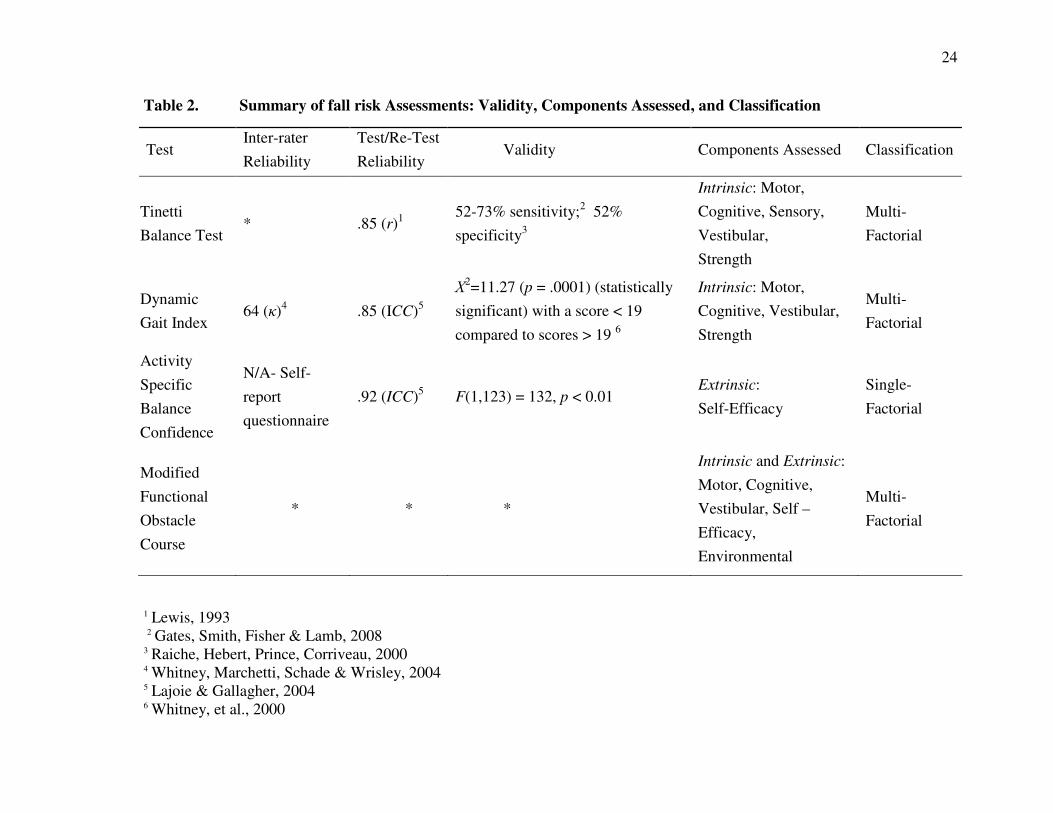
Table 2. Summary of fall risk Assessments: Validity, Components Assessed, and Classification
1 Lewis, 1993
2 Gates, Smith, Fisher & Lamb, 2008 3 Raiche, Hebert, Prince, Corriveau, 2000 4 Whitney, Marchetti, Schade & Wrisley, 2004 5 Lajoie & Gallagher, 2004 6 Whitney, et al., 2000
Test Inter-rater
Reliability
Test/Re-Test
Reliability Validity Components Assessed Classification
Tinetti
Balance Test * .85 (r)1
52-73% sensitivity;2 52%
specificity3
Intrinsic: Motor,
Cognitive, Sensory,
Vestibular,
Strength
Multi-
Factorial
Dynamic
Gait Index 64 (κ)4 .85 (ICC)5
Χ2=11.27 (p = .0001) (statistically
significant) with a score < 19
compared to scores > 19 6
Intrinsic: Motor,
Cognitive, Vestibular,
Strength
Multi-
Factorial
Activity
Specific
Balance
Confidence
N/A- Self-
report
questionnaire
.92 (ICC)5 F(1,123) = 132, p < 0.01 Extrinsic:
Self-Efficacy
Single-
Factorial
Modified
Functional
Obstacle
Course
* * *
Intrinsic and Extrinsic:
Motor, Cognitive,
Vestibular, Self –
Efficacy,
Environmental
Multi-
Factorial
25
History of Obstacle Courses in Research Literature
Obstacle courses (OC) have been used in a relatively small amount of research
studies and only one validation study. All pertinent research was performed by Means, et
al. between 1996 and 2005 (Means, Rodell, & O’Sullivan, 1996; Means & O’Sullivan,
1998; Means, 2005). In their initial study, the researchers performed a task-specific
validation study. The initial design of their OC and research was to investigate its use at
measuring balance and mobility in older adults to determine the quality of fall risk
interventions, and not as a fall risk assessment. Following the original validation study on
the OC, it was modified due to initial design flaws that included “difficult to transport,”
and “costly.” Both of these factors inhibited the OC from being widely used in clinical
practice. Furthermore, the obstacle course over-emphasized “outdoor” fall risk factors
(Means, 2005) and did not include a chair sit-to-stand task, which has been highly
validated as an activity specific indicator of fall risks (Granacher, et al., 2008). The
original course (1996) was built for the specific purpose of aiding in on-site analysis of
fall risk interventions. It was not until after the original validation study (Means, Rodell,
& O’Sullivan, 1998) that the researchers re-designed the course to be more mobile, and
thus increase its clinical applicability. Although the original obstacle course design has
gone through a validity study for assessing fall risks for older adults, the modified version
of the obstacle course has not been validated.
Obstacle courses have also been used as a research tool in fall prevention
intervention research. In these cases, researchers located a population of participants who
had already fallen, or had a high likelihood of falling. The participants went through a
battery of fall risk assessments, many of which have already been mentioned. However,
26
the researchers often included a novel OC as another measurement tool (Shimada &
Uchiyama, 2003; Steadman, Donaldson, & Kalra, 2006). These obstacles courses were
created by the researchers, and the details of the courses were not published. Despite the
prevalence of the OC as an assessment method, there was a general lack of reference to
its design or construction. This implies a need for an instrument such as an OC. Thus
there is a need for a published layout of a valid and reproducible obstacle course.
In order to use an OC, a screening assessment and properly designed validity
study are imperative. In order to determine the construct validity of a course, it must be
correlated to the most commonly used assessment tools that are now in place. Because
each of the previously mentioned assessments have all been validated to test individual
components of balance and mobility and an OC is intended to test the summation of all of
these components, if an OC shows a high correlation to the common tests than it can be
considered efficacious as a holistic predictor of future falls and in diagnosing “fall risks.”
As previously mentioned, the common fall risk assessments have provided
moderate abilities at screening for fall risks. In many cases, this was determined by
performing a construct validity study, in which the assessment of interest was correlated
to other common assessments (Raiche, et al., 2000; Whitney, et al., 2004)
These assessments, however, may only measure a limited number of fall-related
mechanisms. The result is often a one or two-dimensional perspective, which can be
beneficial, but often misses the broader multi-dimensional causes of falls. Until research
can show definitive and universal causes of falls, looking at single factors (in a multi-
factorial disease) will provide poor predictions. Because information is still being
gathered on all of the aspects of fall factors, it is less important to assess what may cause
27
a future fall but, rather, to look at the summation of all impairments in a realistic setting,
because falls do not happen in a closed setting, but within a changing and dynamic
environment.
Background on Validity Studies
A validity study is an integral part of the research process. Before any instrument
can be widely used in either clinical or research purposes, it is important that it has been
validated. However, it is worth noting that the qualification for validity can be subject to
each practitioner’s standard. The assessments previously mentioned in this review have
been tested in two validity paradigms: construct and convergent. In construct validity
studies, the assessment of interest is correlated to other assessments that are in current
practice and that have been previously validated in a manner to examine whether an
assessment measures the construct it purports to measure. For example, a study that has
been shown to measure construct A can be used, via correlation, to show that a second
assessment measures the same construct. Convergent validity is determined by
comparing the assessments of interest to the “gold standard.” In the case of fall risk
screening instruments, this would entail measuring the instruments ability to discern
between fallers and non-fallers (Carmines & Zeller, 1979), through a variety of possible
methods. In terms of performing fall risk assessments, this would require a follow up
after the original testing to measure the frequency of falls in the sample.
Data analysis for this study entailed using Pearson Correlation with the MFOC
and three other popular individual assessments to determine construct validity and test re-
test reliability. Cronbach’s Alpha was used to measure internal consistency.
28
Because the assessments are using continuous variables of measurement, Pearson
is an adequate form of measuring how well the MFOC compares to the three highest
standards of fall risk assessments. Each of these assessments has been validated to assess
their target components. A more detailed description of the data analysis procedures is
included in Chapter III.
Rationale for Creating an Obstacle Course
A systematic review of current fall risk assessments was performed by Oliver, et
al. (2004). They found tests, such as the Activity Specific Balance Confidence Scale,
Tinetti Balance Test, etc., examine self-efficacy, postural sway, or other single and
exclusive components. However, most falls in the older adult population occur in open
and dynamic situations while they are involved with activities of daily living. Currently,
many of the conventional instruments used to assess fall risk have limitations, may
require substantially expensive equipment, and/or have a narrow scope of focus. These
types of assessments lack the pivotal environmental aspect, which may be a more
effective way of identifying older adults who are at risk of falling (Simpson, et al., 2009).
A test that examines a single component of falls will continue to provide
practitioners and researchers with a narrow view of this broad and complex issue. A fall
risk assessment tool should not only look at the causes of falls, but how those causes limit
the body’s ability in novel tasks, as this is where many falls take place.
A properly designed obstacle course (OC) should have the ability to examine the
effectiveness of muscular strength and power, proprioceptive ability, cognitive function,
and even many socio-psychological parameters. An OC is a set area of challenging
functional and practical tasks that are completed in immediate succession. For example,
29
an OC that involves first standing from a seated position, as well as other obstacles
further in the course, tests muscular strength and power. Other tasks such as walking over
a slightly uneven surface test cognitive function, because a participant must be aware of
the upcoming obstacle to make corrections in gait. This, of course, also tests sensory
perception because a participant must be aware of the obstacle before any action begins.
It also tests the proprioceptive system. An uneven surface and other related tasks are
intrinsically new and novel to the participant and, therefore, negate stored motor
programs, forcing the participant to rely on proprioceptive awareness to complete the
task (Means, et al., 1996, 1998). These obstacles and others, such as climbing up and
down stairs, are designed to be truly functional, because they are tasks that would be
completed during everyday activities. For this reason, an OC also tests self-efficacy and
balance confidence.
Summary
This literature review examined the effect of accidental falls on health care costs
and the risk it poses to the increasing number of older adults in America, and what
constitutes balance and mobility and their effect on fall risks. Included in the discussion
of balance and mobility were common ailments that increase the rate of fall risk in aging.
The discussion on balance, mobility, and their impairments was central to the main
purpose of the study, which intends to look at the validity of a novel assessment to
diagnose fall risks (Modified Functional Obstacle Course) by comparing it to three
popular assessments.
30
CHAPTER III: METHODS
This chapter will review the methods used for recruiting study volunteers and
provide a detailed explanation of all tests being used. In addition, protocol for the testing
sessions and data analysis will be explained.
Participants
Prior to commencing the study, approval was obtained for the use of human
subjects from the Institutional Review Board of Boise State University (January 2011). In
order to participate, volunteers had to be: (a) ≥ 65 years old, (b) provided a signed
informed consent, (c) given approval to participate by their primary health care provider,
(d) free from severe macular and ocular degeneration, and (e) free of substantial cognitive
impairments.
A convenience sample of community dwelling participants ≥ 65 years of age were
recruited for the study. Volunteer participants were recruited through a variety of
methods. These methods included: (a) flyers, (b) word of mouth, and (c) direct contact by
the primary researcher. The primary researcher also visited community and retirement
centers, as well as local programs for older adults. Interested participants were contacted
by phone or in person by the primary researcher. See Appendix F for a written phone
script. Volunteer participants were asked to attend an orientation session, where informed
and medical consent documents were distributed. During the initial meeting, in
conjunction with distributing consent forms, potential volunteers were further informed
31
about all aspects of the study, including: inherent risks, benefits, time requirements, data
management, participating research staff, and corresponding credentials. Seventy
participants were sought for the study and a total of 63 older adults completed the study;
the lower than expected participation was due to resource limitations, including: limited
recruitment material and staff.
Instrumentation
Testing consisted of four separate instruments. Each assessment had different
protocols, which are outlined below.
Modified Functional Obstacle Course (MFOC)
The obstacle course used in the study was originally created and later modified by
Means and O’Sullivan (2000). The obstacle course that was modified for this study is
primarily the design of the aforementioned authors, with slight alterations (see Table 3
for a complete description of the MFOC). The original authors on the MFOC provided
verbal consent to use and modify their initial obstacle course for this study.
The MFOC has 12 different tasks that are intended to imitate common
environmental hazards. Scoring is divided into two categories: time to complete (time
score) and the participant’s ability to cross an obstacle without assistance (performance
score). There is a maximum of 36 points a participant can receive. The higher an
individual scores, the better the participant’s performance. For example, if a participant
requires a handrail to balance him/herself, the researcher/practitioner deducts one point
from the scoring on the obstacle. See Appendix A for complete scoring guide.
32
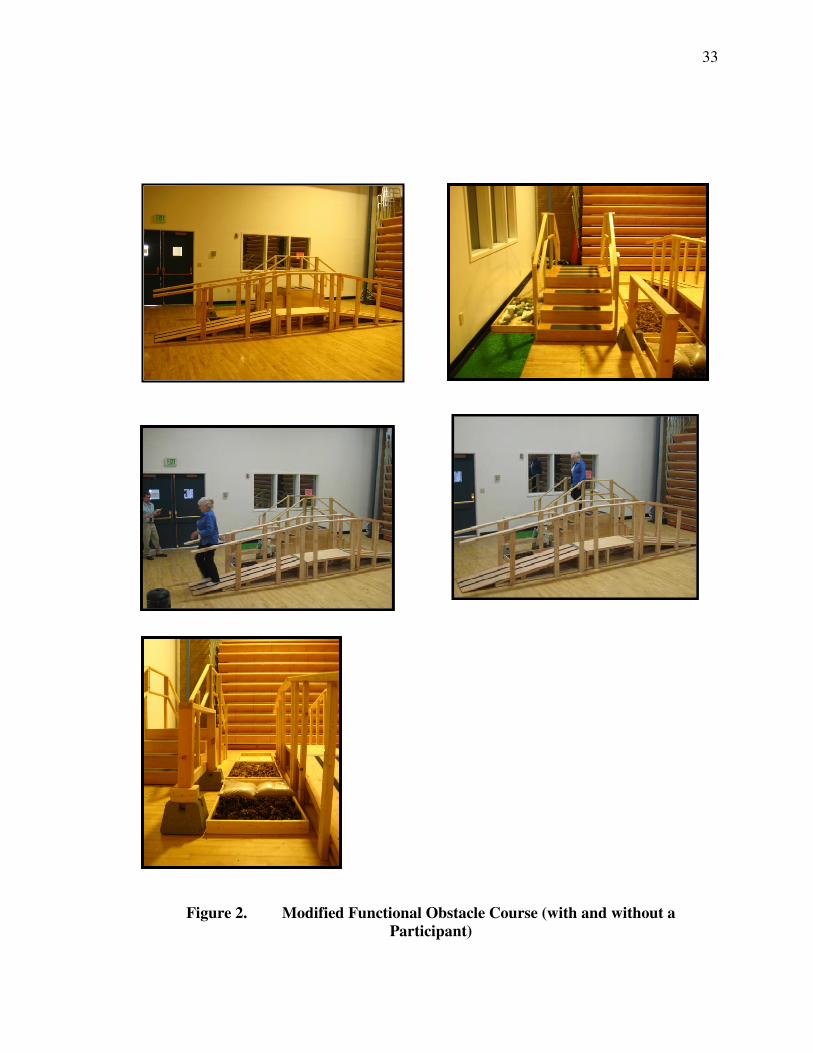
One of the tasks required dynamic activity while physically manipulating an
object, which was the door opening task. Six of the tasks involved walking over various
textures and four required walking up and down stairs and ramps. Figures 2 and 3
illustrate a number of these tasks. Six of the obstacles (chair stand, door opening, foam
bolsters, carpet, sand, and up and down ramp) were all placed next to a wall, for safety.
The stairs include handrails and the pinecones and pine bark obstacles were on the side of
the staircase. The placements of all obstacles were chosen based on the proximity of
handrails or walls in order to increase safety and allow for a greater range of analysis.
The practitioner did not interact with the participant at any time, unless they asked for
assistance. The “performance score” was based on the amount of assistance the
participant needed. For example, if a participant used a handrail to cross an obstacle, that
would equate to a lower score than if he, or she, did not need to use the handrail. If the
participant requested assistance, the practitioner helped the participant cross an obstacle.
However, if assistance was given, the participant received a score of zero for that
particular obstacle.
The order and title of each obstacle is as follows: (a) chair stand, (b) door walk
through, (c) artificial turf, (d) foam bolsters, (e) carpeted turf, (f) pinecone flooring, (g)
stairs (incline), (h) stairs (decline), (i) pine bark flooring, (j) sand box, (k) ramp (incline),
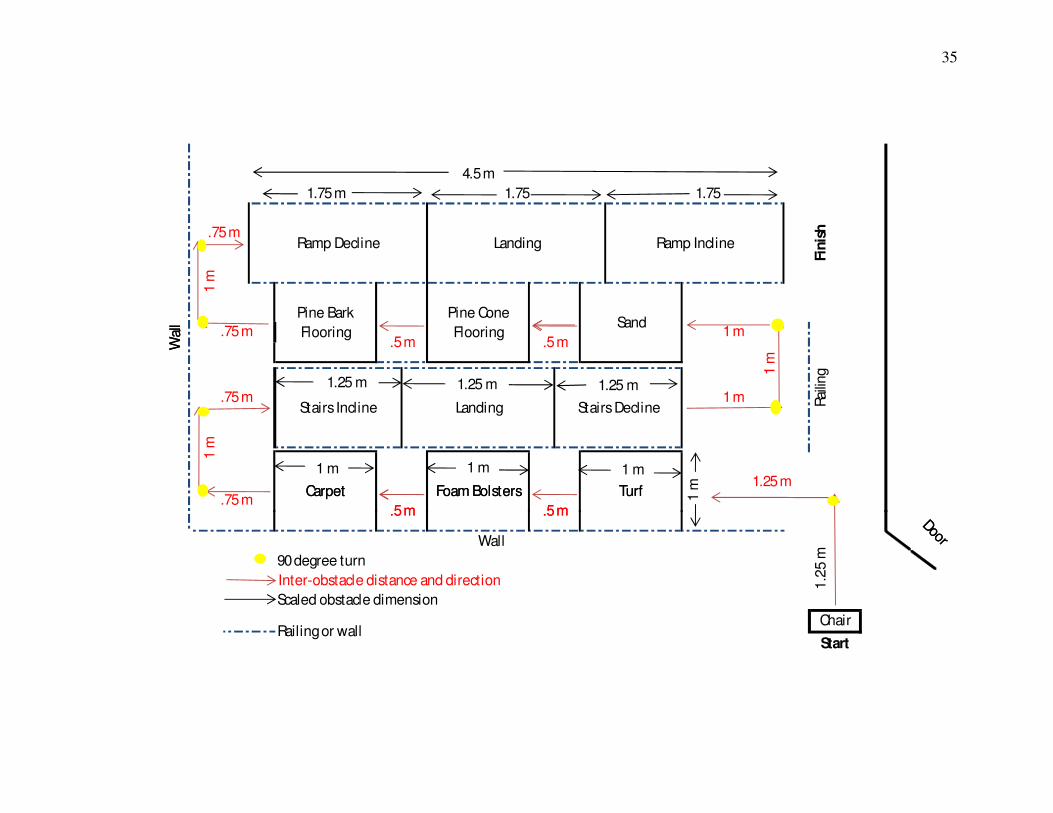
and (l) ramp (decline). All of the obstacles listed above have specific inter-obstacle
distances. A description of the obstacles and sequential order are listed in Table 3;
pictures of the course are shown in Figure 2. A diagram of the course is shown in Figure
3.
33
Figure 2. Modified Functional Obstacle Course (with and without a
Participant)
34
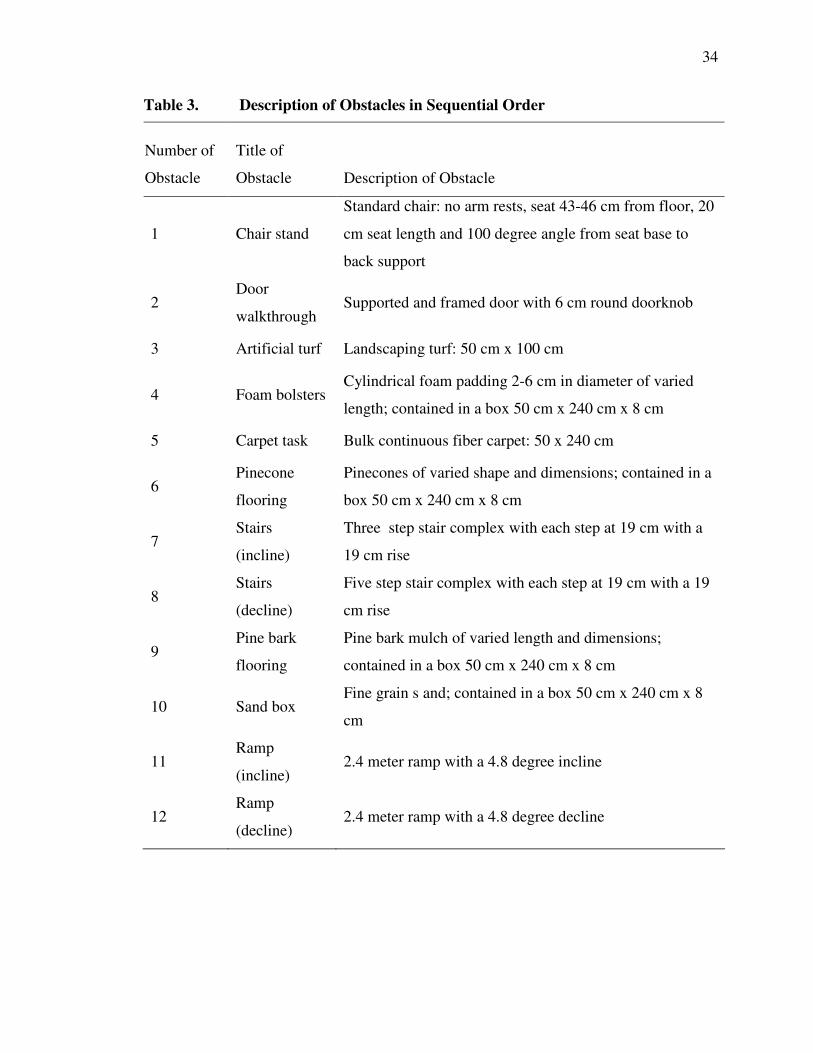
Table 3. Description of Obstacles in Sequential Order
Number of
Obstacle
Title of
Obstacle Description of Obstacle
1 Chair stand
Standard chair: no arm rests, seat 43-46 cm from floor, 20
cm seat length and 100 degree angle from seat base to
back support
2 Door
walkthrough Supported and framed door with 6 cm round doorknob
3 Artificial turf Landscaping turf: 50 cm x 100 cm
4 Foam bolsters Cylindrical foam padding 2-6 cm in diameter of varied
length; contained in a box 50 cm x 240 cm x 8 cm
5 Carpet task Bulk continuous fiber carpet: 50 x 240 cm
6 Pinecone
flooring
Pinecones of varied shape and dimensions; contained in a
box 50 cm x 240 cm x 8 cm
7 Stairs
(incline)
Three step stair complex with each step at 19 cm with a
19 cm rise
8 Stairs
(decline)
Five step stair complex with each step at 19 cm with a 19
cm rise
9 Pine bark
flooring
Pine bark mulch of varied length and dimensions;
contained in a box 50 cm x 240 cm x 8 cm
10 Sand box Fine grain s and; contained in a box 50 cm x 240 cm x 8
cm
11 Ramp
(incline) 2.4 meter ramp with a 4.8 degree incline
12 Ramp
(decline) 2.4 meter ramp with a 4.8 degree decline
35
Wal
l
.75 m
1 m
.75 m
1 m
1 m
1.25 m1.5 m1.25 m
Rai
ling1
m
1 m
Door
Stairs DeclineLanding
.5 m.5 m
1.25 m
1 m
.75 m
.75 m
TurfFoam BolstersCarpet
Stairs Incline
Ramp InclineLandingRamp Decline
SandPine Cone
Flooring
Pine Bark
Flooring
Fin
ish
.5 m .5 m
1.751.751.75 m
4.5 m
90 degree turn
Scaled obstacle dimension
Inter-obstacle distance and direction
Railing or wall
Wal
l
Wall
Start
Door
1.2
5 m
Chair
.5 m.5 m
TurfFoam BolstersCarpet
1.25 m 1.25 m 1.25 m
1 m 1 m 1 m
Figure 3. Schematic of Modified Functional Obstacle Course
36
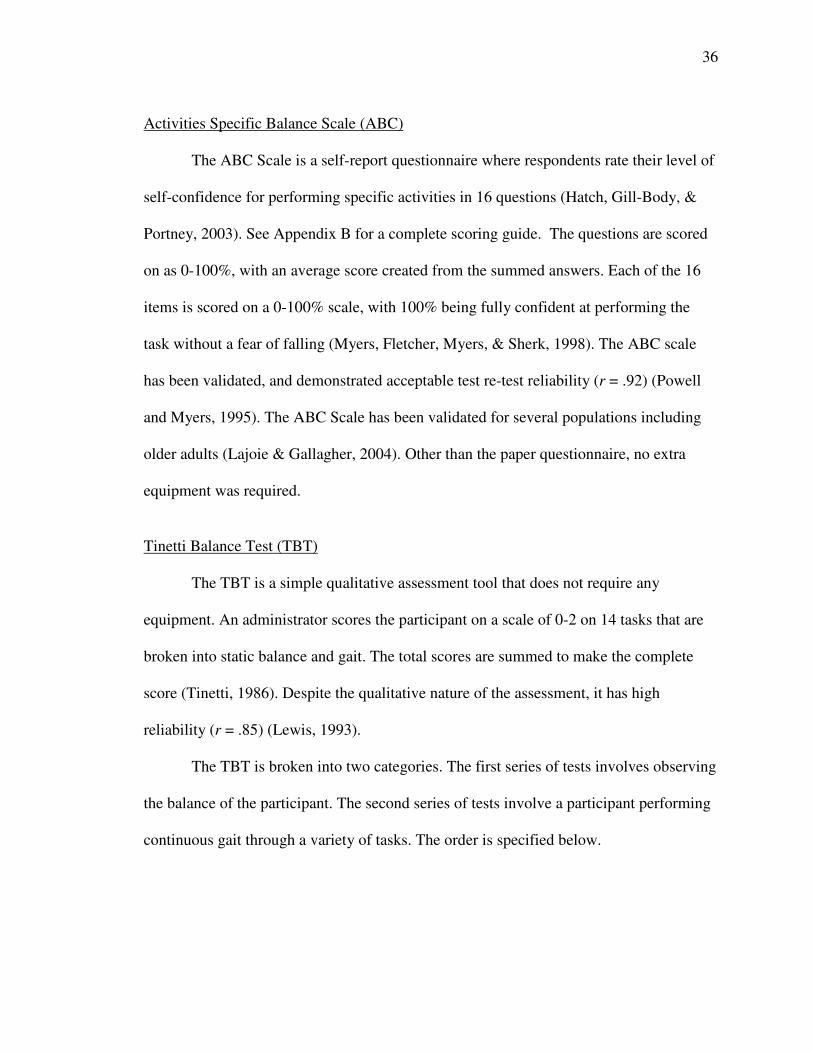
Activities Specific Balance Scale (ABC)
The ABC Scale is a self-report questionnaire where respondents rate their level of
self-confidence for performing specific activities in 16 questions (Hatch, Gill-Body, &
Portney, 2003). See Appendix B for a complete scoring guide. The questions are scored
on as 0-100%, with an average score created from the summed answers. Each of the 16
items is scored on a 0-100% scale, with 100% being fully confident at performing the
task without a fear of falling (Myers, Fletcher, Myers, & Sherk, 1998). The ABC scale
has been validated, and demonstrated acceptable test re-test reliability (r = .92) (Powell
and Myers, 1995). The ABC Scale has been validated for several populations including
older adults (Lajoie & Gallagher, 2004). Other than the paper questionnaire, no extra
equipment was required.
Tinetti Balance Test (TBT)
The TBT is a simple qualitative assessment tool that does not require any
equipment. An administrator scores the participant on a scale of 0-2 on 14 tasks that are
broken into static balance and gait. The total scores are summed to make the complete
score (Tinetti, 1986). Despite the qualitative nature of the assessment, it has high
reliability (r = .85) (Lewis, 1993).
The TBT is broken into two categories. The first series of tests involves observing
the balance of the participant. The second series of tests involve a participant performing
continuous gait through a variety of tasks. The order is specified below.
37
Balance tests
Sitting balance. The participant sits in a hard, armless chair for thirty seconds,
while the researcher observes the participant’s balance.
Rises from a chair. The task measures the participant’s ability to stand from a
chair unassisted.
Immediate standing balance. The practitioner observes the participants balance
during the first five seconds after standing from the chair.
Nudged. The practitioner gently “nudges” the participant in his or her sternum and
observes the participant’s ability to maintain balance.
Eyes closed. The practitioner observes the participant stand (static) with both feet
on the floor, for 20 seconds with eyes closed.
Turn 360 degrees. Without deviating from a given space, the participant must
make one complete circle.
Sitting down. The participant moves into a standard chair and completes the task
at ≈ 90 degree knee flexion.
Gait Tests
Participant begins walking with normal gait. There are no scenarios within this
task. The practitioner observes gait pattern and scores accordingly. The participant
continues walking until all areas have been assessed. The areas of assessment include: (a)
step length and height, (b) step symmetry, (c) step continuity, (d) gait path (deviation), (e)
trunk sway, and (f) register of stance during normal gait (for a complete description and
score form for the TBT see Appendix C).
38
Dynamic Gait Index (DGI)
The DGI is an eight-item assessment tool that assesses a participant’s gait during
task-oriented activities: such as, 180-degree pivot, vertical and horizontal head turns, and
walking up steps. The DGI requires a participant to perform eight functional tasks that
require gait alterations. Each task on the index is scored on an ordinal scale of 0-3, with a
maximum final score of 24. The test takes approximately 15 minutes to complete. This
DGI has been validated as a measurement tool for fall risks (Chiu, 2006). The practitioner
does not interact with the participant, other than to observe and measure the volunteer’s
performance. For a complete description and score form of the DGI, see Appendix D.
The order of the tests is as follows:
Gait on Level Surfaces
The participant walks from the starting position to the next mark (20 feet). There
is not a particular obstacle during this portion of the test.
Change in Gait Speed
The participant walks on a level surface for five feet and then increases speed to
his/her fastest possible walk. After five feet, the participant slows back down to a normal
gait speed.
Gait with Horizontal Head Turns
The participant walks in a straight path on a level surface. After five feet, the
practitioner will ask the participant to look to the left while walking. After another five
feet, the practitioner asks the participant to walk while looking to the right.
39
Gait with Vertical Head Turns
This portion is identical to the “gait with horizontal head turns.” However, instead
of changing looking left or right, the participant is asked to look up and down.
Gait and Pivot Turn
The participant begins walking on a level surface and the practitioner asks the
participant to pivot 90 degrees, in any direction. Scoring is based off the time it takes to
complete the full pivot.
Step Over Obstacle
The participant walks five feet to an eight-inch box. Without touching the box, the
participant must step over the box and continue walking for another five feet.
Step Around Obstacles
The participant must make a figure eight around two cones placed six feet apart.
Stairs
The participant begins at the bottom of a standard set of stairs (8*8) and walks up
five steps, then turns and walks back down. For this study, a modality staircase was used
and participants did not need to complete a turn, but were able to walk in a continuous
path.
Procedures
The purpose of this study was to (a) examine the construct validity of the MFOC,
by measuring the correlation of the MFOC to current assessments, (b) examine the
40
reliability, and (c) further determine construct validity and intra-obstacle discrimination
via principal component analysis.
Several parameters for testing were incorporated to ensure strong data validity
and decrease risks for the participants. The construction of the obstacle course was tested
through a pilot study (N = 10) with participants prior to IRB approval. This was to ensure
that the quality of each obstacle was safe for participants and to verify and practice the
scoring system for each individual assessment before official testing began.
During the pilot study and testing, participants wore a four-inch wide gait belt
and were closely followed by a researcher. The primary researcher, who was present
during all testing, was certified in CPR and First Aid through the American Red Cross
and had an EMT basic license and had extensive experience working with older adults in
similar settings. The pilot testing was successful. Shortly after the pilot testing, IRB
approval was obtained and participant recruitment began.
Testing was only performed by participants who had obtained a medical consent
to participate, which had to be completed by the participant’s primary care physician.
The medical consent forms limited participants who may be at a substantial risk of
falling, or injury due the physical nature of the assessments. Participants were notified
that participation in the study was voluntary and they could withdraw at any time and for
any reason.
Following recruitment, an orientation was held for informational and organization
purposes. Several meetings were offered over several days to accommodate volunteer’s
schedules. These sessions began with a description of the study and what participants
could plan to expect. All relevant forms (e.g., informed consent and medical consent to
41
participate) were distributed at this time and anthropometric data (weight and height) was
recorded and the participant’s fall history was obtained (via self-report questionnaire).
Testing schedules were also chosen at this time. The purpose of the first meeting was to
provide all participants with the necessary information and documentation to ensure they
were fully informed of the inherent risks of the study and what type of activity and
commitment would be required.
Session One (First Day of Testing)
Two participants arrived at a time and began by performing the ABC. Participants
were not told the sequence of the assessments before they were performed and the order
in which the assessments were performed was randomized between participants. Each
assessment took approximately 10-15 minutes to complete. With the exception of the
ABC, one participant performed an assessment while the other rested in an outside
waiting area. The total time for testing was approximately 45 minutes per two
participants. A total of 63 participants completed this portion of the testing. The first 45
participants to complete the study were asked if they would like to return for a second
session, and of the 45, a total of 30 participants agreed to return.
Session Two
This session involved a single test on the MFOC. Participants (N = 30) performed
each test alone, and no other participants were allowed to be present. The approximate
time to complete this session was 15 minutes per participant.
42
Data Analysis
The information gathered from the second session MFOC testing was used to
determine test re-test reliability of the instrument. Pearson correlation was be used to
determine the correlation between all three assessments (ABC, TBT, & DGI) and the
MFOC. Cronbach’s Alpha was used to determine the internal consistency of the MFOC.
Exploratory factor analysis was also performed, using principal component
extraction. Kaiser’s criterion was used to determine significant component, and Varimax
rotation was used to determine factor loading. All analysis was performed with SPSS 19
(SPSS, Inc., Chicago IL).
Summary
This chapter explained the procedures that were used to recruit participants and
the procedures that were used to complete the study. In addition, the safety protocol was
discussed. Testing procedures were described along with how the data was to be
analyzed.
43
CHAPTER IV: RESULTS AND CONCLUSION
The purpose of this study was to determine the construct validity and reliability of
a Modified Functional Obstacle Course (MFOC). The MFOC was compared to three
assessments that are currently being used in the clinical setting to screen for fall risks in
older adults. The assessments are the Activity Specific Balance Confidence Scale
(ABC), Dynamic Gait Index (DGI), and the Tinetti Balance Test (TBT). This chapter
provides descriptive information and the results from the data analysis.
Descriptive Characteristics
Participants
A total of 63 participants completed the study and were recruited from seven
community sites in the Boise, ID area, including a local physician’s clinic, fitness
facilities, current fall risk prevention exercise programs and studies, and local community
centers. Table 4 provides the characteristics of the participants. The sample included 34
males and 29 females with a mean age of 73.30 (SD = 5.02) years. The mean age for
males was 73.71 (SD = 4.96) years and the mean age for females was 72.83 (SD = 5.2)
years. The mean BMI was 22.13 (SD = 1.88): specifically, 22.82 (SD = 2.03) and 22.13
(1.31 = SD) for males and females, respectively. A total of 15 participants reported, via a
self-report questionnaire, having had one or more falls within one year previous to
participating in the study. Independent t tests and Pearson Correlation indicated that
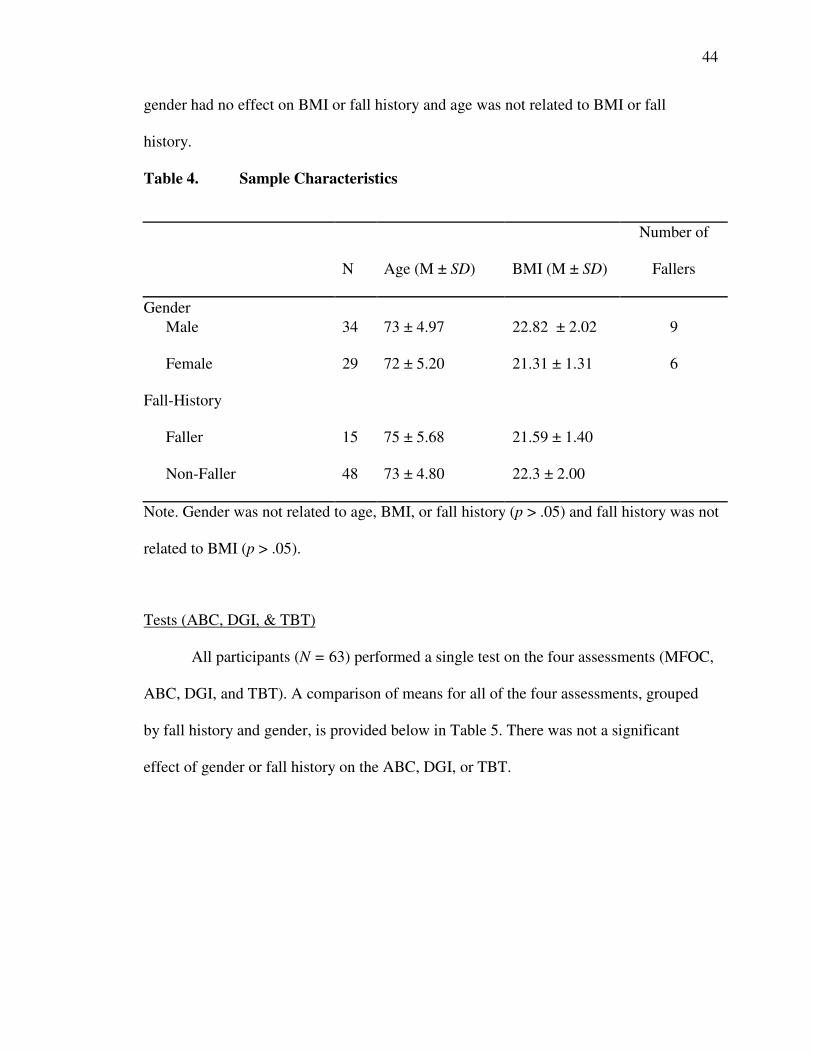
44
gender had no effect on BMI or fall history and age was not related to BMI or fall
history.
Table 4. Sample Characteristics
N Age (M ± SD) BMI (M ± SD)
Number of
Fallers
Gender
Male 34 73 ± 4.97 22.82 ± 2.02 9
Female 29 72 ± 5.20 21.31 ± 1.31 6
Fall-History
Faller 15 75 ± 5.68 21.59 ± 1.40
Non-Faller 48 73 ± 4.80 22.3 ± 2.00
Note. Gender was not related to age, BMI, or fall history (p > .05) and fall history was not
related to BMI (p > .05).
Tests (ABC, DGI, & TBT)
All participants (N = 63) performed a single test on the four assessments (MFOC,
ABC, DGI, and TBT). A comparison of means for all of the four assessments, grouped
by fall history and gender, is provided below in Table 5. There was not a significant
effect of gender or fall history on the ABC, DGI, or TBT.
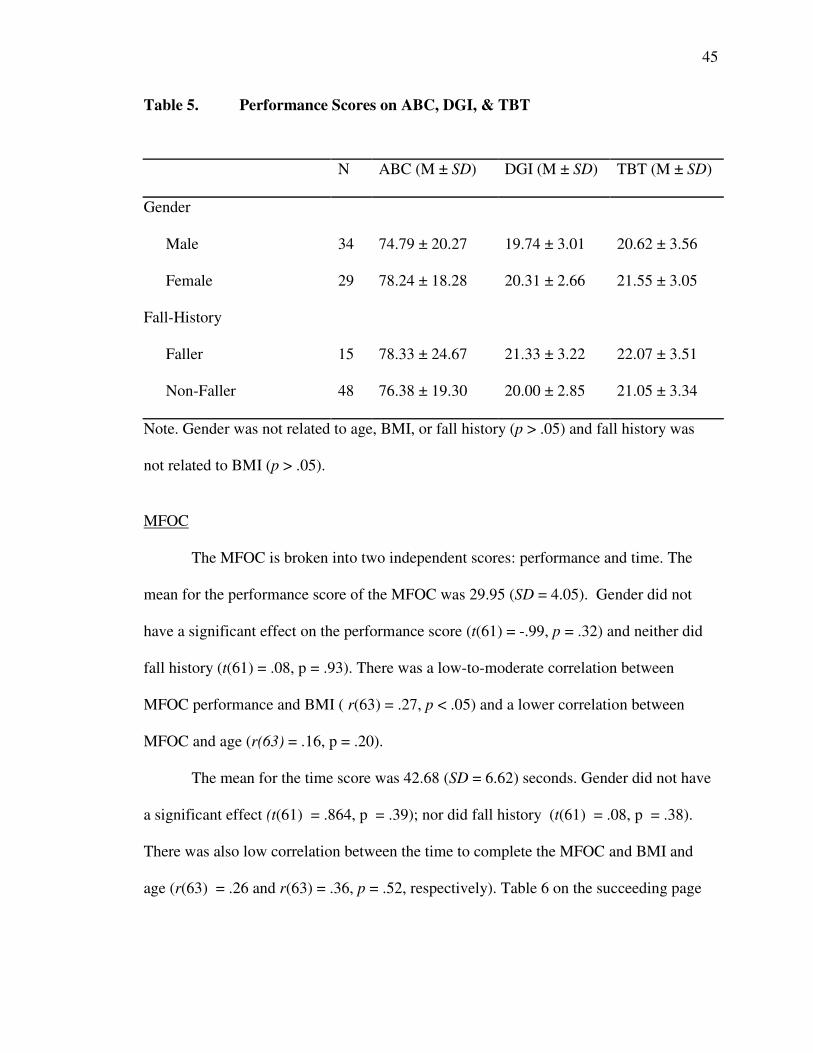
45
Table 5. Performance Scores on ABC, DGI, & TBT
N ABC (M ± SD) DGI (M ± SD) TBT (M ± SD)
Gender
Male 34 74.79 ± 20.27 19.74 ± 3.01 20.62 ± 3.56
Female 29 78.24 ± 18.28 20.31 ± 2.66 21.55 ± 3.05
Fall-History
Faller 15 78.33 ± 24.67 21.33 ± 3.22 22.07 ± 3.51
Non-Faller 48 76.38 ± 19.30 20.00 ± 2.85 21.05 ± 3.34
Note. Gender was not related to age, BMI, or fall history (p > .05) and fall history was
not related to BMI (p > .05).
MFOC
The MFOC is broken into two independent scores: performance and time. The
mean for the performance score of the MFOC was 29.95 (SD = 4.05). Gender did not
have a significant effect on the performance score (t(61) = -.99, p = .32) and neither did
fall history (t(61) = .08, p = .93). There was a low-to-moderate correlation between
MFOC performance and BMI ( r(63) = .27, p < .05) and a lower correlation between
MFOC and age (r(63) = .16, p = .20).
The mean for the time score was 42.68 (SD = 6.62) seconds. Gender did not have
a significant effect (t(61) = .864, p = .39); nor did fall history (t(61) = .08, p = .38).
There was also low correlation between the time to complete the MFOC and BMI and
age (r(63) = .26 and r(63) = .36, p = .52, respectively). Table 6 on the succeeding page

46
provides a comparison of the mean scores, factored by gender and fall history, for all
assessments.
Table 6. Means for the ABC, DGI, MFOC, and TBT (M ± SD)
Male Females Non-Faller Faller Total
ABC 75 ± 20.26 78.24 ± 18.2 78.33 ± 24.7 75.77 ± 17.57 76.40 ± 6.24
DGI 19.73 ± 3.00 20.31 ± 2.66 21.3 ± 3.22 19.58 ± 2.616 20.00 ± 2.85
MFOC
Performance 29.5 ± 4.24 30.5 ± 3.82 30.03 ± 1.5 29.92 ± 4.11 29.95 ± 4.05
MFOC Time 42.68 ± 6.62 41.31 ± 5.8 40.53 ± 5.1 42.52 ± 6.54 42.05 ± 6.24
TBT 20.62 ± 3.56 21.56 ± 3.05 22.06 ± 3.5 20.73 ± 3.26 21.05 ± 3.51
Hypotheses Testing
This study contained two separate hypotheses: (a) the MFOC will demonstrate
high construct validity, via high Pearson correlation to three currently validated
instruments, and (b) The MFOC will demonstrate high test re-test reliability and internal
consistency.
Construct Validity of the Modified Functional Obstacle Course
Construct validity was determined by calculating the Pearson Correlation (r)
between the MFOC scores (performance and time) and the ABC, DGI, and TBT. Results
are displayed in Table 7. Based on previous research, a correlation of r ≥ .80
demonstrates adequate validity (Lewis, 1993). The performance score of the MFOC
demonstrated a higher correlation to the other three assessments (ABC, DGI, and TBT)
than the time score. The performance value showed moderate to high correlations with
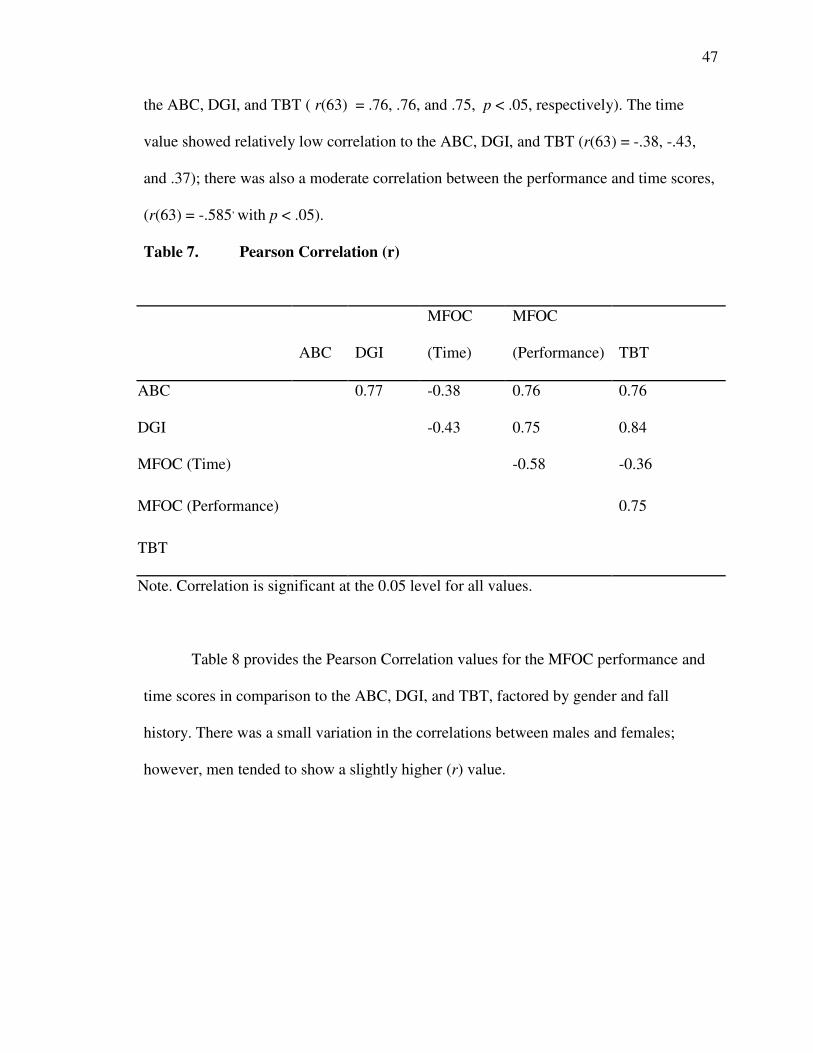
47
the ABC, DGI, and TBT ( r(63) = .76, .76, and .75, p < .05, respectively). The time
value showed relatively low correlation to the ABC, DGI, and TBT (r(63) = -.38, -.43,
and .37); there was also a moderate correlation between the performance and time scores,
(r(63) = -.585, with p < .05).
Table 7. Pearson Correlation (r)
ABC DGI
MFOC
(Time)
MFOC
(Performance) TBT
ABC 0.77 -0.38 0.76 0.76
DGI -0.43 0.75 0.84
MFOC (Time) -0.58 -0.36
MFOC (Performance) 0.75
TBT
Note. Correlation is significant at the 0.05 level for all values.
Table 8 provides the Pearson Correlation values for the MFOC performance and
time scores in comparison to the ABC, DGI, and TBT, factored by gender and fall
history. There was a small variation in the correlations between males and females;
however, men tended to show a slightly higher (r) value.
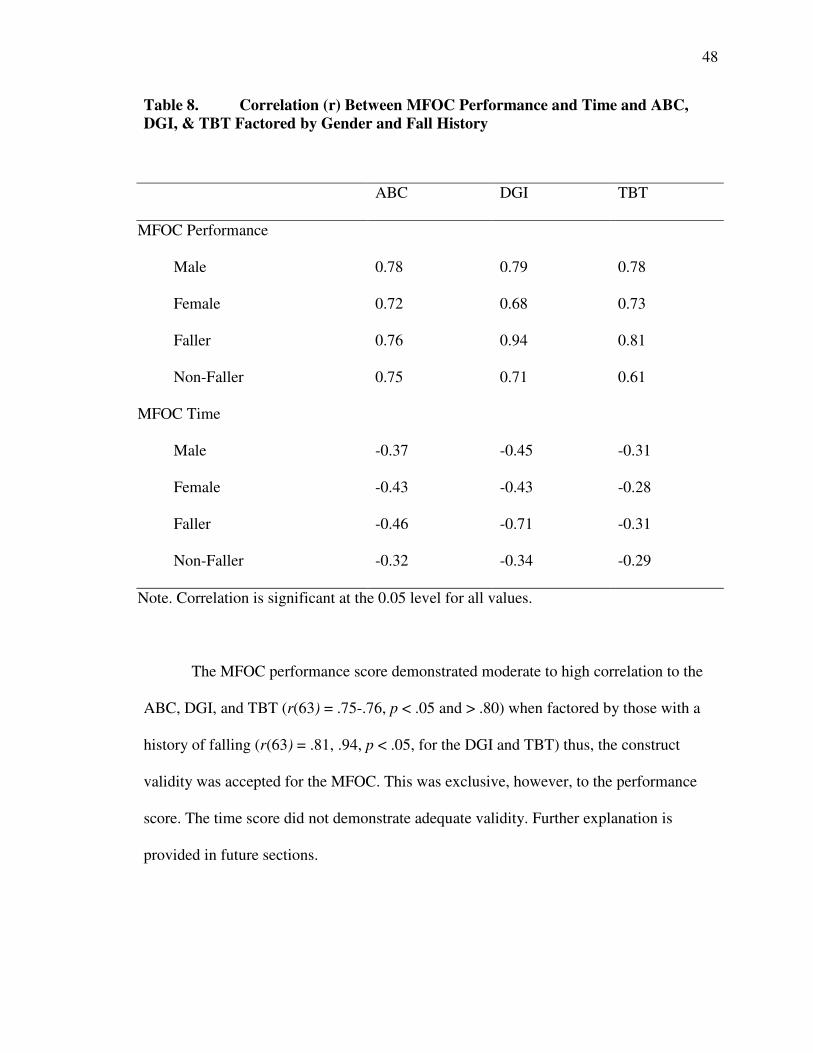
48
Table 8. Correlation (r) Between MFOC Performance and Time and ABC,
DGI, & TBT Factored by Gender and Fall History
The MFOC performance score demonstrated moderate to high correlation to the
ABC, DGI, and TBT (r(63) = .75-.76, p < .05 and > .80) when factored by those with a
history of falling (r(63) = .81, .94, p < .05, for the DGI and TBT) thus, the construct
validity was accepted for the MFOC. This was exclusive, however, to the performance
score. The time score did not demonstrate adequate validity. Further explanation is
provided in future sections.
ABC DGI TBT
MFOC Performance
Male 0.78 0.79 0.78
Female 0.72 0.68 0.73
Faller 0.76 0.94 0.81
Non-Faller 0.75 0.71 0.61
MFOC Time
Male -0.37 -0.45 -0.31
Female -0.43 -0.43 -0.28
Faller -0.46 -0.71 -0.31
Non-Faller -0.32 -0.34 -0.29
Note. Correlation is significant at the 0.05 level for all values.
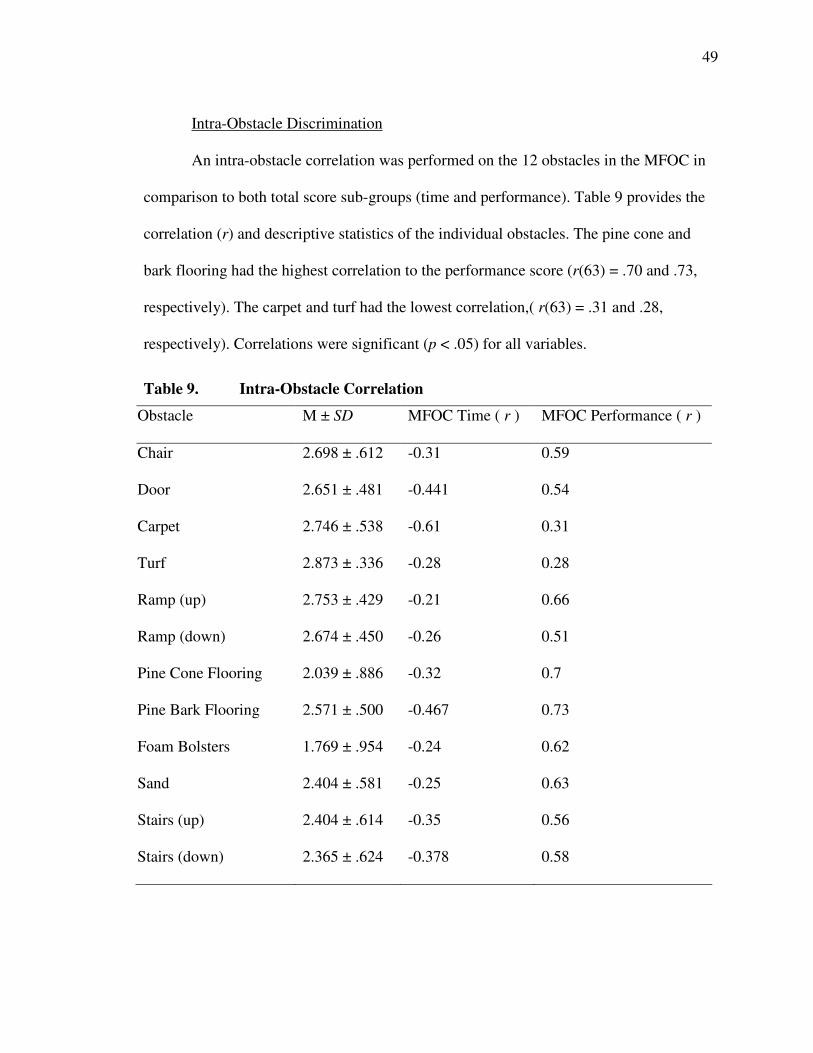
49
Intra-Obstacle Discrimination
An intra-obstacle correlation was performed on the 12 obstacles in the MFOC in
comparison to both total score sub-groups (time and performance). Table 9 provides the
correlation (r) and descriptive statistics of the individual obstacles. The pine cone and
bark flooring had the highest correlation to the performance score (r(63) = .70 and .73,
respectively). The carpet and turf had the lowest correlation,( r(63) = .31 and .28,
respectively). Correlations were significant (p < .05) for all variables.
Table 9. Intra-Obstacle Correlation
Obstacle M ± SD MFOC Time ( r ) MFOC Performance ( r )
Chair 2.698 ± .612 -0.31 0.59
Door 2.651 ± .481 -0.441 0.54
Carpet 2.746 ± .538 -0.61 0.31
Turf 2.873 ± .336 -0.28 0.28
Ramp (up) 2.753 ± .429 -0.21 0.66
Ramp (down) 2.674 ± .450 -0.26 0.51
Pine Cone Flooring 2.039 ± .886 -0.32 0.7
Pine Bark Flooring 2.571 ± .500 -0.467 0.73
Foam Bolsters 1.769 ± .954 -0.24 0.62
Sand 2.404 ± .581 -0.25 0.63
Stairs (up) 2.404 ± .614 -0.35 0.56
Stairs (down) 2.365 ± .624 -0.378 0.58
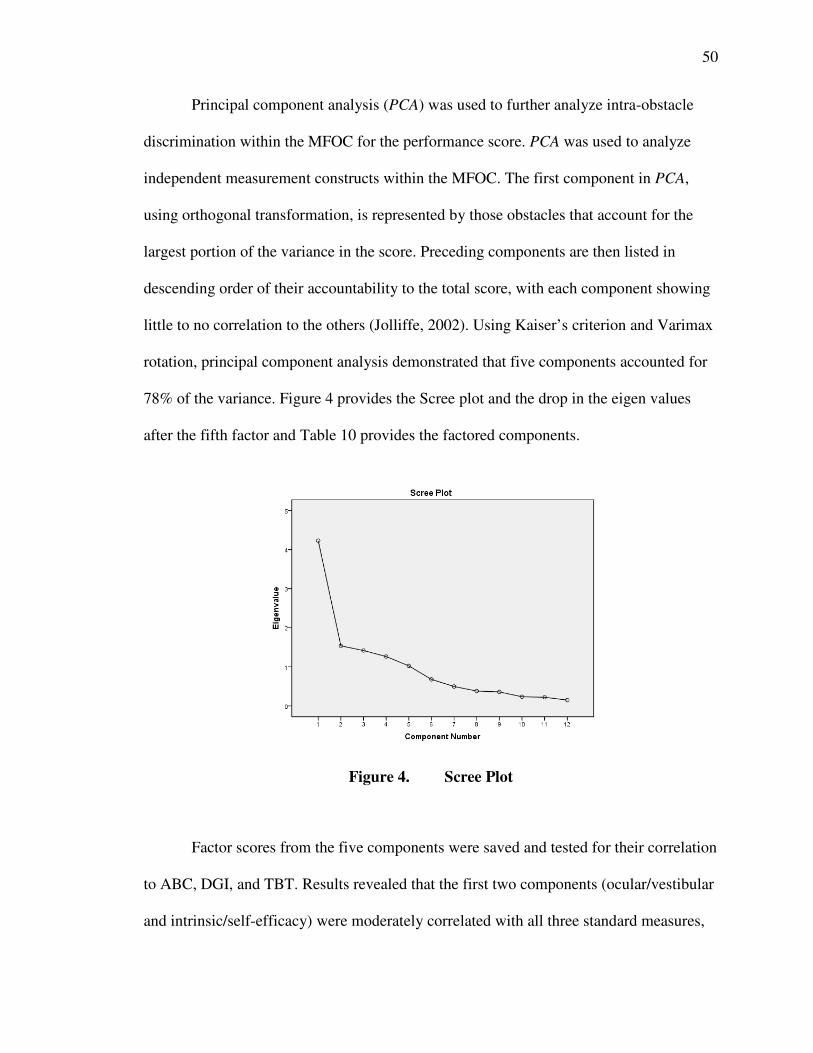
50
Principal component analysis (PCA) was used to further analyze intra-obstacle
discrimination within the MFOC for the performance score. PCA was used to analyze
independent measurement constructs within the MFOC. The first component in PCA,
using orthogonal transformation, is represented by those obstacles that account for the
largest portion of the variance in the score. Preceding components are then listed in
descending order of their accountability to the total score, with each component showing
little to no correlation to the others (Jolliffe, 2002). Using Kaiser’s criterion and Varimax
rotation, principal component analysis demonstrated that five components accounted for
78% of the variance. Figure 4 provides the Scree plot and the drop in the eigen values
after the fifth factor and Table 10 provides the factored components.
Figure 4. Scree Plot
Factor scores from the five components were saved and tested for their correlation
to ABC, DGI, and TBT. Results revealed that the first two components (ocular/vestibular
and intrinsic/self-efficacy) were moderately correlated with all three standard measures,
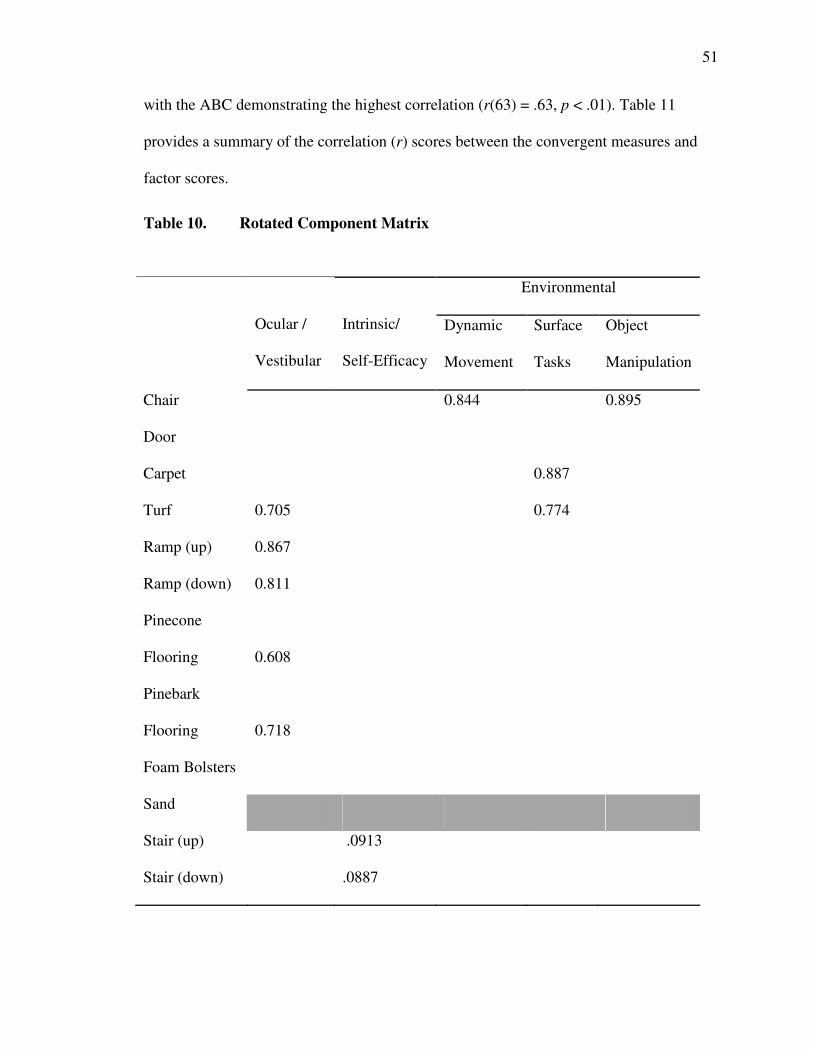
51
with the ABC demonstrating the highest correlation (r(63) = .63, p < .01). Table 11
provides a summary of the correlation (r) scores between the convergent measures and
factor scores.
Table 10. Rotated Component Matrix
Environmental
Ocular /
Vestibular
Intrinsic/
Self-Efficacy
Dynamic
Movement
Surface
Tasks
Object
Manipulation
Chair 0.844 0.895
Door
Carpet 0.887
Turf 0.705 0.774
Ramp (up) 0.867
Ramp (down) 0.811
Pinecone
Flooring 0.608
Pinebark
Flooring 0.718
Foam Bolsters
Sand
Stair (up) .0913
Stair (down) .0887
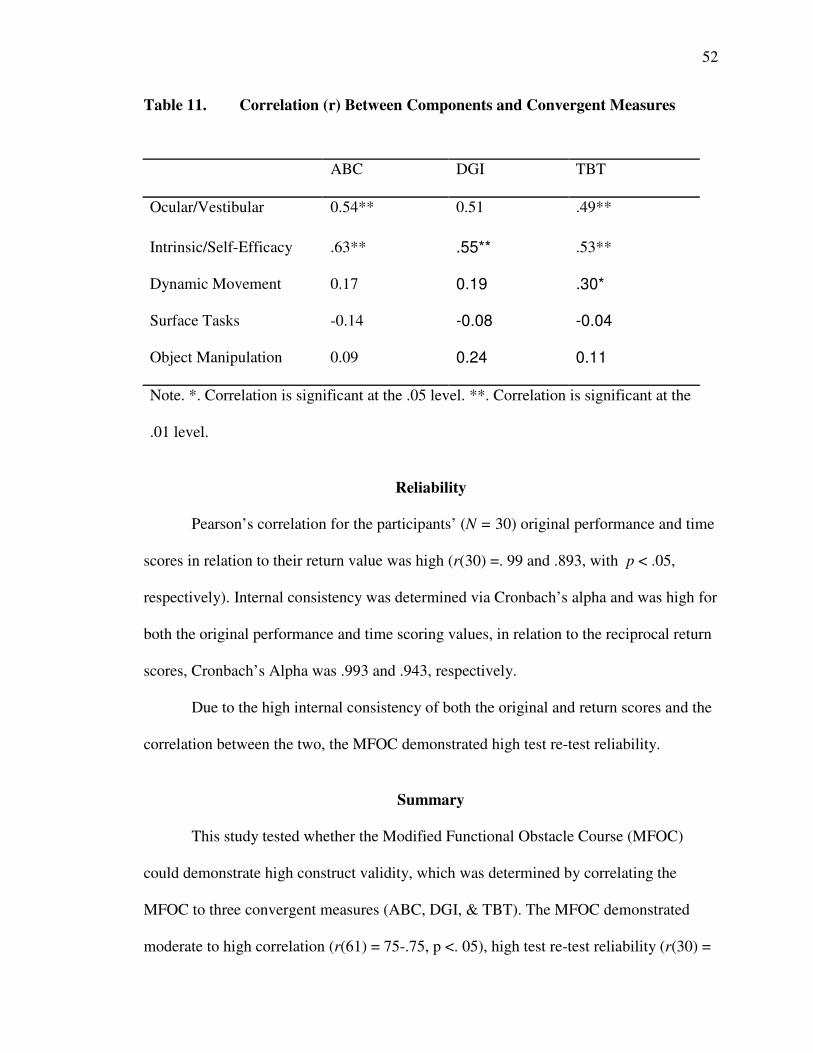
52
Table 11. Correlation (r) Between Components and Convergent Measures
ABC DGI TBT
Ocular/Vestibular 0.54** 0.51 .49**
Intrinsic/Self-Efficacy .63** .55** .53**
Dynamic Movement 0.17 0.19 .30*
Surface Tasks -0.14 -0.08 -0.04
Object Manipulation 0.09 0.24 0.11
Note. *. Correlation is significant at the .05 level. **. Correlation is significant at the
.01 level.
Reliability
Pearson’s correlation for the participants’ (N = 30) original performance and time
scores in relation to their return value was high (r(30) =. 99 and .893, with p < .05,
respectively). Internal consistency was determined via Cronbach’s alpha and was high for
both the original performance and time scoring values, in relation to the reciprocal return
scores, Cronbach’s Alpha was .993 and .943, respectively.
Due to the high internal consistency of both the original and return scores and the
correlation between the two, the MFOC demonstrated high test re-test reliability.
Summary
This study tested whether the Modified Functional Obstacle Course (MFOC)
could demonstrate high construct validity, which was determined by correlating the
MFOC to three convergent measures (ABC, DGI, & TBT). The MFOC demonstrated
moderate to high correlation (r(61) = 75-.75, p <. 05), high test re-test reliability (r(30) =
53
.99-99, p < .05), and internal consistency. Validity was further determined through
principal component analysis, which demonstrated five distinct components
(measurement constructs). Two of these components demonstrated moderate correlation
to the three convergent measures (ABC, DGI, & TBT), and three unique components.
54
CHAPTER V: DISCUSSION
The purpose of this study was to (a) examine the construct validity of the MFOC,
by determining the correlation of the MFOC to three currently validated instruments, (b)
examine the reliability and internal consistency, and (c) measure intra-obstacle
parameters within the MFOC. This chapter will discuss the major findings of the study
along with limitations and suggestions for future research.
Major Findings
The MFOC performance score demonstrated moderate to high correlation to the
convergent assessments: Activity Specific Balance Confidence Scale, Dynamic Gait
Index, and the Tinetti Balance Test (ABC, DGI, & TBT) used to determine the construct
validity (r =. 75 - .76, p < .05). The narrow range of Pearson values (r = .75 - .76)
indicates that the MFOC performance score is equally adept at examining the sum
components of the three assessments combined. This illustrates that inferences can be
made, with moderate to high confidence, that variation in the MFOC scores are
representative of each of the three assessments (ABC, DGI, & TBT). The time score,
however, showed only low correlation to the three convergent measures, as well as to the
performance score.
These findings are comparable to the research by Means and O’Sullivan (2000)
that showed moderate to high correlation between the original version of the functional
obstacle course (FOC) and the TBT. Means, et al., (1996) demonstrated a high
55
correlation of both performance and time scores to the TBT (r = .78, -.77, p <. 001,
respectively). The current study however, contradicts the research by Means, et al.,
(1996) where the time score was positively correlated to the performance score on the
original and modified version of the obstacle course and performance scores on the TBT.
Their research also showed a significant difference in the time to complete the obstacle
course between fallers and non-fallers (1998). The discrepancy between the current study
and those previous two is in the length of the time to complete the course. Due to the
larger size of the original obstacle course, the average time to completion was three
minutes (Means, et al., 1998). The average time to completion for the MFOC was under
one minute. This creates a lower range in possible scores for the MFOC, reducing its
ability to discern between fallers and non-fallers. Table 12 provides a summary of the
validity of the MFOC in comparison to previous studies by Means et al.
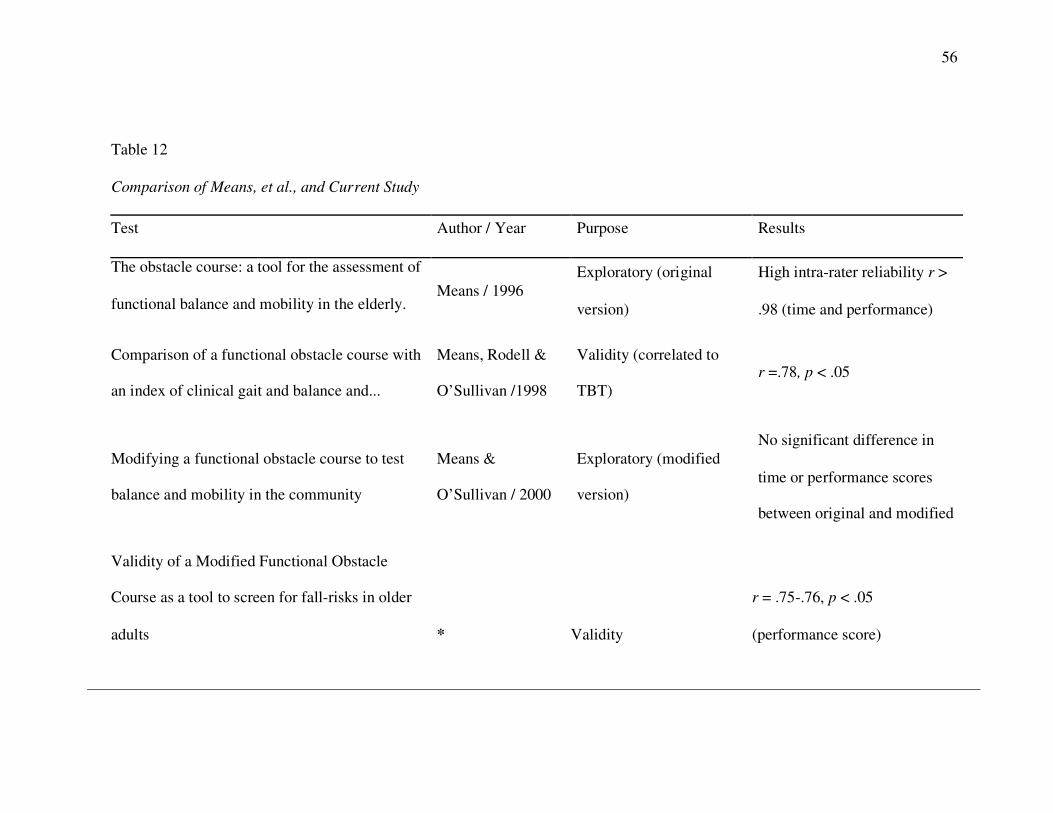
56
Table 12
Comparison of Means, et al., and Current Study
Test Author / Year Purpose Results
The obstacle course: a tool for the assessment of
functional balance and mobility in the elderly. Means / 1996
Exploratory (original
version)
High intra-rater reliability r >
.98 (time and performance)
Comparison of a functional obstacle course with
an index of clinical gait and balance and...
Means, Rodell &
O’Sullivan /1998
Validity (correlated to
TBT) r =.78, p < .05
Modifying a functional obstacle course to test
balance and mobility in the community
Means &
O’Sullivan / 2000
Exploratory (modified
version)
No significant difference in
time or performance scores
between original and modified
Validity of a Modified Functional Obstacle
Course as a tool to screen for fall-risks in older
adults * Validity
r = .75-.76, p < .05
(performance score)
57
Table 12. Comparison of Means et al., and Current Study
58
Another significant finding of this study was the high correlation between
the MFOC performance and time scores between the original round of testing and
the return score, used to determine the test re-test reliability. The test re-test
reliability measurements for the performance and time scores (r = .99 & .98) were
concurrently verified by the internal consistency, which was also high. This
indicates the internal reliability from the MFOC will likely remain consistent
through multiple trials. Table 13 provides a summary of the MFOC validity and
reliability results in comparison to the three convergent measures.
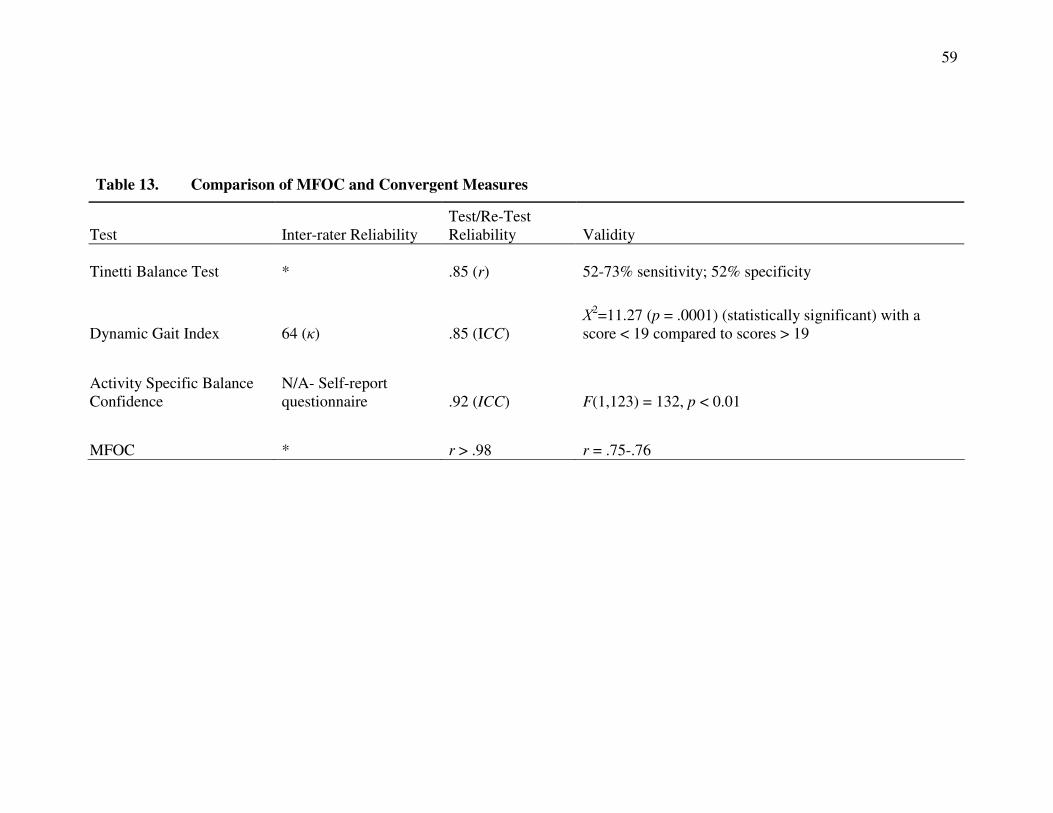
59
Table 13. Comparison of MFOC and Convergent Measures
Test Inter-rater Reliability Test/Re-Test Reliability Validity
Tinetti Balance Test * .85 (r) 52-73% sensitivity; 52% specificity
Dynamic Gait Index 64 (κ) .85 (ICC) Χ
2=11.27 (p = .0001) (statistically significant) with a score < 19 compared to scores > 19
Activity Specific Balance Confidence
N/A- Self-report questionnaire .92 (ICC) F(1,123) = 132, p < 0.01
MFOC * r > .98 r = .75-.76
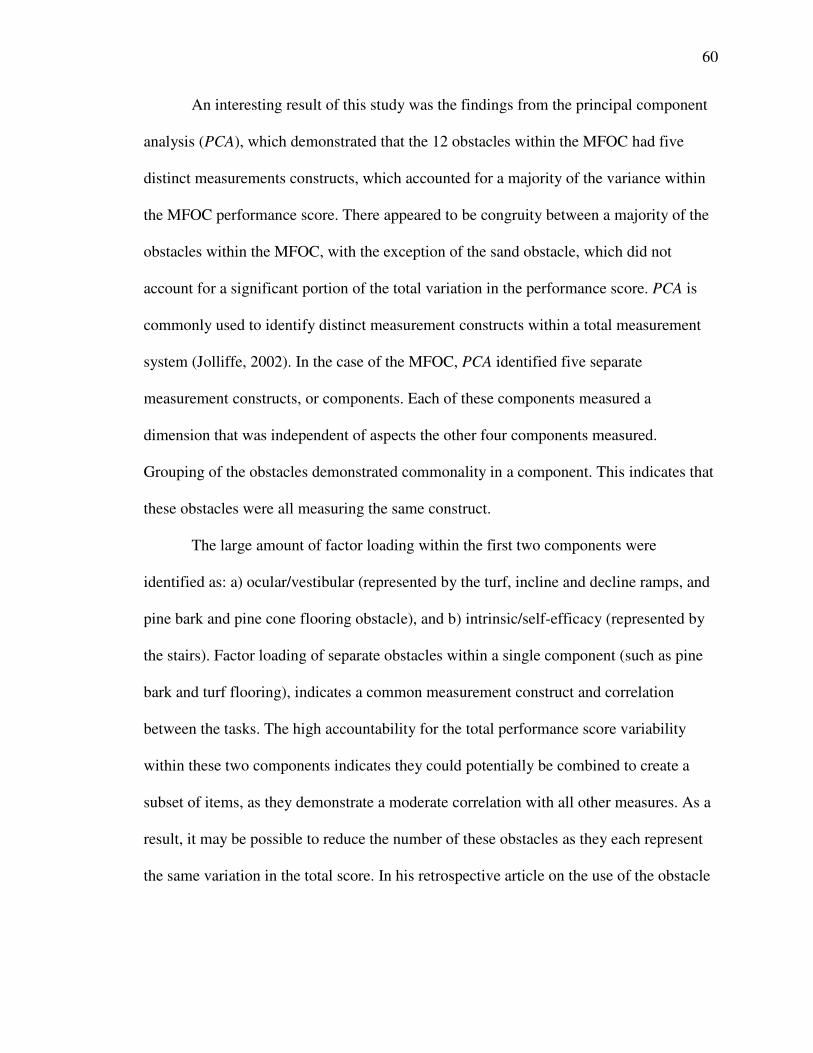
60
An interesting result of this study was the findings from the principal component
analysis (PCA), which demonstrated that the 12 obstacles within the MFOC had five
distinct measurements constructs, which accounted for a majority of the variance within
the MFOC performance score. There appeared to be congruity between a majority of the
obstacles within the MFOC, with the exception of the sand obstacle, which did not
account for a significant portion of the total variation in the performance score. PCA is
commonly used to identify distinct measurement constructs within a total measurement
system (Jolliffe, 2002). In the case of the MFOC, PCA identified five separate
measurement constructs, or components. Each of these components measured a
dimension that was independent of aspects the other four components measured.
Grouping of the obstacles demonstrated commonality in a component. This indicates that
these obstacles were all measuring the same construct.
The large amount of factor loading within the first two components were
identified as: a) ocular/vestibular (represented by the turf, incline and decline ramps, and
pine bark and pine cone flooring obstacle), and b) intrinsic/self-efficacy (represented by
the stairs). Factor loading of separate obstacles within a single component (such as pine
bark and turf flooring), indicates a common measurement construct and correlation
between the tasks. The high accountability for the total performance score variability
within these two components indicates they could potentially be combined to create a
subset of items, as they demonstrate a moderate correlation with all other measures. As a
result, it may be possible to reduce the number of these obstacles as they each represent
the same variation in the total score. In his retrospective article on the use of the obstacle
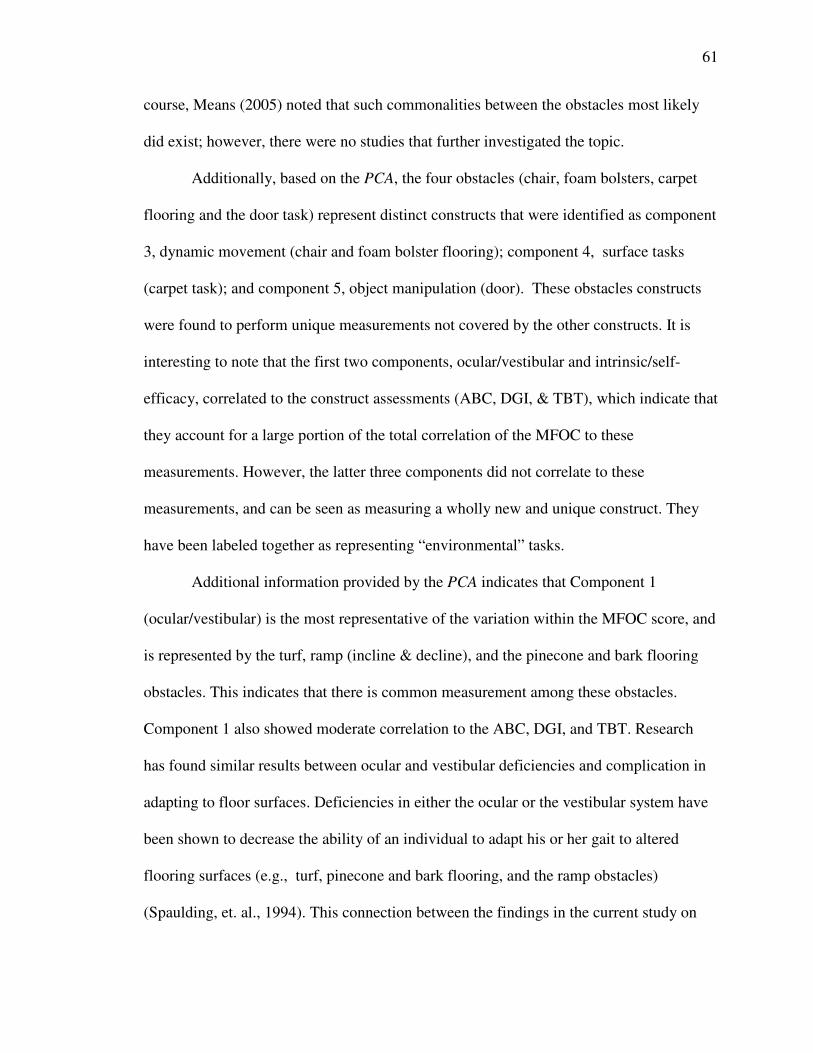
61
course, Means (2005) noted that such commonalities between the obstacles most likely
did exist; however, there were no studies that further investigated the topic.
Additionally, based on the PCA, the four obstacles (chair, foam bolsters, carpet
flooring and the door task) represent distinct constructs that were identified as component
3, dynamic movement (chair and foam bolster flooring); component 4, surface tasks
(carpet task); and component 5, object manipulation (door). These obstacles constructs
were found to perform unique measurements not covered by the other constructs. It is
interesting to note that the first two components, ocular/vestibular and intrinsic/self-
efficacy, correlated to the construct assessments (ABC, DGI, & TBT), which indicate that
they account for a large portion of the total correlation of the MFOC to these
measurements. However, the latter three components did not correlate to these
measurements, and can be seen as measuring a wholly new and unique construct. They
have been labeled together as representing “environmental” tasks.
Additional information provided by the PCA indicates that Component 1
(ocular/vestibular) is the most representative of the variation within the MFOC score, and
is represented by the turf, ramp (incline & decline), and the pinecone and bark flooring
obstacles. This indicates that there is common measurement among these obstacles.
Component 1 also showed moderate correlation to the ABC, DGI, and TBT. Research
has found similar results between ocular and vestibular deficiencies and complication in
adapting to floor surfaces. Deficiencies in either the ocular or the vestibular system have
been shown to decrease the ability of an individual to adapt his or her gait to altered
flooring surfaces (e.g., turf, pinecone and bark flooring, and the ramp obstacles)
(Spaulding, et. al., 1994). This connection between the findings in the current study on
62
floor surfaces and ocular/vestibular deficiencies and previous research demonstrates a
strong measurement construct, represented by the turf, ramps, and pinecone and bark
flooring.
Component 2, intrinsic/self-efficacy, demonstrated a higher degree of correlation
to the ABC, while maintaining a similar correlation to the DGI and TBT. This indicates
Component 2 is similar in its measurement construct to Component 1, but with an added
measurement of self-efficacy. As referenced in earlier sections, self-efficacy (specifically
measured via the ABC scale) has been shown to be strong predictor of falls in older
adults (ICC = .92) (Cattaneo, Jonsdottir, & Repetti, 2006). Self-efficacy represents a
unique, although conclusive, connection to falls that has only been measured via self-
report questionnaires (Simpson, et al., 2009). This provides evidence that the MFOC is
able to mold several measurement constructs together that would have required the use of
multiple and separate assessments to measure otherwise. In addition to this distinct
ability, this study indicates that the MFOC is able to measure new constructs that are not
represented by the ABC, DGI, and TBT.
The environmental components (Component 3-5) made up of the chair, door,
foam bolsters, and carpet obstacles represent the unique portion of the MFOC. The
MFOC has already shown to correlate to the three convergent measures (ABC, DGI, &
TBT), and the first two components account for this correlation. The latter three
components represent a new and unique measurement construct. This indicates the
MFOC is apt at measuring the same components represented by the ABC, DGI, and TBT,
but it also measures new mechanisms that were not represented in the previous
assessments.
63
Component 3, the first of the environmental components, titled dynamic
movement, is represented by the chair and the foam bolsters obstacles. The foam bolster
obstacle provided the participant with a novel and complex task that requires substantial
gait and other mechanical alterations. Previous assessments, such as the DGI and TBT,
used standardized gaits for all participants. However, in the obstacles such as the foam
bolster, the participant is forced to choose the best gait adaptation via a new motor
program to complete the obstacle. This method may be more representative of simulating
tasks and challenges that an older adult would find via daily activities that may result in a
fall.
Component 4 is constructed, solely, from the carpet task. The carpet task requires
ankle moment stabilization as well as limited postural sway that can be brought on, or
exacerbated, by the uneven surface of the carpet; this requires extensive proprioceptive
function, in conjunction with other mechanisms (Manchester, Woolacott, Zederbauer-
Hylton, & Marin, 1989) and has been aptly named “surface tasks.” The door obstacle,
Component 5, showed significant loading in the PCA. In this task, the participant was
required to stabilize the upper body and reduce postural sway, while opening the door. It
also required the participant to hold the door while walking through. The door obstacle,
therefore, requires the most complex gross movement and muscular competency and
represents “object manipulation.” All of the tasks represented in these three components
require skills necessary to successfully navigate through complex environmental
situations. For this reason, they measure the participant’s ability to navigate through a
simulation of general and everyday tasks. As indicated in previous sections, falls happen
in an open and dynamic environment. For this reason, the tasks represented in these three
64
components provide a more detailed measurement of a person’s risk of falling, as they
account for these dynamic environmental hazards. This is important as previous research
has shown environmental obstacles play a large part in falls (Hitcho, et al., 2004).
Previous assessments (ABC, DGI, & TBT) have operated under the paradigm of
removing the environmental component in hopes of isolating specific mechanisms that
can be measured in a standardized form. Unfortunately, this modus operandi has limited
the interrelationship of the fall-related mechanisms that can be viewed as the actual cause
of falls.
Outside of the central findings related to the original hypotheses, the results
provided information on the performance of each assessment (ABC, DGI, MFOC, &
TBT, factored by participant characteristics. There was not a significant difference
between males/females and fallers/non-fallers for the scores on the MFOC, and the three
validation assessments (ABC, DGI, & TBT). Age was also correlated to the time but not
the performance score on the MFOC. Research has closely shown a correlation between
fall risk and age and it would be expected that a stronger correlation would be found in
both scores (time and performance) if a wider range of ages for participants were used for
the study (Stevens, 2008). It is important to note that the relatively low BMI (M = 22.13)
for the sample may have resulted in less variation in the time score than would be found
in larger or more diverse population.
Unique Contributions of the Study
The complex nature leading to falls has led to the origination of several different
fall risk screening and diagnostic assessments (Heinze, et al., 2009). However, these
assessments often look at single or limited factors, whereas the causes of falls are not
65
typically characterized in such a limited scope. Common assessments (e.g. the ABC,
DGI, & TBT) have attempted to quantify deficiencies in a limited amount of the
previously mentioned mechanisms, and use their measurements as methods for predicting
falls (Oliver, et al., 2004). However, these types of assessments lack the pivotal
environmental aspect that may be a more effective way of identifying older adults who
are at risk of falling (Simpson, et al., 2009). This is important because several studies
have shown that obstacle courses that include the environmental component have
significant potential as a fall risk-screening tool (Means, 2005).
The current study differed from previous research by Means et al., (1996, 1998,
2000) in two substantive components: 1) the MFOC was validated against three distinct
fall risk assessments, and 2) intra-obstacle discrimination of the MFOC was examined.
Previous research on the use of a functional obstacle course, mainly by Means et al., has
been extensive. However, the validation study for the original design was correlated to
the TBT, exclusively (Means, et al., 1998). By examining the construct validity of the
MFOC via correlation to a variety of distinct assessments, a better-rounded view of the
obstacle course’s ability and scope was provided.
The wider variety of assessments used for this study also permitted a more precise
view of the separate components being tested within MFOC’s measurement constructs
into separate and distinct components, which could be correlated to the convergent
measures (ABC, DGI & TBT). The obstacle course, in both its original and modified
version, has been noted as being lengthy (in time-to-completion) and large in size
(Means, 2005). Subsequently, it lacked clinical applicability, despite its performance as a
fall risk screening instrument. The current study began the process of thoroughly
66
reviewing the need for each obstacle by finding redundant measures. This allows future
researcher and practitioners to truncate the course, thereby decreasing it in size, cost, and
time to completion.
Limitations
The major limitation of the study pertains to the use of the commonly used
assessments as a method to determine validity, as opposed to using a follow-up study to
examine the frequency of falls within the sample. A larger sample would also have
presented a higher frequency of fallers as a method of comparison and validation by
using a retrospective approach. This study had a relatively small sample size (N = 63) for
a validity study. A follow-up study at set time interval, to ascertain up-to-date fall
histories would have been the ideal method.
Secondly, the cohort was not a true representation of the intended demographic,
as they lacked general diversity in socioeconomic status, ethnicity, and exercise history.
It should be noted, however, that this information was obtained anecdotally. A majority
of the participants were recruited from recurring fall-prevention and exercise classes,
although a relatively large portion of the sample (24%) had indicated having had a
previous fall. Many of the participants who reported have fallen within the last six
months were enrolled in the interventions. For this reason, their performance may not
have been truly characteristic of others who have a history of falls. The previous exercise
history of the participants may be responsible for the low mean BMI (22.13), which was
much lower than expected and indicates that the sample may have a higher physical
fitness level than the national norm.
67
In relation to the data analysis, it is important to notethat Kaiser’s criterion (used
during the PCA) has been shown to overestimate eigen values and it is possible that fewer
than five components could be used for analysis (Lance, Butts, & Michels, 2006). Under
another interpretation of the results, as few as three components could be used, as
opposed to five.
A further limitation was in the range in intra-participant effort and motivation.
Participants were not informed of the precise scoring system of any of the assessments,
for both the safety of the participant and for the integrity of the study. As a result, many
participants may have believed time was the primary mode of scoring and they
subsequently hurried through the assessments, resulting in lower performance scores.
Suggestions for Future Research
There is a discrepancy in the ability of the MFOC’s time score to show a
difference in fallers and non-fallers, between the current and previous studies. Future
research should determine the measurement parameters necessary to successfully utilize
the time score. For example, is timing each individual obstacle more predictive of fall
risk over a simple time-to-completion?
While this study began the process of reviewing the principal components of the
MFOC, future research needs to be conducted to take this process further, including a
more detailed and conclusive outline of the exact measurement constructs of the MFOC
components analyzed in this study via principal component analysis. PCA is an
exploratory process and does not represent conclusive evidence. Future research should
work to further detail the measurement constructs of the MFOC. This will help to
68
increase the clinical applicability of the MFOC, as it will provide more information to the
researcher/practitioner using the assessment, regarding the “take-home message.”
Further research on the measurement construct of the MFOC should examine,
specifically the nature of the environmental components. There is currently no research
that indicates whether the obstacles (chair, foam bolster, door, and the carpet task)
represent environmental obstacles better than the other eight in the MFOC. PCA
indicated that they represent unique constructs, and future studies should focus on the
exploration of the nature of these constructs.
A better understanding of the mechanisms being measured will provide a more
detailed view of the fall risk pathology. The concept of the MFOC was to provide a
screening assessment for fall risks that measures the sum impact of a variety of fall-
related mechanisms. Future research, now, can look at whether the MFOC can
discriminate between these mechanisms. In this way, the assessment will provide both a
broad (holistic) measurement, as well as provide a practitioner with a more detailed
outline of an individual/participant’s fall-related pathologies.
Conclusion
This chapter covered the major findings of the study, which included the construct
validity of the MFOC (r(63) = .75-.76, p < .05) and a discussion of the findings from the
principal component analysis (PCA). PCA showed several distinct measurement
constructs, including several that are not represented in the ABC, DGI, and TBT.
In conclusion, with a moderate to high construct validity and high test re-test
reliability (r(30) = .99, p < .05) and internal consistency, the MFOC is a valid instrument
69
to screen for fall risks in older adults, and is represented by distinct measurement
constructs.
70
REFERENCES
Arnadottir, S., Lundin-Olsson, L., Gunnarsdottir, E., & Fisher, A (2010). Application of Rasch analysis to examine psychometric aspects of the activities-specific balance confidence scale when used in a new cultural context. Archives of Physical
Medicine and Rehabilitation, 91(1), 156-163
Bandura, A (1986). Social foundations of thought and action: A social cognitive theory. Englewood Cliffs, N.J: Prentice-Hall.
Brault, M (2008). Prevalance and most common causes of disability among adults—United States, 2005. Centers for Disease Control and Prevention, 12(1)
Carmines, E. G., & Zeller, R. A. (1979). Reliability and validity assessment. Beverly Hills, CA: Sage Publications.
Cattaneo, D., Jonsdottir, J., & Repetti, S. (2007). Reliability of four scales on balance disorders in persons with multiple sclerosis. Disability & Rehabilitation, 29(24),
Center for Disease Control and Prevention and The Merck Foundation (2007) The state
of aging and health in America in 2007. Whitehouse Station, NJ: The Merck Foundation
Chiu, Yi-Po (2006). Research reports - use of item response analysis to investigate measurement properties and clinical validity of data for the dynamic gait index. Physical Therapy, 86 (6)
Cohen, J (2010). Life expectancy is the death-weighted average of the reciprocal of the survival-specific force of mortality. Demographic Research, 22(5),
Englander, F, Hodson, T, & Terregrossa, R (1996). Economic dimensions of slip and fall injuries. Journal of Forensic Sciences, 41.
Gates, S., Smith, L., Fisher, J., & Lamb, S (2008). Systematic review of accuracy of screening instruments for predicting fall risk among independently living older adults. Journal of Rehabilitation Research & Development, 45(8), 1105-1116.
Gill, T, Williams, C, Robinson, J, & Tinetti, M (1999). A Population-based study of environmental hazards in the homes of older persons. American Journal of Public
Health, 89(4), 550-554.
71
Granacher, U., Zahner, L., & Gollhofer, A (2008). Strength, power, and postural control in seniors: considerations for functional adaptations and for fall prevention. European Journal of Sport Science, 8(6), 325-340.
Guincestre, J. Y., & Sesboue, B (2006). Muscular fatigue. Annales De Readaptation Et
De Medecine Physique (49)6, 348-354
Hatch, J., Gill-Body, K., & Portney, L (2003). Determinants of balance confidence in community-dwelling elderly people. Physical Therapy, 83(12), 1072-1079.
Hayes, K. C., Wolfe, D. L., Trujillo, S. A., & BurkelL, J. A. (2010). On the interaction of disability and aging: Accelerated degradation models and their influence on projections of future care needs and costs for personal injury litigation. Disability
& Rehabilitation, 32(1)
Heinze, C., Dassen, T., Halfens, R., & Lohrmann, C (2009). Screening the risk of falls: a general or a specific instrument?. Journal of Clinical Nursing, 18(3), 350-356.
Highstein, S., Fay, R., & Popper, A (2004). The vestibular system. New York: Springer Verlag.
Hitcho, E., et al (2004). Characteristics and circumstances of falls in a hospital setting, Journal of General Internal Medicine, 19(7), 732-739.
Huan, C (2010). Falls and older adults. Journal of the American Medical Association, 303(3)
Jolliffe, I. T. (2002). Principal component analysis. New York: Springer.
Ka-Chun, S., Catena, R., Li-Chan, C., van Donkelaar, P., & Woollacott, M (2008). Effects of a secondary task on obstacle avoidance in healthy young adults. Experimental Brain Research, 184(1), 115-120.
Lajoie, Y., & Gallagher, S (2004). Predicting falls within the elderly community: comparison of postural sway, reaction time, the Berg balance scale and the Activities-specific Balance Confidence (ABC) scale for comparing fallers and non-fallers. Archives of Gerontology & Geriatrics, 38(1)
Lance, CE, Butts, and Michels (2006). The sources of four commonly reported cutoff criteria: What did they really say? Organizational Research Methods 9(2): 202-220
Lewell, et al., (2006). Aging, complexity and motor performance: Healthy and disease states. In J. E. Birren & K. W. Schaie (Eds.), Handbook of The Psychology Of
Aging: 163–182.
Lewis C., (1993) Balance gait test proves simple yet useful Physical Therapy Bulletin, 2(10)
72
Lexell J, Taylor CC, Sjostrom M (1998). What is the cause of the aging atrophy? Total number, size and proportion of different fiber types studied in whole vastus lateralis muscle from 15- to 83-year-old men. Journal of Neurological Science, 84(3): 275 – 294
Manchester, D., Woollacott, M., Zederbauer-Hylton, N., & Marin, O. (January 01, 1989). Visual, vestibular and somatosensory contributions to balance control in the older adult. Journal of Gerontology, 44(4), 118-27
Means K., Rodell D., O'Sullivan P (1996). Use of an obstacle course to assess balance
and mobility in the elderly: A validation study. American Journal of Physical
Medicine Rehabilitation, 75, 88-95.
Means K., Rodell D., O'Sullivan P. (1998) Comparison of a functional obstacle course with an index of clinical gait and balance and postural sway. Journal of
Gerontology and Biological Science, 53
Means, K.,. (2005) A Functional obstacle course. Journal of Rehabilitation Research &
Development, 12(3)
Means, K., & O'Sullivan, P (2000). Modifying a functional obstacle course to test balance and mobility in the community. Journal of Rehabilitation Research &
Development, 37(5), 621.
Myers, A., Fletcher, P., Myers, AH., & Sherk, W (1998). Discriminative and evaluative properties of the activities-specific balance confidence scale. Journal of
Gerentology, 287-894.
Oliver, D, Daly, F, Martin, FC, & McMurdo, ME (2004). Risk factors and risk assessment tools for falls in hospital in-patients: a systematic review. Age and
Ageing, 33(2)
Pang, M., & Eng, J (2008). Fall-related self-efficacy, not balance and mobility performance, is related to accidental falls in chronic stroke survivors with low bone mineral density. Osteoporosis International, 19(7), 919-927
Pfisterer, et al., K (2003). Cognitive impairment decreases postural control during dual tasks in geriatric patients with a history of severe falls. Journal of the American
Geriatrics Society, (51)11, 1638-44.
Powell, L, Myers, A (1995). The Activities-Specific Balance Confidence Scale. Journal
of Gerontology, 50
Raiche, M, Hebert, R, & Price, F (2000). Screening older adults at risk of falling with the Tinetti Balance Test. The Lancet
Shimada, H. and Uchiyama (2003). Specific effects of balance and gait exercises on the frail elderly. Clinical Rehabilitation, 17, 472-79.
73
Shumway-Cook A. and Woollacott M (1995), Motor Control Theory and Applications,
Baltimore: Lippincott, Williams & Wilkins.
Shumway-Cook, A, Gruber, W, Baldwin, M, & Polissar, NL (1997). Predicting the probability of falls in community-dwelling adults. Physical Therapy, 77
Simpson, J., Worsfold, C., Fisher, K., & Valentine, J (2009). The CONFbal scale: a measure of balance confidence--a key outcome of rehabilitation. Physiotherapy, 95(2), 103-109
Sosnoff, J., & Voudrie, S (2009). Practice and age-related loss of adaptability in sensorimotor performance. Journal of Motor Behavior, 41(2), 137-146
Spaulding, S. J., Patla, A. E., Elliott, D. B., Flanagan, J., Rietdyk, S., & Brown, S. Waterloo (1994) Vision and mobility study: gait adaptations to altered surfaces in individuals with age-related maculopathy. Optometry and Vision Science, 7(12), 770-7.
Steadman, J., Nora D. and Kalra, L (2006). A randomized controlled trial of an enhanced balance training program to improve mobility and reduce falls in elderly patients. Journal of the American Geriatrics Society. 51(6)
Stevens, J (2008). A CDC compendium of effective community-based interventions. National Center for Injury Prevention and Control, 1(97)
Stevens, J, Corso, P, Finkelstein, E, & Miller, T (2006). The costs of fatal and non-fatal falls among older adults. Injury Prevention, 12, 250-255.
Tinetti ME.(1986) Performance-oriented assessment of mobility problems in elderly patients. Journal of American Geriatric Society, (34), 119-126.
Vaina, L, Beardsley, S, & Rushton, S (2009). Optic flow and beyond. New York: Springer Netherlands.
Vander, L. D. W., Brunt, D., & McCulloch, M. U. (1994). Variant and invariant characteristics of the sit-to-stand task in healthy elderly adults. Archives of
Physical Medicine and Rehabilitation, 75, 6, 653-60
Verghese J, Lipton RB, Hall CB, Kuslansky G, Katz MJ, & Buschke H (2002). Abnormality of gait as a predictor of non-Alzheimer's dementia. The New
England Journal of Medicine. 34(22), 1761-8.
Whitney, S., Hudak, M., & Marchetti, G. (2000). The Dynamic Gait Index relates to self-reported fall history in individuals with vestibular dysfunction. Journal of
Vestibular Research: Equilibrium & Orientation, 10(2), 99.
Whitney, S., Marchetti, G., Schade, A., & Wrisley, D (2004). The sensitivity and specificity of the timed "Up & Go" and the dynamic gait index for self-reported
74
falls in persons with vestibular disorders. Journal of Vestibular Research:
Equilibrium & Orientation, 14(5), 397-409.
Young, P., Tolbert, D (2007). Basic clinical neuroanatomy. Boston: Lippincott Williams & Wilkins.
75
APPENDIX A
Modified Functional Obstacle Course Scoring
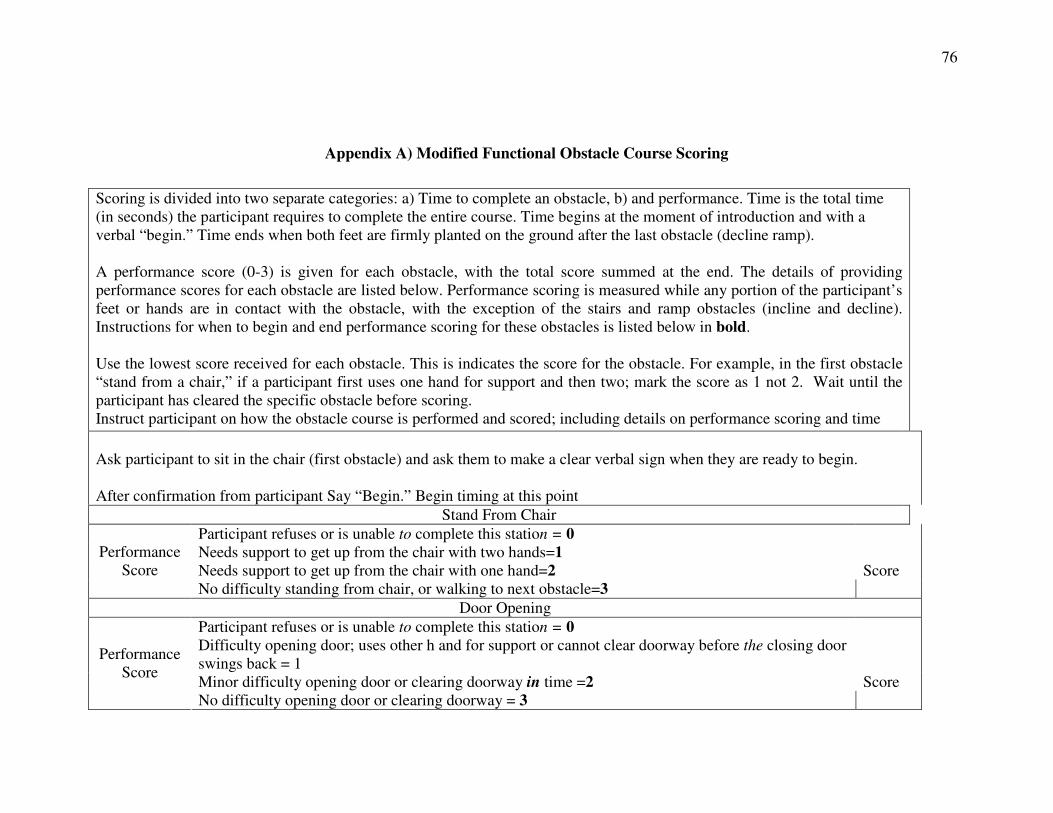
76
Appendix A) Modified Functional Obstacle Course Scoring
Scoring is divided into two separate categories: a) Time to complete an obstacle, b) and performance. Time is the total time (in seconds) the participant requires to complete the entire course. Time begins at the moment of introduction and with a verbal “begin.” Time ends when both feet are firmly planted on the ground after the last obstacle (decline ramp). A performance score (0-3) is given for each obstacle, with the total score summed at the end. The details of providing performance scores for each obstacle are listed below. Performance scoring is measured while any portion of the participant’s feet or hands are in contact with the obstacle, with the exception of the stairs and ramp obstacles (incline and decline). Instructions for when to begin and end performance scoring for these obstacles is listed below in bold. Use the lowest score received for each obstacle. This is indicates the score for the obstacle. For example, in the first obstacle “stand from a chair,” if a participant first uses one hand for support and then two; mark the score as 1 not 2. Wait until the participant has cleared the specific obstacle before scoring. Instruct participant on how the obstacle course is performed and scored; including details on performance scoring and time
Ask participant to sit in the chair (first obstacle) and ask them to make a clear verbal sign when they are ready to begin. After confirmation from participant Say “Begin.” Begin timing at this point
Stand From Chair
Participant refuses or is unable to complete this station = 0 Needs support to get up from the chair with two hands=1 Needs support to get up from the chair with one hand=2 Score
Performance Score
No difficulty standing from chair, or walking to next obstacle=3
Door Opening
Participant refuses or is unable to complete this station = 0 Difficulty opening door; uses other h and for support or cannot clear doorway before the closing door swings back = 1
Minor difficulty opening door or clearing doorway in time =2 Score
Performance Score
No difficulty opening door or clearing doorway = 3
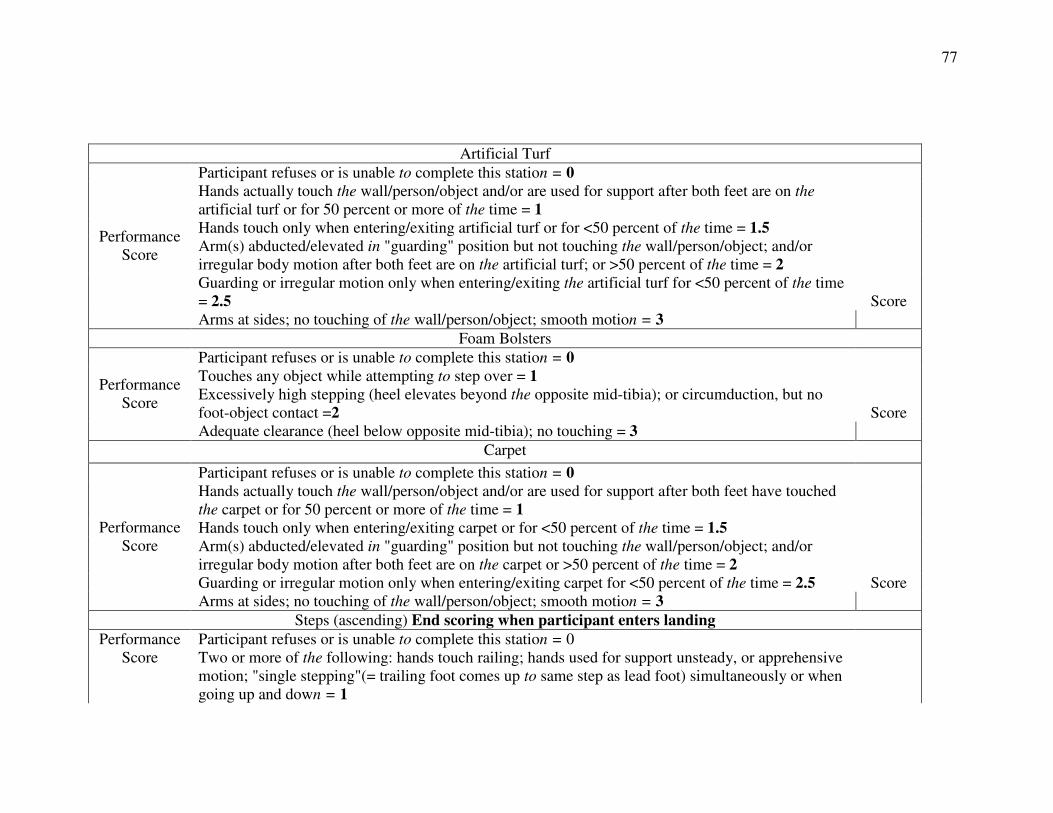
77
Artificial Turf
Participant refuses or is unable to complete this station = 0 Hands actually touch the wall/person/object and/or are used for support after both feet are on the artificial turf or for 50 percent or more of the time = 1
Hands touch only when entering/exiting artificial turf or for <50 percent of the time = 1.5 Arm(s) abducted/elevated in "guarding" position but not touching the wall/person/object; and/or irregular body motion after both feet are on the artificial turf; or >50 percent of the time = 2
Guarding or irregular motion only when entering/exiting the artificial turf for <50 percent of the time = 2.5 Score
Performance Score
Arms at sides; no touching of the wall/person/object; smooth motion = 3
Foam Bolsters
Participant refuses or is unable to complete this station = 0 Touches any object while attempting to step over = 1 Excessively high stepping (heel elevates beyond the opposite mid-tibia); or circumduction, but no foot-object contact =2 Score
Performance Score
Adequate clearance (heel below opposite mid-tibia); no touching = 3
Carpet
Participant refuses or is unable to complete this station = 0 Hands actually touch the wall/person/object and/or are used for support after both feet have touched the carpet or for 50 percent or more of the time = 1
Hands touch only when entering/exiting carpet or for <50 percent of the time = 1.5 Arm(s) abducted/elevated in "guarding" position but not touching the wall/person/object; and/or irregular body motion after both feet are on the carpet or >50 percent of the time = 2
Guarding or irregular motion only when entering/exiting carpet for <50 percent of the time = 2.5 Score
Performance Score
Arms at sides; no touching of the wall/person/object; smooth motion = 3
Steps (ascending) End scoring when participant enters landing
Participant refuses or is unable to complete this station = 0 Performance Score Two or more of the following: hands touch railing; hands used for support unsteady, or apprehensive
motion; "single stepping"(= trailing foot comes up to same step as lead foot) simultaneously or when going up and down = 1
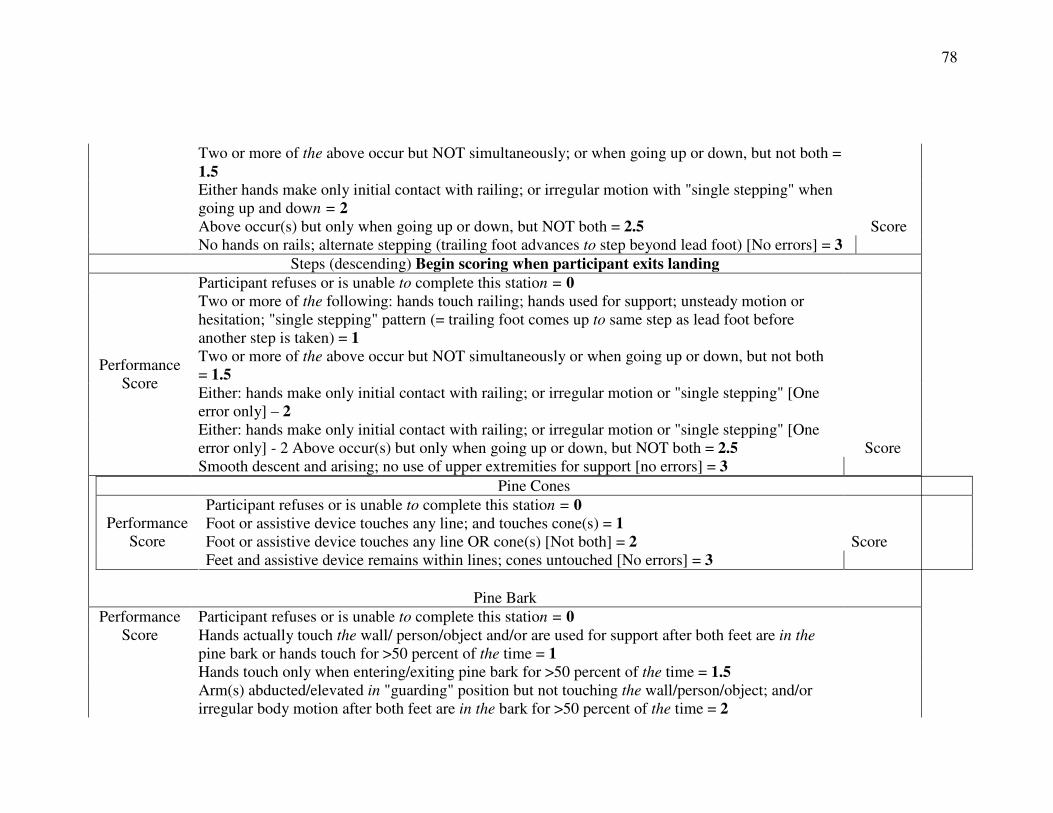
78
Two or more of the above occur but NOT simultaneously; or when going up or down, but not both = 1.5
Either hands make only initial contact with railing; or irregular motion with "single stepping" when going up and down = 2
Above occur(s) but only when going up or down, but NOT both = 2.5 Score No hands on rails; alternate stepping (trailing foot advances to step beyond lead foot) [No errors] = 3
Steps (descending) Begin scoring when participant exits landing
Participant refuses or is unable to complete this station = 0 Two or more of the following: hands touch railing; hands used for support; unsteady motion or hesitation; "single stepping" pattern (= trailing foot comes up to same step as lead foot before another step is taken) = 1
Two or more of the above occur but NOT simultaneously or when going up or down, but not both = 1.5
Either: hands make only initial contact with railing; or irregular motion or "single stepping" [One error only] – 2
Either: hands make only initial contact with railing; or irregular motion or "single stepping" [One error only] - 2 Above occur(s) but only when going up or down, but NOT both = 2.5 Score
Performance Score
Smooth descent and arising; no use of upper extremities for support [no errors] = 3
Pine Cones
Participant refuses or is unable to complete this station = 0 Foot or assistive device touches any line; and touches cone(s) = 1 Foot or assistive device touches any line OR cone(s) [Not both] = 2 Score
Performance Score
Feet and assistive device remains within lines; cones untouched [No errors] = 3
Pine Bark Participant refuses or is unable to complete this station = 0 Hands actually touch the wall/ person/object and/or are used for support after both feet are in the pine bark or hands touch for >50 percent of the time = 1
Hands touch only when entering/exiting pine bark for >50 percent of the time = 1.5
Performance Score
Arm(s) abducted/elevated in "guarding" position but not touching the wall/person/object; and/or irregular body motion after both feet are in the bark for >50 percent of the time = 2
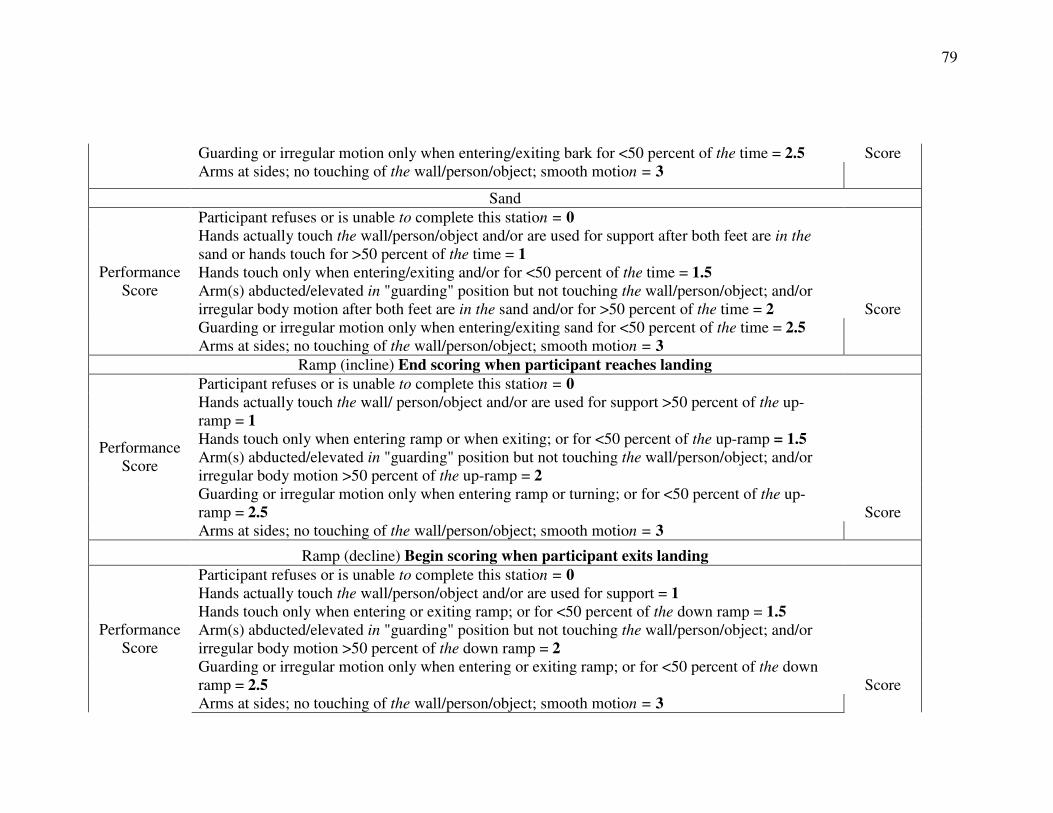
79
Guarding or irregular motion only when entering/exiting bark for <50 percent of the time = 2.5 Score Arms at sides; no touching of the wall/person/object; smooth motion = 3
Sand
Participant refuses or is unable to complete this station = 0 Hands actually touch the wall/person/object and/or are used for support after both feet are in the sand or hands touch for >50 percent of the time = 1
Hands touch only when entering/exiting and/or for <50 percent of the time = 1.5 Arm(s) abducted/elevated in "guarding" position but not touching the wall/person/object; and/or irregular body motion after both feet are in the sand and/or for >50 percent of the time = 2 Score
Performance Score
Guarding or irregular motion only when entering/exiting sand for <50 percent of the time = 2.5 Arms at sides; no touching of the wall/person/object; smooth motion = 3
Ramp (incline) End scoring when participant reaches landing
Participant refuses or is unable to complete this station = 0 Hands actually touch the wall/ person/object and/or are used for support >50 percent of the up-ramp = 1
Hands touch only when entering ramp or when exiting; or for <50 percent of the up-ramp = 1.5 Arm(s) abducted/elevated in "guarding" position but not touching the wall/person/object; and/or irregular body motion >50 percent of the up-ramp = 2
Guarding or irregular motion only when entering ramp or turning; or for <50 percent of the up-ramp = 2.5 Score
Performance Score
Arms at sides; no touching of the wall/person/object; smooth motion = 3
Ramp (decline) Begin scoring when participant exits landing
Participant refuses or is unable to complete this station = 0 Hands actually touch the wall/person/object and/or are used for support = 1 Hands touch only when entering or exiting ramp; or for <50 percent of the down ramp = 1.5 Arm(s) abducted/elevated in "guarding" position but not touching the wall/person/object; and/or irregular body motion >50 percent of the down ramp = 2
Guarding or irregular motion only when entering or exiting ramp; or for <50 percent of the down ramp = 2.5 Score
Performance Score
Arms at sides; no touching of the wall/person/object; smooth motion = 3
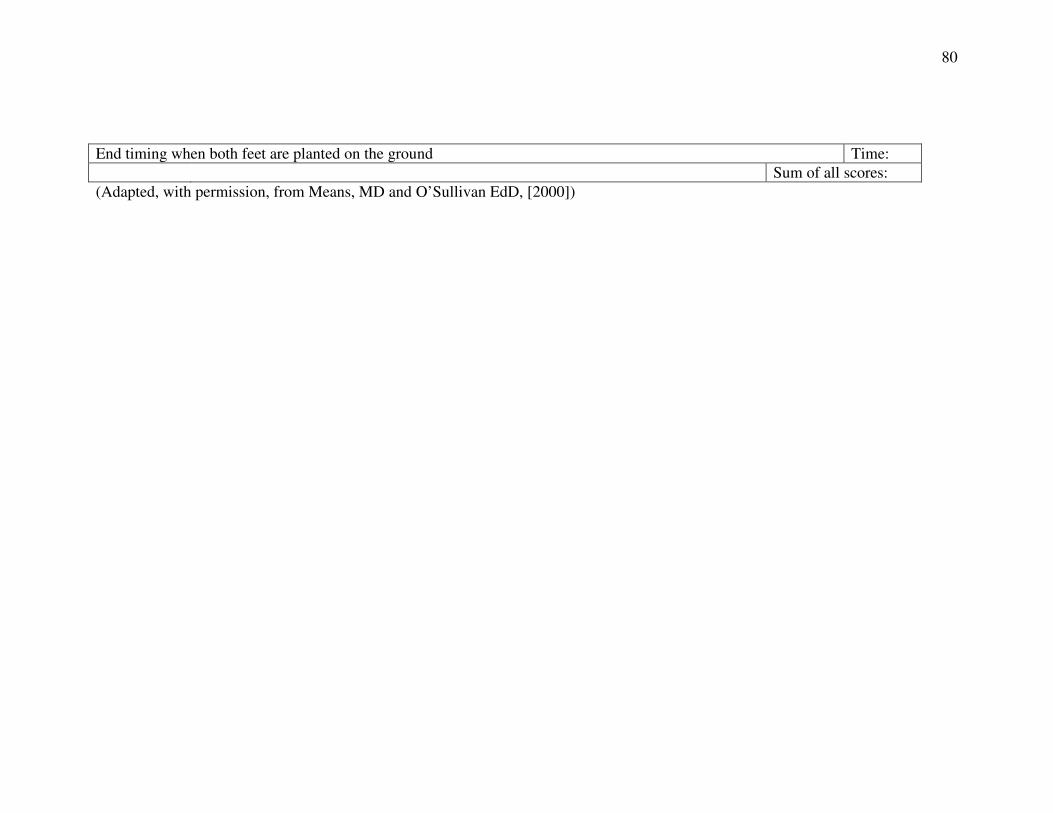
80
End timing when both feet are planted on the ground Time:
Sum of all scores:
(Adapted, with permission, from Means, MD and O’Sullivan EdD, [2000])

81
APPENDIX B
Activities-Specific Balance Confidence Scale (ABC)
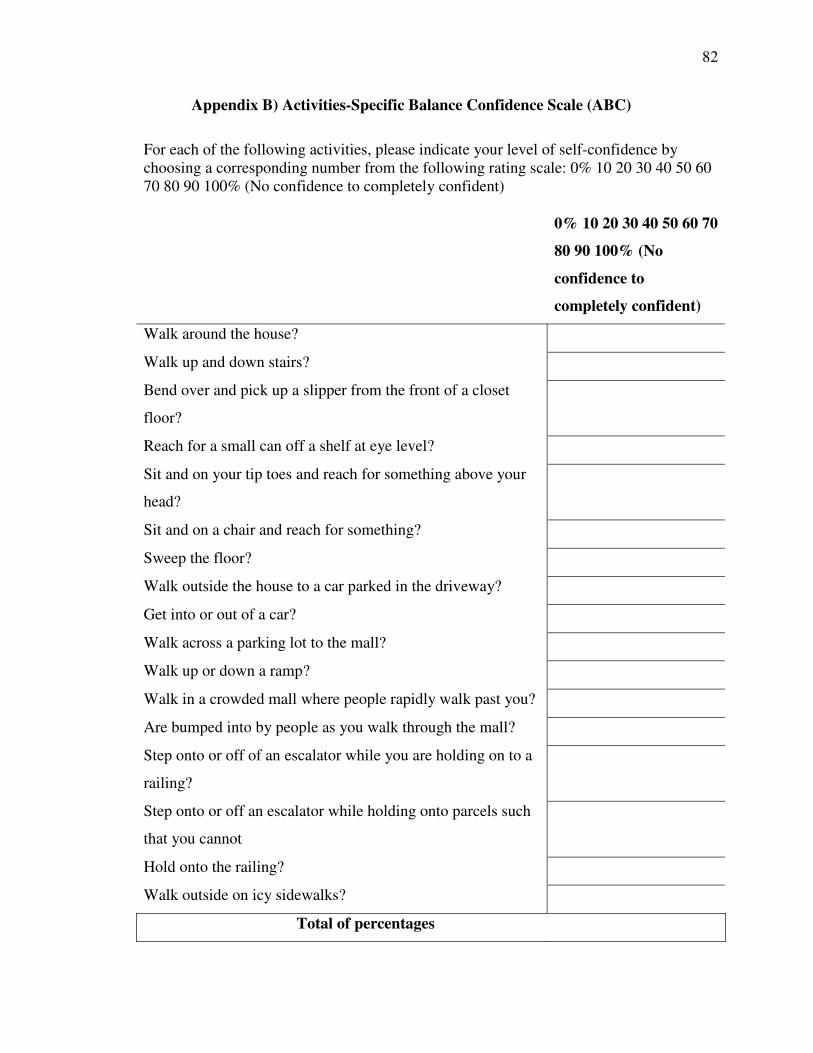
82
Appendix B) Activities-Specific Balance Confidence Scale (ABC)
For each of the following activities, please indicate your level of self-confidence by choosing a corresponding number from the following rating scale: 0% 10 20 30 40 50 60 70 80 90 100% (No confidence to completely confident)
0% 10 20 30 40 50 60 70
80 90 100% (No
confidence to
completely confident)
Walk around the house?
Walk up and down stairs?
Bend over and pick up a slipper from the front of a closet
floor?
Reach for a small can off a shelf at eye level?
Sit and on your tip toes and reach for something above your
head?
Sit and on a chair and reach for something?
Sweep the floor?
Walk outside the house to a car parked in the driveway?
Get into or out of a car?
Walk across a parking lot to the mall?
Walk up or down a ramp?
Walk in a crowded mall where people rapidly walk past you?
Are bumped into by people as you walk through the mall?
Step onto or off of an escalator while you are holding on to a
railing?
Step onto or off an escalator while holding onto parcels such
that you cannot
Hold onto the railing?
Walk outside on icy sidewalks?
Total of percentages
83
(Adapted from Powell &Myers [1995])
84
APPENDIX C
Tinetti Balance Test
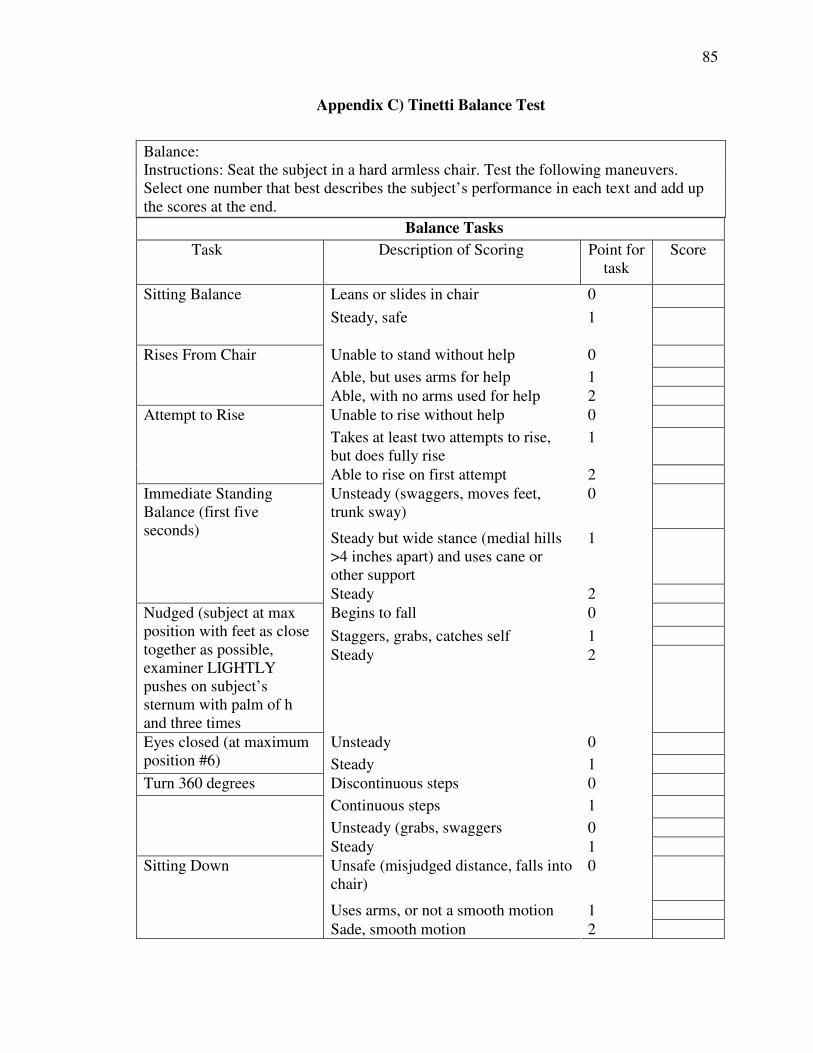
85
Appendix C) Tinetti Balance Test
Balance: Instructions: Seat the subject in a hard armless chair. Test the following maneuvers. Select one number that best describes the subject’s performance in each text and add up the scores at the end.
Balance Tasks
Task Description of Scoring Point for task
Score
Leans or slides in chair 0 Sitting Balance
Steady, safe
1
Unable to stand without help 0
Able, but uses arms for help 1
Rises From Chair
Able, with no arms used for help 2
Unable to rise without help 0
Takes at least two attempts to rise, but does fully rise
1
Attempt to Rise
Able to rise on first attempt 2
Unsteady (swaggers, moves feet, trunk sway)
0
Steady but wide stance (medial hills >4 inches apart) and uses cane or other support
1
Immediate Standing Balance (first five seconds)
Steady 2
Begins to fall 0
Staggers, grabs, catches self 1
Nudged (subject at max position with feet as close together as possible, examiner LIGHTLY pushes on subject’s sternum with palm of h and three times
Steady 2
Unsteady 0 Eyes closed (at maximum position #6) Steady 1
Turn 360 degrees Discontinuous steps 0
Continuous steps 1
Unsteady (grabs, swaggers 0
Steady 1
Unsafe (misjudged distance, falls into chair)
0
Uses arms, or not a smooth motion 1
Sitting Down
Sade, smooth motion 2
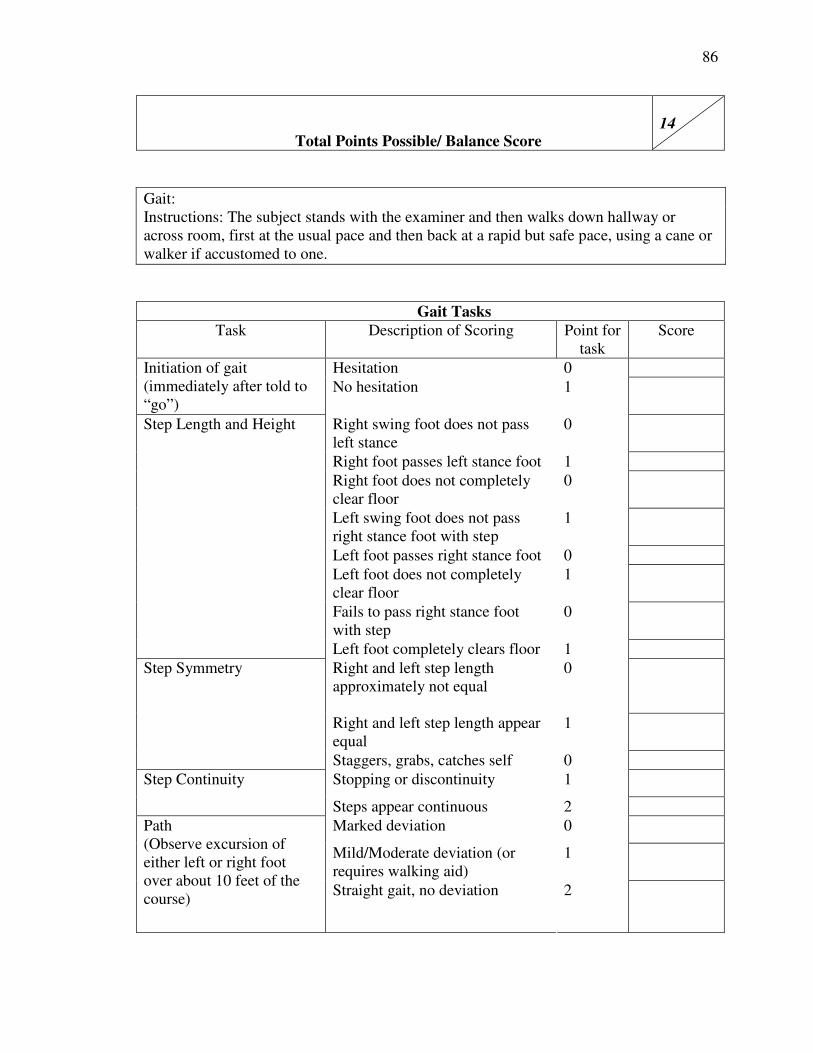
86
Total Points Possible/ Balance Score 14
Gait: Instructions: The subject stands with the examiner and then walks down hallway or across room, first at the usual pace and then back at a rapid but safe pace, using a cane or walker if accustomed to one.
Gait Tasks
Task Description of Scoring Point for task
Score
Hesitation 0 Initiation of gait (immediately after told to “go”)
No hesitation
1
Right swing foot does not pass left stance
0
Right foot passes left stance foot 1
Right foot does not completely clear floor
0
Left swing foot does not pass right stance foot with step
1
Left foot passes right stance foot 0
Left foot does not completely clear floor
1
Fails to pass right stance foot with step
0
Step Length and Height
Left foot completely clears floor 1
Right and left step length approximately not equal
0
Right and left step length appear equal
1
Step Symmetry
Staggers, grabs, catches self 0
Stopping or discontinuity 1 Step Continuity
Steps appear continuous 2
Marked deviation 0
Mild/Moderate deviation (or requires walking aid)
1
Path (Observe excursion of either left or right foot over about 10 feet of the course)
Straight gait, no deviation 2
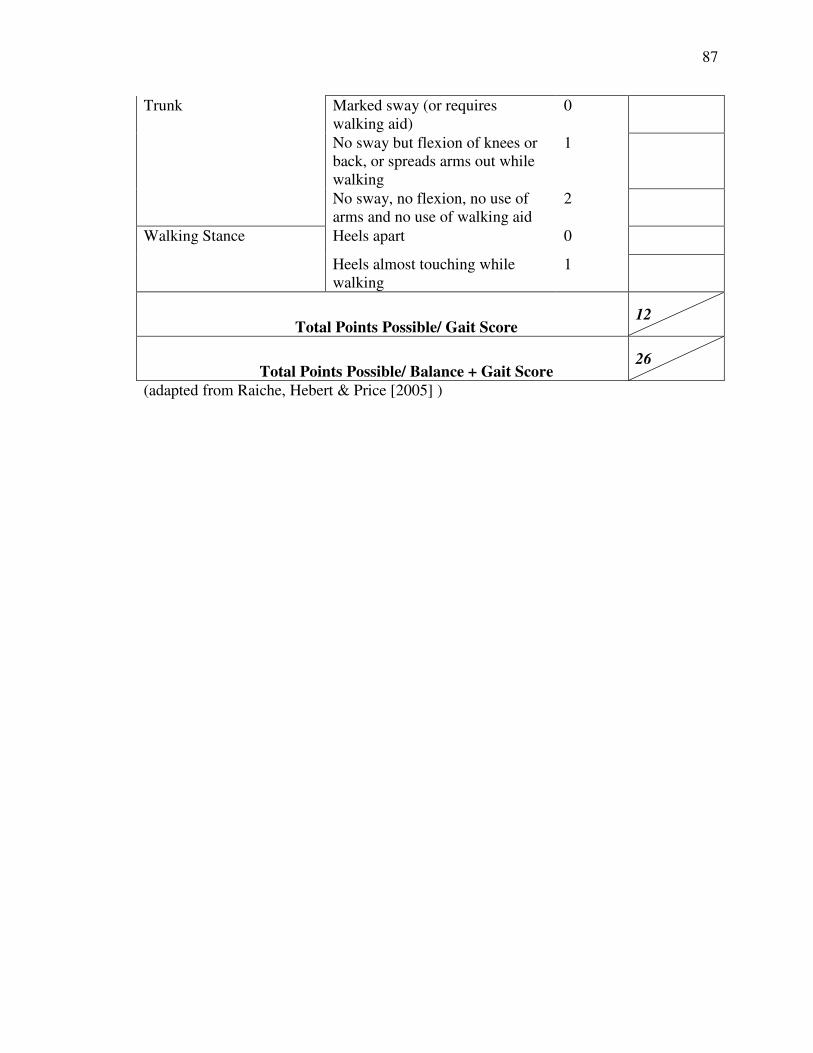
87
Marked sway (or requires walking aid)
0
No sway but flexion of knees or back, or spreads arms out while walking
1
Trunk
No sway, no flexion, no use of arms and no use of walking aid
2
Heels apart 0 Walking Stance
Heels almost touching while walking
1
Total Points Possible/ Gait Score 12
Total Points Possible/ Balance + Gait Score 26
(adapted from Raiche, Hebert & Price [2005] )
88
APPENDIX D
Dynamic Gait Index Scoring
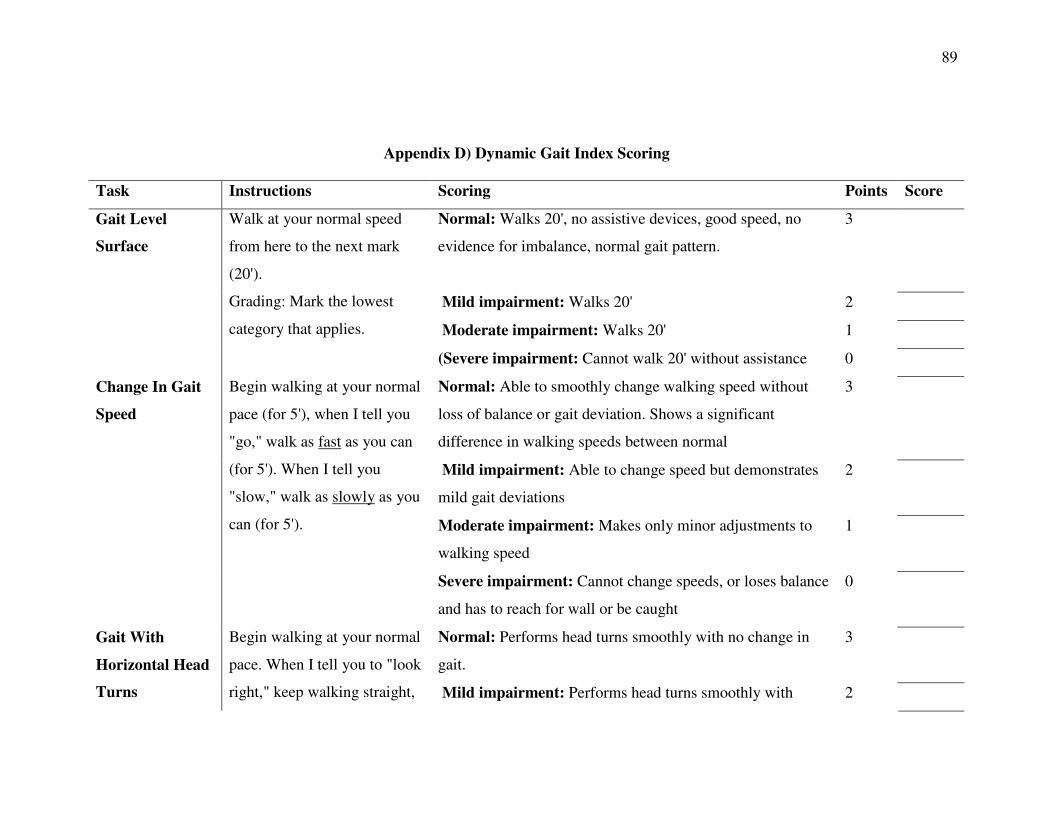
89
Appendix D) Dynamic Gait Index Scoring
Task Instructions Scoring Points Score
Normal: Walks 20', no assistive devices, good speed, no
evidence for imbalance, normal gait pattern.
3
Mild impairment: Walks 20' 2
Moderate impairment: Walks 20' 1
Gait Level
Surface
Walk at your normal speed
from here to the next mark
(20').
Grading: Mark the lowest
category that applies.
(Severe impairment: Cannot walk 20' without assistance 0
Normal: Able to smoothly change walking speed without
loss of balance or gait deviation. Shows a significant
difference in walking speeds between normal
3
Mild impairment: Able to change speed but demonstrates
mild gait deviations
2
Moderate impairment: Makes only minor adjustments to
walking speed
1
Change In Gait
Speed
Begin walking at your normal
pace (for 5'), when I tell you
"go," walk as fast as you can
(for 5'). When I tell you
"slow," walk as slowly as you
can (for 5').
Severe impairment: Cannot change speeds, or loses balance
and has to reach for wall or be caught
0
Normal: Performs head turns smoothly with no change in
gait.
3 Gait With
Horizontal Head
Turns
Begin walking at your normal
pace. When I tell you to "look
right," keep walking straight, Mild impairment: Performs head turns smoothly with 2
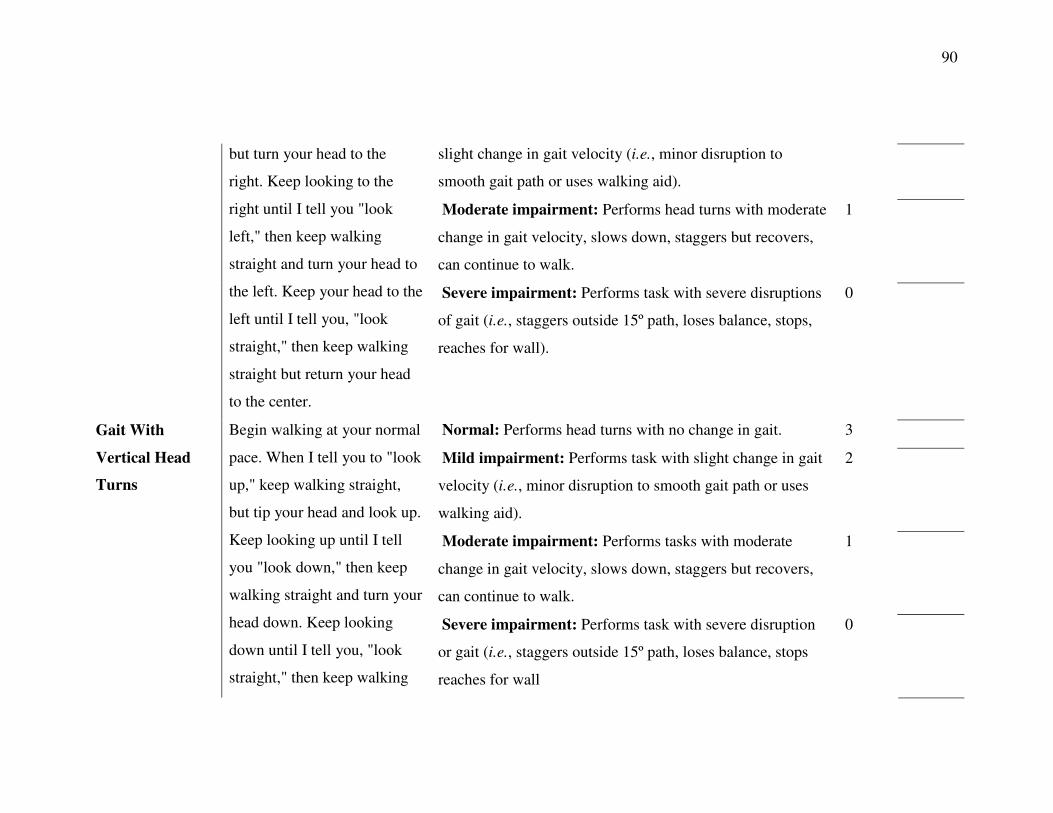
90
slight change in gait velocity (i.e., minor disruption to
smooth gait path or uses walking aid).
Moderate impairment: Performs head turns with moderate
change in gait velocity, slows down, staggers but recovers,
can continue to walk.
1
but turn your head to the
right. Keep looking to the
right until I tell you "look
left," then keep walking
straight and turn your head to
the left. Keep your head to the
left until I tell you, "look
straight," then keep walking
straight but return your head
to the center.
Severe impairment: Performs task with severe disruptions
of gait (i.e., staggers outside 15º path, loses balance, stops,
reaches for wall).
0
Normal: Performs head turns with no change in gait. 3
Mild impairment: Performs task with slight change in gait
velocity (i.e., minor disruption to smooth gait path or uses
walking aid).
2
Moderate impairment: Performs tasks with moderate
change in gait velocity, slows down, staggers but recovers,
can continue to walk.
1
Gait With
Vertical Head
Turns
Begin walking at your normal
pace. When I tell you to "look
up," keep walking straight,
but tip your head and look up.
Keep looking up until I tell
you "look down," then keep
walking straight and turn your
head down. Keep looking
down until I tell you, "look
straight," then keep walking
Severe impairment: Performs task with severe disruption
or gait (i.e., staggers outside 15º path, loses balance, stops
reaches for wall
0
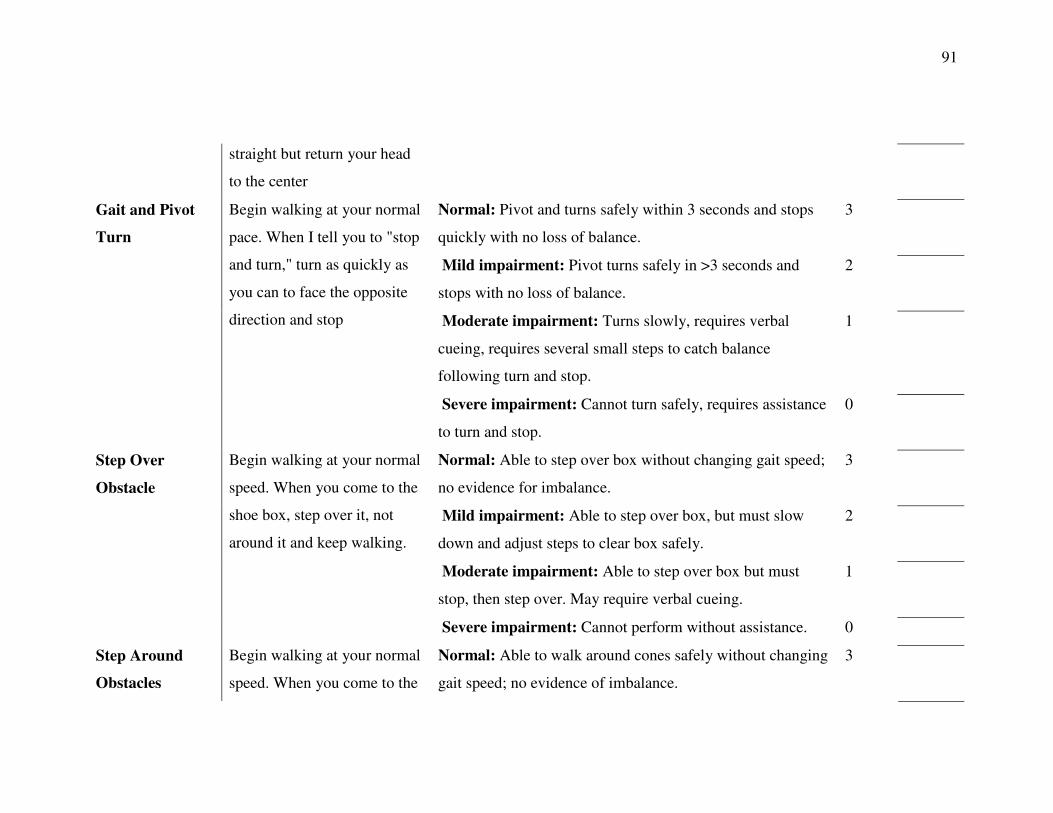
91
straight but return your head
to the center
Normal: Pivot and turns safely within 3 seconds and stops
quickly with no loss of balance.
3
Mild impairment: Pivot turns safely in >3 seconds and
stops with no loss of balance.
2
Moderate impairment: Turns slowly, requires verbal
cueing, requires several small steps to catch balance
following turn and stop.
1
Gait and Pivot
Turn
Begin walking at your normal
pace. When I tell you to "stop
and turn," turn as quickly as
you can to face the opposite
direction and stop
Severe impairment: Cannot turn safely, requires assistance
to turn and stop.
0
Normal: Able to step over box without changing gait speed;
no evidence for imbalance.
3
Mild impairment: Able to step over box, but must slow
down and adjust steps to clear box safely.
2
Moderate impairment: Able to step over box but must
stop, then step over. May require verbal cueing.
1
Step Over
Obstacle
Begin walking at your normal
speed. When you come to the
shoe box, step over it, not
around it and keep walking.
Severe impairment: Cannot perform without assistance. 0
Step Around
Obstacles
Begin walking at your normal
speed. When you come to the
Normal: Able to walk around cones safely without changing
gait speed; no evidence of imbalance.
3
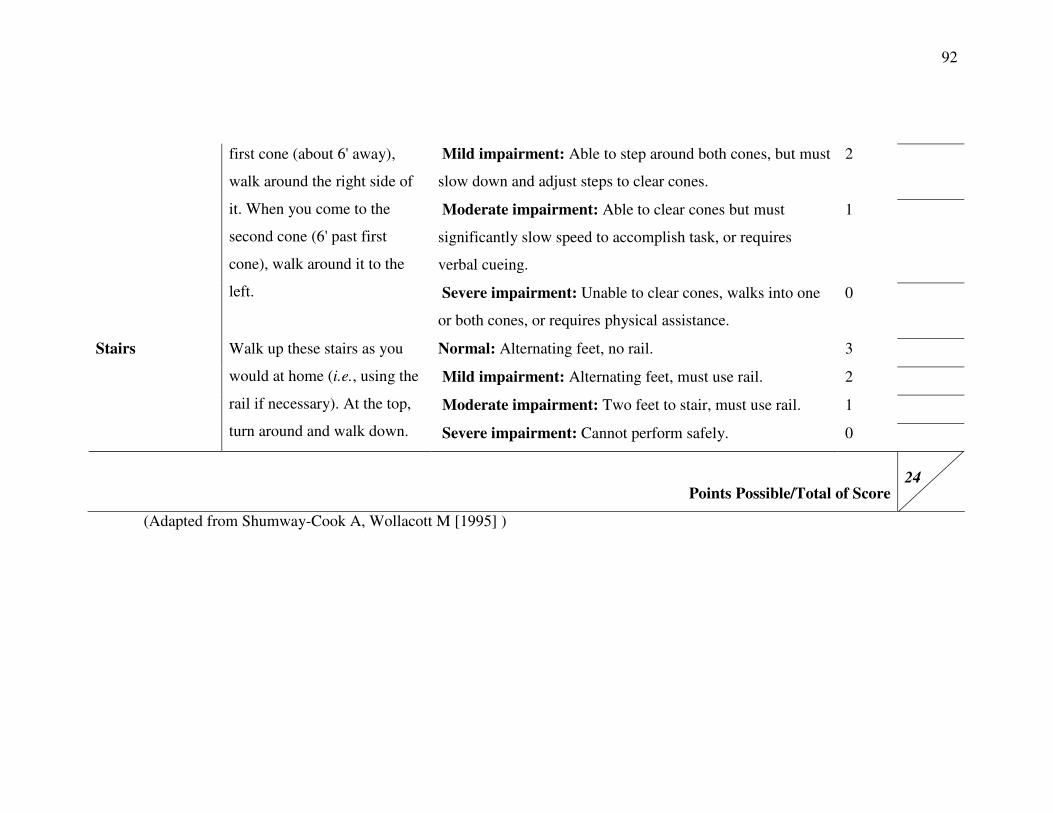
92
Mild impairment: Able to step around both cones, but must
slow down and adjust steps to clear cones.
2
Moderate impairment: Able to clear cones but must
significantly slow speed to accomplish task, or requires
verbal cueing.
1
first cone (about 6' away),
walk around the right side of
it. When you come to the
second cone (6' past first
cone), walk around it to the
left. Severe impairment: Unable to clear cones, walks into one
or both cones, or requires physical assistance.
0
Normal: Alternating feet, no rail. 3
Mild impairment: Alternating feet, must use rail. 2
Moderate impairment: Two feet to stair, must use rail. 1
Stairs Walk up these stairs as you
would at home (i.e., using the
rail if necessary). At the top,
turn around and walk down. Severe impairment: Cannot perform safely. 0
Points Possible/Total of Score 24
(Adapted from Shumway-Cook A, Wollacott M [1995] )
93
APPENDIX E
Recruitment Flyer
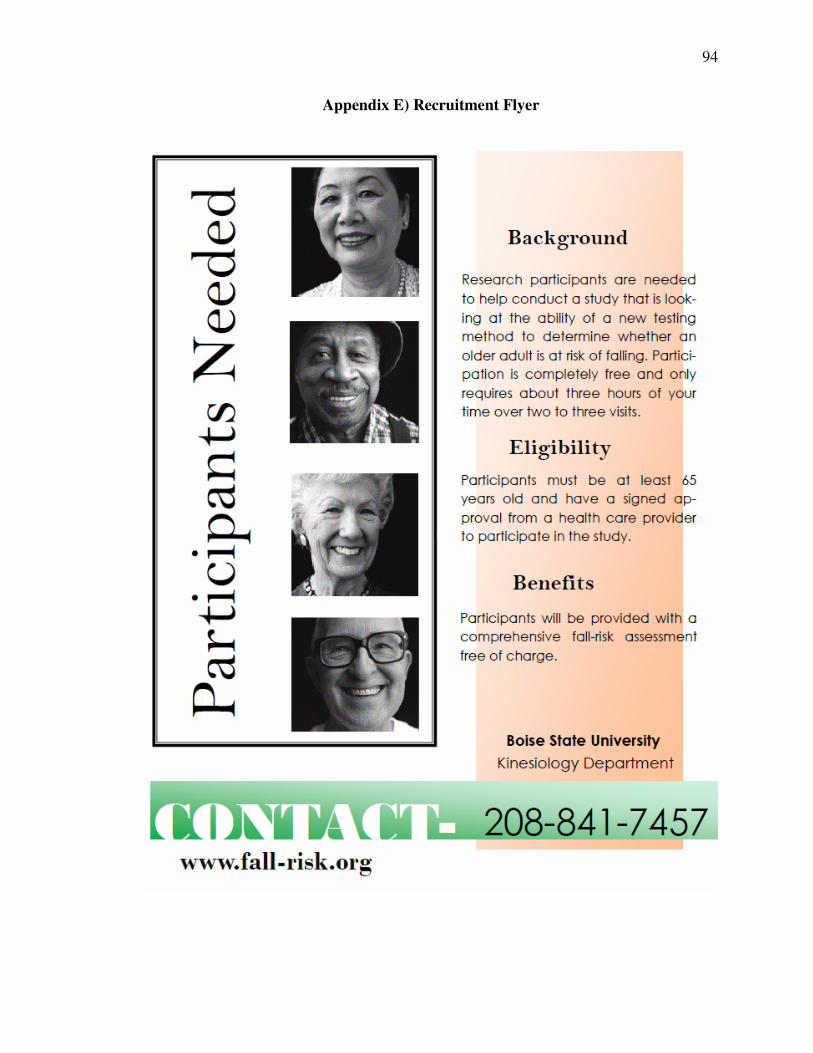
94
Appendix E) Recruitment Flyer

95
APPENDIX F
Telephone Script
96
Appendix F) Telephone Script
Hello. My name is Daniel Gragert and I am a graduate student at the Boise State
University Kinesiology Department. We currently have a study you previously expressed
interest in. If you have some time, I would like to explain the study to you. Do you have a
few moments right now?
If no:
Okay, is there a day and time when I can call you back? Date:_______
Time:_________
Thank you for your time.
If yes:
Great! Thank you for your time, this won’t take long.
This study is part of our research about a new diagnostic method for older adult
fall risks. This study involves testing a new assessment tool that resembles a short
obstacle course for diagnosing fall risks. If you choose to participate you will be asked to
come to an initial meeting in which we will discuss a few details of the study and provide
you with an informed consent and a consent to participate that needs to be signed by your
primary health care provider. In addition to the signed consent forms we will also have
you fill out a quick form called the physical activity readiness questionnaire. If you
choose to participate we will collect the signed consent forms and schedule your meeting
times.
97
You will be asked to come to campus four separate times for testing. The first
time will take about two hours and the next three will take about one and half hours.
During the first session we will ask you to perform four assessments that take about
fifteen minutes, each, to complete. During the next three sessions you will only perform
three of these first tests. For each testing session you will be testing with another
participant. As he or she performs the assessment you will be provided time to rest and
socialize and vice-versa.
At your request we will provide you with the scores of any assessment you like.
All of your information will kept in a locked filing cabinet that can only be accessed by
necessary staff members.
Do you have any questions at this moment?
Is this something you may be interested in?
If no:
Thank you for your time and I hope you have a good day. If you have any
questions you can contact me at 208-841-7457
If yes:
Great! The first session is_________ at the _________ from ________
to_______. I look forward to seeing you there.
Do you have any questions at this moment?
98
If you’d like, I can email you a breakdown of what we will be doing the day of
the study. Would you be interested in that?
Thank you for your time today as well as your willingness to be a part of our
study. Please to not hesitate to contact me if you have any further questions or concerns.
Again, my name is Daniel Gragert and I can be reached at 208-841-7457. Thank you for
your time and I look forward to meeting you.
Recommended