Land surface processes in climatemodels: Carbon Cycle and Ecology
Victor Brovkin
Max-Planck-Institut für MeteorologieKlimaCampus, Hamburg
Brovkin & Kleinen: Terrestrial ecosystem processes within Earth system models

Brovkin & Kleinen: Terrestrial ecosystem processes within Earth system models
Schedule
1) 26.10 Land surface models I: Biophysics and hydrology (VB)
2) 02.11 Land surface models II: Carbon cycle and ecology (VB)
3) 09.11 Land use effect on climate (TK)
4) 16.11 Land-atmosphere interactions I: biogeophysical feedbacks (VB)
5) 23.11 Land-atmosphere interactions II: carbon cycle feedback (VB)
6) 30.11 Wetland modelling and CH4 feedback (TK)
VB – Victor Brovkin, TK – Thomas Kleinen

The land biosphere in the global carbon cycle
IPCC 2007

Terminology
• Net Ecosystem Production (NEP) = land uptakeNEP=GPP-Ra-Rh=NPP-Rh
• Net Ecosystem Exchange (NEE) = land-atmosphere flux
→ NEE = - NEP
GPP – gross primary productivityNPP – net primary productivity; NPP=GPP-RaRa - autotrophic (living plant) respirationRa - heterotrophic (microbial) respiration
1 PgC = 1 GtC =1015 gCGlobal NEP and NEE units are PgC/yr (IPCC TAR) or GtC/yr (IPCC AR4)
Bonan, 2008

How much is 1 Gt of carbon?
Hamburg area = 755 km2
Typical wood density: 500 kg/m3, 250 kgC/m3
1GtC = 109 t C = 4 km3 wood
4 km3 wood / 755 km2 of Hamburg surface =5.3 m high stack of wood over Hamburg
Global annual NPP = 60 GtC
60 GtC = 320 m high wood pile over Hamburg
Hamburg Funkturm = 270 m
Wikipedia Commons

Carbon sources and sinks overthe last two centuries
House et al., GCB, 2003

Dynamics of global CO2 fluxes
Canadell et al., PNAS, 2007
Land uptake has strongInterannual variability

Global carbon budget
landoceanlandusefossilatm FFFF
dtdC +++=
GtC/yr
IPCC 2007

Photosynthesis: C3 vs C4 plants
Wikipedia Commons
C3-type photosynthesis: ca. 85%Most of trees; all plants in cold environment
C4-type photosynthesis: ca. 15%Corn, sugar cane, some plants in warm/dryenvironment
C4 plants keep part of CO2 released duringautotrophic respiration within the leaf

Combined photosynthesis-conductance model
The stomatal conductance (gs) is a direct function of photosynthesis, CO2 concentration at the leaf surface (cs), and relative humidity at the leaf surface, hs = es/e*(Ts) [ es = vapor pressure at leaf surface]:
where m is an empirical coefficient fromobservations (≈9 for most C3 vegetation and ≈4 for C4 vegetation), An is the net CO2 assimilation, cs is the CO2concentration at the leaf surface, hs is the relative humidity at the leaf surface, p is the atmospheric pressure, and b is the minimum value of gs (≈ 0.01 for C3vegetation and ≈ 0.04 for C4 vegetation).
Sellers et al., Science, 1997
C3 and C4 plant have distictly different δ13C values(ca. -26‰ and -12‰, respectively)

Autotrophic respiration
Sitch et al., GCB, 2003
r – tissue respiration at reference temperature;g(T) – respiration depencence on temperature;φ– phenology index (0<φ<1);Ci – biomass of given component;cn – C:N ratio of given component

Soil carbon dynamics
10/)(10)(
)(
refTTrefi
iiii
QkTk
CTkFdt
dC
−=
−=
where Ci is soil carbon content (kg C/m2) of the compartment i, Fi is a net carbon flux to the compartment i, ki(T) is decomposition rate at the given soil temperature T, kref is a decomposition rate at reference temperature (usually 10°C), Q10 is a sensitivity of decomposition rate to temperature change (~2).

Biospheric CO2 fluxes by a high resolution model
[Pillai et al., ACP 2010]
Photosynthesis production during daytime (blue)is compensated by nightly ecosystem respiration (red)

CO2 anomalies in high resolution model
[Pillai et al., ACP 2010]
Fossil fuel emissions and nightly respiration (red) mask out the daytime carbon uptake by land ecosystems (blue)
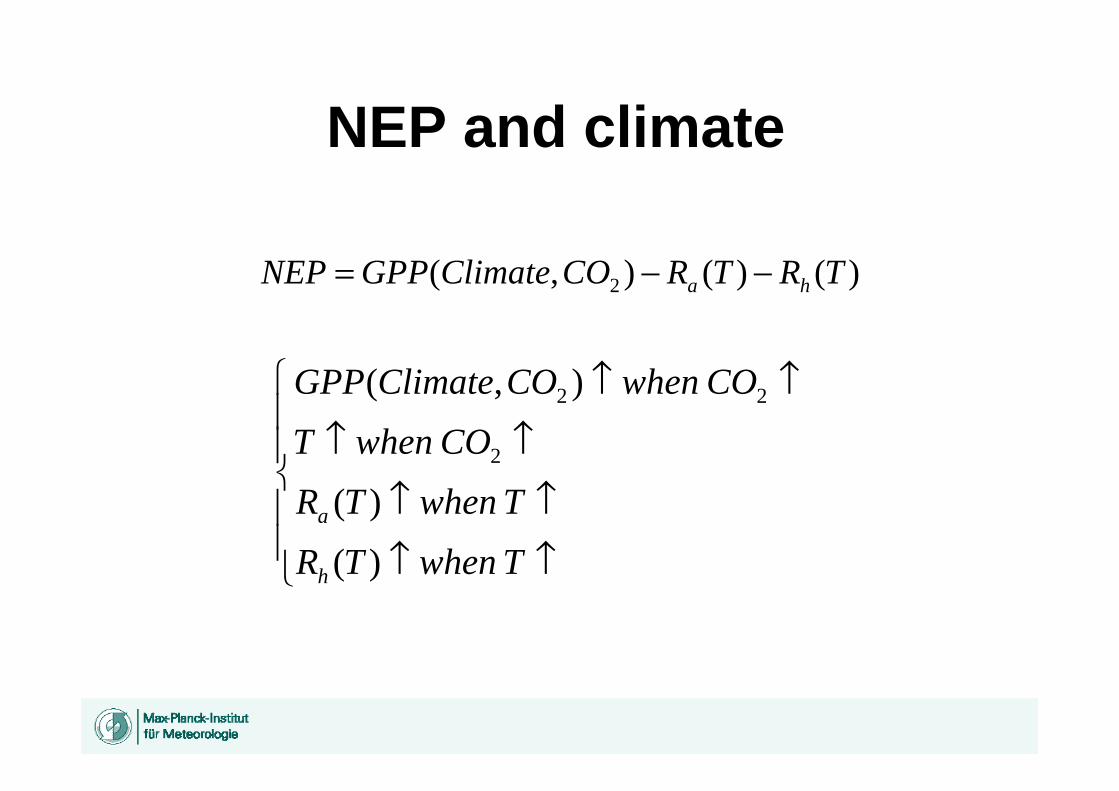
NEP and climate
)()(),( 2 TRTRCOClimateGPPNEP ha −−=
⎪⎪
⎩
⎪⎪
⎨
⎧
↑↑
↑↑
↑↑
↑↑
TwhenTR
TwhenTR
COwhenT
COwhenCOClimateGPP
h
a
)(
)(
),(
2
22

Generic dynamic balance equation
NNNmNdtdN
mNNNdtdN
)())((
or,)(
εμ
μ
=−=
−=
whereN is a vegetation quantity (number of species, carbon storage), μ(N) is a growth function, m is mortality.
If ε(N*)=0, when N* is the system equilbrium (stable or unstable)
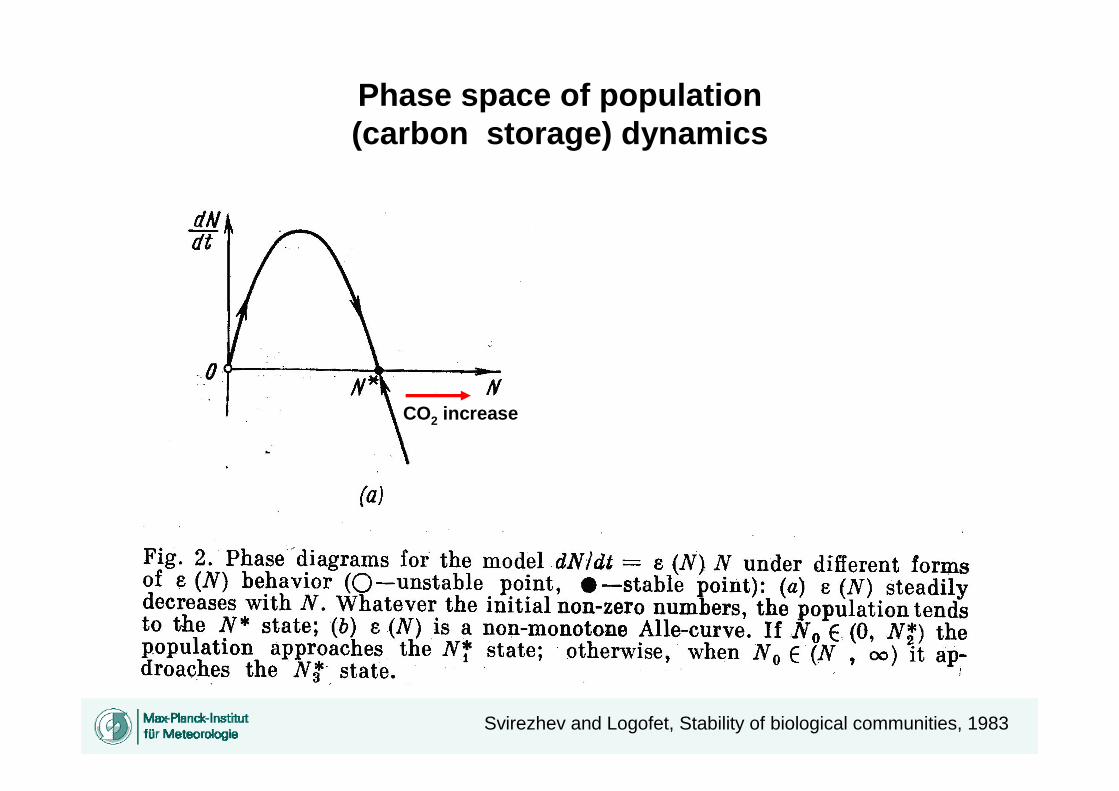
Phase space of population(carbon storage) dynamics
Svirezhev and Logofet, Stability of biological communities, 1983
CO2 increase

NEP dynamics in the future
Cramer et al., GCB, 2001

• Carbon cycle: – ecological databases with species parameters
(traits)• Plant ecology

Ever-growing plant trait databases
> 1 million trait entries geographically referenced> 8,000 sites> 1,000 traits> 60,000 species
TRY database
Kattge et al., GCB, submitted

0.892361440.91C4 perennial grass
1.101445461.24C3 perennial grass
0.891957480.92boreal broadleaved summergreen tree
0.863257500.87boreal needleleaved summergreen tree
0.772380580.71boreal needleleaved evergreen tree
1.212241451.41Temperate broadleaved summergreen tree
0.812141410.78temperate broadleaved evergreen tree
0.832273500.81temperate needleleaved evergreen tree
1.231433481.44tropical broadleaved raingreen tree
0.841766470.83tropical broadleaved evergreen tree
Turnover rate, k(N), 1/yrLignin,%C:NC, %N,%LPJ PFT
PFT-specific leaf litter decomposition rate in accordance with ART-DECO dataset

LPJ (Sitch et al., 2003)
LPJ (trait-based)
Using trait datasets improves litter stock patternsLitter storage, kg C/m2
Brovkin et al., GRL, submitted

TeN BoNTrBE TrBR TeBE BoBSTeBS
Woody litter storage
OldNew
Brovkin et al., GRL, submitted
Boreal treesTropical trees Temperate trees
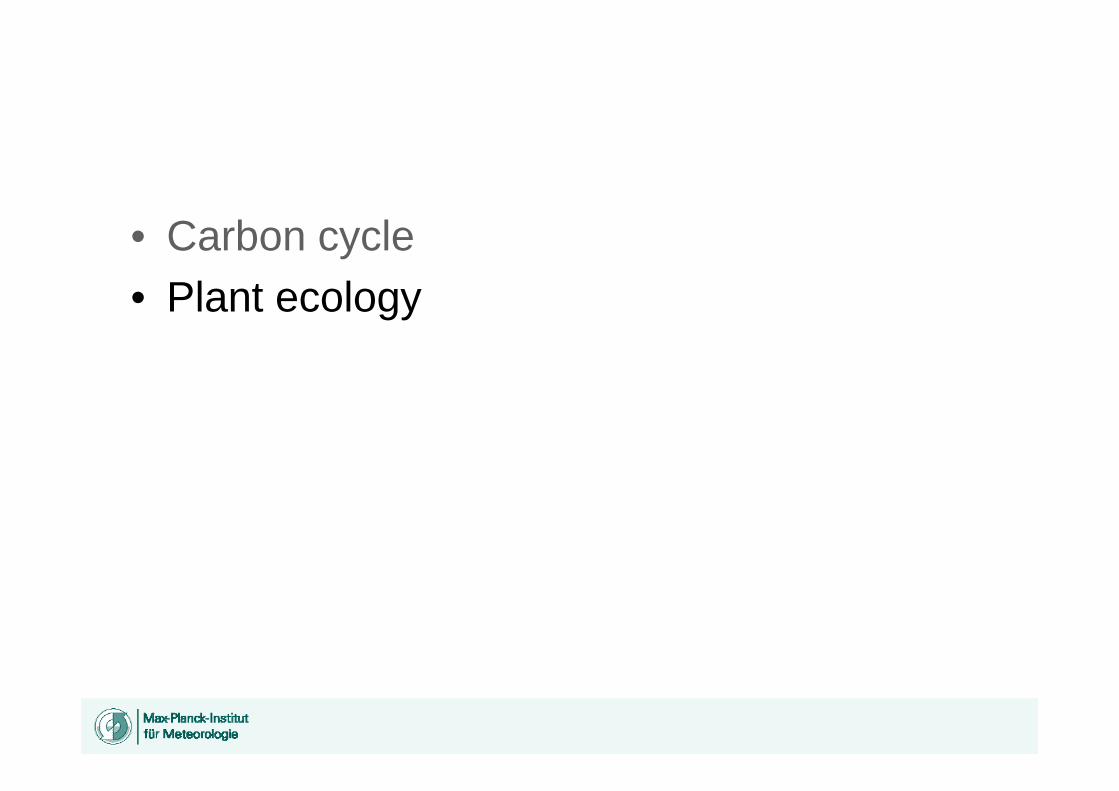
• Carbon cycle• Plant ecology

Purves et al., Life: The Science of biology
Climatic control of terrestrial vegetation

Holdridge’s Life Zone model
Holdridge, Science, 1947

Biome shifts in global warming scenario
Today’s climate
2 x CO2climate scenario
• Poleward shifts of boreal and temperate forests
• Expansion of steppe, dry woodland and desert
Emanuel et al., Climatic Change, 1995

BIOME model
Prentice et al., Journal of Biogeography, 1992

BIOME model
Prentice et al., Journal of Biogeography, 1992

Global vegetation according to the BIOME model
Prentice et al., Journal of Biogeography, 1992
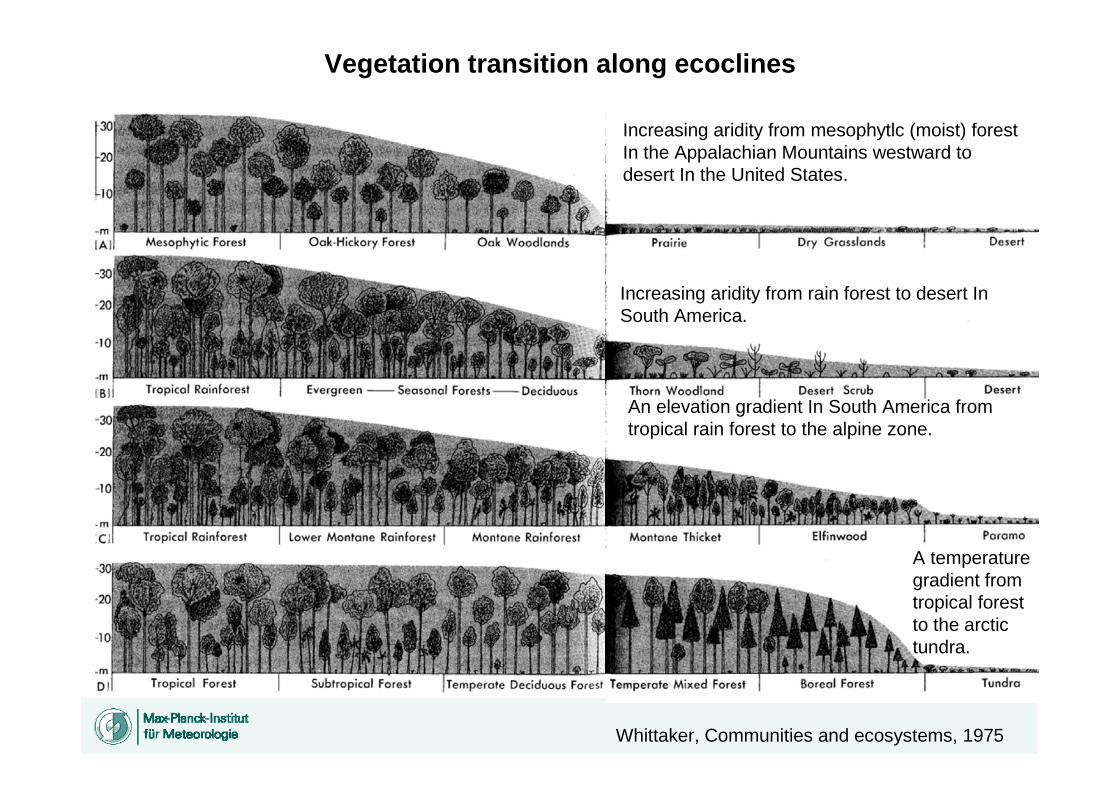
A temperature gradient from tropical forest to the arctic tundra.
Increasing aridity from mesophytlc (moist) forest In the Appalachian Mountains westward to desert In the United States.
Increasing aridity from rain forest to desert In South America.
An elevation gradient In South America from tropical rain forest to the alpine zone.
Whittaker, Communities and ecosystems, 1975
Vegetation transition along ecoclines

BIOME-type equilibrium model Dynamic Global Vegetation Model

Modular structure of a generic dynamic global vegetation model (DGVM)

Competition for light:Stratification and Iight extinction in a forest
Whittaker, Communities and ecosystems, 1975

Niche divergence of two species
Whittaker, Communities and ecosystems, 1975
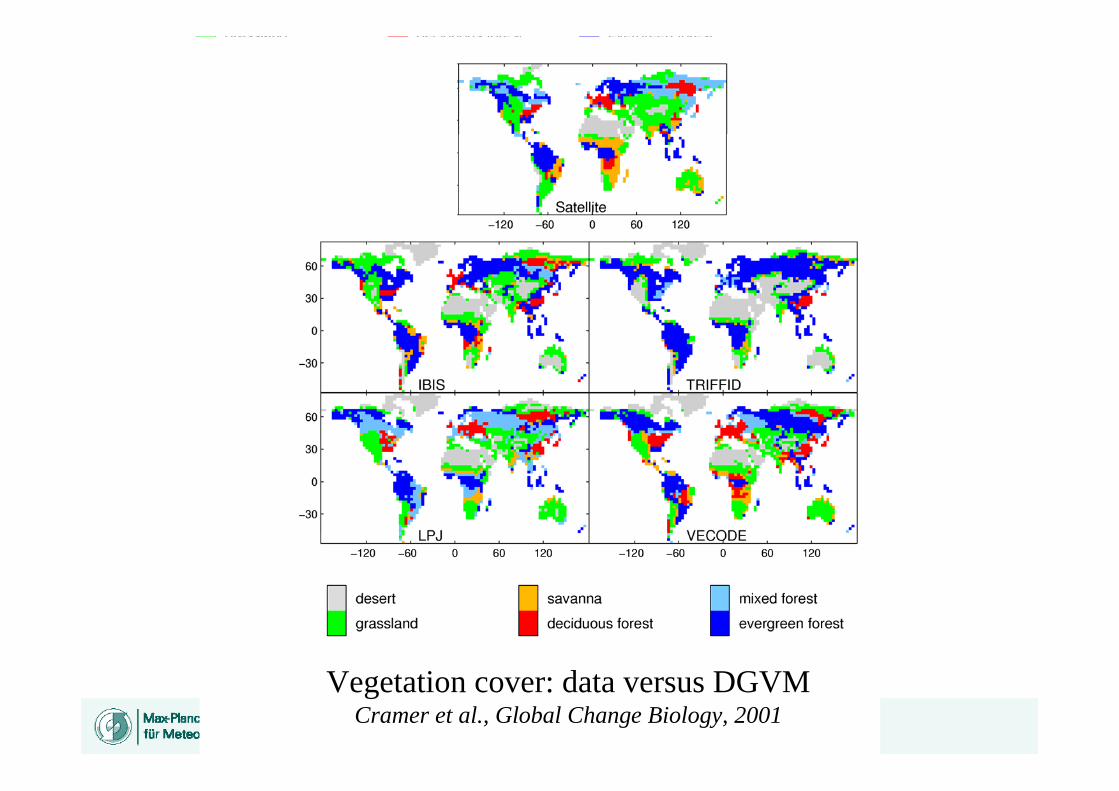
Vegetation cover: data versus DGVMCramer et al., Global Change Biology, 2001

Disturbancies: fire

Fire - Climate impact: Donnelley flat fire Alaska 1997
Randerson et al., Science 2008

Annual area burned: model (CLM-CN) vs dataC
LM-C
NO
bser
vatio
nsSa
telli
te b
ased
L3JRC – SPOT VEGGFEDv2 - MODIS
AB-HI-FS
[%]
Kloster et al., Biogeosciences, 2010
[%]
[%]

FPC1
FPC2FPCi
Land area excluded from vegetation dynamics (e.g. crops & pastures, glaciers)
FPCn
Fast variable: Bare soil, Bs
Slow variable: Desert or bare ground, Bg
Tiling of land surface
ECHAM land grid cell
damagedi
burntiii
i FPCFPCFPCMORTFPCESTdt
dFPC −−−= )()(
MPI-ESM: model of vegetation dynamics
FPC – fractional projection cover of i-th plant functional type (PFT)
Brovkin et al., GRL, 2009
Bonan, 2008

PFT dynamics in phase space
⎪⎪⎩
⎪⎪⎨
⎧
−=
−−−=
(...)(...) iii
ii
iai
i
MORTESTdt
dFPC
DCRGPPdt
dCτ
potential equilibrium in absence of climate variability
actual „mixed“ equilibriuminduced by disturbances
0
1
FPC(PFT1) –dominant PFT
FPC(PFT2)
1
Carbon dynamics
Dynamics of PFT fraction(FPC – fractional projection cover)
Brovkin et al., GRL, 2009

MPI-ESM: simulated bare ground fraction
MODIS data (bare)
Model (desert+bare soil)
Coupled modelECHAM5-MPIOM-JSBACH-DYNVEG
Hansen et al., 2006, Vegetation Continuous Fields
Brovkin et al., GRL, 2009

MODIS data (tree)
Model (tree - crops)
Coupled modelECHAM5-MPIOM-JSBACH
Hansen et al., 2006, Vegetation Continuous Fields
MPI-ESM: simulated tree fraction
Brovkin et al., GRL, 2009

MPI-ESM SRES A2 simulations until 2300
Ulrike Port, in progress
Change in tree fraction, 2120
Change in tree fraction, 2300
CONTROLDYNAMIC VEGETATIONFIXED VEGETATION
CONTROLDYNAMIC VEGETATIONFIXED VEGETATION
Global annual surface air temperature
Atmospheric CO2 concentration

Projected changes in tree and grass cover, 2100 - 1850
Sitch et al., GCB, 2008
TRIFFID DGVM (Hadley Centre, UK)
LPJ DGVM
Hadley Centre climate projection, SRES A1F1 scenario

Global N cycle
Gruber and Galloway, Nature, 2008

NEP simulated by 6 DGVMs
Cramer et al., GCB, 2001
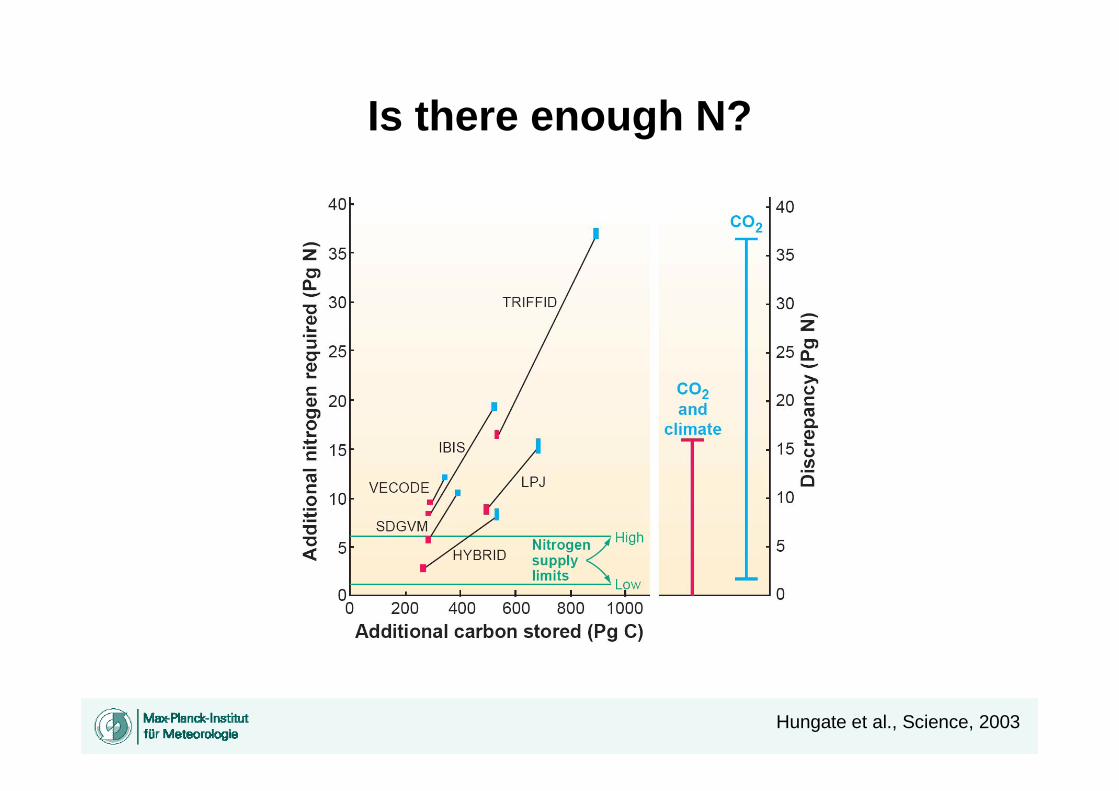
Is there enough N?
Hungate et al., Science, 2003

Adding N cycle to land ecosystem models
Sokolov et al., GBC, 2008

Depositions of reactive nitrogen
(Galloway et al. 2004)
mgN
/m2= 10
-2kgN/ha
In 1860
In early 1990s

Deposition of reactive nitrogen
Galloway et al., 2004
Kg N/ha
20002030
Kg N/ha

Churkina et al., GBC, 2009
in 2030
Nhigh
CO2
Clim
Clim+CO2+Nhigh
Vegetation
Potential Present
Synergy of rising N deposition and atmospheric CO2on land C uptake offsets global warming

Synergy of rising N deposition and atmospheric CO2on land C uptake offsets global warming
Churkina et al., GBC, 2009
in 2030

Summary• ESM estimate fluxes of carbon based on photosynthesis
– conductance models• At present, land is a sink for carbon• A recent progress in trait databases provide better
constraints on the carbon cycle• For future emission scenarios, ESMs project
– a shift of boreal forests to the north– a reduction of Amazon forest– Changes in drylands are not certain
• N limitation is an emerging part of the carbon cyclesimulations

Outlook
• Next lecture - by Thomas Kleinen– Anthropogenic landuse and ist impact on
climate– Ruddiman‘s hypothesis
Recommended