Vietjet Aviation JSC (VJC: HSX)
sd
FULL REPORT 01/04/2019
Nguyen Anh Tung – Analyst
Vietjet Air has currently been the
the second largest aviation
company in Vietnam in 2018
Passenger transportation is
expected to keep growing with
the support from the
international market
The ancillary segment will likely
maintain a strong growth, which
benefits from international
market expansion.
VJC will continue to gain a large
revenue from selling aircrafts
Risks
Founded in 2007, with the first flight taking off in 2011, after 7 years of operation,
VJC has become the second biggest aviation company in Vietnam. In 2018, VJC
ranked second in terms of market share (40.1%), after Vietnam Airlines with 43.1%.
Revenue in 2018 of passenger transport reached VND 25,031 billion, up by 48.5%
yoy, CAGR in four years hits 44%. VJC’s strategy turning to stimulate operation in
the international market is very potential with CAGR reaching 138.6% in 2014-
2017. Low operating cost can be considered a strong competitive advantage thanks
to young fleet age and low labor costs together with high aircraft operating
efficiency.
Revenue of the ancillary segment in 2018 hit VND 8,370 billion, gaining 52.8% yoy,
four-year CAGR was 63.1%. Focusing on international markets will boost ancillary
growth due to higher demand in the international market compared to the
domestic market.
2018 revenue gained from aircraft sale was VND 18,512 billion, losing 6.2% yoy,
four-year CAGR was 80.1%. In the next years, VJC will still gain revenue from sale
and lease back (SLB) as the number of reserved purchase orders of VJC was 270
aircrafts including 200 Boeing 737 aircrafts and 70 Airbus ones.
There are some risks in VJC operation: (1) Risks from fuel price; (2) Financial risks
from SLB and the number of ordered aircrafts; (3) Risks from changes of accounting
standards; (4) Risks from aircraft providers.
Hold
Target price 121,350 VND
Target price 4.20%
Up/Down 116,500 VND
Current price (29/03/2019) 121,350 VND
Target price
63,098 bn VND
(2,71 bn USD)
Exchange rates on 01/04/2019: 1USD = 23,260 VND
Trading data
Outstanding share volume 541,611,334
3-month average trading
volume 686,627
% foreign ownership 21.65%
334 VND
Forecast revenue
FY-End 2017A 2018A 2019F 2020F
NII (bil VND) 42,303 52,388 66,393 111,170
Growth rate (%) 53.83% 23.84% 26.73% 67.44%
Total operating income
(VND bn)
6,549 7,536 9,462 13,607
CIR (%) 15.48% 14.39% 14.25% 43.81%
Net profit (VND bn) 5,074 5,217 6,061 8,054
Growth rate (%) 103.27% 2.82% 16.18% 32.88%
EPS (VND thousand) 11,241 9,632 10,173 12,290
BVPS (VND thousand) 35.1% -14.3% 5.6% 20.8%
P/B 10.66 12.44 11.78 9.75
% of price change
(%) 1M 3M 6M 12M
VJC -1.9% 5.6% -1.9% 5.6%
VNINDEX -8.1% 4.6% -8.1% 4.6%
Source: KBSV
KBSV RESEARCH
2
I. OVERVIEW
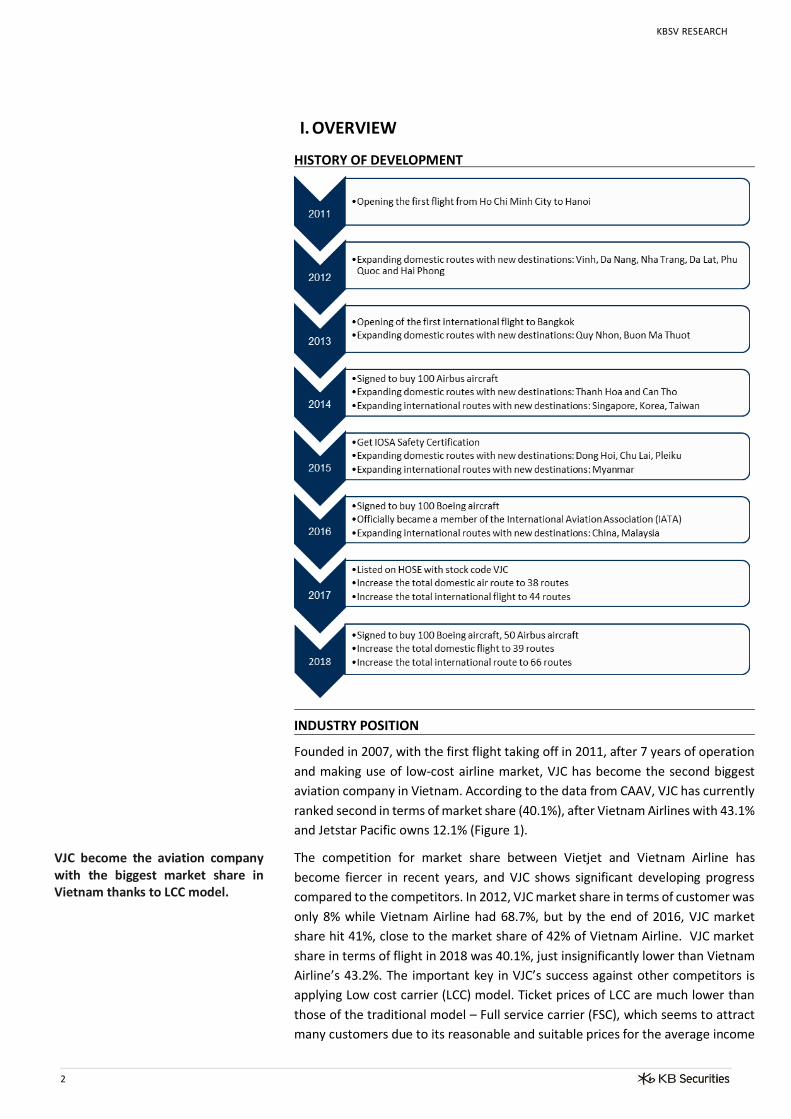
HISTORY OF DEVELOPMENT
INDUSTRY POSITION
VJC become the aviation company with the biggest market share in Vietnam thanks to LCC model.
Founded in 2007, with the first flight taking off in 2011, after 7 years of operation
and making use of low-cost airline market, VJC has become the second biggest
aviation company in Vietnam. According to the data from CAAV, VJC has currently
ranked second in terms of market share (40.1%), after Vietnam Airlines with 43.1%
and Jetstar Pacific owns 12.1% (Figure 1).
The competition for market share between Vietjet and Vietnam Airline has
become fiercer in recent years, and VJC shows significant developing progress
compared to the competitors. In 2012, VJC market share in terms of customer was
only 8% while Vietnam Airline had 68.7%, but by the end of 2016, VJC market
share hit 41%, close to the market share of 42% of Vietnam Airline. VJC market
share in terms of flight in 2018 was 40.1%, just insignificantly lower than Vietnam
Airline’s 43.2%. The important key in VJC’s success against other competitors is
applying Low cost carrier (LCC) model. Ticket prices of LCC are much lower than
those of the traditional model – Full service carrier (FSC), which seems to attract
many customers due to its reasonable and suitable prices for the average income

KBSV RESEARCH
3
of Vietnamese people.
Figure 1: Market shares in terms of flight number of aviation companies in 2018
Source: CAAV
REVENUE STRUCTURE
VJC has operated as Low Cost Carrier with revenue coming from: (1) Passenger
transport segment (2) Ancillary services segment; (3) Sale and lease back - SLB. In
2018, the customer carrier segment contributed 47.8% of the total revenue;
ancillary services brought about 16.3%; Aircraft selling earned 35.3% revenue
(Figure 2).
Figure 2: VJC revenue structure in 2014-2018
Source: VJC
50.3%
47.4%
43.2%
32.3%
35.9%
40.1%
12.9%
12.2%
12.1%
4.6%
4.5%
4.6%
0 50,000 100,000 150,000 200,000 250,000 300,000 350,000
2016
2017
2018
Vietnam Airline Vietjet Air Jetstar Vasco

KBSV RESEARCH
4
OWNERSHIP STRUCTURE
VJC has a current charter capital of VND5,416 billion, in which domestic
shareholders hold 78.35%, and foreign shareholders have the rest. Sunflower
Sunny Investment Ltd is the biggest shareholder with 28.6% shares. Vice chairman
of the BoD and CEO Nguyen Thi Phuong Thao owns 8.76% and Sovico JSC holds
7.59%. GIC/Government of Singapore is the biggest foreign shareholder of VJC
with 4.97% shares.
Figure 3: Vietjet Air JSC ownership structure
Source: Fiinpro
II. BUSINESS OPERATION
OPERATING MODEL
LCC in Vietnam in specific and in ASEAN countries in general hit the highest growth rate
VJC achieved high growth rates thanks to LCC model, which has many
advantages over the traditional model FSC.
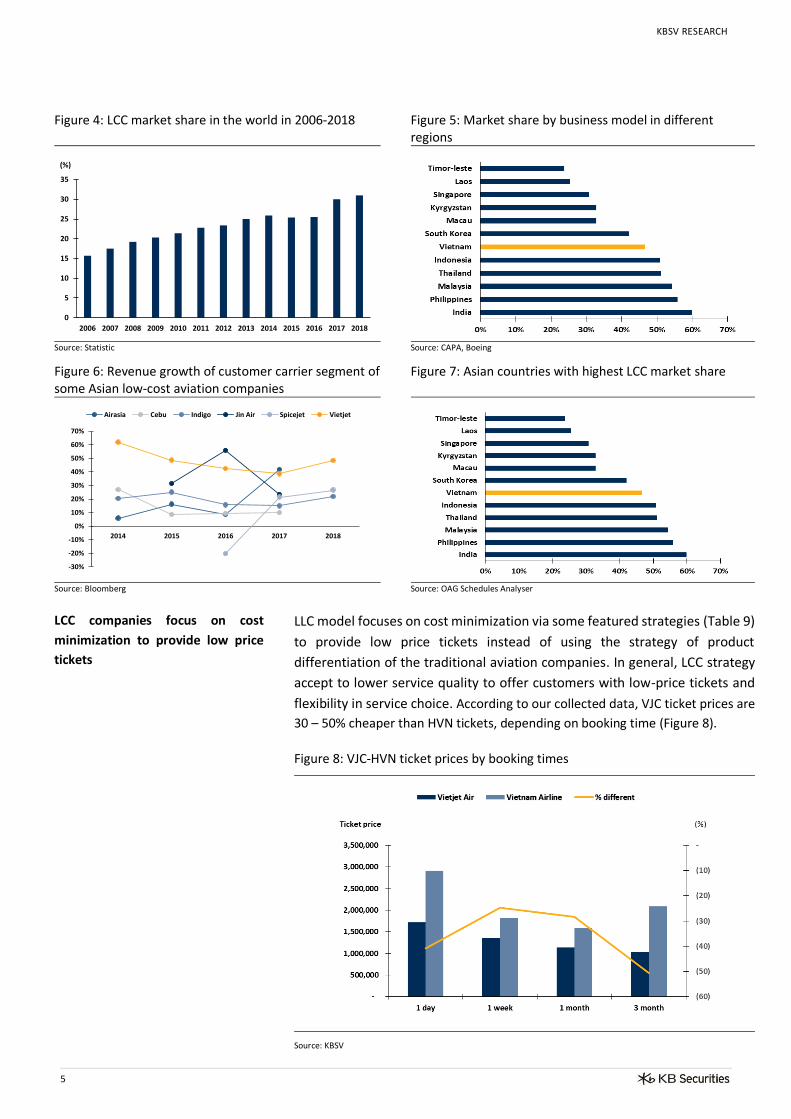
LCC model has become more and more developed in many countries in the world.
In 2006, LCC enterprises’ market share only reached 15.7%, but in 2018, the
market share of LCC industry was 31% (Figure 4). LCC in Vietnam in specific and in
ASEAN countries in general hit the highest growth rate. At the moment, ASEAN is
the region with highest LCC growth, accounting for 53% of the aviation
transportation market share (Figure 5) with many companies of the same sector
reaching two-digit growth rate in recent years (Figure 6). The main reason is that
ASEAN is highly populated, and a significant part has mid-low income, so the
demand for LCC products is higher than that in other regions of the world.
According to Airbus forecast, the general growth of the whole aviation sector in
Asia-Pacific region in 2016-2026 will still rank second in the world, reaching 6.2%
per year, which shows the potential growth of the whole sector and LCC.
KBSV RESEARCH
5
Figure 4: LCC market share in the world in 2006-2018 Figure 5: Market share by business model in different regions
Source: Statistic
Source: CAPA, Boeing
Figure 6: Revenue growth of customer carrier segment of some Asian low-cost aviation companies
Figure 7: Asian countries with highest LCC market share
Source: Bloomberg
Source: OAG Schedules Analyser
LCC companies focus on cost
minimization to provide low price
tickets
LLC model focuses on cost minimization via some featured strategies (Table 9)
to provide low price tickets instead of using the strategy of product
differentiation of the traditional aviation companies. In general, LCC strategy
accept to lower service quality to offer customers with low-price tickets and
flexibility in service choice. According to our collected data, VJC ticket prices are
30 – 50% cheaper than HVN tickets, depending on booking time (Figure 8).
Figure 8: VJC-HVN ticket prices by booking times
Source: KBSV
0
5
10
15
20
25
30
35
2006 2007 2008 2009 2010 2011 2012 2013 2014 2015 2016 2017 2018
(%)
-30%
-20%
-10%
0%
10%
20%
30%
40%
50%
60%
70%
2014 2015 2016 2017 2018
Airasia Cebu Indigo Jin Air Spicejet Vietjet

KBSV RESEARCH
6
Table 9: LCC features
CUSTOMER CARRIER SEGMENT
The number of VJC customers still saw a high growth, 5-year CAGR growth reached 48.9%, and is expected to maintain this growth in the next years
There are signs of a slowdown in domestic operation, VJC redirects its activities to the international flight market
VJC customer carrier segment showed a dramatic growth since the day of
operation. Revenue in 2018 of this segment was VND 25,031 billion, up by 48.5%
yoy, CAGR in four years reached 44% (Figure 11).
The total number of customers of VJC in 2018 hit 23.1 billion people, up by 34%
yoy, CAGR growth in five years was 48.9% (Figure 10). ASK index (Available seat
kilometers), is equal to the number of seats available multiplied by the number of
kilometers flown, reached 26.2 million units in 2018, gaining 36% compared to
that in 2017. Load Factor always stays high at 88%.
There are signs of a slowdown in domestic operation. Revenue growth gained
from customer carrier segment in 2013-2015 rose and then gradually slided to
24.7% in 2017 (Figure 11). In 2013-2016, VJC kept raising the number of domestic
flights, about 8-9 new flight routes. In two years of 2017, 2018, VJC only added
two new airline routes to raise the total number of domestic routes to 39. In other
words, the domestic revenue growth force recently comes from the increase in
the number of customers. Domestic competition is also becoming fiercer as the
airline companies have pushed their full capacity on the main routes causing
overload at airports. Realizing that there is not much room for domestic growth,
Features Impacts
For aircrafts of the same size, the number of seats on LCC
aircrafts is more than that of FSCs. Reasons: (1) LCCs do
not have business class seats, which requires large space
and distance between seats; (2) LCC seat size is smaller
than FSC's, thus saving more area.
Increase the revenue for each flight. An LCC aircraft has an ASK 30-40% higher than
that of a traditional same size aircraft.
Short-range planes have fixed cost/ASK much lower than long-range aircrafts.
Besides, the short flight distance helps to accelerate the round raise the number of
flight hours/day, thereby reducing fixed cost/ASK.
Short-range aircrafts cost less material expenses than long-range aircrafts because
the fuel is heavily dependent on aircraft tonnage. Most short-range airplanes are
small with a narrow area, the volume of of loaded passengers and accompanied
baggage is less than that in long-range aircrafts.
Charge on accompanied services
The decrease in revenue from the cheap ticket price selling is partly offset by
accompanied service fees such as freight charges, food fees ... The total cost in
case customers use all services will be close equal to the total cost when traveling
on a traditional flight, however, it will create more flexibility for customers'
spending.
Only use some certain aircraft types
The use of the same type of aircraft helps LCC airlines: (1) Save the cost of training
flight crew; (2) Increase operational flexibility; (3) Preferential selling price from
the manufacturer when ordering a large number of aircrafts of the same type.
Mainly sell products via online channelsReducing selling and management expenses without commission costs for sales
agents.
Mainly operating short routes, point to point, no transit,
cargo transfer to increase the rounds of aircraft use per
day

KBSV RESEARCH
7
VJC redirects its activities to the international flight market with the new and
continuous opening of 21 and 22 new routes in 2017-2018 to Asian countries such
as Korea, Japan, China..., increasing the total number of international routes to
66. International passenger transport revenue grew strongly with CAGR growth
reaching 138.6% in 2014-2017 (Figure 11).
Figure 10: Customer growth in 2013-2018 Figure 11: Customer carrier revenue growth in 2014-2018
Source: VJC
Source: VJC
The growth force will come from raising intensity of available international flight routes and fleet capacity
We supposed that VJC will still raise the number of international routes, but the
remaining room for development is not very much because VJC has exploited most
of the Asian market, while VJC aircrafts and business determination of LCC are not
suitable for flights to Europe and Americas. Instead, the growth force will come
from raising intensity of available international flight routes. At the moment, load
factor ratio of VJC is 88%, mid-high level compared to other aviation companies,
which means VJC still has much room to develop the volume of customers to raise
the number of flights.
Figure 12: Load Factor ratio in some LCC companies
Source: VJC
75%
80%
85%
90%
95%
100%
Vietjet Air Indigo Air Asia Cebu Air SpiceJet Ryan Air

KBSV RESEARCH
8
ANCILLARY SERVICES
In 2018, revenue was up 52.8% yoy, 4-year CAGR reached 63.1%
Ancillary revenue/passenger is USD11.92/PASK, higher than other Asian LCCs.
Ancillary services play an important role in the demand-supply chain of LCC
services. Vietjet services include: (1) Food, beverages, souvenirs at the airport and
on the airplane; (2) Baggage fees; (3) Travel insurance and other services. Ancillary
revenue has surged in recent years. The difference between LCC and LSC is LCC
charges for most of the provided services, especially good and baggage fees.
2018 revenue reached VND8,370 billion, up by52.8% yoy, 4-year CAGR was 63.1%
(Figure 13). Revenue saw a dramatic increase recently thanks to: (1) The volume
of customers, flights increased as mentioned above; (2) The strategy to develop
international flights. International routes with long flight times and routes make
the demand for luggage and eating services soar. In addition, the price of services
for international routes is also about 30-50% higher than that of domestic routes,
which also contributes to boosting the revenue of ancillary services.
VJC ancillary services has showed high efficiency compared to others in other
regional LCC companies. According to the data by IdeaWork, the ancillary
revenue/passenger of VJC is USD11.92/pask, lower than that of European and
Middle Eastern aviation enterprises, but higher than many Asian ones such as
Indigo, Air Asia, Cebu, SpiceJet… (Figure 14). Besides, the proportion of ancillary
services revenue/total revenue of VJC is 10.9%, which is equal to the average in
the region and higher than Indigo, Cebu, Spring Airline.
Figure 13: Ancillary revenue growth in 2014-2018 Figure 14: Ancillary revenue/passenger
Source: VJC
Source: VJC, Idealwork
SALE AND LEASE BACK (SLB)
In recent years, Vietjet has continuously recorded large profits from aircraft sale
to the third partner and leasing back. 2018 revenue came aircraft sale was VND
18,512 billion, down by 6.2% yoy, 4-year CAGR was 80.1% (Figure 16). Gross profit
from aircraft sale in 2018 was VND 2,880 billion, down by 15.2% yoy.
KBSV RESEARCH
9
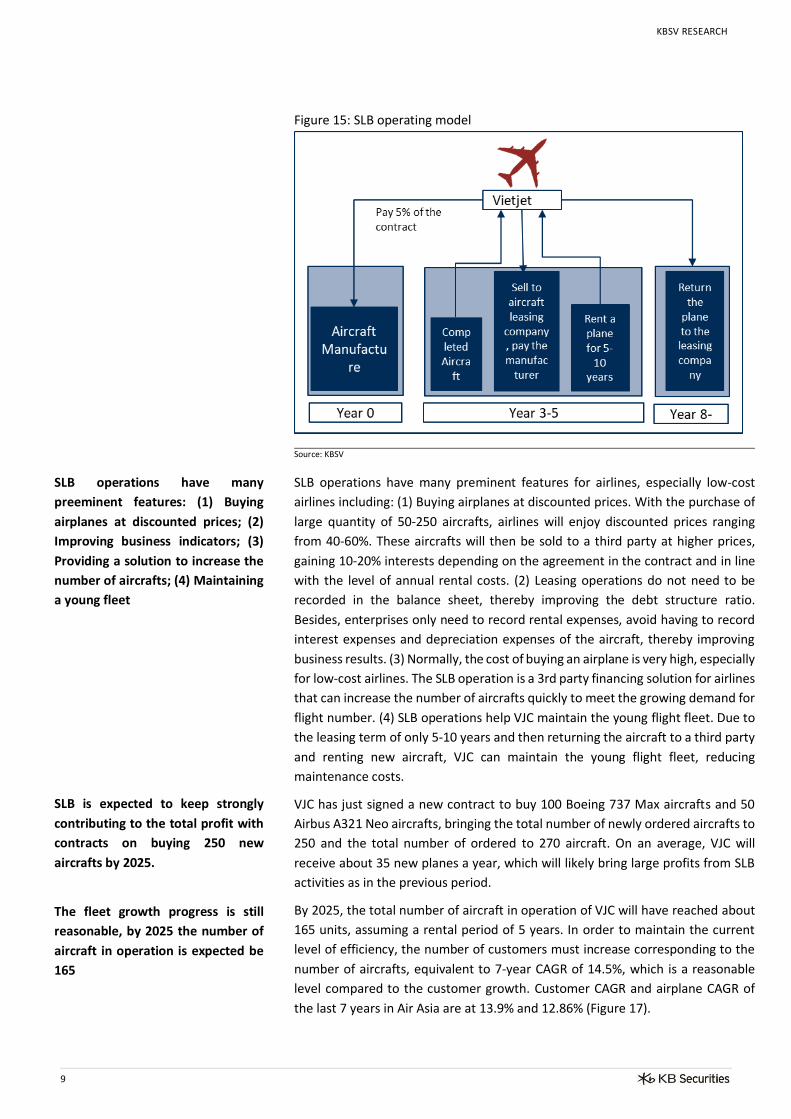
Figure 15: SLB operating model
Source: KBSV
SLB operations have many
preeminent features: (1) Buying
airplanes at discounted prices; (2)
Improving business indicators; (3)
Providing a solution to increase the
number of aircrafts; (4) Maintaining
a young fleet
SLB is expected to keep strongly
contributing to the total profit with
contracts on buying 250 new
aircrafts by 2025.
The fleet growth progress is still
reasonable, by 2025 the number of
aircraft in operation is expected be
165
SLB operations have many preminent features for airlines, especially low-cost
airlines including: (1) Buying airplanes at discounted prices. With the purchase of
large quantity of 50-250 aircrafts, airlines will enjoy discounted prices ranging
from 40-60%. These aircrafts will then be sold to a third party at higher prices,
gaining 10-20% interests depending on the agreement in the contract and in line
with the level of annual rental costs. (2) Leasing operations do not need to be
recorded in the balance sheet, thereby improving the debt structure ratio.
Besides, enterprises only need to record rental expenses, avoid having to record
interest expenses and depreciation expenses of the aircraft, thereby improving
business results. (3) Normally, the cost of buying an airplane is very high, especially
for low-cost airlines. The SLB operation is a 3rd party financing solution for airlines
that can increase the number of aircrafts quickly to meet the growing demand for
flight number. (4) SLB operations help VJC maintain the young flight fleet. Due to
the leasing term of only 5-10 years and then returning the aircraft to a third party
and renting new aircraft, VJC can maintain the young flight fleet, reducing
maintenance costs.
VJC has just signed a new contract to buy 100 Boeing 737 Max aircrafts and 50
Airbus A321 Neo aircrafts, bringing the total number of newly ordered aircrafts to
250 and the total number of ordered to 270 aircraft. On an average, VJC will
receive about 35 new planes a year, which will likely bring large profits from SLB
activities as in the previous period.
By 2025, the total number of aircraft in operation of VJC will have reached about
165 units, assuming a rental period of 5 years. In order to maintain the current
level of efficiency, the number of customers must increase corresponding to the
number of aircrafts, equivalent to 7-year CAGR of 14.5%, which is a reasonable
level compared to the customer growth. Customer CAGR and airplane CAGR of
the last 7 years in Air Asia are at 13.9% and 12.86% (Figure 17).

KBSV RESEARCH
10
Figure 16: Business performance of aircraft selling segment in 2014-2018
Figure 17: AirAsia aircraft number growth in 2011-2018
Source: VJC, KBSV
Source: AirAsia, KBSV
III. BUSINESS PERFORMANCE & FINANCIAL STATUS
Revenue in 2018 rose 23.8% yoy,
NPAT increased 2.8% yoy, 5-year
CAGR reached 176.6%.
Total assets reached VND 39,222
billion, gaining 23.9% compared to
the beginning of the period with
more than VND7,000 billion in cash.
The debt/asset ratio of VJC was
64.5%. The off-balance sheet items
related to the total liabilities of
aircraft leasing is VND49,682 billion,
and the payables in the next 5 years
are VND25,600 billion
2018 net revenue was VND52,388 billion, gaining 23.8% yoy, which is the sixth
consecutive growth since the first flight in 2012. Revenue CAGR in five years
reached 69% (Figure 18). Revenue growth in 2018 seemed to slow down due to a
decrease of 6% yoy in aircraft selling segment, while aviation carrier and ancillary
services gained 48.5% and 52.8% yoy. 2018 gross profit hit 14.4%, losing 1% over
2017, resulting from a decrease in the gross revenue from selling aircrafts.
Financial and management expenses are maintained at 2% of total revenue
(Figure 19). NPAT in 2018 reached VND 5.217 billion, climbing by 2.8% yoy, 5-year
CAGR of NPAT was 176.6% (Figure 20).
The total assets by the 4Q/2018 was VND 39,222 billion, rising 23.9% compared
to previous year. Receivables took the largest proportion in the total assets,
mainly of which were deposits to buy aircrafts and aircraft maintenance fund. In
2018, there was VND990 billion added to short-term investment items to invest
in PV Oil. VJC has currently owned a large amount of cash + deposits of more than
VND7,000 billion, equal to 17.8% of the total assets, which ensures the ability to
finance business activities when necessary.
By the end of 2018, debt/asset ratio of VJC was 64.5%, down by 2% compared to
that in 2017 and down by 11.9% compared to that in 2016. The main reason is
that the undistributed profits increased sharply during this period, which also
raised the total equity. VJC's current payment ratio and quick payment ratio hit
1.24 and 1.2 respectively, which indicated that VJC is capable of paying due debts.
The off-balance sheet items related to the total liabilities of aircraft leasing is VND
49,682 billion, increasing by 9% compared to that in 2017 and up by 176%
compared to that in 2016. VJC has to pay VND25,600 billion in the next 5 years,
equal to VND 5,000 billion a year on average (Figure 21). These are all non-
cancelable debt contracts, the cost is included in the cost price, which requires
VJC to maintain high revenue so as not to affect gross profit margin.

KBSV RESEARCH
11
Figure 18: VJC – HVN revenue growth Figure 19: Gross profit margin & Cost in 2013-2018
Source: VJC, HVN
Source: VJC
Figure 20: VJC - HVN NPAT growth Figure 21: Payables of leasing aircrafts in 2014-2018
Source: VJC, HVN
Source: VJC
IV. INVESMENT VIEWPOINT
Barriers for domestic firms to enter the industry are supporting factors for VJC to maintain growth
Passenger transport segment is expected to maintain growth momentum in the next 2-3 years
Vietnam's air transport market is highly concentrated with only 5 active airlines
including the new airline named Bamboo Airline, much less than that in other
regional countries. Although the industry outlook is very positive, the lack of
infrastructure is a barrier for domestic enterprises to enter the industry. For
example, Vietstar business license was postponed until Tan Son Nhat airport
completed the expansion. Barriers for domestic firms to enter the industry are the
basis for VJC and HVN to maintain growth.
We suppose that VJC will continue grow sustainably and improve its passenger
transport market share in the next 2-3 years, based on: (1) Low-cost aviation suits
Vietnamese consumption habits; (2) Vietnam's domestic and international
tourists are in a strong growth phase. According to the Vietnam National
Administration of Tourism, in 2018, the number of domestic tourists gained 9.6%
yoy, 5-year CAGR reached 18% while the volume of international visitors rose
19.9% yoy, 5-year CAGR reached 15.4% (Figure 22); (3) The market share of LCCs
in Vietnam has surged in recent years but is still lower than that in many countries
in the region such as India, Malaysia, Philippines, Thailand... (Figure 7); (4) The
competition is not very fierce in the short term. Currently, VJC has only 2
competitors in the LCC segment: Jetstar Pacific and Bamboo Airline. Meanwhile
Jetstar does not show great efficiency and competitiveness, Bamboo Airline has
just joined the industry and needs time to develop its network and fleet.

KBSV RESEARCH
12
Figure 22: Vietnamese tourist growth 2010-2018 Figure 23: The number of domestic and international flight routes of VJC in 2013 - 2018
Source: Administration of Tourism, KBSV
Source: VJC
VJC is competitive in the
international market due to its
relatively lower operating costs
compared to its competitors thanks
to the advantage of having a young
fleet and low labor costs
Ancillary services will maintain a
high growth thanks to stimulated
international flights.
SLB operations are expected to earn
profits for the company via newly
signed agreements to buy 250
aircrafts by 2025
At the moment, VJC has a low operating cost compared to other LCCs, CASK of VJC
hit USD4, higher than that of AirAsia and Ryan Air (Figure 24). We believe that VJC
has two main competitive advantages to secure low operating cost: (1) Young fleet
helps to reduce the cost of maintenance. VJC is currently at the top airlines with
youngest fleet of 2.82 years in 2018, lower than the average level in Asian - 5.78
years and 5.46 years in Europe and Middle East (Figure 25). In the next few years,
VJC will continue to replace old aircrafts with new ones via new purchase orders,
which helps to maintain the young age of the fleet as in present. (2) VJC's
personnel costs are relatively low compared to other businesses. VJC's personnel
cost/revenue ratio reached 0.07, just higher than that of Cebu Pacific and much
lower than other brands (Figure 26). In addition, VJC's turnaround efficiency is
better, one VJC aircraft generates USD22.8 million/ year on average, which is
higher than the figures of other industry peers (Figure 27).
In our opinion, ancillary services will maintain a high growth as VJC will keep
focusing on international routes. As mentioned above, the room for development
of domestic business is not much and international routes exploitation will be the
main force of VJC. Therefore, ancillary services will be stimulated as the demand
for services of foreign passengers is much higher compared to domestic
passengers’.
VJC has just signed agreements to buy 100 new Boeing 737 Max aicrafts and 50
Airbus A321 Neo aicrafts, rasing the number of new aircrafts to 250 and the
number of ordered aircrafts to 270. VJC will receive about 35 aicrafts annually,
which will earn more profit from SLB operations as in the previous period.

KBSV RESEARCH
13
Figure 24: RASK-CASK of LCCs Figure 25: Fleet ages of some LCCs in the world
Source: VJC
Source: VJC
Figure 26: Personnel cost/revenue Figure 27: Revenue/number of aircrafts
Source: Bloomberg, KBSV
Source: Bloomberg, KBSV
V. RISKS
Risks from oil price fluctuation
SLB operations with high renting
costs and new aircraft orders will
create a large financial pressure on
VJC business.
We assess that VJC's business will face some main risks as follows:
The main fuel, which is oil, accounts for the largest proportion, about 42% of VJC's
operating cost structure (Figure 28). The current average oil prices is at USD65.3
per barrel. Unstable supply - demand balance in the world, OPEC's decisions on
supply cuts and sanctions against Iran may lead to an upward trend in oil prices in
2019. We assess the impact of oil prices on VJC's business activities at the average
level. The reason is that VJC's fares are quite low compared to other low-cost
airlines. VJC's RASK in 2018 reached 4.47, higher than that in Air Asia and Cebu
Pacific but lower than many others such as Ryan Air, Spice Jet, and Nok. Low ticket
prices help VJC to flexibly adjust prices to balance the fluctuation in fuel prices.
However, price adjustment needs to be carefully considered when VJC boosts its
operations in the international market. In addition, fuel cost/ASK for international
routes will be lower due to no import taxes and environmental fees imposed. At
present, VJC has to pay fuel taxes when buying domestically including 10% import
tax on fuel and an environmental tax of VND 3,000/liter equivalent to 25.6%.
From our viewpoint, the prevailing number of VJC orders by 2025 reaching 250
aircrafts is reasonable, which requires VJC to maintain an average customer
growth of more than 14.5% in the next seven years. However, given that many
international experienced LCCs with strong distribution system like Air Asia have
been trying to penetrate into Vietnam market, and the launch of Bamboo Airway
will also create a large pressure on VJC passenger growth in the mid-term.
Furthermore, if the economy becomes weaker, the number of passengers using
4.47
3.54
5.13
3.78
5.565.16
4.42
6.76
5.72
8.55
6.18
2.21.94
2.362.74
3.42
2.82
4.29 4.1
3.46
5.54 5.4
4
3.07
3.98 4.02
4.74 4.56
5.595.83
5.15
7.13 7.2
0
1
2
3
4
5
6
7
8
9
RASK CASK-ex fuel CASK(USD)
-
0.02
0.04
0.06
0.08
0.10
0.12
0.14
0.16
VJC Air Asia Ryan Air Cebu Air Spice Jet Indigo
-
5.0
10.0
15.0
20.0
25.0
VJC Air Asia Ryan Air Cebu Air Spice Jet Indigo
(million USD)

KBSV RESEARCH
14
The risks from changing accounting
standard to IFRS 16 may affect VJC
debt and revenue structure.
VJC's fleet increasing progress may
be heavily affected by Boeing air
crashes.
air transportation services will decrease, leading to a decrease in the occupancy
rate as well as a decrease in the number of flights while VJC still has to bear the
high cost of renting aircrafts, causing the financial burden more serious, and
strongly affecting business results as well as cash flow of the company.
Regulations of IFRS 16, effective from January 01, 2019, clarified that SLB
activities, regardless of form, must be accounted for in the form of financial
leasing. Decision No.480/QD-TTg by the Ministry of Finance, Vietnam Accounting
Standards (VAS) will partially apply IFRS (about 30 criteria) in 2020-2023 before
applying all criteria in 2023-2025. If IFRS are applied, VJC's debt structure will
change drastically because VJC's current off-balance-sheet debt is VND49,682
billion (calculated data by the end of 2Q/2018). The ratio of liabilities/total assets
after the adjustment reached 84.7%, much higher than the current rate of 64.5%.
In addition, according to IFRS 16 criteria, earnings from the sale of aircraft in SLB
operations will be recorded as a loan, not recorded as revenue, thereby making
VJC unable to record profits from SLB operations.
In the past six months, there have been two serious air crashes of Lion Air and
Ethiopian Air, which killed nearly 350 people. In particular, the two accidents took
place with the same aircraft type, Boeing 737 MAX. This is the type that VJC has
ordered 100 aircrafts with Boeing, and they are expected to be received in
October 2019. Currently, some countries such as the US, China, Singapore,
Indonesia, and Vietnam have issued a temporary order to ban all Boeing 737 Max
aircrafts from flying in their airspace until specific causes of the accidents are
found. In a negative case, the Boeing 737 aircraft actually had a technical error
and needs time to be fixed, VJC will not be able to receive new Boeing aircrafts at
the end of the year. Instead, the company may hire aircrafts from other sources
to meet the fleet needs, but must pay higher rental rates due to rising rental
demand as a series of other airlines have to stop using Boeing 737 MAX aircrafts.
Figure 28: VJC cost structure in the 2Q/2018 Figure 29: Brent oil fluctuation in 2016 - 2019
Source: VJC
Source: Bloomberg
30
40
50
60
70
80
90
18
/03
/20
16
18
/05
/20
16
18
/07
/20
16
18
/09
/20
16
18
/11
/20
16
18
/01
/20
17
18
/03
/20
17
18
/05
/20
17
18
/07
/20
17
18
/09
/20
17
18
/11
/20
17
18
/01
/20
18
18
/03
/20
18
18
/05
/20
18
18
/07
/20
18
18
/09
/20
18
18
/11
/20
18
18
/01
/20
19

KBSV RESEARCH
15
NPAT of VJC in 2019 is expected to be VND 6,061 billion, up 16.2% yoy, EPS forward is 10,173 VND per share.
VI. VALUATION
2019 FORECAST BUSINESS PERFORMANCE
In 2019, we estimate VJC to reach VND66,393 billion, up by 26.73% yoy, based on:
The revenue gained from passenger carrier will continue to achieve high growth
rates of 40% based on the assumption: (1) The number of airplanes goes up from
64 to 78; (2) and the efficiency of international flight routes is improved.
The revenue form ancillary segment will hit VND 12,839 billion, up by 50% thanks
to increased passenger volume and stimulated operations in international markets
for higher ancillary service cost/ASK.
Revenue from airplane selling may reach VND 18,512 billion, unchanged compared
to that in 2018 if the gross margin from aircraft selling is unchanged and VJC
receives 14 new aircrafts in 2019, equal to the relevant number in 2018.
EBT is expected to be VND 6,773 billion, gaining 16.18% yoy. NPAT of the parent
company is about VND 6,061 billion, climbing 16.2% yoy, EPS is projected to reach
VND 10,173 per share.
Table 30: Forecast business performance in 2019
Source: KBSV
VALUATION
FCFE
EV/EBITDA comparison
We used two valuation methods which are FCFE and EV/EBITDA comparison
among LLCs in the world.
We used the discounted cash flow method - FCFE, thereby eliminating the impact
of the increased profit from SLB operations on the free cash flow of the business.
The price is estimated at VND 138,201/share. Cost of equity is 14.2% based on the
assumption: The risk-free rate is 4.8%, equivalent to 10-year government bond
rate; The expected return of the market is 13.9%, equivalent to the market average
rate in 8 years; VJC's beta is 1.03; the long-term growth rate is 3%.
VJC shares are currently traded at EV/EBITDA of 10.6x and expected EV/EBITDA
forward in 2019 at 8.76x, which are higher than that in other peers (7.75x.)
VJC is the leading enterprise in air transportation of Vietnam. We believe that the
room for development of VJC is still very large as the potential growth of tourism
in Vietnam is high, and VJC changed to stimulate international flight routes. Based
on the valuation, business outlook and the potential risk assessment, we
Billion VND 2015 2016 2017 2018 2019F
Revenue 19,845 27,499 42,303 52,388 66,393
Cost of good sold 17,736 23,597 35,753 44,852 56,932
Gross margin 2,110 3,902 6,549 7,536 9,462
Selling Expense 318 518 579 714 1,110
Administrator Expense 203 189 226 330 410
Financial Expense/profit (408) (509) (402) (589) (1,136)
Profit from affiliated companies (21) (15) (44) (81) (34)
Net profit before tax 1,168 2,703 5,303 5,829 6,773
NPAT of parent company 1,170 2,496 5,073 5,217 6,061

KBSV RESEARCH
16
recommend to HOLD VJC shares with the target price of VND 121,300 per share,
4.2% higher than that in 29/03/2019.
Table 31: FCFE assumption
Table 32: A relative comparison of EV/EBITDA in different LLCs
Source: Bloomberg, KBSV
Table 33: VJC valuation
Source: KBSV
Assumption Value
Cost of Equity 14.2%
Risk free rate 4.8%
Market risk premium 9.10%
Beta 1.03
Long term growth rate 3%
Time forecast 7 year
AirlineMarket capitalization (Billion
VND)EV/EBITDA Proportion
EV/EBITDA based on
proportion
AirAsia Group Bhd 52,899 3.91 5% 0.201
easyJet PLC 143,646 4.86 14% 0.677
Jeju Air Co Ltd 20,259 3.15 2% 0.062
Cebu Air Inc 21,915 4.39 2% 0.093
Spring Airlines Co Ltd 111,563 10.14 11% 1.098
Norwegian Air Shuttle ASA 14,152 7.79 1% 0.107
SpiceJet Ltd 15,801 8.81 2% 0.135
JetBlue Airways Corp 119,688 4.05 12% 0.470
Ryanair Holdings PLC 361,919 7.84 35% 2.754
InterGlobe Aviation Ltd 168,838 13.14 16% 2.153
EV/EBITDA average 7.749
Method Estimated price Proportion Proportion price
EV/EBITDA 104,500 50% 52,250
FCFE 138,201 50% 69,101
Target price 121,351

KBSV RESEARCH
17
APPENDIX Financial statement
Income Statement Balance Sheet
(VND billion) 2015 2016 2017 2018 (VND billion) 2015 2016 2017 2018
Net sa les 19,845.48 27,499.30 42,302.57 52,387.83 CURRENT ASSETS 6,257.86 10,313.47 17,668.64 19,789.15
Cost of sa les ######### -23,597.46 -35,753.18 -44,851.55 Cash and cash equiva lents 923.51 2,741.34 6,861.60 7,164.92
Gross Profi t 2,109.94 3,901.84 6,549.40 7,536.28 Short-term investments 270.00 1.40 1.40 816.90
Financia l income 153.68 144.66 118.68 466.05 Accounts receivable 4,691.41 7,128.76 10,223.45 11,009.13
Financia l expenses -561.57 -653.95 -520.76 -1,055.43 Inventories 164.43 137.93 267.18 421.92
of which: interest expenses -129.70 -180.73 -237.60 -257.51 LONG-TERM ASSETS 5,787.00 9,749.23 13,989.62 19,433.27
Gain/(loss ) from joint ventures (from 2015) -20.61 -14.61 -44.28 -80.58 Long-term trade receivables 2,885.23 5,104.77 7,152.67 9,290.44
Sel l ing expenses -317.84 -517.79 -578.78 -713.66 Fixed assets 28.96 1,047.22 1,528.72 2,700.13
Genera l and admin expenses -203.35 -188.80 -225.81 -330.41 Investment properties 0.00 0.00 0.00 0.00
Operating profi t/(loss ) 1,160.24 2,671.35 5,298.45 5,822.25 Long-term incomplete assets 137.35 181.30 222.03 1,263.60
Other incomes 8.38 31.85 5.75 7.86 Long-term investments 8.42 68.42 68.42 68.42
Other expenses -0.14 -0.05 -1.55 -0.83 TOTAL ASSETS 12,044.86 20,062.70 31,658.27 39,222.42
Net other income/(expenses) 8.24 31.80 4.19 7.03 LIABILITIES 9,897.42 15,328.68 21,064.13 25,297.81
Income from investments in other enti ties 0.00 0.00 0.00 0.00 Current l iabi l i ties 6,393.87 10,570.08 13,911.51 15,916.14
Net accounting profi t/(loss ) before tax 1,168.48 2,703.15 5,302.64 5,829.28 Trade accounts payable 425.83 391.12 560.25 878.99
Corporate income tax expenses 2.15 -207.16 -228.99 -612.51 Advances from customers 169.27 306.91 456.36 688.67
Net profi t/(loss ) after tax 1,170.63 2,495.99 5,073.65 5,216.77 Short-term unreal ized revenue 662.23 1,306.84 1,964.46 2,732.38
Minori ty interests 0.38 0.35 0.29 0.05 Short-term borrowings 3,543.47 6,102.39 6,897.23 5,852.14
Attributable to parent company 1,170.25 2,495.64 5,073.36 5,216.71 Long-term l iabi l i ties 3,503.56 4,758.60 7,152.62 9,381.66
Long-term trade payables 0.00 0.00 0.00 0.00
Operating statistics & Ratios Long-term advances from customers 0.00 0.00 0.00 0.00
2015 2016 2017 TTM Q3/2018 Unreal ized revenue 0.00 0.00 0.00 0.00
Gross profi t margin 17.34% 10.10% 10.63% 14.19% Long-term borrowings 0.00 694.84 626.91 572.23
EBITDA margin 17.61% 6.48% 8.06% 11.79% OWNER'S EQUITY 2,147.44 4,734.02 10,594.13 13,924.61
EBIT margin 13.81% 6.34% 8.01% 11.62% Pa id-in capita l 1,450.00 3,000.00 4,513.43 5,416.11
Pre-tax profi t margin 12.65% 5.10% 5.89% 9.83% Share premium 0.00 0.00 245.95 245.95
Operating profi t margin 12.47% 4.70% 5.85% 9.71% Undis tributed earnings 685.72 1,702.86 5,809.06 8,137.19
Net profi t margin 10.62% 4.14% 5.90% 9.08% Minori ty interests 1.14 1.49 1.77 1.83
Cash Flow Statement Key ratios
(VND billion) 2015 2016 2017 2018 2015 2016 2017 TTM Q3/2018
Net profi t/(loss ) before tax 1,168.48 2,703.15 5,302.64 5,829.28 Multiple
Depreciation and amortisation 10.17 45.87 94.99 144.33 P/E 14.97 14.52 10.75 12.54
Profi t/loss from investing activi ties -45.80 -40.89 44.28 -127.80 P/E di luted 14.97 14.52 10.75 12.54
Interest expense 129.70 180.73 237.60 257.51 P/B 8.16 7.66 5.15 4.70
Operating profi t/(loss ) before changes in Working Capita l 1,575.66 3,332.56 5,889.00 6,676.40 P/S 0.88 1.32 1.29 1.25
(Increase)/decrease in receivables -1,625.00 -2,628.50 -2,794.31 -4,488.56 P/Tangible Book 8.20 7.67 5.15 4.70
(Increase)/decrease in inventories -71.06 26.50 -129.25 -154.73 P/Cash Flow 20.56 22.15 9.77 13.88
Increase/(decrease) in payables 1,014.10 848.24 1,824.01 1,788.64 EV/EBITDA 12.59 12.43 9.45 9.75
(Increase)/decrease in prepaid expenses 120.24 275.39 1,344.40 1,254.68 EV/EBIT 12.67 12.61 9.61 9.96
Net cash inflows/(outflows) from operating activi ties 851.76 1,636.02 5,578.20 4,714.18 Operating performance
Purchases of fixed assets and other long term assets -1,209.72 -3,145.88 -2,622.03 -2,081.48 ROE% 0.75 0.73 0.66 0.43
Proceeds from disposal of fixed assets 0.00 0.00 0.00 1,545.99 ROA% 0.12 0.16 0.20 0.15
Loans granted, purchases of debt instruments 0.00 -1.40 -487.33 0.00 ROIC% 0.28 0.28 0.32 0.32
Col lection of loans , proceeds from sa les of debts instruments 0.00 270.00 0.00 0.00 Financia l s tructure
Investments in other enti ties 0.00 -60.00 0.00 -1,132.84 Cash Ratio 0.19 0.26 0.49 0.51
Proceeds from divestment in other enti ties -1.26 0.00 0.00 0.00 Quick Ratio 0.92 0.93 1.23 1.20
Dividends and interest received 10.26 107.09 67.35 209.00 Current Ratio 0.98 0.98 1.27 1.24
Net cash inflows/(outflows) from investing activi ties -1,200.73 -2,830.19 -3,042.01 -1,459.33 LT Debt/Equity 0.00 0.15 0.06 0.04
Proceeds from issue of shares 0.00 71.50 1,759.38 0.00 LT Debt/Tota l Assets 0.00 0.03 0.02 0.01
Payments for share returns and repurchases 0.00 0.00 0.00 0.00 Debt/Equity 1.65 1.44 0.71 0.46
Proceeds from borrowings 13,666.59 21,249.91 25,899.05 34,609.69 Debt/Tota l Assets 0.29 0.34 0.24 0.16
Repayment of borrowings -12,926.50 -18,035.14 -25,184.71 -35,712.26 ST Liabi l i ties/Equity 2.98 2.23 1.31 1.14
Finance lease principa l payments 0.00 0.00 0.00 0.00 ST Liabi l i ties/Tota l Assets 0.53 0.53 0.44 0.41
Dividends pa id 0.00 -300.00 -876.83 -1,926.62 Tota l Liabi l i ties/Equity 4.61 3.24 1.99 1.82
Interests , dividends , profi ts received 0.00 0.00 0.00 0.00 Tota l Liabi l i ties/Tota l Assets 0.82 0.76 0.67 0.64
Net cash inflows/(outflows) from financing activi ties 740.09 2,986.28 1,596.90 -3,029.18 Activi ty ratios
Net increase in cash and cash equiva lents 391.12 1,792.11 4,133.09 225.66 Account Receivable Turnover 57.72 22.94 26.39 25.81
Cash and cash equiva lents at the beginning of period 526.75 923.51 2,741.34 6,861.60 Inventory Turnover 137.46 156.09 176.51 130.17
Cash and cash equiva lents at the end of period 923.51 2,741.34 6,861.60 7,164.92 Account Payable Turnover 46.97 57.77 75.16 62.33

KBSV RESEARCH
18
Investment portfolio recommendations
Buy: +15% or more
Hold: between +15% and -15%
Sell: -15% or less
DISCLAIMER
This report has been prepared for informational purposes only, and does not constitute an offer or solicitation of a contract
for trading. Opinions in this report reflect professional judgment at this date based on information and data obtained from
sources KBSV considers reliable. However, KBSV does not guarantee that the information and data are accurate or complete,
and, therefore, this report is subject to change without prior notice. Individual investments should be made based on each
client’s own judgment and we expressly disclaim all liabilities for any investment decisions and any results thereof. This report
is a copyrighted material of KBSV and, thus, it may not be reproduced, distributed, or modified without the prior consent of
KB Securities. This report is not prepared for academic purposes and any third party wishing to quote from it for academic
publications should receive the prior consent of KBSV.
KB SECURITIES VIETNAM (KBSV)
Head Office:
Floor G, 2&7, Sky City Tower, 88 Lang Ha Street, Dong Da District, Hanoi, Vietnam. Tel: (+84) 24 7303 5333 - Fax: (+84) 24 3776 5928
Hanoi Branch
Floor 1, VP Tower, 5 Dien Bien Phu Street, Ba Dinh District, Hanoi, Vietnam
Tel: (+84) 24 3776 5929 - Fax: (+84) 24 3822 3131
Saigon Branch
Floor 1, Saigon Trade Center, 37 Ton Duc Thang Street, Ben Nghe Ward, District 1, HCMC, Vietnam
Tel: (+84) 28 7306 3338 - Fax: (+84) 28 3910 1611
Ho Chi Minh Branch
Floor 2, TNR Tower Nguyen Cong Tru, 180-192 Nguyen Cong Tru Street, District 1, HCMC, Vietnam
Tel: (+84) 28 7303 5333 - Fax: (+84) 28 3914 1969
CONTACT INFORMATION
Institutional Client Center: (+84) 28 7303 5333 - Ext: 2656
Private Customer Care Center: (+84) 24 7303 5333 - Ext: 2276
Hotmail: [email protected]
Website: www.kbsec.com.vn
Recommended