WAJIR COUNTY
2020 SHORT RAINS FOOD AND NUTRITION SECURITY ASSESSMENT REPORT
A Joint Report by Kenya Food Security Steering Group (KFSSG) and
Wajir County Technical Steering Group (CSG)
February 2021
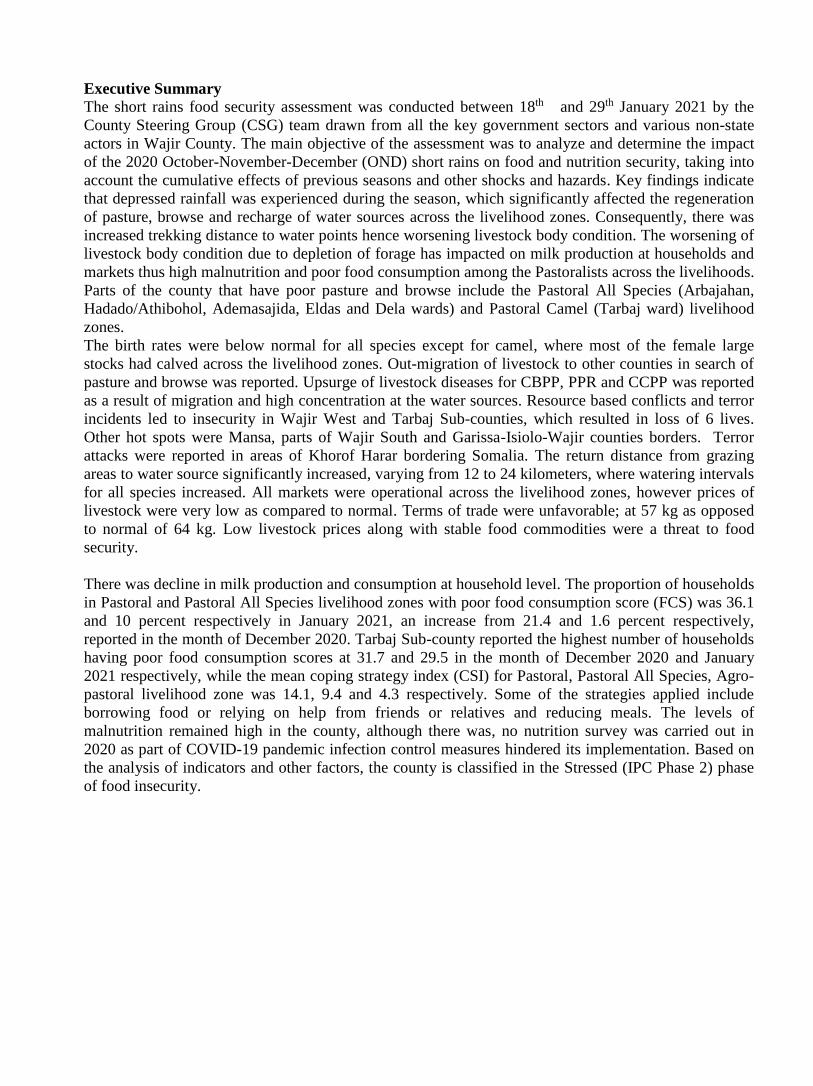
Executive Summary
The short rains food security assessment was conducted between 18th and 29th January 2021 by the
County Steering Group (CSG) team drawn from all the key government sectors and various non-state
actors in Wajir County. The main objective of the assessment was to analyze and determine the impact
of the 2020 October-November-December (OND) short rains on food and nutrition security, taking into
account the cumulative effects of previous seasons and other shocks and hazards. Key findings indicate
that depressed rainfall was experienced during the season, which significantly affected the regeneration
of pasture, browse and recharge of water sources across the livelihood zones. Consequently, there was
increased trekking distance to water points hence worsening livestock body condition. The worsening of
livestock body condition due to depletion of forage has impacted on milk production at households and
markets thus high malnutrition and poor food consumption among the Pastoralists across the livelihoods.
Parts of the county that have poor pasture and browse include the Pastoral All Species (Arbajahan,
Hadado/Athibohol, Ademasajida, Eldas and Dela wards) and Pastoral Camel (Tarbaj ward) livelihood
zones.
The birth rates were below normal for all species except for camel, where most of the female large
stocks had calved across the livelihood zones. Out-migration of livestock to other counties in search of
pasture and browse was reported. Upsurge of livestock diseases for CBPP, PPR and CCPP was reported
as a result of migration and high concentration at the water sources. Resource based conflicts and terror
incidents led to insecurity in Wajir West and Tarbaj Sub-counties, which resulted in loss of 6 lives.
Other hot spots were Mansa, parts of Wajir South and Garissa-Isiolo-Wajir counties borders. Terror
attacks were reported in areas of Khorof Harar bordering Somalia. The return distance from grazing
areas to water source significantly increased, varying from 12 to 24 kilometers, where watering intervals
for all species increased. All markets were operational across the livelihood zones, however prices of
livestock were very low as compared to normal. Terms of trade were unfavorable; at 57 kg as opposed
to normal of 64 kg. Low livestock prices along with stable food commodities were a threat to food
security.
There was decline in milk production and consumption at household level. The proportion of households
in Pastoral and Pastoral All Species livelihood zones with poor food consumption score (FCS) was 36.1
and 10 percent respectively in January 2021, an increase from 21.4 and 1.6 percent respectively,
reported in the month of December 2020. Tarbaj Sub-county reported the highest number of households
having poor food consumption scores at 31.7 and 29.5 in the month of December 2020 and January
2021 respectively, while the mean coping strategy index (CSI) for Pastoral, Pastoral All Species, Agro-
pastoral livelihood zone was 14.1, 9.4 and 4.3 respectively. Some of the strategies applied include
borrowing food or relying on help from friends or relatives and reducing meals. The levels of
malnutrition remained high in the county, although there was, no nutrition survey was carried out in
2020 as part of COVID-19 pandemic infection control measures hindered its implementation. Based on
the analysis of indicators and other factors, the county is classified in the Stressed (IPC Phase 2) phase
of food insecurity.

Executive Summary ........................................................................................................................ 2
1. 0 INTRODUCTION ................................................................................................................... 4
1.1 County Background .............................................................................................................. 4
1.2 Methodology and approaches ............................................................................................... 4
2.0 DRIVERS OF FOOD AND NUTRITION SECURITY IN THE COUNTYError! Bookmark not
defined.
2.1 Rainfall Performance ............................................................................................................ 5
2.2 Insecurity/Conflict ............................................................... Error! Bookmark not defined.
2.3 Other shocks and Hazard ..................................................... Error! Bookmark not defined.
3.0 IMPACTS OF DRIVERS ON FOOD AND NUTRITION SECURITYError! Bookmark not
defined.
3.1 Availability ........................................................................... Error! Bookmark not defined.
3.1.1 Crops Production ........................................................... Error! Bookmark not defined.
3.1.2 Cereals stock ................................................................. Error! Bookmark not defined.
3.1.3 Livestock Production .................................................... Error! Bookmark not defined.
3.1.4 Impact on Food Availability ......................................... Error! Bookmark not defined.
3.2 Access .................................................................................. Error! Bookmark not defined.
Maize prices ........................................................................... Error! Bookmark not defined.
3.2.2 Terms of Trade (ToT) ................................................... Error! Bookmark not defined.
3.2.3 Income Sources ............................................................. Error! Bookmark not defined.
Water Access and Availability ............................................... Error! Bookmark not defined.
Distances to Water Sources, Waiting time, water consumption and costError! Bookmark not
defined.
3.2.5 Food Consumption ........................................................ Error! Bookmark not defined.
Food Consumption Score (FCS) and Coping Strategy Index (CSI)Error! Bookmark not defined.
3.3 Utilization ............................................................................. Error! Bookmark not defined.
3.3.1 Morbidity and Mortality Pattern ................................... Error! Bookmark not defined.
3.3.2 Immunization and Vitamin A supplementation ............ Error! Bookmark not defined.
3.3.2 Nutritional Status and Dietary Diversity ....................... Error! Bookmark not defined.
3.4 Trends of key food security indicators ................................. Error! Bookmark not defined.
Cross – Cutting Issues ............................................................ Error! Bookmark not defined.
3.5 Education ............................................................................. Error! Bookmark not defined.
3.5.3 Retention .................................................................. Error! Bookmark not defined.
Table 11: sub-county ranking in terms of food insecurity .................................................... 20
5.2 Ongoing Interventions ......................................................................................................... 20
5.2.1 Food Interventions ....................................................................................................... 20
5.2 Ongoing Interventions ......................................................................................................... 21
5.2.1 Food intervention ......................................................................................................... 21
Table 15: Recommended food interventions ......................... Error! Bookmark not defined.


Figure 1: Livelihood zones
1. 0 INTRODUCTION
1.1 County Background
Wajir County is located in the north eastern region of
Kenya between latitudes 3° N 60°N and 0° 20°N and
Longitudes 39° E and 41° E and covers an area of
56,685.9 Km2. It borders Somalia to the East, Ethiopia to
the North, Mandera County to the Northeast, Isiolo
County to the South West, Marsabit County to the West
and Garissa County to the South. The county comprises
of eight sub-counties namely Wajir East, Tarbaj, Wajir
West, Eldas, Wajir North, Buna, Habswein and Wajir
South. It is further divided into 28 divisions, 128
locations and 159 sub-locations. The County has a total
population of 781,263people (KNBS1 2019 census). The
main livelihood zones are Agro-pastoral, Pastoral All
Species, Pastoral Cattle, Pastoral Camel, and
formal/informal employment in various proportions as
shown in figure 1.
Livestock production contributes 70 percent of household income in both Pastoral All Species livelihood
zone and Pastoral Cattle, 60 percent in the Agro-pastoral livelihood zone and 55 percent in Pastoral
Camel livelihood zones. Crop production contributes 30 percent of household income in Agro-pastoral
and 15 percent in other livelihood zones.
1.2 Methodology and approach
The assessment exercise was coordinated by the CSG in collaboration with the Kenya Food Security
Steering Group (KFSSG). The joint team collected secondary data, which included livelihood zone
baseline data, drought monitoring information, monthly nutrition surveillance data, nutrition survey
data, price data and satellite imagery. Besides, more information was collected by the team from various
sectoral departments through checklists.
Additional primary data and information was obtained through transect drives in the county that was
carried out to collect information from the community and households using community interview
guides and key informant questionnaires for every sector. The teams also visited health and education
institutions to gather relevant information. Visual inspection techniques were used to obtain qualitative
data. The field data was collated, reviewed, analyzed and triangulated to verify its validity. After the
transect drive and analysis of field data, the CSG was debriefed for validation. The results from sampled
areas, along with outcomes of discussions with the larger CSG and secondary data analysis, were used to
draw inferences for non-visited areas situated in similar livelihood zones. The findings and
recommendations were made for planning purposes.

Figure 2: Rainfall Performance
2.0 DRIVERS OF FOOD AND NUTRITION SECURITY IN THE COUNTY
2.1 Rainfall Performance
The onset of the 2020 OND short rains was on time in
the county apart from Wajir North sub-county (Bute and
Gurar), where the rainfall started in the second dekad of
October.
Most parts of the County received depressed rainfall of
between 51 to 75 percent of normal, except for a few
parts of Wajir North sub-county (Bute and Gurar),
which received near-normal rainfall (figure 2).
Rainfall performance was poor in both temporal and
spatial distribution.
Cessation was late in the third decade of December
2020.
2.2 Insecurity/Conflict
Resource based conflicts and terror incidents have led to disruption of livelihoods in all livelihood zones
within the County. In the past six months, resource-based conflicts have been reported in Wajir West
sub-county and Tarbaj Sub-county. Conflict was reported in Yamicha in Wajir West sub-county and
Urara in Merti sub-county at highly concentrated water points, between Wajir pastrolists and Borana
(host community) that resulted in loss of 6 lives.
2.3 COVID 19 Pandemic
Since April 30, 2020 a total of 86 confirmed cases of COVID-19 infections have been listed with a case
fatality rate of 3.5 percent. So far, 19 (22 percent) heath workers have been confirmed with one fatality.
Measures put in place to mitigate spread of COVID-19 include a 10 pm to 4 am movement curfew and
the pandemic had no impacts.
2.4 Other shocks and hazards
Livestock diseases
Livestock diseases reported in the period are Lumpy Skin Disease (LSD) for cattle and trypanosomiasis.
Foot and Mouth Disease (FMD) and the camel sudden death were reported in the Agro-pastoral
livelihood zone. Others include endemic diseases such as CCPP, PPR, Sheep and Goat Pox.
Desert Locust infestation
The current wave of locust invasion was reported on November 2020 from Somalia through Diff and
later from Mandera. This was followed by other swarms which affected the entire county with most
impact being reported in Wajir south and Wajir west sub-counties. A total of 78 swarms have been
reported to date, 44 of them were controlled through spraying. Currently there are 5 swarms. The
impact of destruction is estimated at 310 hectares of assorted crops and over 7,500 hectares of pastures
and browse.

3.0 IMPACTS OF DRIVERS ON FOOD AND NUTRITION SECURITY
3.1 Availability
The two main livelihoods in the county are the Pastoral Livelihood zone and the Agro-pastoral
livelihood zone with the latter being practiced in specific regions such as Bute, Korondille,
Danaba and Habaswein among others. Rain-fed crop production has increased over time
especially in the northern and southern regions of the county with a similar reported increase in
irrigated crop production within Wajir Township and its environs. Currently, approximately 30
percent of the population relies on crop production-based activities for their food and income.
However, to a greater extent, crop-based food items are majorly sourced from other counties.
Food aid from the government and development partners has continued to play a significant role
in bridging the food security gap in the county. It should also be noted that food could be
physically available but access may be limited by low purchasing power.
3.1.1 Crops Production
Crop production under rainfed conditions is common in Wajir South, Wajir North, Tarbaj and
Wajir West sub-counties and the strip along the Kenya Somalia border. The main food crops
produced in Wajir are maize, sorghum, millet, cow peas, beans and green grams. Cash crops
grown are mainly watermelon, sim sim, tomatoes, kales, spinach, onions, capsicum and fruit
trees, (mangoes, pawpaw, citrus and lemon). Crop production contributes to 30 percent of food
consumed in the County with April to June rains being the main season spreading over 60 to 90
days and the short rains season covering a scope of October to December.
The short rains contribute approximately 30 percent of the annual food produced in the county.
However, during the 2020 short rains season, the rains were inadequate in most parts of the
county except in Wajir North sub-county along the hills bordering Ethiopia. The county received
depressed rainfall which was poorly distributed in time and space, which drastically reduced the
area planted for various rain-fed crops and their subsequent performance with crops drying
prematurely. The Desert locust invasion had also affected the production, where 250 acres of
crop land estimated at 20 percent were reportedly destroyed. The area mostly consists of rain-
fed crops and was approximately 440 hectares compared to the long-term average of 594
hectares with the total arable land being 102,406 hectares. Majority of the farms are small scale
with average holding of 2.4 hectares mostly used for subsistence farming.
Rain-fed crop production
Rain-fed crop production is carried out in depressions and along drainage lines where there is
more moisture due to seasonal flooding especially in Wajir North sub-county which originates
from Ethiopian highlands. Performance of maize, sorghum and cowpeas during the 2020 short
rains production season is indicated below.
Table 1: Rain-fed crop production
Crop Area planted
during 2020
Short rains
season (Ha)
LTA (5yrs)
area planted
during the Short rains
season (Ha)
2020 Short rains
season production
(90 kg bags)
Actual
LTA production
during the Short rains
season (90 kg bags)
Maize 70 202 0 1,450
Sorghum 320 327 200 2,845
Pulses/Beans 50 65 150 404
440 594 350 4,699
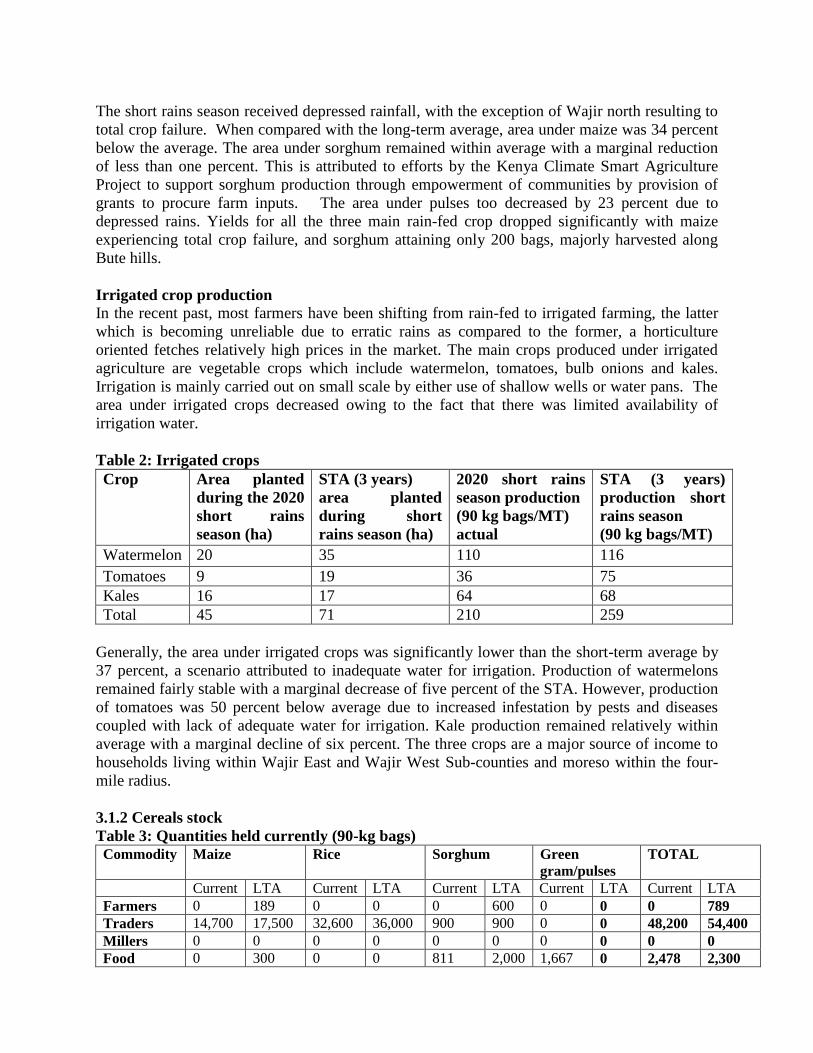
The short rains season received depressed rainfall, with the exception of Wajir north resulting to
total crop failure. When compared with the long-term average, area under maize was 34 percent
below the average. The area under sorghum remained within average with a marginal reduction
of less than one percent. This is attributed to efforts by the Kenya Climate Smart Agriculture
Project to support sorghum production through empowerment of communities by provision of
grants to procure farm inputs. The area under pulses too decreased by 23 percent due to
depressed rains. Yields for all the three main rain-fed crop dropped significantly with maize
experiencing total crop failure, and sorghum attaining only 200 bags, majorly harvested along
Bute hills.
Irrigated crop production
In the recent past, most farmers have been shifting from rain-fed to irrigated farming, the latter
which is becoming unreliable due to erratic rains as compared to the former, a horticulture
oriented fetches relatively high prices in the market. The main crops produced under irrigated
agriculture are vegetable crops which include watermelon, tomatoes, bulb onions and kales.
Irrigation is mainly carried out on small scale by either use of shallow wells or water pans. The
area under irrigated crops decreased owing to the fact that there was limited availability of
irrigation water.
Table 2: Irrigated crops
Crop Area planted
during the 2020
short rains
season (ha)
STA (3 years)
area planted
during short
rains season (ha)
2020 short rains
season production
(90 kg bags/MT)
actual
STA (3 years)
production short
rains season
(90 kg bags/MT)
Watermelon 20 35 110 116
Tomatoes 9 19 36 75
Kales 16 17 64 68
Total 45 71 210 259
Generally, the area under irrigated crops was significantly lower than the short-term average by
37 percent, a scenario attributed to inadequate water for irrigation. Production of watermelons
remained fairly stable with a marginal decrease of five percent of the STA. However, production
of tomatoes was 50 percent below average due to increased infestation by pests and diseases
coupled with lack of adequate water for irrigation. Kale production remained relatively within
average with a marginal decline of six percent. The three crops are a major source of income to
households living within Wajir East and Wajir West Sub-counties and moreso within the four-
mile radius.
3.1.2 Cereals stock
Table 3: Quantities held currently (90-kg bags)
Commodity Maize Rice Sorghum Green
gram/pulses
TOTAL
Current LTA Current LTA Current LTA Current LTA Current LTA
Farmers 0 189 0 0 0 600 0 0 0 789
Traders 14,700 17,500 32,600 36,000 900 900 0 0 48,200 54,400
Millers 0 0 0 0 0 0 0 0 0 0
Food 0 300 0 0 811 2,000 1,667 0 2,478 2,300
Aid/NCPB
Total 50,678 57,489
The currently available stocks especially with traders are sourced from other counties. At the
moment, the monthly cereal requirements for the county stands at 5,900 metric tons. The current
available stocks are estimated to last one month. However, more staple food commodities are
expected to be brought by merchants to replenish the depleted stocks though this may not be
accessible to the resource poor whose purchasing power has been eroded by the current situation.
A few farmers in Bute cumulatively managed to harvest approximately 150 bags of beans but
was consumed immediately upon harvest, therefore no food is stored by farmers.
3.1.3 Livestock Production
Livestock production accounts for over 70 percent of the livelihood and food security in the
county and employs about 75 percent of the rural population. It contributes to 61, 71, 56 and 71
percent of cash income in the Agro-pastoral, Pastoral All Species, Pastoral Camel and Pastoral
Cattle livelihood zones respectively. The main livestock species kept in the county include
camels, goats, cattle, sheep and donkeys.
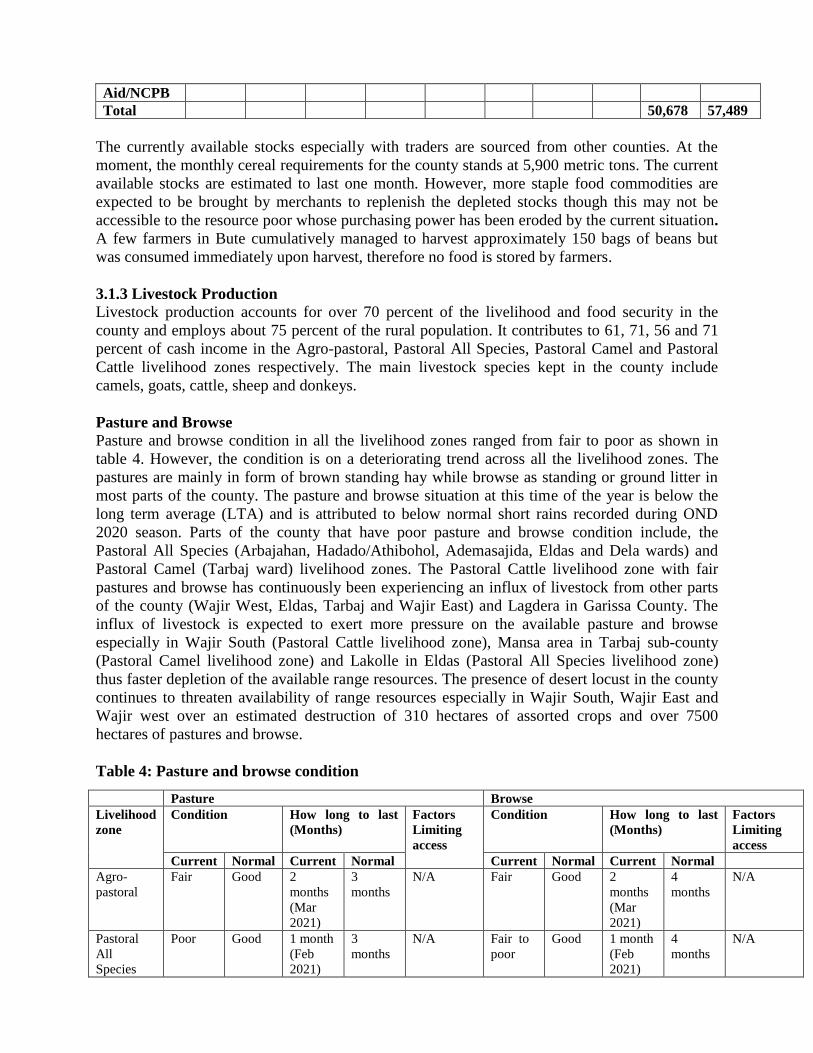
Pasture and Browse Pasture and browse condition in all the livelihood zones ranged from fair to poor as shown in
table 4. However, the condition is on a deteriorating trend across all the livelihood zones. The
pastures are mainly in form of brown standing hay while browse as standing or ground litter in
most parts of the county. The pasture and browse situation at this time of the year is below the
long term average (LTA) and is attributed to below normal short rains recorded during OND
2020 season. Parts of the county that have poor pasture and browse condition include, the
Pastoral All Species (Arbajahan, Hadado/Athibohol, Ademasajida, Eldas and Dela wards) and
Pastoral Camel (Tarbaj ward) livelihood zones. The Pastoral Cattle livelihood zone with fair
pastures and browse has continuously been experiencing an influx of livestock from other parts
of the county (Wajir West, Eldas, Tarbaj and Wajir East) and Lagdera in Garissa County. The
influx of livestock is expected to exert more pressure on the available pasture and browse
especially in Wajir South (Pastoral Cattle livelihood zone), Mansa area in Tarbaj sub-county
(Pastoral Camel livelihood zone) and Lakolle in Eldas (Pastoral All Species livelihood zone)
thus faster depletion of the available range resources. The presence of desert locust in the county
continues to threaten availability of range resources especially in Wajir South, Wajir East and
Wajir west over an estimated destruction of 310 hectares of assorted crops and over 7500
hectares of pastures and browse.
Table 4: Pasture and browse condition
Pasture Browse
Livelihood
zone
Condition How long to last
(Months)
Factors
Limiting
access
Condition How long to last
(Months)
Factors
Limiting
access
Current Normal Current Normal Current Normal Current Normal
Agro-
pastoral
Fair Good 2
months
(Mar
2021)
3
months
N/A Fair Good 2
months
(Mar
2021)
4
months
N/A
Pastoral
All
Species
Poor Good 1 month
(Feb
2021)
3
months
N/A Fair to
poor
Good 1 month
(Feb
2021)
4
months
N/A
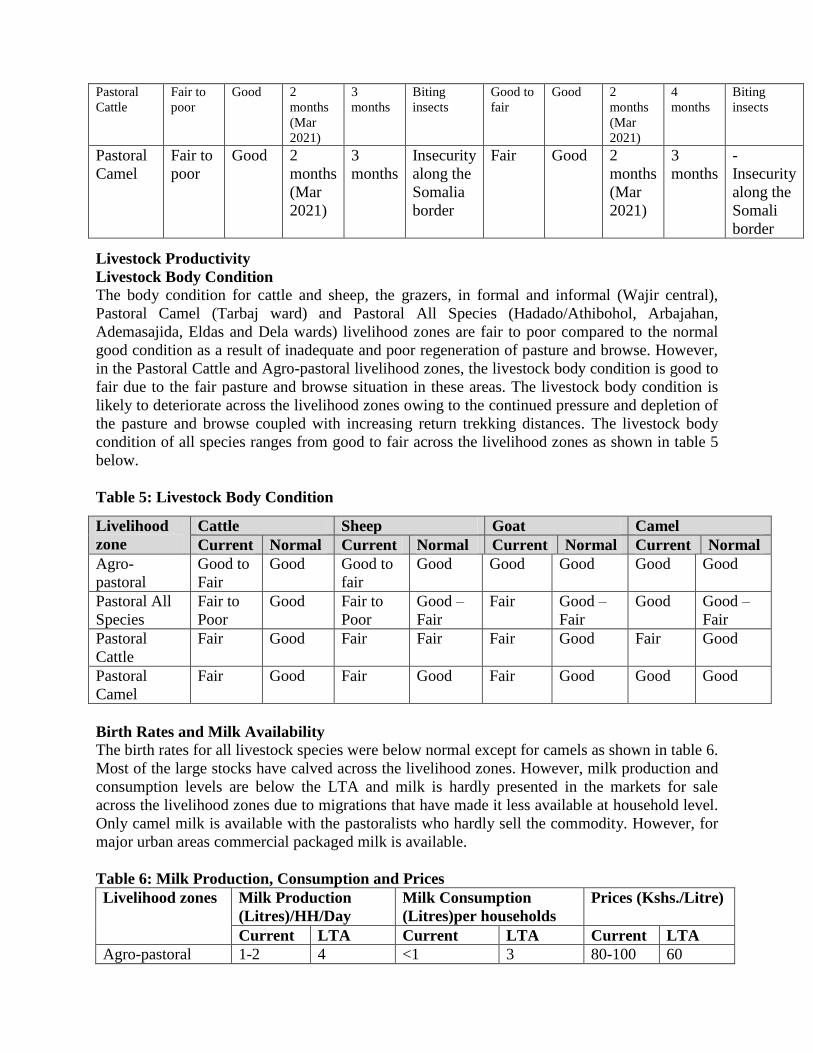
Livestock Productivity
Livestock Body Condition
The body condition for cattle and sheep, the grazers, in formal and informal (Wajir central),
Pastoral Camel (Tarbaj ward) and Pastoral All Species (Hadado/Athibohol, Arbajahan,
Ademasajida, Eldas and Dela wards) livelihood zones are fair to poor compared to the normal
good condition as a result of inadequate and poor regeneration of pasture and browse. However,
in the Pastoral Cattle and Agro-pastoral livelihood zones, the livestock body condition is good to
fair due to the fair pasture and browse situation in these areas. The livestock body condition is
likely to deteriorate across the livelihood zones owing to the continued pressure and depletion of
the pasture and browse coupled with increasing return trekking distances. The livestock body
condition of all species ranges from good to fair across the livelihood zones as shown in table 5
below.
Table 5: Livestock Body Condition
Birth Rates and Milk Availability The birth rates for all livestock species were below normal except for camels as shown in table 6.
Most of the large stocks have calved across the livelihood zones. However, milk production and
consumption levels are below the LTA and milk is hardly presented in the markets for sale
across the livelihood zones due to migrations that have made it less available at household level.
Only camel milk is available with the pastoralists who hardly sell the commodity. However, for
major urban areas commercial packaged milk is available.
Table 6: Milk Production, Consumption and Prices
Livelihood zones
Milk Production
(Litres)/HH/Day
Milk Consumption
(Litres)per households
Prices (Kshs./Litre)
Current LTA Current LTA Current LTA
Agro-pastoral 1-2 4 <1 3 80-100 60
Pastoral
Cattle
Fair to
poor
Good 2
months
(Mar
2021)
3
months
Biting
insects
Good to
fair
Good 2
months
(Mar
2021)
4
months
Biting
insects
Pastoral
Camel
Fair to
poor
Good 2
months
(Mar
2021)
3
months
Insecurity
along the
Somalia
border
Fair Good 2
months
(Mar
2021)
3
months
-
Insecurity
along the
Somali
border
Livelihood
zone
Cattle Sheep Goat Camel
Current Normal Current Normal Current Normal Current Normal
Agro-
pastoral
Good to
Fair
Good Good to
fair
Good Good Good Good Good
Pastoral All
Species
Fair to
Poor
Good Fair to
Poor
Good –
Fair
Fair Good –
Fair
Good Good –
Fair
Pastoral
Cattle
Fair Good Fair Fair Fair Good Fair Good
Pastoral
Camel
Fair Good Fair Good Fair Good Good Good

Pastoral All
Species
<2 3 1.8 2 80-100 60
Pastoral Cattle 1-3 4 2 3 80-100 60
Pastoral Camel 2-3 6 2 4 80-100 60
Tropical Livestock Units The average tropical livestock units (TLUs) across the livelihood zones per household have been
on an increasing trend in the last two years. The reason for the above average TLUs may be
attributed to the good performance of short rains season in 2019 that improved pasture, browse
and water availability.
Table 7: TLUs by Livelihood zones
Livestock Water Access The main sources of water for livestock in the county are shallow wells, boreholes and water
pans and are normal at this time of the year as shown in table 8. Most water sources are on
multiple use and support domestic and livestock across the livelihoods. However, water pans in
the Pastoral All Species, Pastoral Camel and Agro-pastoral can hardly last for less than a month
owing to lower recharge levels and use. Return trekking distances to water sources significantly
increased compared to normal due to low recharge of water sources attributed to depressed
rainfall. Water trucking for livestock by private individuals especially for small stock and cattle
was also witnessed in Lakolle grazing area, parts of Wajir North and Tarbaj Sub-counties.
Concentration of livestock at the permanent water points was evident across the livelihoods for
example Bosicha Borehole in Wajir North, Kotkot and Sabuli Boreholes in Wajir South in
addition to Eldas Borehole in Eldas among others.
Table 8: Water availability and access
Livelihood
zone
Sources Return average
distances (km)
Expected
duration to last
(months) for pans
Factors
limiting
access
Current Normal Current Normal Current Normal
Agro-
pastoral
Water
pans
Boreholes
Shallow
wells
Water
pans
Boreholes
Shallow
wells
18-25 5 1 (Feb
2021)
4 N/A
Pastoral
Camel
Water
pans
Boreholes
Water
pans
Boreholes
14-24 8 <1 (Feb
2021)
3 N/A
Pastoral Water Water 12-18 6-9 2 (Mar 3 Migration of
Livelihood zone Poor income
households
Medium income households
Current Normal Current Normal
Agro-pastoral 6 4 8 7
Pastoral All Species 5 3 14 11
Pastoral Cattle 6 5 18 15
Pastoral Camel 6 5 18 16

All
Species
pans
Shallow
wells
Boreholes
pans
Boreholes
Shallow
wells
2020) the
LIVELIHOOD
ZONE
Pastoral
Cattle
Water
pans
Boreholes
Shallow
wells
Water
pans
Boreholes
14-24 6-8 1-2 (Feb
Mar
2020)
3 Longer
waiting
duration and
incidences of
biting insects
Watering Frequency
Watering intervals have been seen to be normal trending upward across the livelihood zones as
shown in Table 9. Small stock and cattle were being watered every two to three days against a
normal of one to two days at this time of the year. Camels are however watered between seven to
ten days against a normal of five to seven days. The cost of watering livestock has also remained
within the normal ranges with sheep and goats, cattle and camels at KShs. 1-2, 7-10 and 10-20
respectively in the Pastoral All Species and Pastoral Cattle livelihood zones. The apparent
stability has been occasioned by availability of water at most of the open water sources and
permanent water sources in these livelihood zones though showing faster depletion and higher
concentration especially in the latter livelihood zone.
Table 9: Watering frequency in days
Livelihood
zone
Cattle Camels Goats Sheep
Current Normal Current Normal Current Normal Current Normal
Agro-
pastoral
2 1-2 7-10 5-7 2-3 1-2 2-3 1-2
Pastoral
Camel
2 1-2 7-10 5-7 2-3 1-2 2-3 1-2
Pastoral
All
Species
2 1-2 7-10 5-7 2-3 1-2 2-3 1-2
Pastoral
Cattle
2 1-2 7-10 5-7 2-3 1-2 2-3 1-2
Migration, Livestock Diseases and Mortalities
There were cases of out-migration of livestock towards Wajir South, Wajir North, Tarbaj and
Eldas of Mansa and Lakole and outside the county in search of pasture and browse as well as in-
migration from Lagdera in Garissa County. Suspected cases of livestock diseases such as LSD
for cattle and trypanosomiasis in camels were reported across the livelihood zones. Foot and
Mouth Disease and camel sudden deaths were also reported in the Agro-pastoral livelihood zone.
Endemic diseases including Contagious Caprine Pleuropneumonia (CCPP), Contagious Bovine
Pleuropneumonia (CBPP), and Peste des-petit Ruminate (PPR) Sheep and Goat Pox incidences
were reported in a few areas especially the Pastoral Cattle livelihood zone where concentration
of livestock was experienced. There is ongoing surveillance and monitoring of zoonotic diseases
especially rift valley fever (RVF) through veterinary technical field staff and community disease
reporters (CDRs) following confirmed outbreak in Isiolo and Mandera Counties. Wajir County
especially areas along the drainage lines of Waso belt is a RVF hotspot and reports from the field
indicate the upsurge of the RVF vector.

Figure 3: Maize Prices
Figure 5: Terms of Trade
3.2 Access
3.2.1 Market Prices
Major trading market places that are functional for livestock and food commodities in the county
are mainly Wajir town, Griftu, Buna, Tarbaj, Habaswein and Eldas and the products traded were
livestock and livestock products within the county. However staple food commodities are out-
sourced from other counties, mainly Nairobi, Thika, Meru and Nanyuki Markets as well as from
the republics of Somalia and Ethiopia.
Maize prices remained stable
throughout the season between the
ranges of Kshs 55 and Kshs 56,
though there was slight decline in
December 2020. The average maize
price was Kshs 56, which is six
percent above the long term
average. Maize prices from October
to December 2020 were slightly
higher than the long-term average,
having been as a result of higher
priced commodities from the
sources. However, maize is not a staple food consumed, as the mostly consumed ones include,
rice, pasta (spaghetti) and wheat flour.
Goat Price
The current goat prices for a medium size goat fell
between Kshs 3,200 and 3,500 for the month of
January 2021 as compared to the long term average
of 3,300 which is within the normal range. Prices
are expected to drop as the body condition worsens
due to depletion of pasture and browse.
3.2.2 Terms of Trade
The
current terms of trade (ToT) are unfavorable as
most of the households could access 57 kg of
maize for sale of a goat, which is 11 percent below
the long term average of 64 kg across the county.
The low ToT was due to decrease in goat prices,
despite stable maize prices in January 2021.The trend is expected to worsen as the prices of goat
will deteriorate further and maize prices will remain stable due to import from other counties and
countries.

3.2.3 Income sources
Major sources of income were livestock and livestock Products, which contribute 70 percent and
30 percent respectively in the Pastoral livelihood households income across the county. Most of
the Pastoral livelihood households rely on market purchase to meet their needs. Other sources of
income include casual waged labor, sale of charcoal, petty trade, remittances and the sale of
firewood. Despite COVID-19 pandemic, sources of income for households remained relatively
stable in the last six months.
3.2.4 Water access and Availability
Major water sources across the livelihood zones were boreholes, shallow wells, water trucking
and water pans. However, there was poor recharge of water pans across the county. There are
about 298 boreholes, 280 medium size and small seasonal water pans with over 22,000 shallow
wells. Some of the water points are saline, especially boreholes and shallow wells. Out of the
298 boreholes, about 278 are operational, while the remaining 20 boreholes are not operational
due to breakdown while some have not been equipped. There is high concentration of livestock
and human population at boreholes and shallow wells across the livelihood zones due to a
limited number of water sources as all the water pans have completely dried up, except few dams
in Wajir North and Wajir South sub-counties that are likely to last for less than two weeks.
Shallow wells in Wajir town are drying up due to poor recharge.
Distances to Water Sources, Waiting time, water consumption and cost
The return trekking distances to domestic water points across the livelihood zones were 10
kilometers as compared to a normal of 5 kilometers. The average distance to domestic water
sources varied according to livelihood zones, where Pastoral All Species in Wajir west, Tarbaj
and Eldas sub-counties reported high distance due to depressed rainfall witnessed across the
county. Water consumption per person per day decreased drastically across the livelihood zones
ranging between seven and 10 litres per person per day (lpppd) as compared to normal of 15 to
20 litres. The decrease is attributed to increased distance to and high concentration at the water
points. Water consumption varied according to livelihood zones, where Pastoral All Species in
Wajir West, Eldas and Tarbaj sub-counties recorded lowest consumption per household per day
as shown in table 10.
Table 10: Water Consumption
The waiting time ranged between 20 and 40 minutes as compared to normal of five to 10
minutes. The average cost of water per 20 liters Jerrican varied according to livelihood zones,
where Tarbaj and Wajir North recorded between kshs 10 and Kshs 30 as compared to normal of
two to five Kenyan shillings whereby the lowest was in Wajir North and highest in Tarbaj, Wajir
West and Eldas while all others remained within the normal of three to five Kenyan shillings.
However, in Wajir town the cost remained normal at Ksh 25 per 20 litres jerrican being as a
result of the persistent shortage of water and the cost of vending.
No Livelihood zones Normal(lts/p/d) Current(Lts/p/d
1 Pastoral All Species 15-20 litres 7-10 litres
2 Pastoral livelihood zones 15-20 litres 7-12 litres
3 Agro-pastoral Livelihood zones 15-20 litres 10-15 litres

Figure 6: Food consumption score
3.2.5 Food Consumption
The Food Consumption Score (FCS) for the county was 2.2 44.1 and 56 percent for the poor,
border line and acceptable categories
respectively for the month of January 2021 as
compared to December 2020, which had 1.0,
39.2 and 59.8 percent for the poor, borderline
and acceptable respectively. The proportion of
households with food consumption increased in
the month of January 2021 as opposed to
December 2020. Going by the livelihood zones,
the proportion of households in Pastoral and
Pastoral All Species livelihood zones with poor
food consumption was 36.1 and 10 percent as
illustrated in figure 6, an increase from 21.4 and
1.6 percent respectively reported in the month
of December 2020. The two livelihood zones
have reported migration of livestock,
minimizing access to milk and small stock for
sale to buy other food commodities. About 63
percent of the households in the Agro-pastoral zone reported an acceptable FCS due to minimal
migration. Pastoral livelihood zone, covers Wajir South, parts of Wajir East, Tarbaj and Eldas
Sub-counties whereas Wajir West sub-county is in Pastoral All Species. Tarbaj Sub-county
reported the highest number of households with poor food consumption scores at 31.7 and 29.5
percent in the month of November and December 2020 respectively.
Milk Consumption
The average milk consumption per household per day decreased from 1.3 litres in the month of
January 2021 as compared to the same period in 2020 and below the long term average.
Decrease in milk consumption in the January 2021 is attributed to declining livestock
productivity driven by forage depletion thus increasing trekking distance to water sources.
3.2.6 Coping Strategy
The consumption based coping strategies for the county, as measured using reduced coping
strategy index indicated 25.1 percent for Non/Minimal and 74.9 percent in the stressed coping
strategy in the month of January 2021.The levels were comparable with what was reported in the
month of December 2020, where the reduced coping strategy (rCSI) showed 20.2 percent for
Non/Minimal and 77.8 percent for stressed respectively. Some of the strategies employed
include, borrowing food or relying on help from friends or relatives, reducing the quantity of
food consumed by adult/mothers, relying on less preferred and less expensive food.
3.3 Utilization
3.3.1 Morbidity and Mortality Morbidity remains a key driver to malnutrition in the county, with the most prevalent diseases
reported being upper respiratory tract infections (URTI) and diarrhoea for children under the age
of five years and general population. The cases of URTI were higher in the months of August
and September 2020 as compared to the same period in 2019 while higher for diarrhoea in
October 2020. The decline in morbidity in the months of November and December is attributed
to the strike by health workers, where reporting was not captured. In Wajir County, diarrhea
trend was characterized by spikes in November which could be due to the onset of the rain

Figure 8: Immunization coverage for BCG, Penta, MR and FIC
Figure 7: URTI and Diarrhea trend for children under five years
Figure 12: Proportion of children 6-59 months with MUAC below 125 mm
season in October. Measles and visceral leishmaniasis (Kaalazar) outbreak was reported within
the county, where Measles outbreak was first reported in January 2020 with a total of 35 cases
listed. It was however controlled with the last case being reported in July 2020. The outbreak
was reported in Tarbaj, Wajir East and Wajir South sub-counties. Visceral leishmaniasis
outbreak is active with a total of seven cases listed in Wajir West and Eldas sub-counties.
COVID-19 has been confirmed in the county with a total of 86 cases, where the peak was in
October 2020. Majority of the cases are from Wajir East sub-county. Morbidity level was
however within the seasonal trend in the county.
3.3.2 Immunization and Vitamin A Supplementation
The proportion of immunized children has remained relatively the same compared to the same
period last year, Measles Rubella 1 and FIC as illustrated in figure 7 and 8. The county
performance was below the national target of 80 percent. However the sustained achievement is
attributed to outreach services. Vitamin A supplementation coverage for semester two of 2020
was 63 percent, which was lower than the same period in 2019, a situation attributed to closure
of ECD and duksi where most children were being accessed with ease during malezi bora
campaigns.
3.3.3 Nutritional status and dietary diversity
The proportion of children with Mid
Upper Arm Circumference (MUAC)
less than 125 mm was 22.7 percent in
January 2021. The percentage of
malnutrition was on an increasing
trend from July 2020 (figure 12) with
a slight decline in the months of
October and December. The
proportion of was higher compared to
8.2 percent reported in July 2020
indicating a deteriorating situation,
which is attributed to poor dietary
intake as the number of the
households with poor FCS increased within the same period. Diarrheal cases were at the peak in
the month of November, whereby morbidity became a major contributor to acute malnutrition.
Sub-optimal infant feeding practices was a major contributor to malnutrition. According to the

Figure 10: OTP admission trend Figure 11: SFP admission Trend
Knowledge, Attitude, Beliefs and Practices (KABP) survey carried out in November, 2017,
exclusive breastfeeding rate was high at 69.9 percent, with early initiation of breastfeeding at
87.6 percent. However, complementary feeding practices were observed to be very poor. Timely
introduction of solid, semi-solid or soft foods was at 65.2 percent, minimum meal frequency for
the children aged (6-23) months was 27.6 percent while minimum dietary diversity was 25.7 and
minimum acceptable diet (6-23 combined with breastfeeding) being 12.4 (KABP, 2018). In the
past one year, behavior change communication on child feeding practices were not intensified,
thus significant change might not have been realized from what was observed in the survey
Admission to SFP and OTP is illustrated in figure 2. There was an increase in admissions across
the month of October 2020 affecting both programs which was above the short term average,
followed by a decline in admissions to both programs in November and December 2020, which
is partly
attributed to
health workers
strike. The
admission
trend was
within the
seasonal
range. Wajir
North sub-
county
admitted the
highest
number of
cases (25 percent) whereas Eldas sub-county admitted 10 percent of the total cases. Cure rate for
2020 for OTP and SFP was 92.5 and 95.3 percent respectively with defaulter rate of 4.6 and 2.3
percent respectively.
3.3.4 Health and Nutritional sector on COVID 19 context
Most of the health sector services were not disrupted particularly in the static facilities, although,
services were scaled down in the nutrition sector for a period of three months starting from April
to June 2020 as a result of COVID-19. Outreach services were not interrupted and the services
were normal. However, there was a lot of anxiety and fear among the general population due to
fear of COVID-19.
3.3.5 Public Interventions, risk communication and community level actions
Public interventions that were ongoing include, media engagement through radio talk shows with
radio spots going on through community radio stations. Schools health education was going on
as well. Engaging social influencers such as religious leaders on prompting reflection about
stigmatized people and how to support them where respected leaders were used to amplify
messages that reduce stigma. There was ongoing community engagement and general public
awareness on COVID-19 and encouraging them to observe the Ministry of Health recommended
measures for containing the pandemic. It was noted that within the urban and rural areas of the
county, adherence to COVID-19 control measures was still very low.
3.3.5 Coordination and leadership in COVID-19 pandemic preparedness and response
There is high level coordination structure overseeing cross county preparedness and response
activities of the COVID-19 outbreak. The committee is chaired by the Governor and co-chaired
by the County Commissioner. The committee provides policy guidance and leadership in
implementation of COVID-19 response plan, resource mobilization, effective and efficient
implementation of COVID-19 preparedness and response. Furthermore, the department of health
has a technical committee that provides technical support and advice to health care workers both
at county and sub-county levels.
3.3.7 Water Hygiene and Sanitation According to NDMA early warning bulletin for January 2021, main water sources in use were
boreholes, shallow wells, water pans and water trucking for both human and livestock. Few
water pans were moderately recharged following depressed rains in the 2020 OND rains.
According to the Nutrition and Health Survey carried out in 2019 water treatment was sub-
optimal with only 23 percent of the households treating their drinking water. Currently the
department has no stock of water treatment chemicals. Household return trekking distance in
search of water increased from August 2020, stabilizing following onset of rains and increasing
in December 2020. In the period under review water search distance was above both LTA and
wet years STA. According to 2019 Health and Nutrition Survey, households who have no
relieving points are approximately 40 percent.
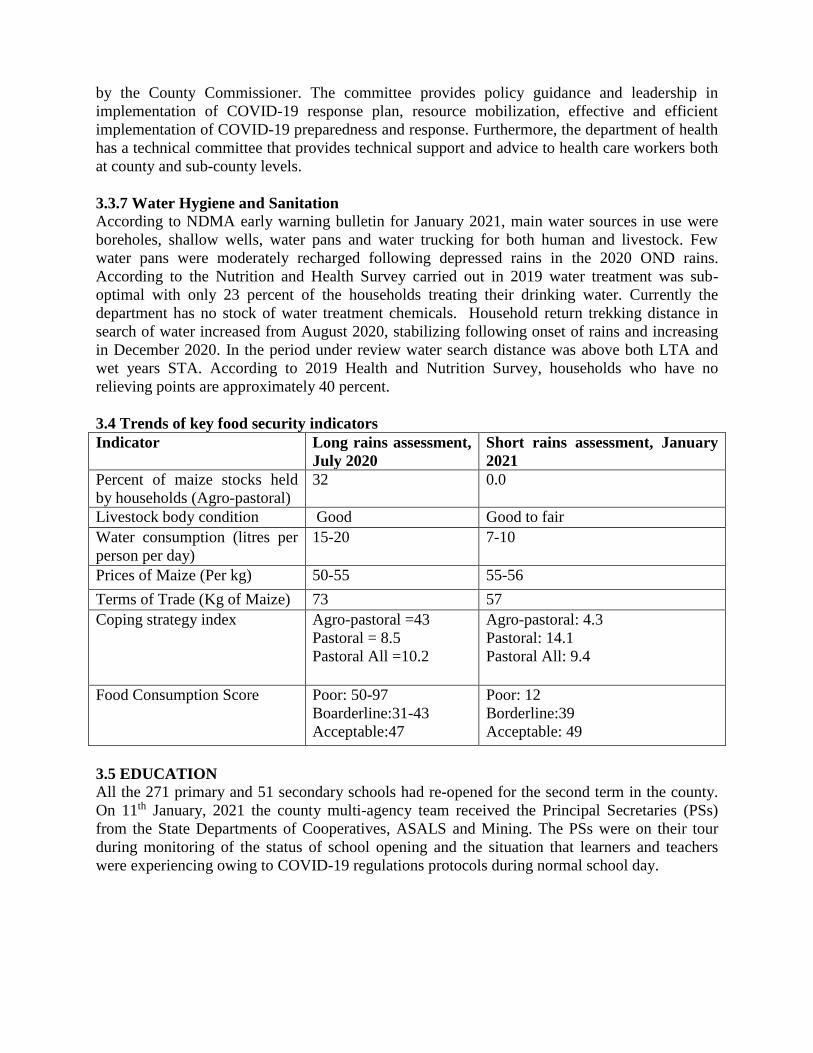
3.4 Trends of key food security indicators
Indicator Long rains assessment,
July 2020
Short rains assessment, January
2021
Percent of maize stocks held
by households (Agro-pastoral)
32 0.0
Livestock body condition Good Good to fair
Water consumption (litres per
person per day)
15-20 7-10
Prices of Maize (Per kg) 50-55 55-56
Terms of Trade (Kg of Maize) 73 57
Coping strategy index Agro-pastoral =43
Pastoral = 8.5
Pastoral All =10.2
Agro-pastoral: 4.3
Pastoral: 14.1
Pastoral All: 9.4
Food Consumption Score Poor: 50-97
Boarderline:31-43
Acceptable:47
Poor: 12
Borderline:39
Acceptable: 49
3.5 EDUCATION
All the 271 primary and 51 secondary schools had re-opened for the second term in the county.
On 11th January, 2021 the county multi-agency team received the Principal Secretaries (PSs)
from the State Departments of Cooperatives, ASALS and Mining. The PSs were on their tour
during monitoring of the status of school opening and the situation that learners and teachers
were experiencing owing to COVID-19 regulations protocols during normal school day.

3.5.1 ENROLMENT
Enrolment was still ongoing across the
county with all schools having been
opened. There was a noticeable increase
in enrolment in 2021 compared to 2020
as illustrated in figure 12. Enrolment
for 2021 is still ongoing although it has
been affected by migration.
3.5.2 Effects of COVID-19 in schools
Acute shortage of water in most schools that depended on water pans that have since dried up
following the ongoing dry spell in the county. The situation has led to parents migrating to areas
with water and pasture, affecting mostly primary schools, social distancing in schools could not
be realized due to large class sizes, inadequate infrastructure and lack of enough teachers making
the splitting of classes impossible. Though hand washing stations are currently available in most
schools, their continued maintenance is likely to be jeopardized by the prevailing acute water
shortages in most schools. As a result of the high levels of poverty amongst the local population
coupled with the existing drought, parents are experiencing challenges in providing face masks
to their school going children daily as some of the pupils had no face masks, others had soiled
face masks which could be a source of other respiratory ailments.
Inadequate and reliable suppliers of face masks in the remote parts of the county has been a
hindrance for parents to provide face masks to all learners. Due to decline by some contracted
artisans and workshops, the county is yet to realize the full provision of locally fabricated desks
under the ESP program to selected primary and secondary schools in the county. Only 44 percent
have been delivered as of Wednesday 27th January, 2021. The county had just received SMP
supplies. This will assist the learners especially during this dry period. The ECD section which is
currently under the new curriculum (CBC) lacks teachers who are trained under the new
curriculum, a fact which will lead to poor impact on the learners. There is an acute shortage of
teachers in all schools following the mass exodus of non-local teachers from the county (region)
since March/April 2020. Since majority of the students in the county could not access E-
Learning over the long holiday, they have fallen so much below the standards that were
expected. Insecurity in most parts of the border sub-counties has led to mass exodus of teachers
leading to poor start-off in some schools. There were five cases of pregnancies that were
reported, whereby the Ministry of Education allowed them to continue learning while giving
them guidance and counseling.

4.0 Food Security Prognosis
4.1 Assumptions
March and may long rains are likely to be below average.
Pasture and browse condition is expected to be depleted during the month of February and
March but thereafter improve in the month of April 2021.
Milk availability and accessibility is likely decline in February and March 2021 and
thereafter improve during the long rains season.
Market prices for livestock are likely to worsen further as the dry spell continues and
thereafter improve during the long rains.
Rangeland condition is expected to deteriorate further as below average rainfall is expected.
The prices of essential food commodities are likely to increase due to cut-off of the roads
during the rainy season thus affecting food accessibility.
Conflicts are likely to continue as the dry spell progresses as a result of in-migration and
high concentration of livestock in search of pasture and water compounded with
administrative boarder disputes.
4.2 Food Security Outcomes from February to April 2021
As a result of the poor short rains performance and subsequent poor regeneration of pasture and
browse, the livestock body condition was good to fair across the livelihood zones but is expected
to worsen before the onset of the long rains. Milk availability and accessibility in the county
declined due to low livestock productivity following the above average trekking distances and
livestock migration. Low recharge of water sources will lead to high concentration of both
livestock and human in strategic livestock boreholes across the livelihood zones. Malnutrition
levels for children under five is likely to increase due to decline in milk production and
consumption. Households will experience reduced household food access as terms of trade are
unfavorable. Food security phase classification for the county will degenerate into crisis phase.
4.3 Food Security Outcomes from May 2020 to July 2020
The long rains are projected to be below average but will still result in short-lived improvement
of pasture, browse and water condition across the county. Milk production and consumption at
Pastoral livelihood households is likely to remain below average and be on a declining trend
from June and lead to a deteriorating nutritional status of children under five years. Trekking
distance to water points from grazing areas is expected to increase significantly due to
deterioration of water, browse and pasture. Terms of trade are likely be below average thus
reducing household food access. Households will be forced to increasingly apply consumption
and livelihood coping strategies that are unsustainable and be in Crisis (IPC Phase 3).

5.0 Conclusion and Interventions
5.1 Conclusion
5.1.1 Phase classification
Current food security situation in the county is Stressed (IPC Phase 2) on a worsening trend, due
to depressed rainfall with poor regeneration of pasture, browse and low recharge of water,
unfovourable terms of trade, low market prices for livestock, migration, low milk production,
increased trekking distance and poor food consumption and decline in nutrition status.
5.1.2 Summary of the Findings Food security situation is on worsening trend and the situation is projected to deteriorate further
before the onset of the long rains.
5.1.3 Sub County Ranking
Table 11: Sub-county ranking in terms of food insecurity severity
No Sub
County
Pop in need (
percent range
min – max)
Proposed
mode of
intervention
Main Food Security Threats
1 Wajir
West
20-35 HSNP/FFA Water scarcity, total crop failures, poor pasture
and browse, migration, reduced livestock
production and productivity, livestock diseases
and predation
2 Eldas 20-25 HSNP/FFA Water scarcity, massive migration, poor
pastures, overgrazing, poor livestock prices and
predation
3 Tarbaj 20-25 HSNP/FFA Water scarcity, depleting forage resources,
migration, livestock diseases and predation
4 Wajir
North
10-20 HSNP/FFA Poor pasture, water scarcity, outmigration, lack
of milk, depleting vegetation conditions and
predation
5 Wajir
East
10-15 HSNP/FFA Water scarcity, depleting pasture, poor livestock
prices, low production of milk.
6 Wajir
South
10-15 HSNP/FFA Water sources diminishing, fair to poor pasture,
livestock diseases, migration, reduced livestock
production (milk) and predation
5.2 Ongoing Interventions
5.2.1 Food Interventions
The main food assistance interventions ongoing were Sustainable food system Program by the
World Food Programme (WFP) targeting 4,667 households spread in 41 sites across the County.
Cash transfers by the Hunger Safety Net Programme by the National Drought Management
Authority (Regular cash Transfer Programme to 19,201 households (HSNP). Cash transfer to
4,239 households affected by the invasion of desert locusts by Wajir South Development
Association (WASDA). Support to integrated outreaches at 52 sites in Tarbaj, Wajir North and
Wajir West sub-counties by Save the Children.

5.2 Ongoing Interventions
5.2.1 Food intervention
Table 12: Food Interventions
Intervention Objective Specific
Location
Activit
y
target
Cos
t
No. of
beneficia
ries
Implem
entation
Time
Frame
Implementation
Stakeholders
Agriculture sector: Ongoing interventions
In-kind food
assistance/distribution
under the Sustainable
Food Systems
Programme(SFSP)
To provide assorted
food items for small-
holder farmers to
support them during
lean seasons (The
assorted food items are
Sorghum, peas and
Vegetable oil)
All 8 sub-
counties in
Wajir
200
M
28,002 2018
June-
2023
June
DALF
WFP
Excavation of 2 farm
ponds for Rainwater
Harvesting.
To promote RWH for
farming activities and
enhance food production
Habaswei
n and
Danaba
1M
3600
beneficiar
ies
DALF
WFP
Rehabilitation of 4 high
yielding boreholes
To enhance water
supply for crop
production.
Qara,
Garseqoft
u,
Habaswei
n and
Jaijai
8M
6,000
beneficiar
ies
WFP
DALF
Provision of 16,000
Orange Fleshed Sweet
Potato (OFSP)
seeds/vines to support
production, marketing
and consumption of
OFSP, addressing food
and nutrition security.
Nutrition sensitive
programming
Wajir
Town,Hab
aswein,
Eldas,
Bute
2M
400 HH DALF
WFP
Extension support To provide technical
support for farmers in
best agronomic practices
to enhance food
production
All 8 sub-
counties
5M
2000 HH WFP
DALF
Surveillance and
control of desert locusts
To control destruction
of crops, pasture and
natural vegetation
County
wide
50,000HH DALF
WFP
Livestock Department
Distribution of fodder
seeds
To enhance fodder
production and
contribute to the growth
of livestock sector.
Wajir
East,
Wajir
West and
tarbaj
1M
DALF
WFP
Distribution of
agricultural
To promote fodder
value chain, Dairy
Wajir
East,
1M
WFP DALF

equipment/tools(
Haybalers and Chuff
cutter)
farming and feedlot Wajir
North
Special programmes
Ongoing interventions
Responding to wild
fires
Recommended
interventions
Purchase of relief food
To protect the natural
resources and cushion
communities from loss
of their livelihoods
Bojiyare,
Abagmath
obe,
Barmil,
Barwaqo
and wel-
gares
County
wide
9M CGW
Health and Nutrition Sector
Ongoing interventions
High impact Nutrition
intervention
To reduce child
morbidity and mortality
County
wide
Childre
n
under-
fives
and
PLW
150
M
SAM-
1400
MAM < 5
4500
PLW-
6200
Continu
es
CGW
UNICEF
WFP
Integrated outreaches
To increase access &
utilization to integrated
health and nutrition
services
Tarbaj,
Wajir
north and
Wajir west
Childre
n
under-
fives
and
PLW
5M
12,000
Adults
7057
Children
Jan
2019-
dec
2021
Save the children
Covid 19 Case
Management and
Infection Prevention &
Control
To enhance infection
prevention and control
measures and ensure
patients can access life-
saving treatment,
County
wide
General
populat
ion
KRCS ,WVI and
County government
Recommended interventions
Roll out of positive
deviance hearth
To reduce the
prevalence of
malnutrition among
children under five
years
Ganyure,B
una,Elnur,
Dilmanyal
e,Barwaqo
and
Desheq
6-36
months
childre
n
2M
Feb
2021
WFP
Scaling up of vitamin A
Reduces child morbidity
and mortality
County
wide
Childre
n years
1M
May
2021
UNICEF
SMART Survey
determine the
prevalence of acute
malnutrition among
children 6-59 months
and PLW
County
wide
6-69
months
childre
n and
PLW
3M
N/A June
2021
UNICEF
County govt
Outbreak investigation
for reported outbreaks,
assumption outbreaks
To improve early
detection
and response to the
General
0.2
M
County govt

leading causes of illness,
death, and
Peace and security sector
Ongoing interventions
Gumarey peace
meeting
To maintain peace
through prevention,
mitigation and response
to conflict occurrences
over scarce resources
(water & pasture) within
Wajir East
Khorof
harar
0.46
M
Jan
2021
WCG
ELDERS
NDMA
Mercy Corps
KRAPID
Halango peace dialogue
meeting
To effectively engage
the two Pastoralist
groups and the local
leaderships for a
community dialogue in
Halango in Merti Sub
County.
Halango
Urura
0.56
M
Nov.
2020
WCG
ELDERS
NDMA
Mercy Corps
KRAPID
Recommended
Gumarey leaders forum
and folow up peace
meeting
To facilitate leader’s
peace forum within hot
spot areas within Wajir
East.
To facilitate community
peace dialogues
platforms to address
resource based conflicts
and promote community
cohesion and peace
Khorof
harar
0.78
M
Jan-
March
2021
WCG
ELDERS
NDMA
Mercy Corps
KRAPID
Merti leaders forum
and dialogue meeting
To facilitate leader’s
peace forum within hot
spot areas within Wajir
West.
To facilitate community
peace dialogues
platforms to address
resource based conflicts
and promote community
cohesion and peace
Merti 0.78
M
Jan-
March
2021
WCG
ELDERS
NDMA
Mercy Corps
KRAPID
Conflict Mapping To track progress of
community
engagements, conflict
contexts and dynamics
and come up with
strategies for future
engagements geared
towards improvements
of future interventions
Entire
County
1M Jan-
March
2021
WCG
ELDERS
NDMA
Mercy Corps
KRAPID
Community
sensitization peace
forum
To sensitize Pastoralists
residing around
Machesa, Kanjara areas
on the significance of
peaceful coexistence
through public Barazas
and peace caravans
Machesa,
Kanjara,
Kursi,
Guticha
1M Jan-
March
2021
WCG
ELDERS
NDMA
Mercy Corps
KRAPID

Water sector : Ongoing interventions
Water trucking To support lives and
livelihoods
County
wide
5m Jan-
March
2021
County Goverment
Rehabilitation of
boreholes
To Save lives and
livelihood
Wajir
West
6m Jan_Mar
ch 2021
County
Government,Resilience
Recommended interventions
Construction of water
pans/dams
To provide clean water County
Wide
25m Dec
2020-
April
2021
County Governet
Drilling of boreholes To provide clean water County
Wide
30m April20
21
County goverment
Repair and maintenance
of boreholes
To Safe lives and
livelihood
County
Wide
5m Feb_Ap
ril 2021
County goverment
Recommended