Walker River
Workshops
Smith: August 27, 2015 and
Yerington: August 28, 2015
1
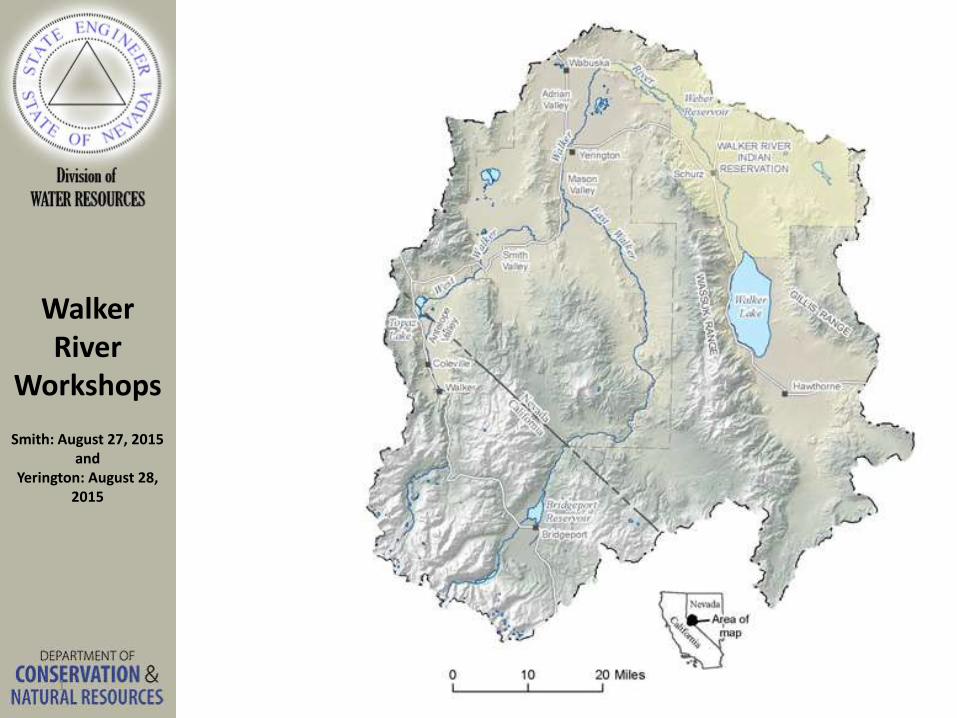
Agenda
− Review of the issues and actions
− Climate outlook for winter of 2015-2016
− Recent pumpage tabulations
− Review of Mason and Smith Valley pumpage tool
− Recent DRI modeling results – supplemental rights only
− NRCS streamflow forecast for surface water supply and curtailment
− Curtailment sliding scale
− Priority tables
− Schedule of actions and hearings
− Q & A
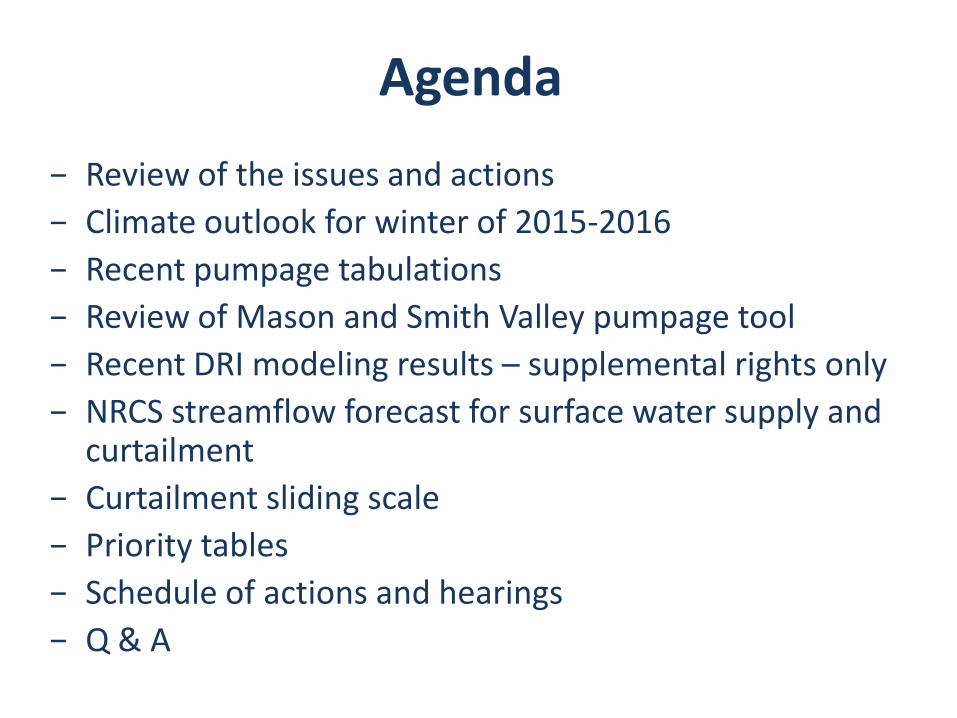
Recent Actions
− Public meetings held January 22, 2015 − Issued Order 1250 on February 3, 2015
– Called for 50% curtailment of pumping of supplemental groundwater rights
– Required properly installed and accurate meters
− Order appealed and Preliminary Injunction issued − Court case is pending − Workshops held July 15 & 16, 2015
– Water levels continue decline – Drought worsening – New Curtailment Order required for 2016

Hydrologic Conditions
&
Climate Forecast
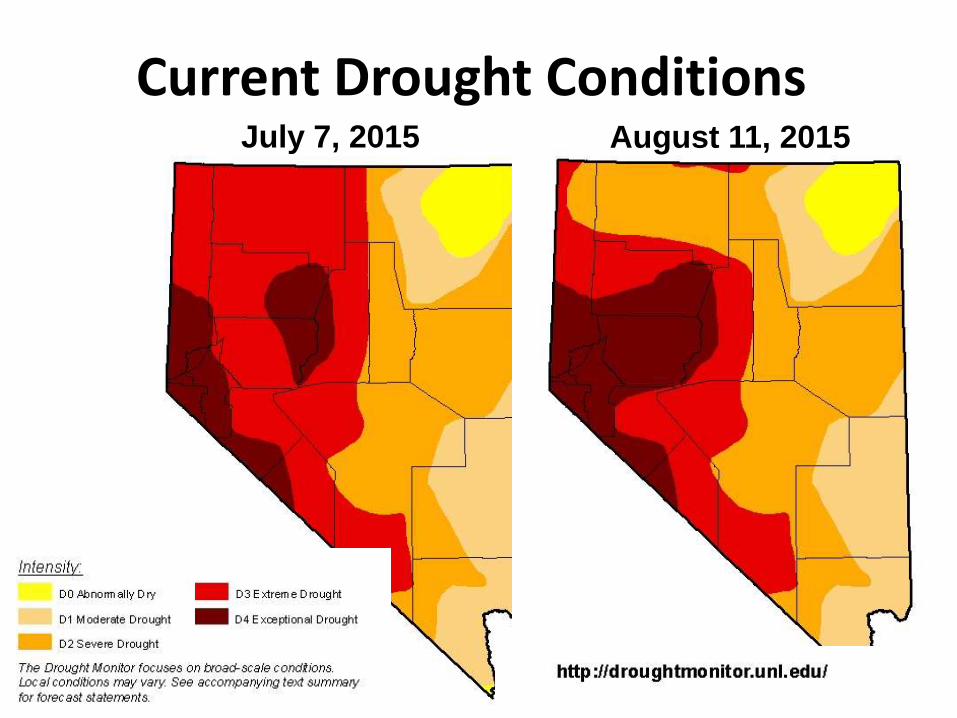
Current Drought Conditions July 7, 2015 August 11, 2015
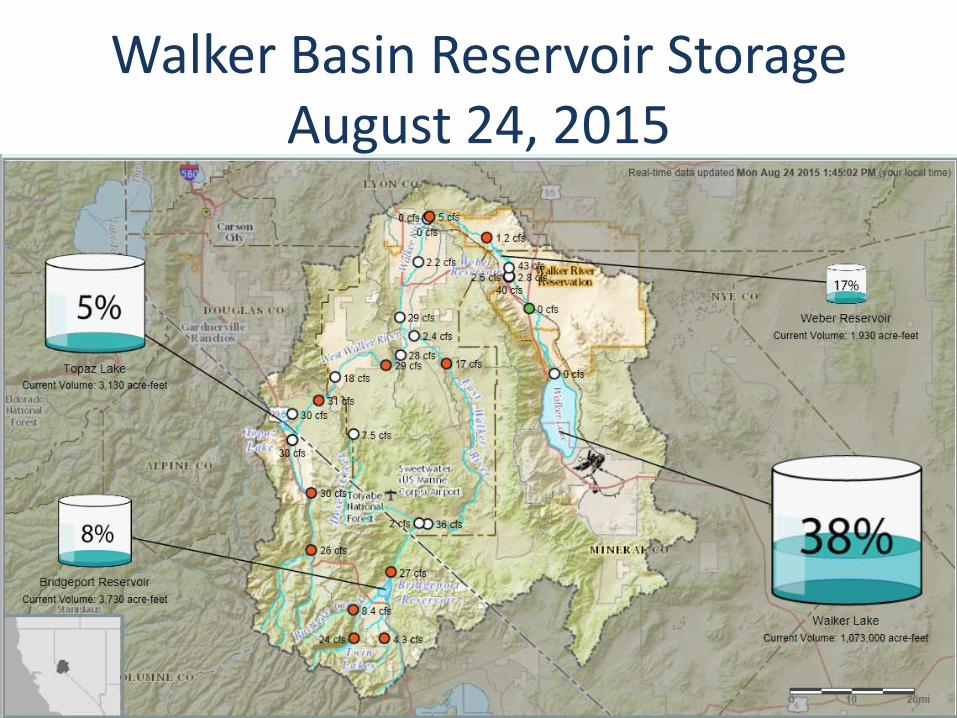
Walker Basin Reservoir Storage August 24, 2015
USGS - Walker Basin Hydro Mapper: Home Page. (n.d.). Retrieved July 14, 2015, from
http://nevada.usgs.gov/walkerbasinhydromapper/webApp/home.html
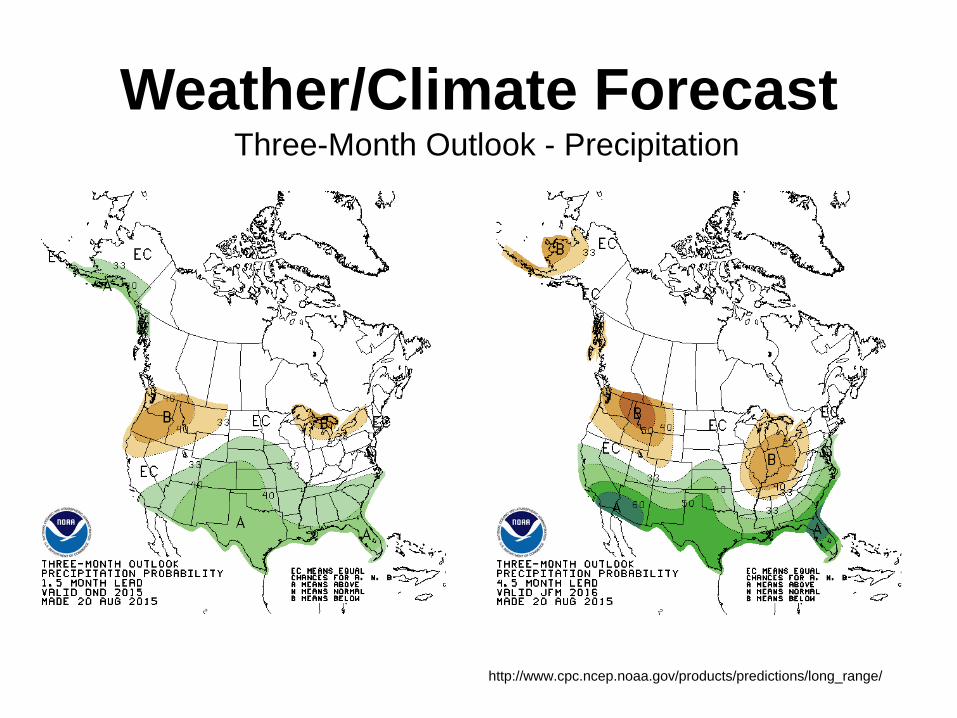
Weather/Climate Forecast Three-Month Outlook - Precipitation
http://www.cpc.ncep.noaa.gov/products/predictions/long_range/
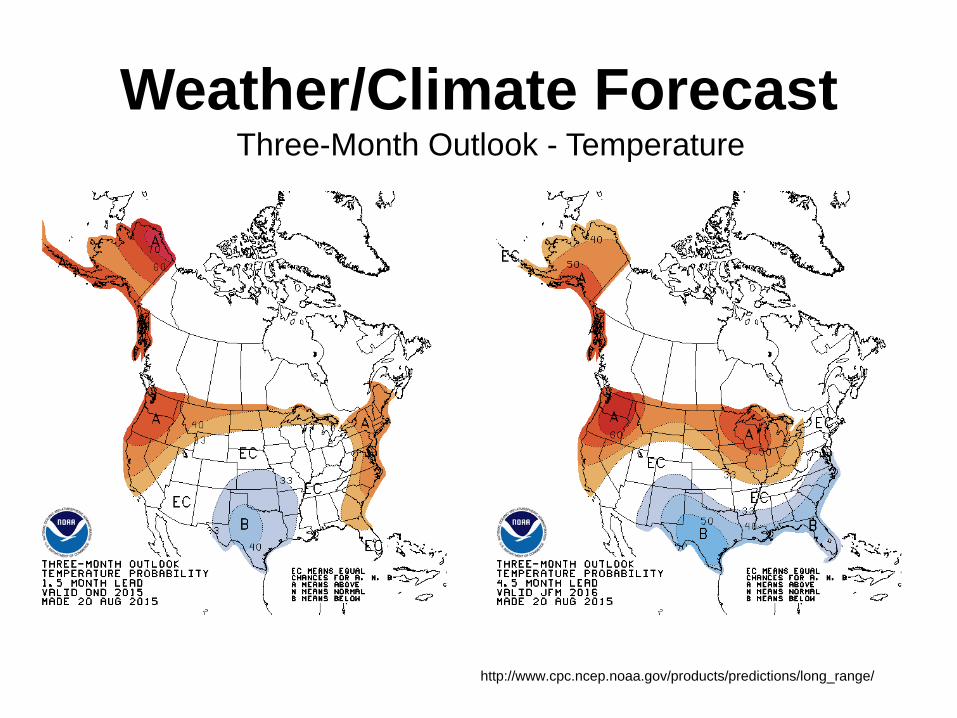
Weather/Climate Forecast Three-Month Outlook - Temperature
http://www.cpc.ncep.noaa.gov/products/predictions/long_range/
2015 Pumping
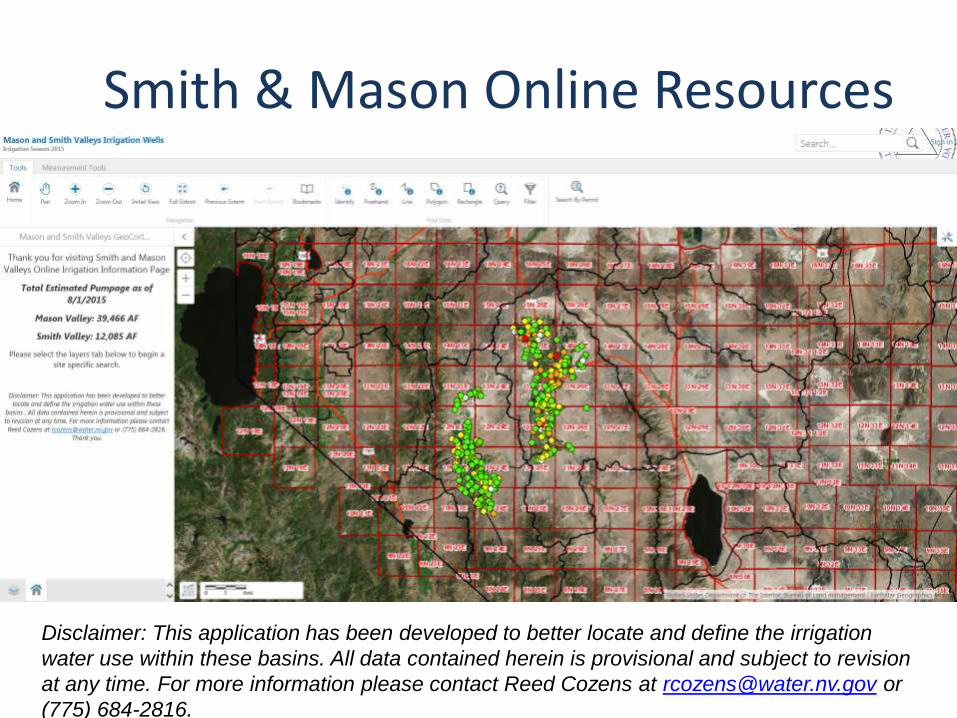
On-Line Pumping Resources
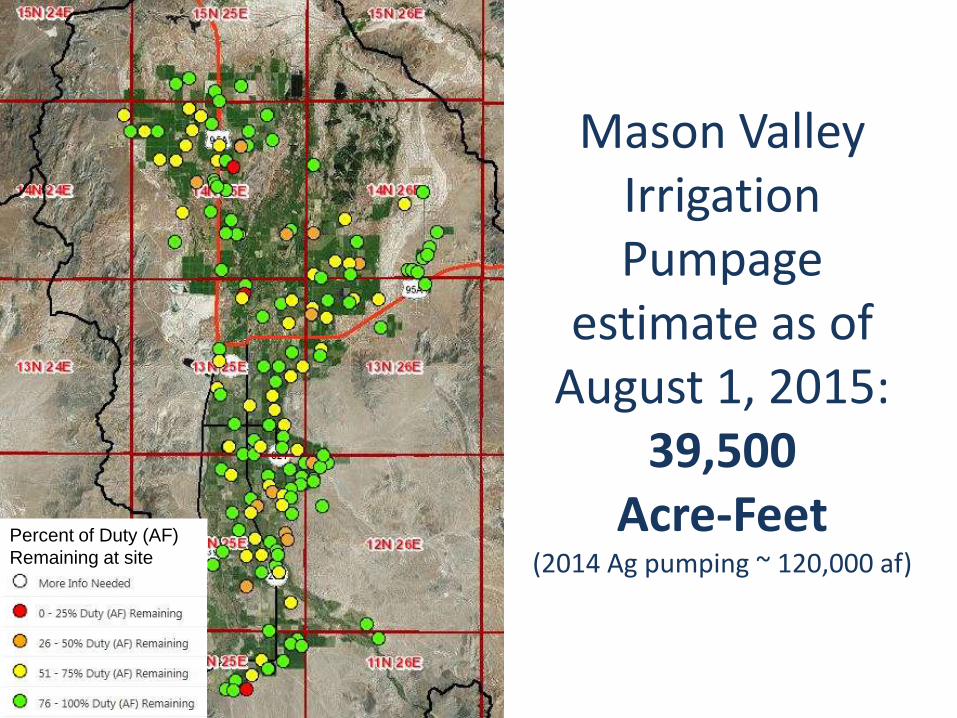
Mason Valley Irrigation Pumpage
estimate as of August 1, 2015:
39,500 Acre-Feet
(2014 Ag pumping ~ 120,000 af) Percent of Duty (AF)
Remaining at site
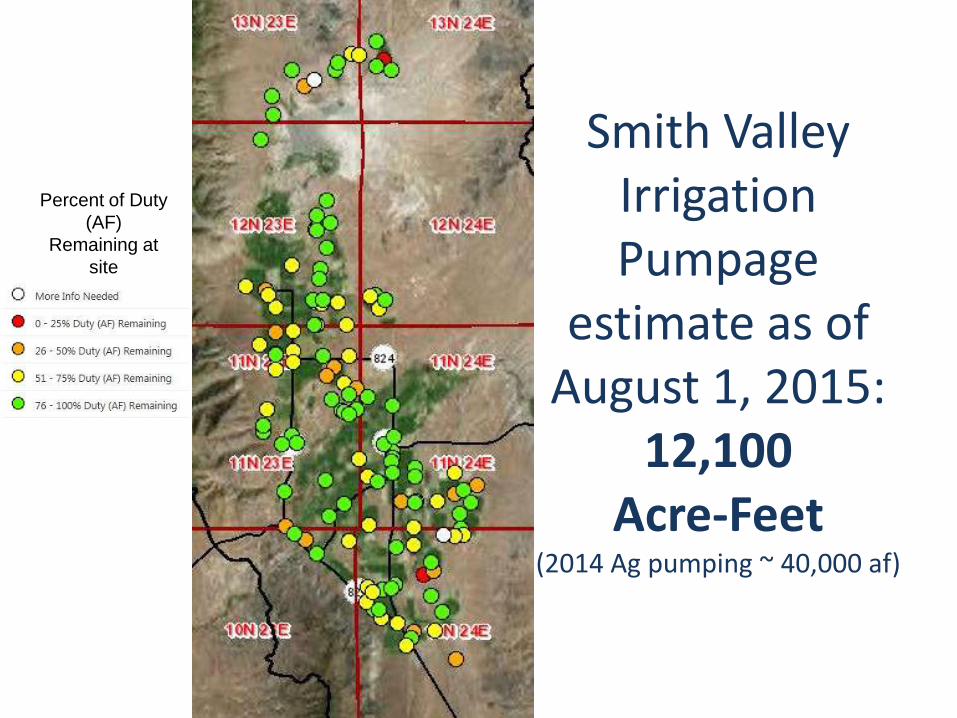
Smith Valley Irrigation Pumpage
estimate as of August 1, 2015:
12,100 Acre-Feet
(2014 Ag pumping ~ 40,000 af)
Percent of Duty
(AF)
Remaining at
site
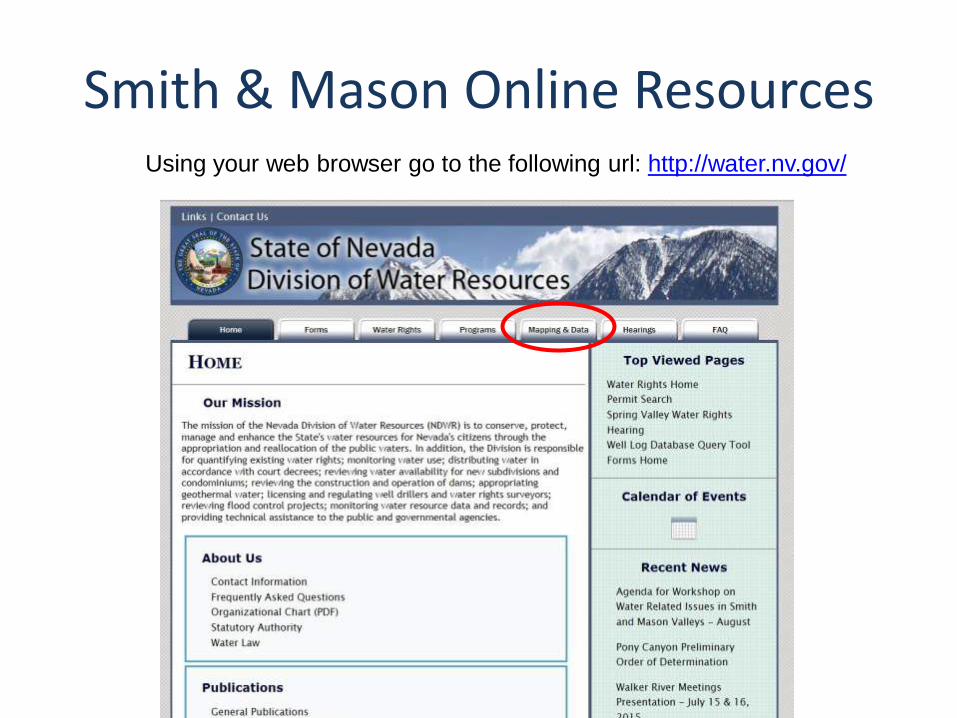
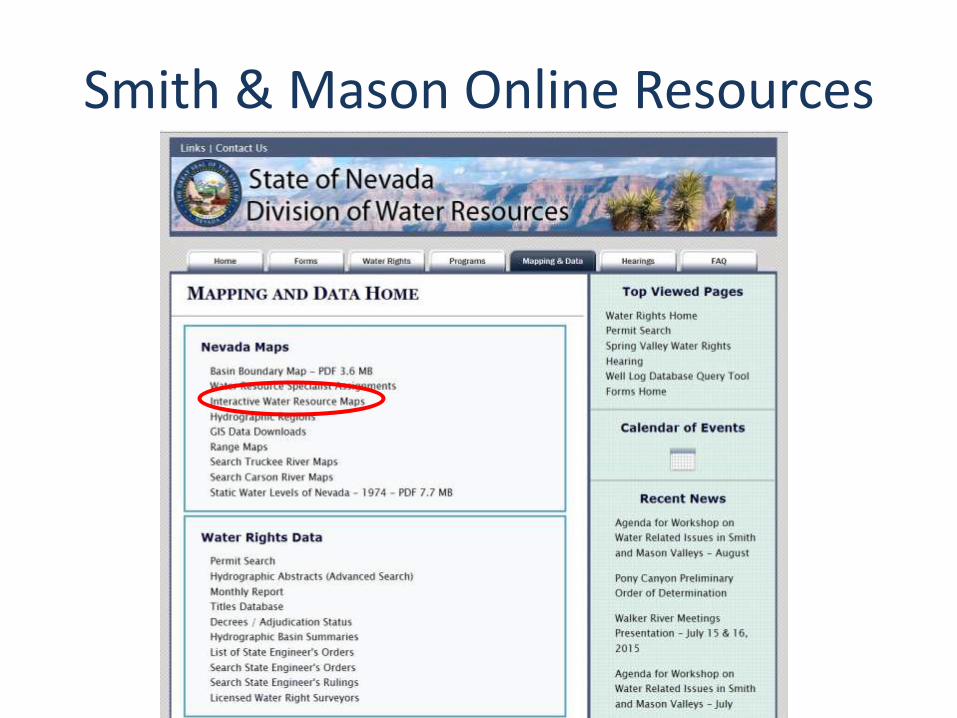
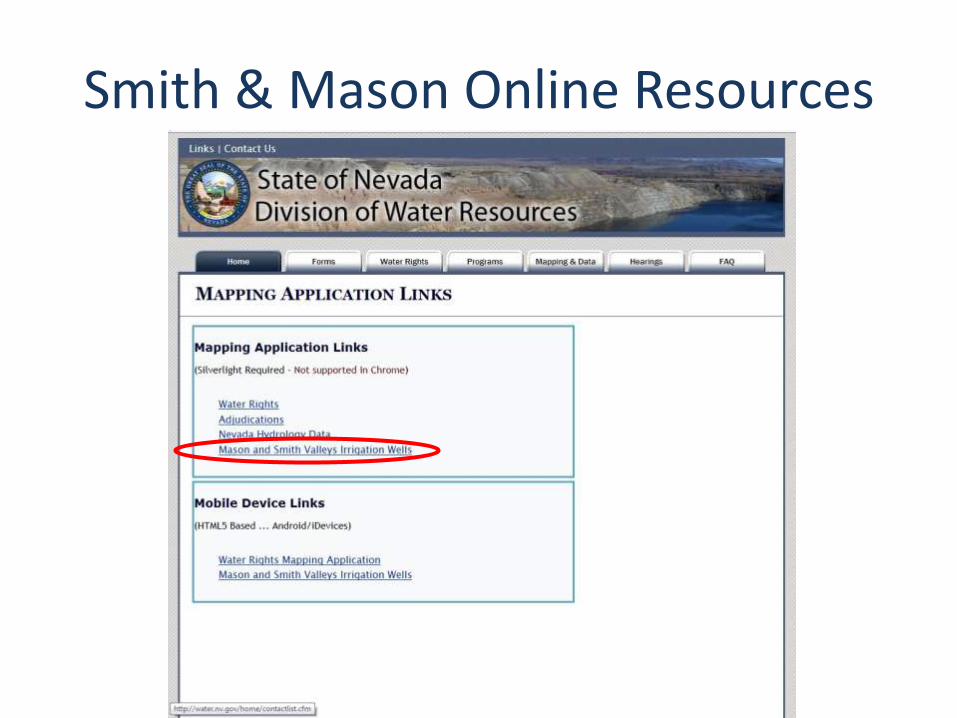
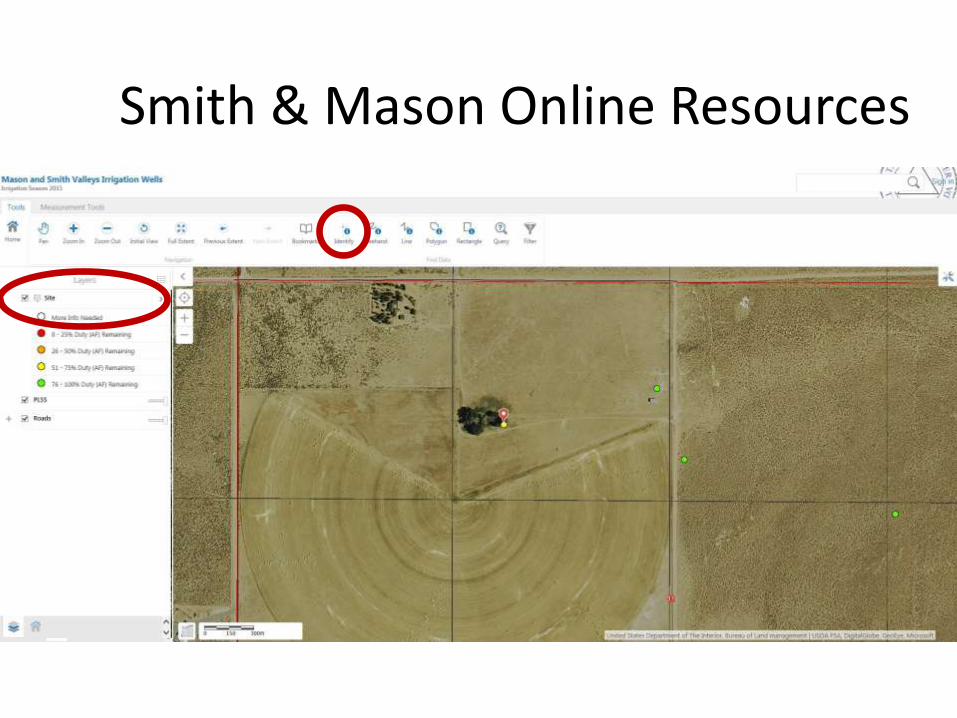
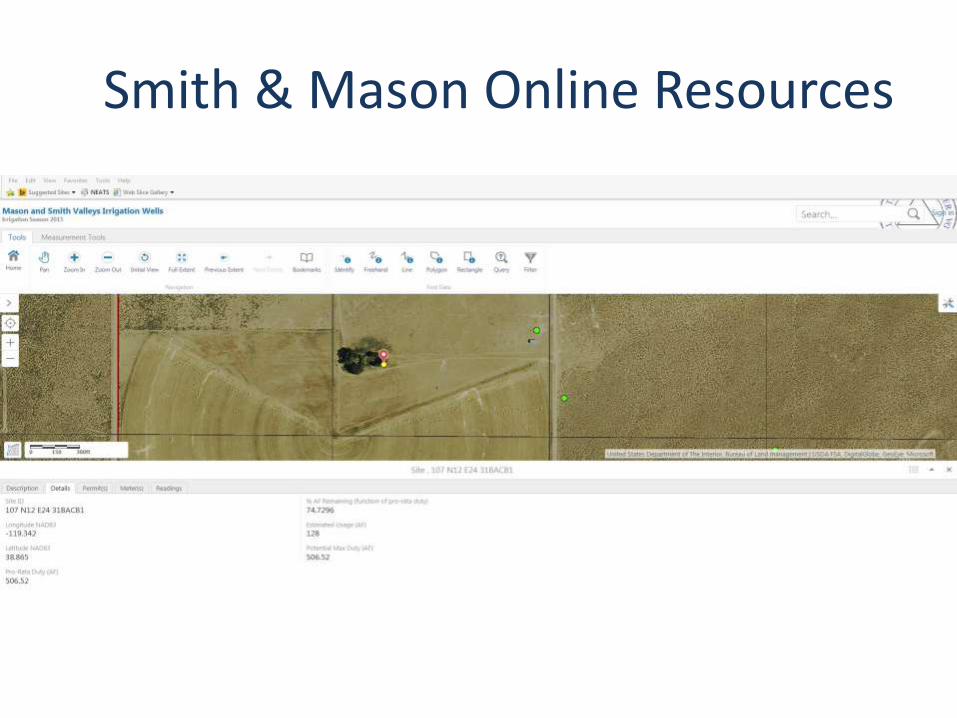
Smith & Mason Online Resources Using your web browser go to the following url: http://water.nv.gov/
Smith & Mason Online Resources
Smith & Mason Online Resources
Smith & Mason Online Resources
Disclaimer: This application has been developed to better locate and define the irrigation
water use within these basins. All data contained herein is provisional and subject to revision
at any time. For more information please contact Reed Cozens at [email protected] or
(775) 684-2816.
Smith & Mason Online Resources
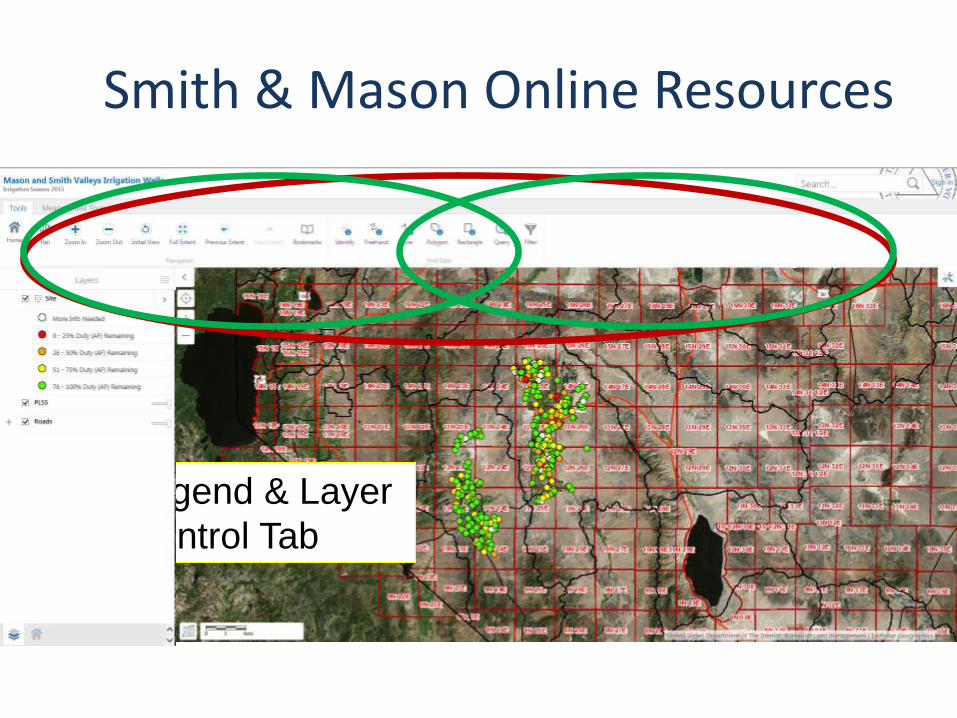
Legend & Layer
Control Tab
Smith & Mason Online Resources
Smith & Mason Online Resources

Modeling Results
&
Curtailment Details
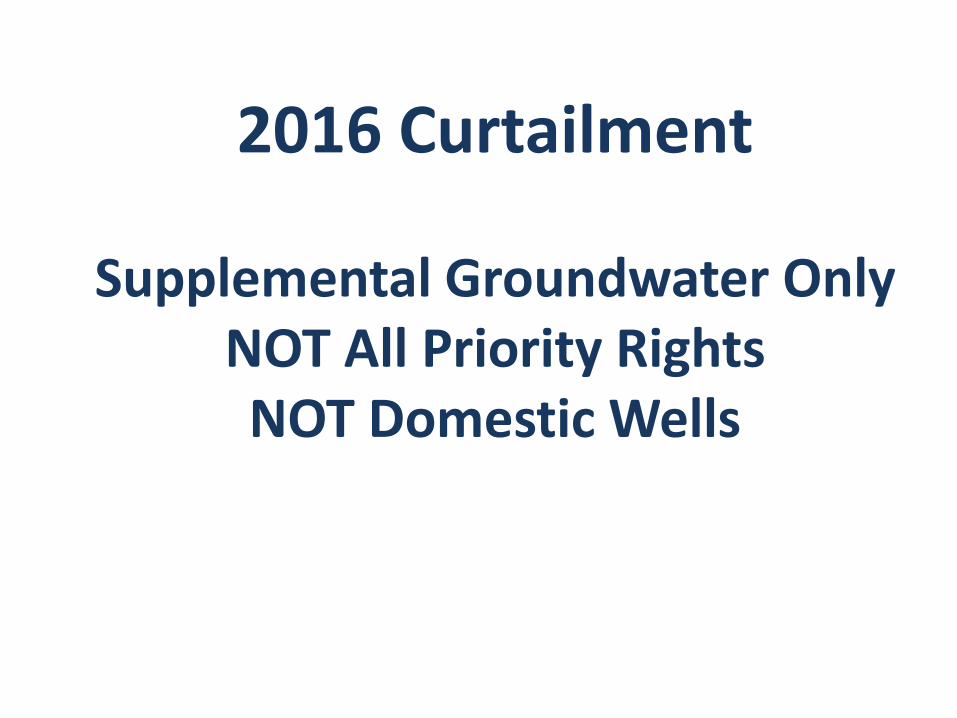
2016 Curtailment
Supplemental Groundwater Only NOT All Priority Rights NOT Domestic Wells
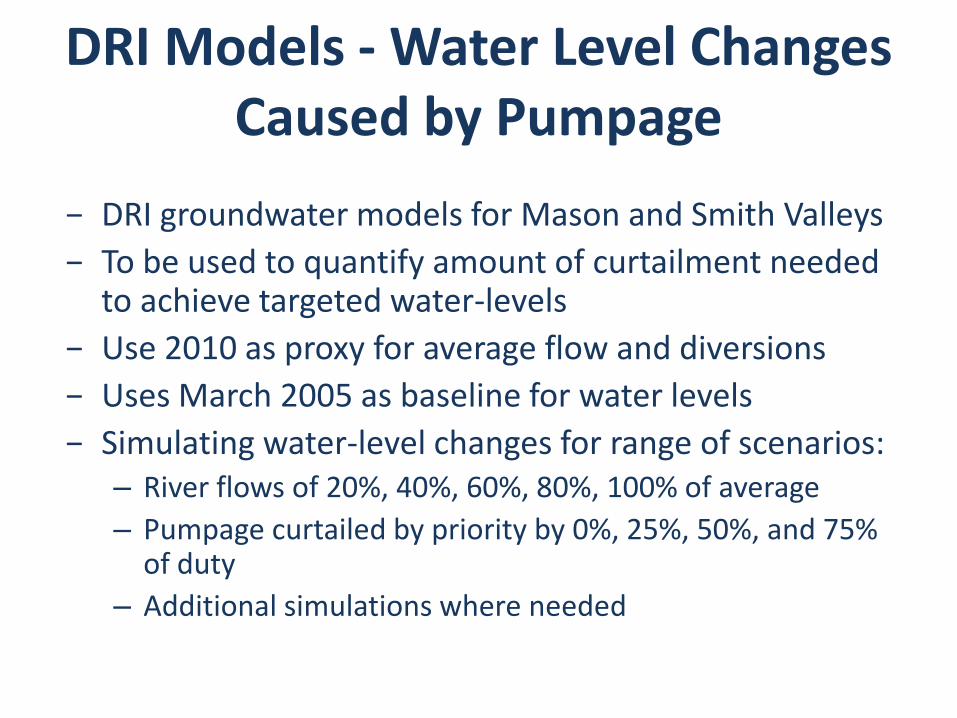
DRI Models - Water Level Changes Caused by Pumpage
− DRI groundwater models for Mason and Smith Valleys
− To be used to quantify amount of curtailment needed to achieve targeted water-levels
− Use 2010 as proxy for average flow and diversions
− Uses March 2005 as baseline for water levels
− Simulating water-level changes for range of scenarios: – River flows of 20%, 40%, 60%, 80%, 100% of average
– Pumpage curtailed by priority by 0%, 25%, 50%, and 75% of duty
– Additional simulations where needed
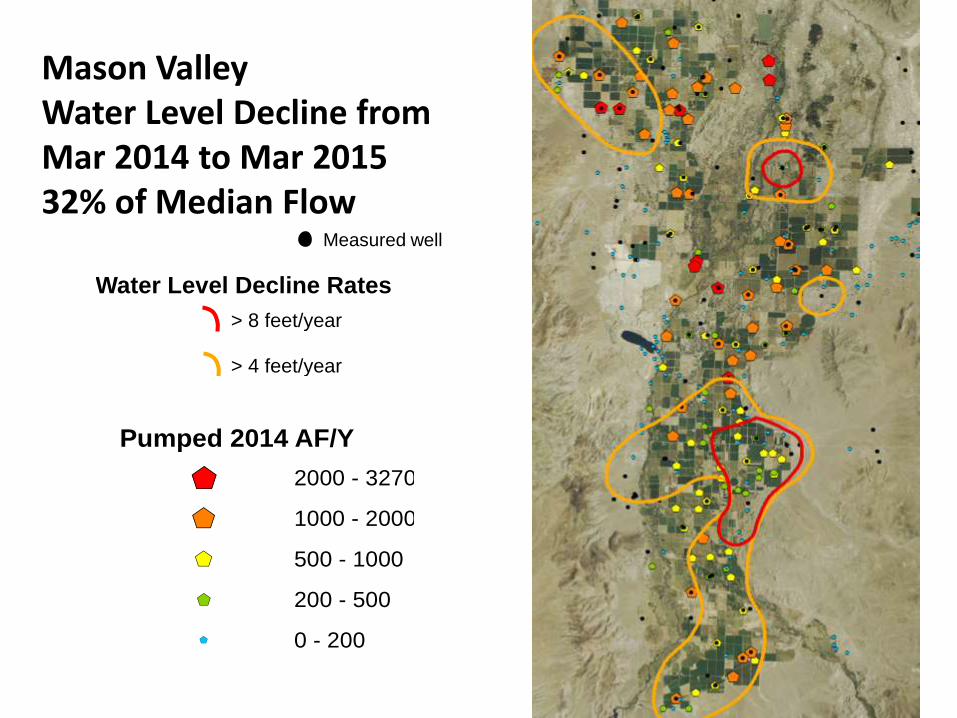
Mason Valley Water Level Decline from Mar 2014 to Mar 2015 32% of Median Flow
> 8 feet/year
> 4 feet/year
Water Level Decline Rates
Pumped 2014 AF/Y
$+ 2000 - 3270
$+ 1000 - 2000
$+ 500 - 1000
$+ 200 - 500
$+ 0 - 200
Measured well
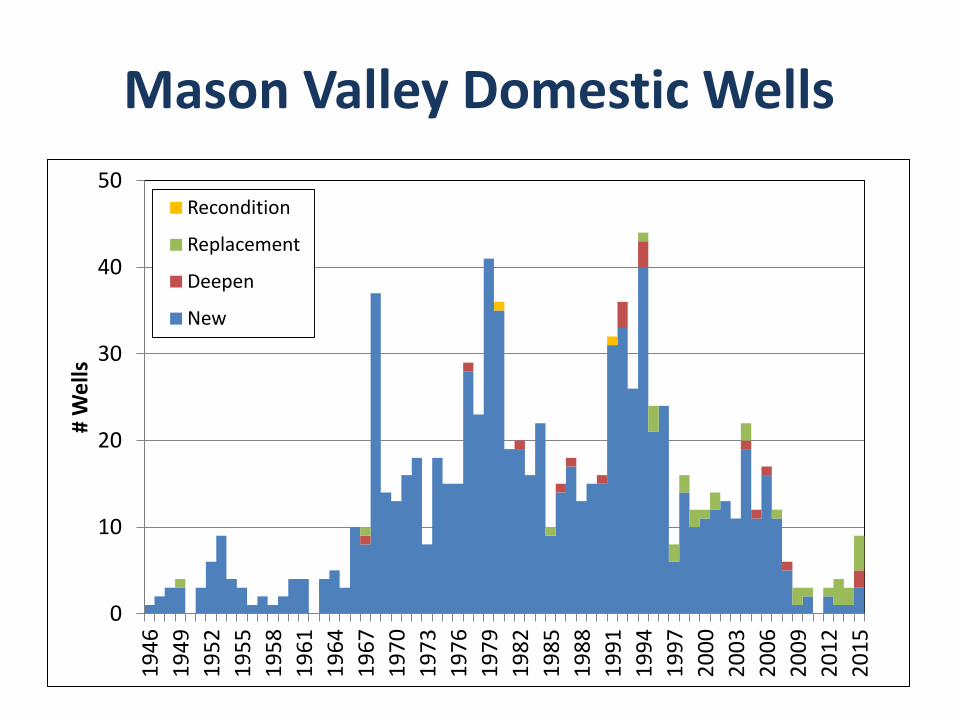
Mason Valley Domestic Wells
0
10
20
30
40
50
19
46
19
49
19
52
19
55
19
58
19
61
19
64
19
67
19
70
19
73
19
76
19
79
19
82
19
85
19
88
19
91
19
94
19
97
20
00
20
03
20
06
20
09
20
12
20
15
# W
ells
Recondition
Replacement
Deepen
New
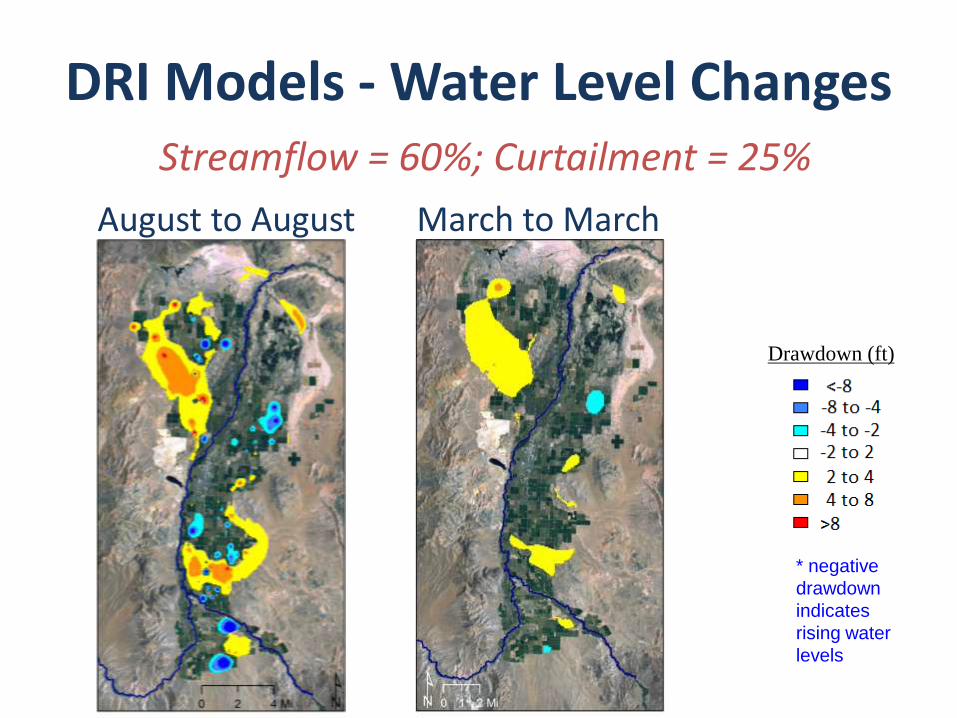
DRI Models - Water Level Changes Streamflow = 60%; Curtailment = 25%
August to August
March to March
* negative
drawdown
indicates
rising water
levels
Drawdown (ft)
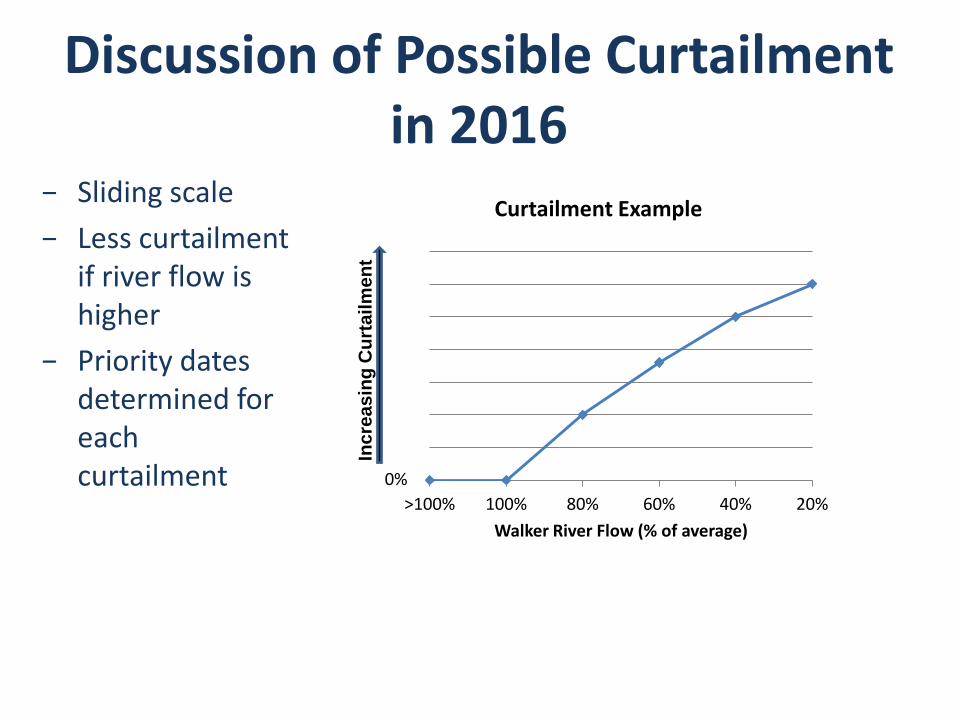
Discussion of Possible Curtailment in 2016
− Sliding scale
− Less curtailment if river flow is higher
− Priority dates determined for each curtailment
>100% 100% 80% 60% 40% 20%
Walker River Flow (% of average)
Curtailment Example
0%
Inc
rea
sin
g C
urt
ail
me
nt
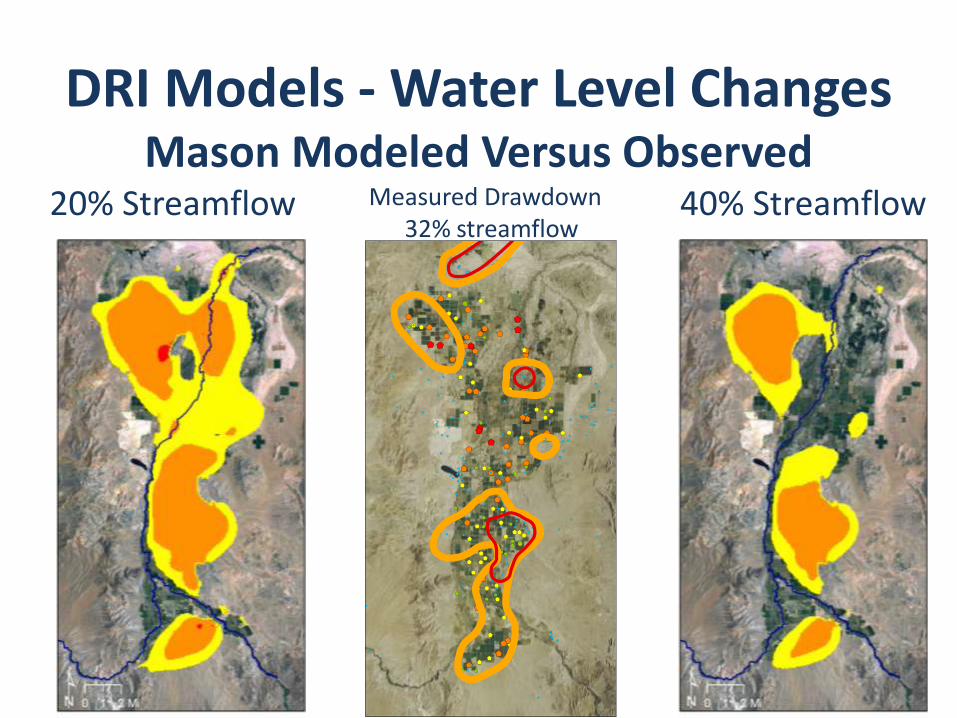
DRI Models - Water Level Changes Mason Modeled Versus Observed
20% Streamflow
Measured Drawdown 32% streamflow
40% Streamflow
$+
$+
$+
$+$+
$+
$+
$+
$+
$+
$+
$+
$+
$+
$+
$+
$+
$+
$+
$+$+
$+
$+
$+
$+
$+
$+
$+
$+
$+
$+$+
$+
$+
$+
$+
$+
$+
$+
$+
$+
$+
$+
$+
$+
$+
$+
$+$+
$+
$+
$+
$+
$+$+
$+
$+
$+
$+
$+
$+
$+
$+
$+
$+
$+
$+
$+
$+
$+
$+
$+
$+
$+$+
$+
$+
$+
$+
$+
$+
$+
$+
$+
$+
$+
$+
$+
$+
$+
$+
$+
$+
$+
$+
$+
$+
$+
$+
$+
$+
$+
$+
$+
$+
$+
$+
$+
$+
$+
$+
$+
$+$+$+
$+$+
$+
$+
$+
$+
$+
$+
$+
$+
$+
$+ $+
$+$+
$+
$+
$+
$+
$+
$+
$+
$+
$+$+
$+
$+
$+
$+
$+
$+
$+
$+
$+
$+
$+
$+
$+
$+
$+
$+
$+
$+
$+
$+
$+
$+
$+
$+$+
$+
$+
$+
$+
$+ $+
$+
$+
$+
$+
$+
$+
$+
$+
$+
$+
$+
$+$+
$+
$+
$+
$+
$+
$+
$+$+
$+
$+$+
$+
$+
$+
$+
$+
$+
$+
$+
$+
$+
$+
$+
$+
$+
$+
$+$+$+
$+$+
$+
$+
$+
$+
$+
$+
$+$+
$+
$+
$+
$+
$+
$+
$+
$+
$+
$+
$+
$+
$+
$+
$+
$+
$+
$+
$+
$+
$+
$+
$+
$+
$+
$+
$+$+$+$+$+$+
$+
$+
$+
$+ $+
$+
$+$+
$+
$+
$+
$+
$+
$+
$+
$+$+
$+
$+
$+
$+
$+
$+
$+
$+
$+
$+
$+
$+
$+
$+
$+
$+
$+
$+
$+
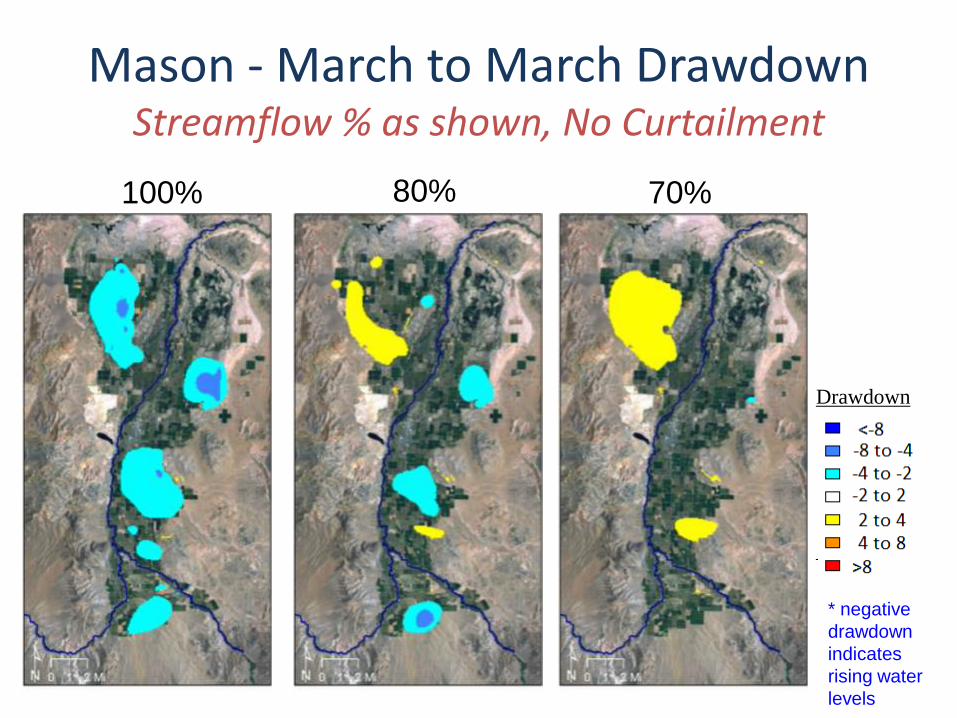
Mason - March to March Drawdown Streamflow % as shown, No Curtailment
100% 80% 70%
Drawdown
(ft)
* negative
drawdown
indicates
rising water
levels
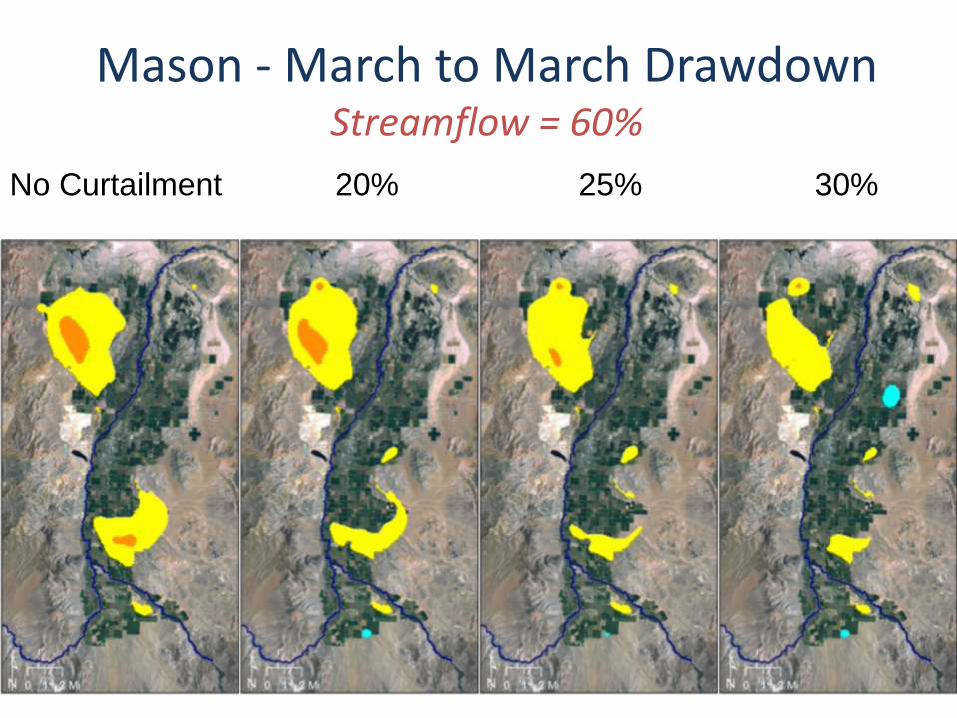
Mason - March to March Drawdown Streamflow = 60%
No Curtailment 20% 25% 30%
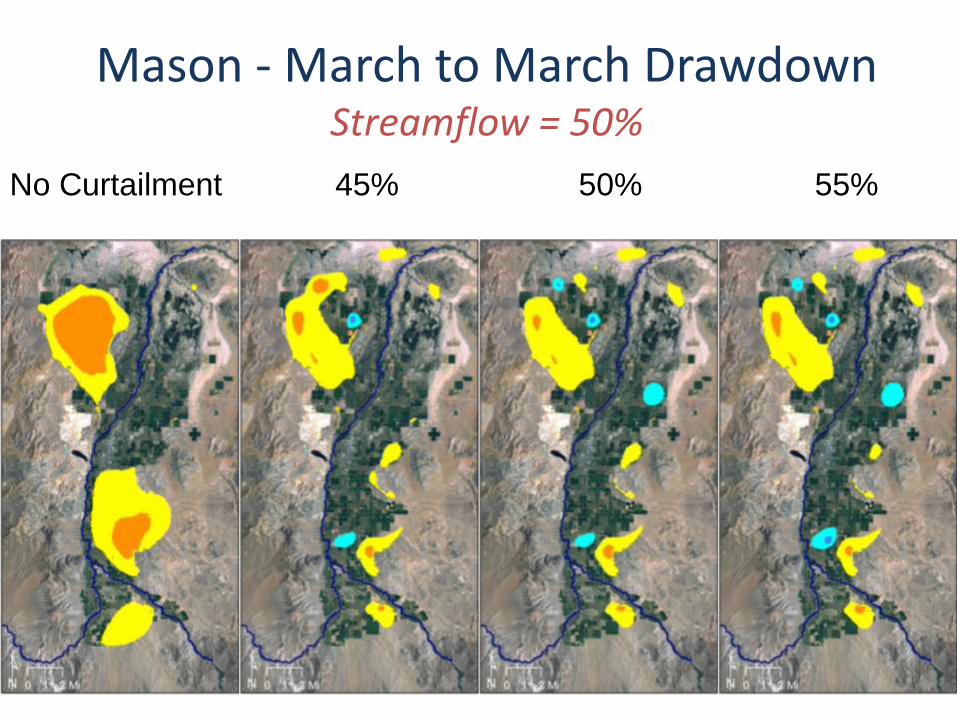
Mason - March to March Drawdown Streamflow = 50%
No Curtailment 45% 50% 55%
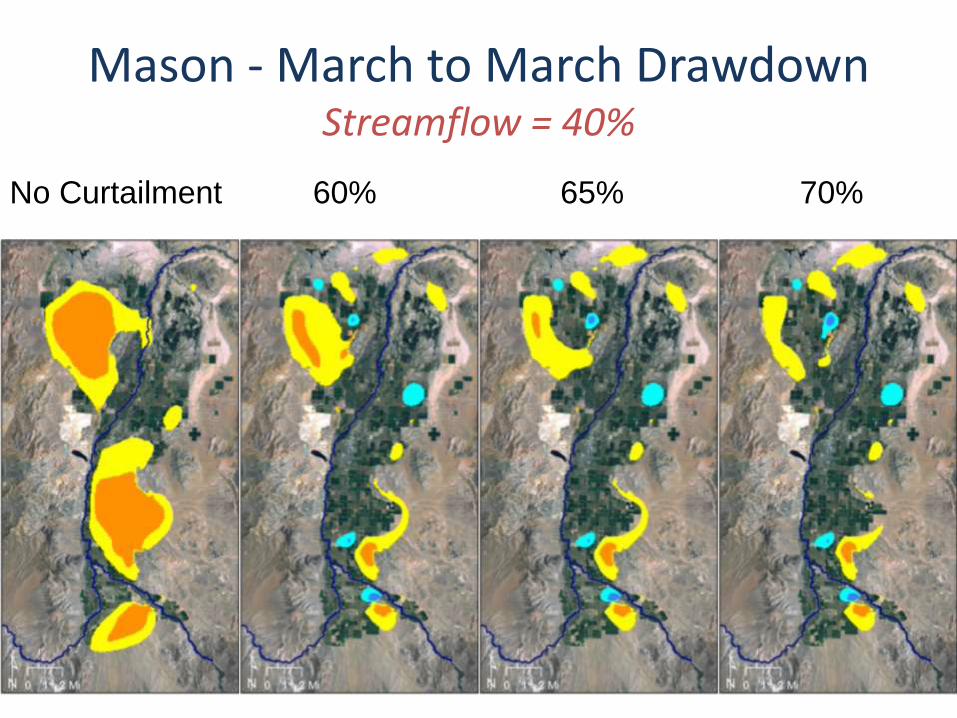
Mason - March to March Drawdown Streamflow = 40%
No Curtailment 60% 65% 70%
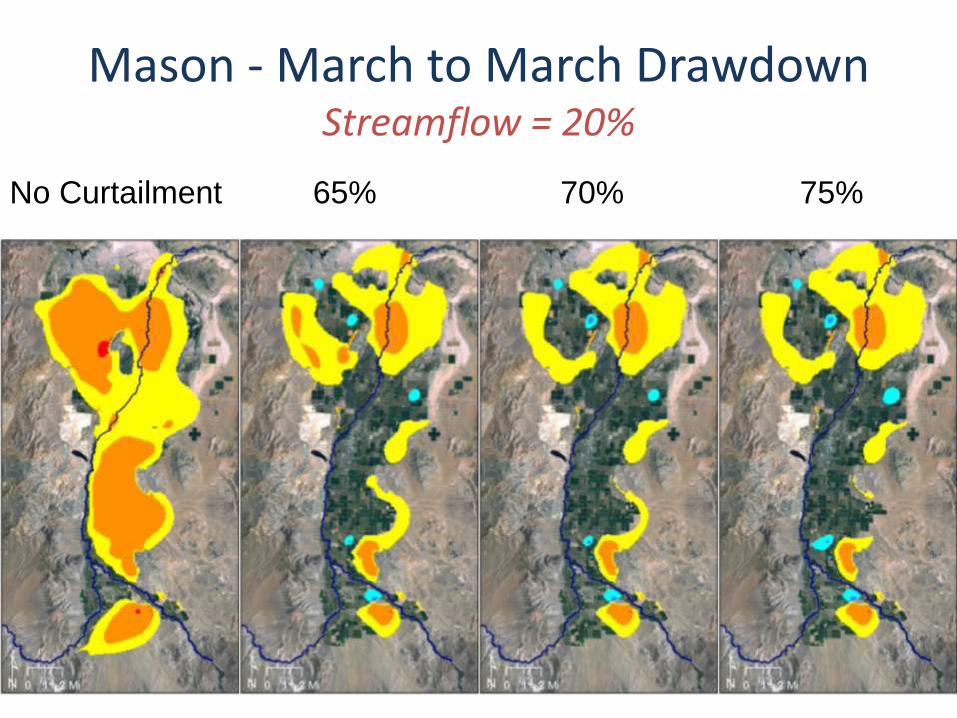
Mason - March to March Drawdown Streamflow = 20%
No Curtailment 65% 70% 75%
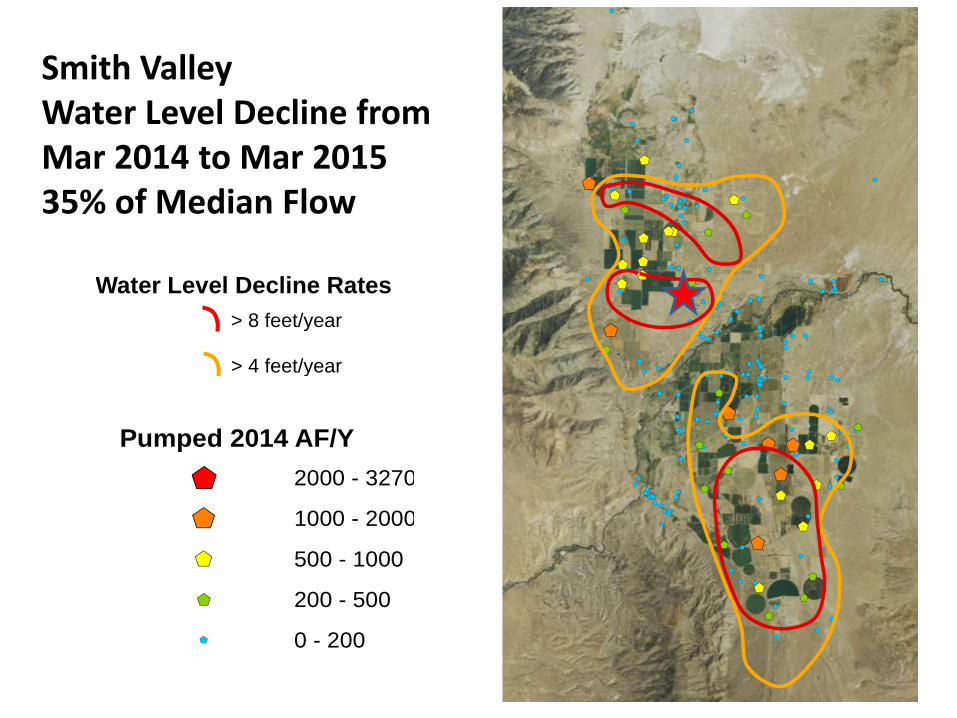
Smith Valley Water Level Decline from Mar 2014 to Mar 2015 35% of Median Flow
> 8 feet/year
> 4 feet/year
Water Level Decline Rates
Pumped 2014 AF/Y
$+ 2000 - 3270
$+ 1000 - 2000
$+ 500 - 1000
$+ 200 - 500
$+ 0 - 200
$+$+$+
$+$+
$+$+
$+$+$+$+$+$+$+
$+
$+
$+$+
$+
$+$+$+
$+
$+$+
$+ $+
$+
$+$+
$+
$+$+$+
$+
$+
$+
$+
$+
$+
$+
$+
$+
$+
$+
$+$+
$+ $+ $+
$+
$+$+
$+
$+$+
$+$+
$+$+ $+
$+$+
$+
$+
$+$+$+
$+$+
$+$+
$+
$+$+
$+$+
$+$+
$+
$+$+
$+$+
$+
$+
$+$+$+$+$+
$+
$+
$+$+
$+$+
$+ $+$+$+ $+
$+$+$+$+
$+$+
$+
$+
$+$+$+ $+$+
$+ $+$+$+$+
$+$+$+
$+$+$+$+
$+$+$+ $+$+
$+ $+$+
$+$+
$+
$+
$+
$+
$+$+$+ $+$+
$+
$+
$+$+
$+$+$+
$+
$+$+
$+
$+
$+
$+
$+
$+$+
$+
$+$+
$+
$+
$+
$+$+$+
$+$+
$+$+
$+ $+$+
$+
$+
$+
$+ $+
$+
$+
$+
$+$+$+
$+
$+$+
$+
$+$+
$+
$+
$+
$+
$+$+
$+
$+
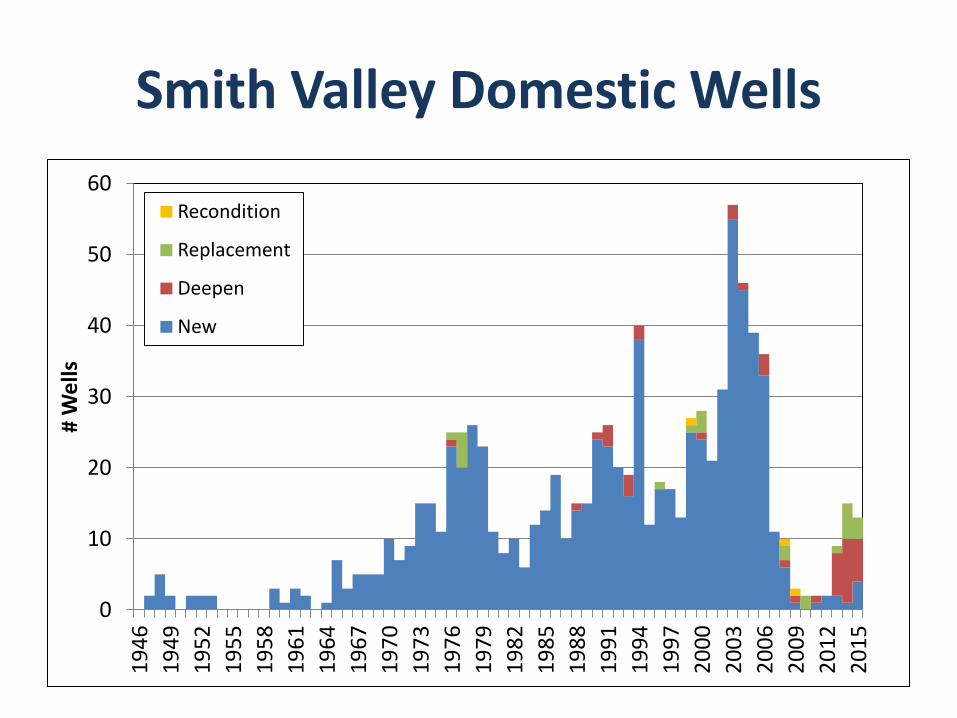
Smith Valley Domestic Wells
0
10
20
30
40
50
60
19
46
19
49
19
52
19
55
19
58
19
61
19
64
19
67
19
70
19
73
19
76
19
79
19
82
19
85
19
88
19
91
19
94
19
97
20
00
20
03
20
06
20
09
20
12
20
15
# W
ells
Recondition
Replacement
Deepen
New
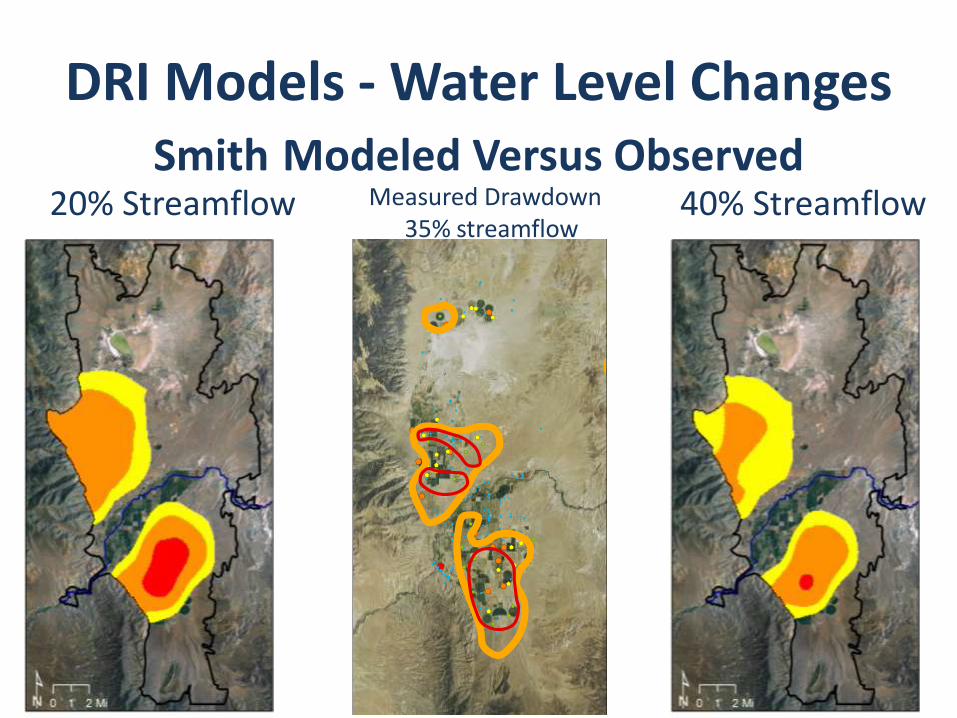
DRI Models - Water Level Changes Smith Modeled Versus Observed
20% Streamflow
Measured Drawdown 35% streamflow
40% Streamflow
$+
$+
$+
$+
$+$+$+$+
$+$+
$+$+
$+$+$+$+$+$+$+
$+
$+
$+$+
$+
$+$+$+
$+
$+$+
$+ $+
$+
$+$+$+
$+
$+$+$+
$+
$+
$+
$+
$+
$+
$+
$+
$+
$+
$+
$+$+
$+
$+ $+ $+
$+
$+$+$+
$+
$+$+
$+$+
$+$+ $+
$+$+
$+
$+
$+$+$+
$+$+
$+$+
$+
$+$+
$+$+
$+$+
$+
$+$+
$+$+
$+
$+
$+$+$+$+$+
$+
$+
$+$+
$+$+
$+ $+$+$+ $+
$+$+$+$+
$+$+
$+
$+
$+$+$+ $+$+
$+ $+$+$+$+
$+$+$+
$+$+$+$+
$+$+$+ $+$+
$+ $+$+
$+$+
$+
$+
$+
$+
$+$+$+ $+$+
$+
$+
$+$+
$+$+$+
$+
$+$+
$+
$+
$+
$+
$+
$+$+
$+
$+$+
$+
$+
$+
$+$+$+
$+$+
$+$+
$+ $+$+
$+
$+
$+
$+ $+
$+
$+
$+
$+$+$+
$+
$+$+
$+
$+$+
$+
$+$+$+
$+
$+
$+$+
$+
$+
$+

Discussion of Possible Curtailment in 2016
− Sliding scale
− Less curtailment if river flow is higher
− Priority dates determined for each curtailment
>100% 100% 80% 60% 40% 20%
Walker River Flow (% of average)
Curtailment Example
0%
Inc
rea
sin
g C
urt
ail
me
nt
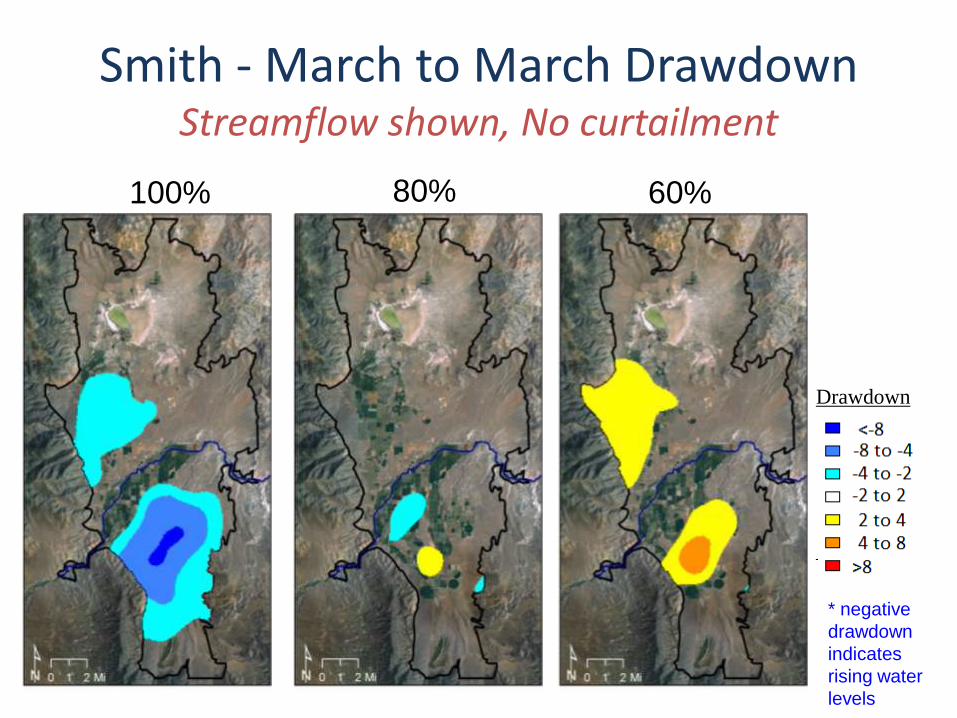
Smith - March to March Drawdown Streamflow shown, No curtailment
100% 80% 60%
Drawdown
(ft)
* negative
drawdown
indicates
rising water
levels
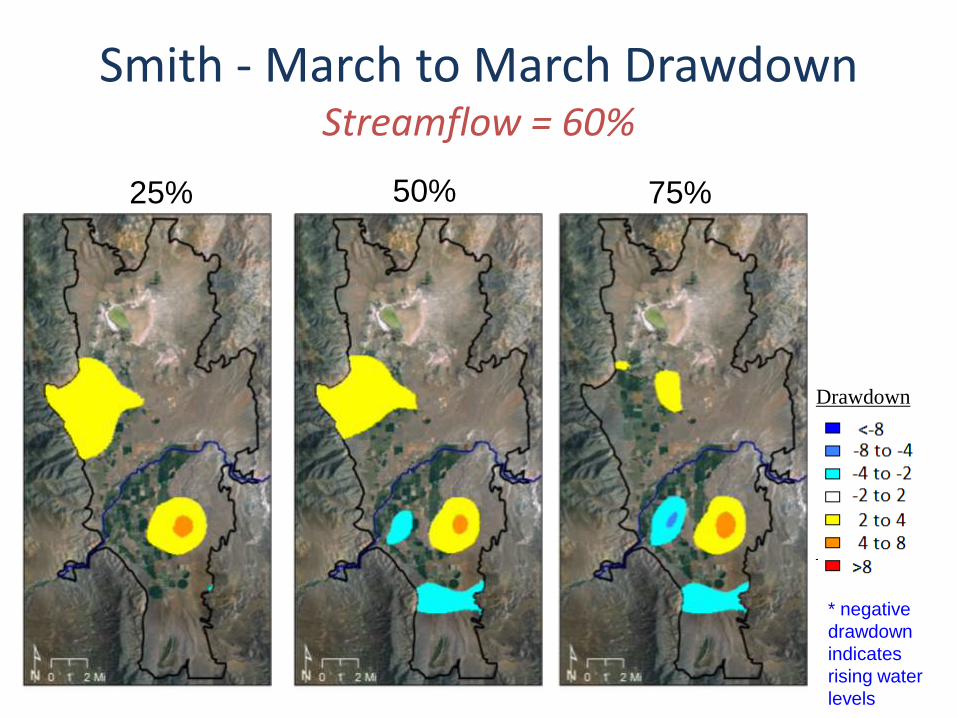
Smith - March to March Drawdown Streamflow = 60%
25% 50% 75%
Drawdown
(ft)
* negative
drawdown
indicates
rising water
levels
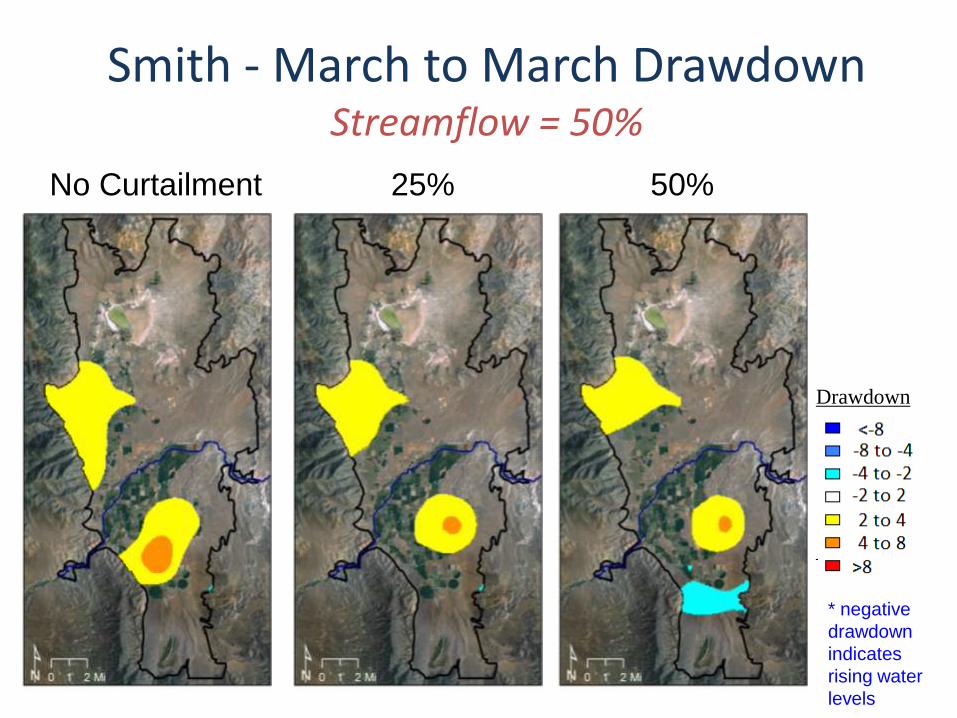
Smith - March to March Drawdown Streamflow = 50%
No Curtailment 25% 50%
Drawdown
(ft)
* negative
drawdown
indicates
rising water
levels
Smith - March to March Drawdown Streamflow = 40%
No Curtailment 70% 75% 100%
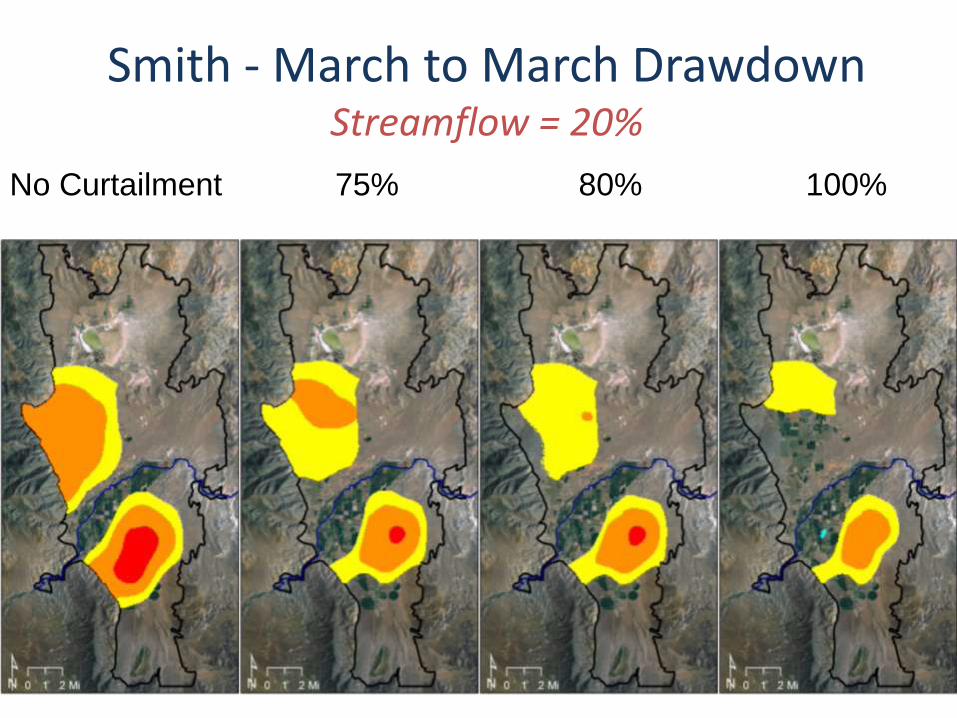
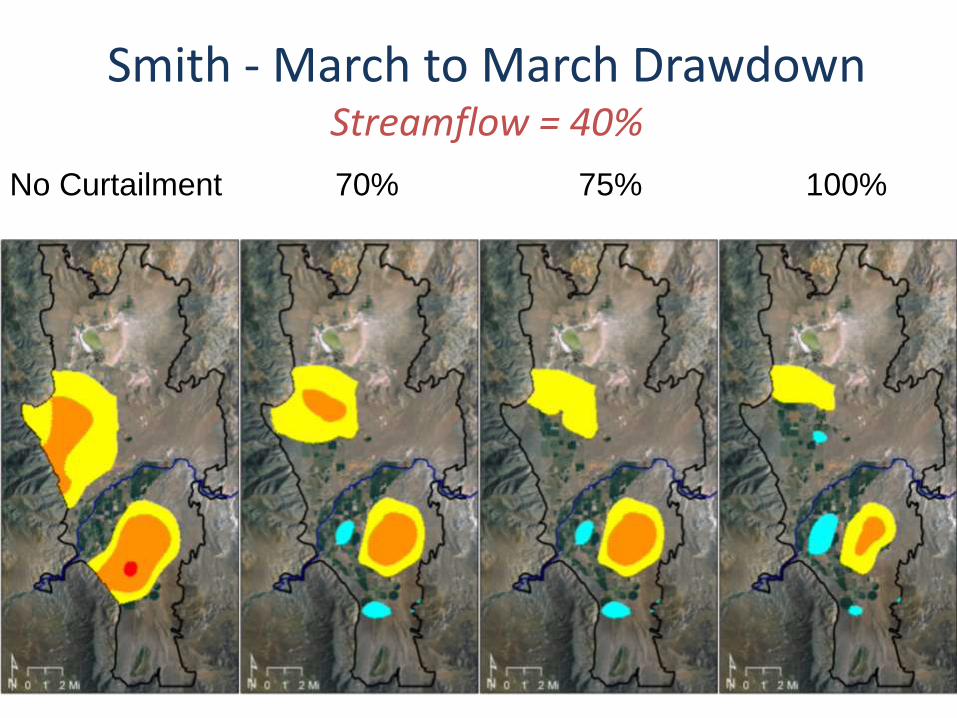
Smith - March to March Drawdown Streamflow = 20%
No Curtailment 75% 80% 100%
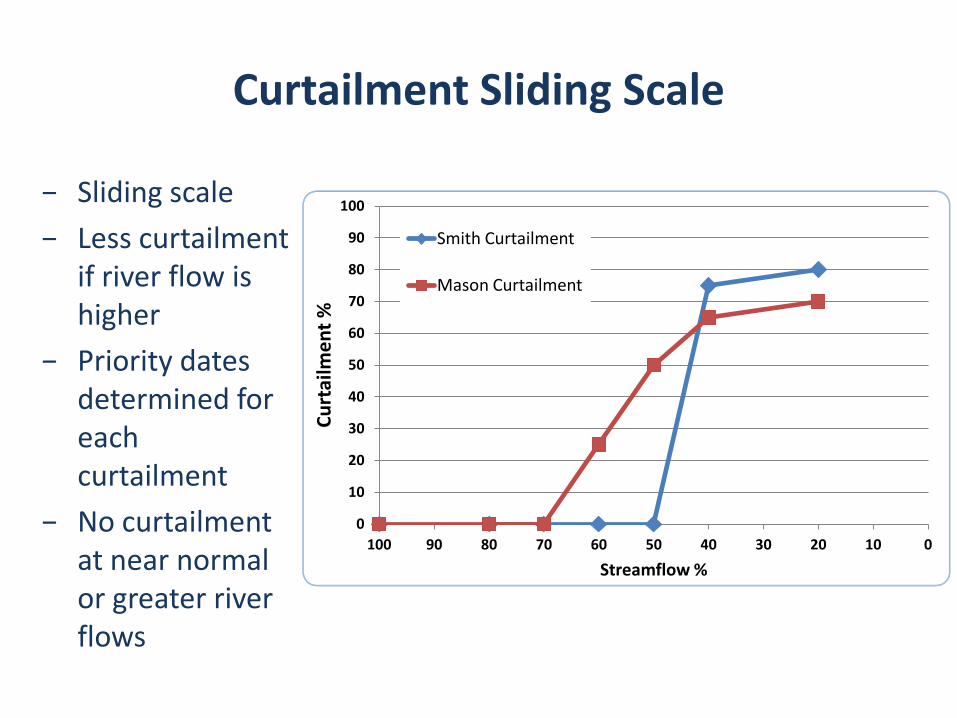
Curtailment Sliding Scale
− Sliding scale
− Less curtailment if river flow is higher
− Priority dates determined for each curtailment
− No curtailment at near normal or greater river flows
0
10
20
30
40
50
60
70
80
90
100
0 10 20 30 40 50 60 70 80 90 100
Cu
rtai
lme
nt
%
Streamflow %
Smith Curtailment
Mason Curtailment
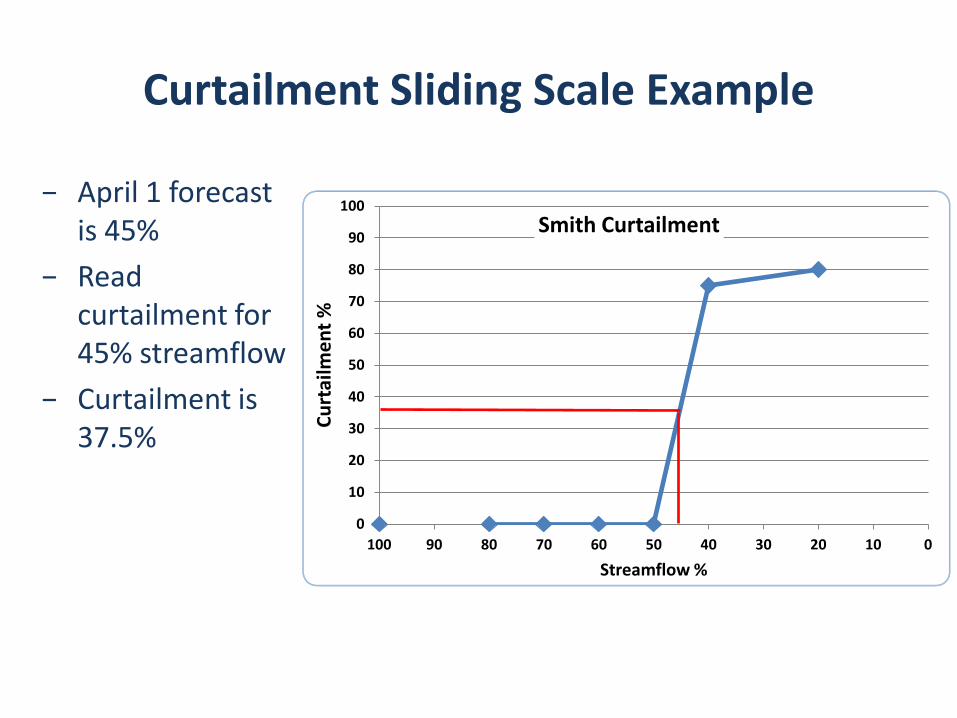
Curtailment Sliding Scale Example
− April 1 forecast is 45%
− Read curtailment for 45% streamflow
− Curtailment is 37.5%
0
10
20
30
40
50
60
70
80
90
100
0 10 20 30 40 50 60 70 80 90 100
Cu
rtai
lme
nt
%
Streamflow %
Smith Curtailment
Curtailment Sliding Scale Example
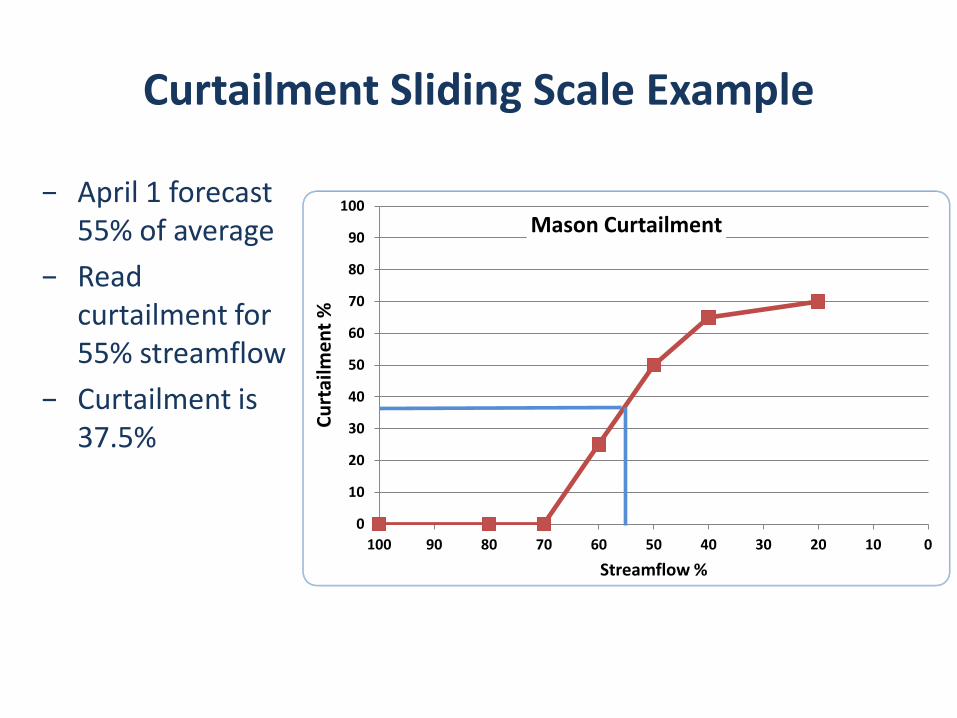
− April 1 forecast 55% of average
− Read curtailment for 55% streamflow
− Curtailment is 37.5%
0
10
20
30
40
50
60
70
80
90
100
0 10 20 30 40 50 60 70 80 90 100
Cu
rtai
lme
nt
%
Streamflow %
Mason Curtailment
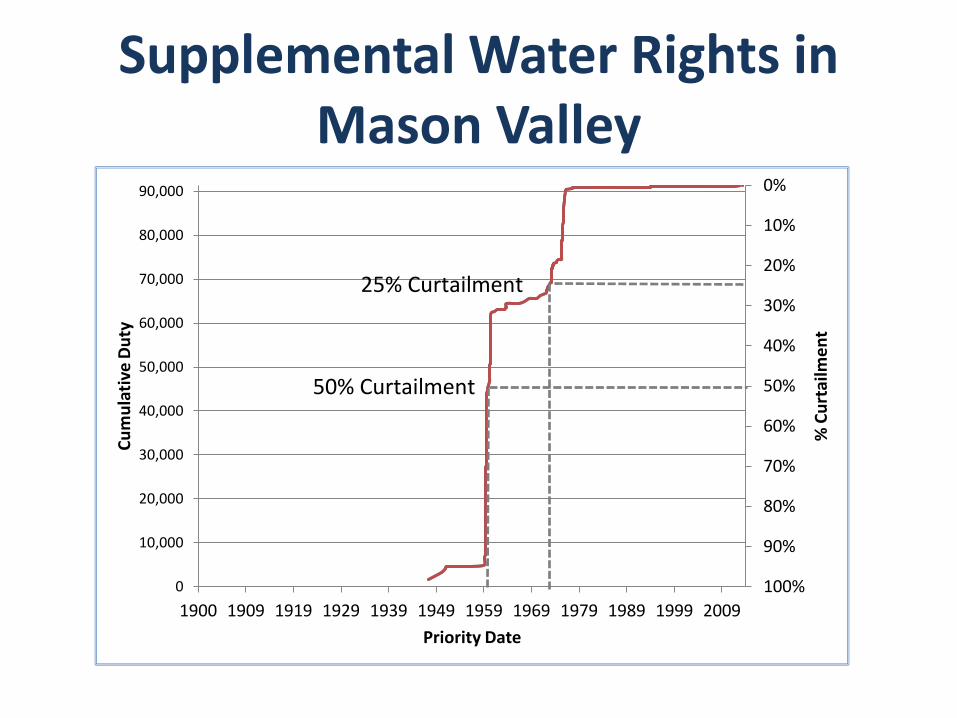
Supplemental Water Rights in Mason Valley
0%
10%
20%
30%
40%
50%
60%
70%
80%
90%
100% 0
10,000
20,000
30,000
40,000
50,000
60,000
70,000
80,000
90,000
1900 1909 1919 1929 1939 1949 1959 1969 1979 1989 1999 2009
% C
urt
ailm
en
t
Cu
mu
lati
ve D
uty
Priority Date
25% Curtailment
50% Curtailment
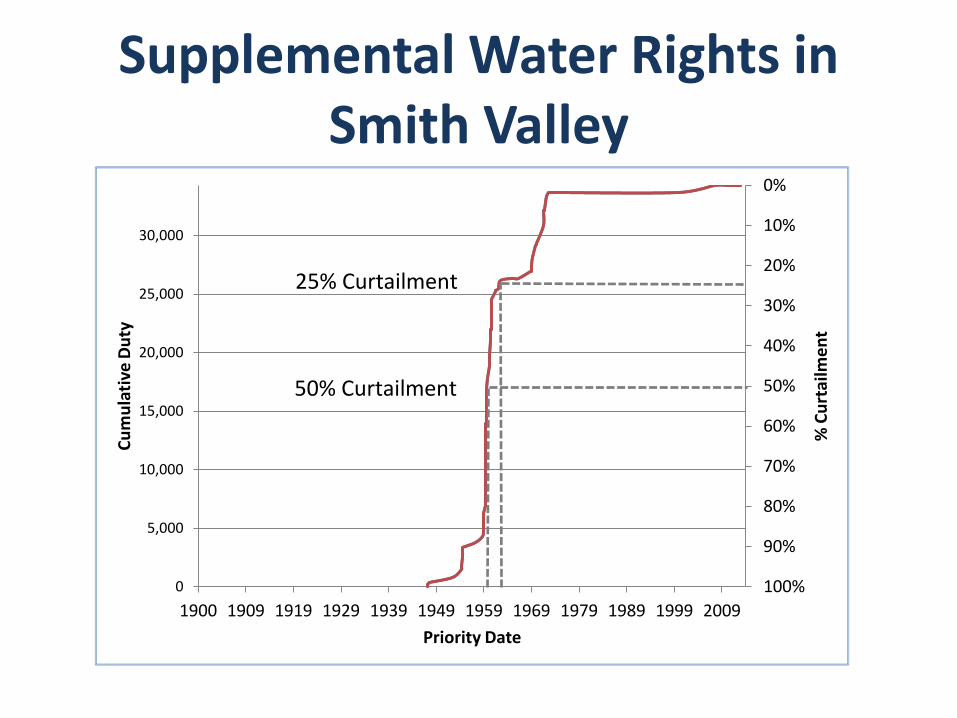
Supplemental Water Rights in Smith Valley
0%
10%
20%
30%
40%
50%
60%
70%
80%
90%
100% 0
5,000
10,000
15,000
20,000
25,000
30,000
1900 1909 1919 1929 1939 1949 1959 1969 1979 1989 1999 2009
% C
urt
ailm
en
t
Cu
mu
lati
ve D
uty
Priority Date
25% Curtailment
50% Curtailment

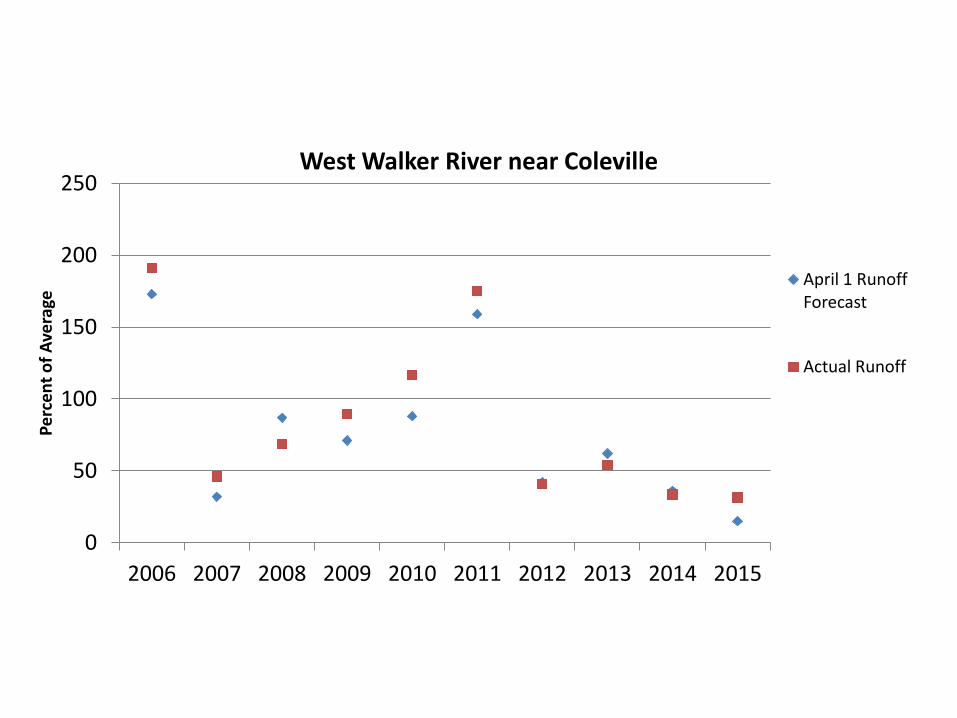
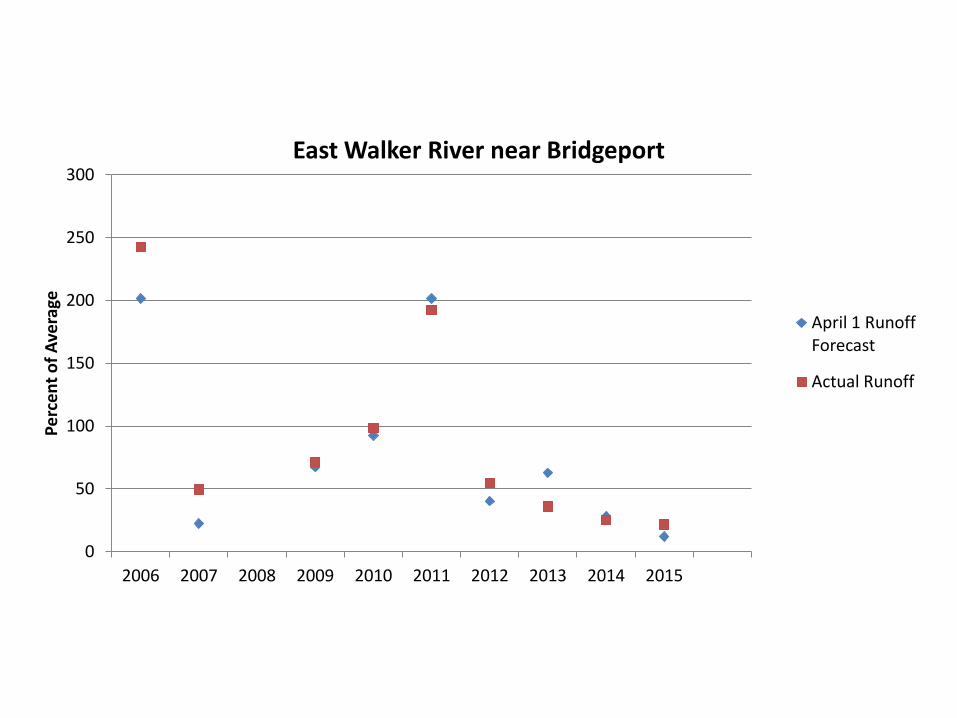
Streamflow Forecasts
NRCS April 1 Forecast for Water Supply
• Gages: West Walker nr Coleville and East Walker nr Bridgeport
• Best available forecast of water supply for Smith and Mason Valleys
• Data considered: – SNOTEL
– Snow course
– Total precipitation
– Soil moisture
– Forecast updated monthly beginning January 1.
– http://www.nrcs.usda.gov/wps/portal/nrcs/main/nv/snow/
0
50
100
150
200
250
2006 2007 2008 2009 2010 2011 2012 2013 2014 2015
Pe
rce
nt
of
Ave
rage
West Walker River near Coleville
April 1 Runoff Forecast
Actual Runoff
0
50
100
150
200
250
300
2006 2007 2008 2009 2010 2011 2012 2013 2014 2015
Pe
rce
nt
of
Ave
rage
East Walker River near Bridgeport
April 1 Runoff Forecast
Actual Runoff

Curtailment Examples
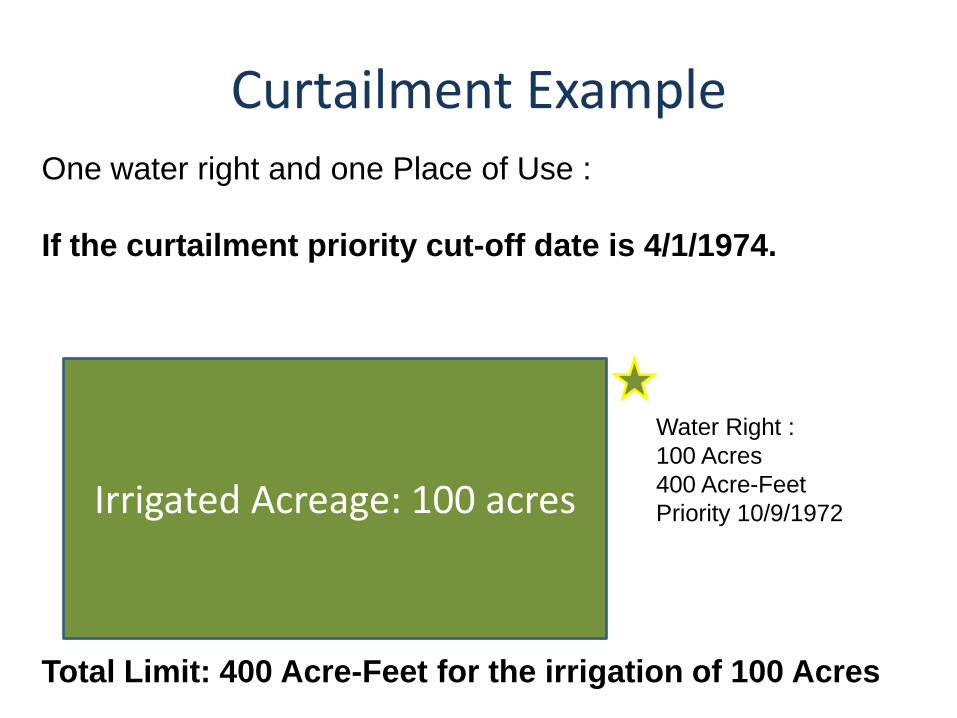
Curtailment Example One water right and one Place of Use :
If the curtailment priority cut-off date is 4/1/1974.
Irrigated Acreage: 100 acres
Water Right :
100 Acres
400 Acre-Feet
Priority 10/9/1972
Total Limit: 400 Acre-Feet for the irrigation of 100 Acres
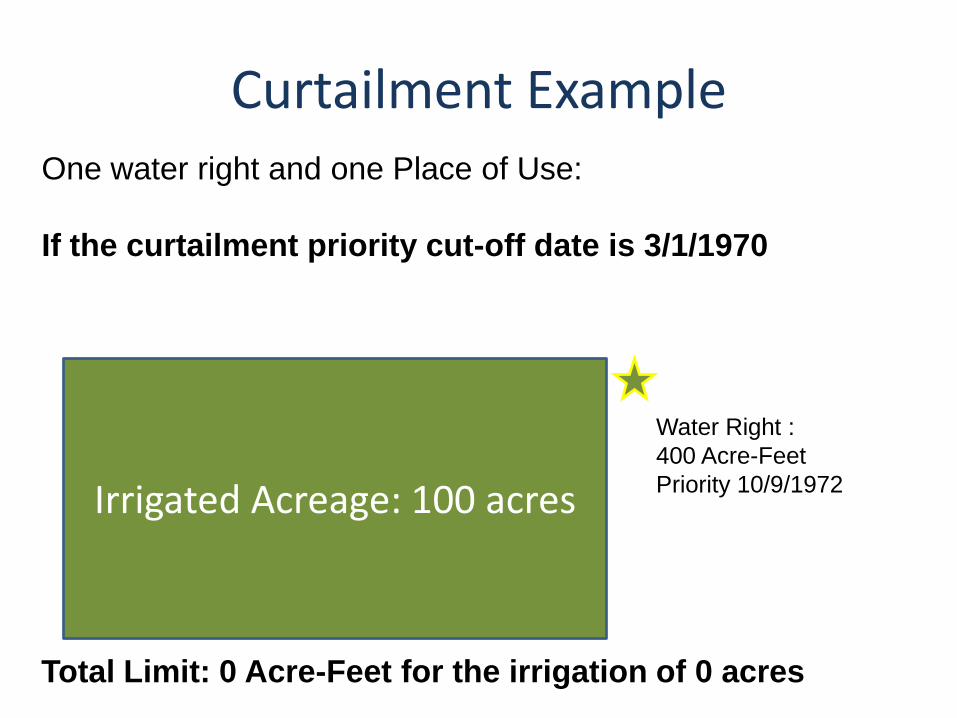
Curtailment Example One water right and one Place of Use:
If the curtailment priority cut-off date is 3/1/1970
Irrigated Acreage: 100 acres
Water Right :
400 Acre-Feet
Priority 10/9/1972
Total Limit: 0 Acre-Feet for the irrigation of 0 acres
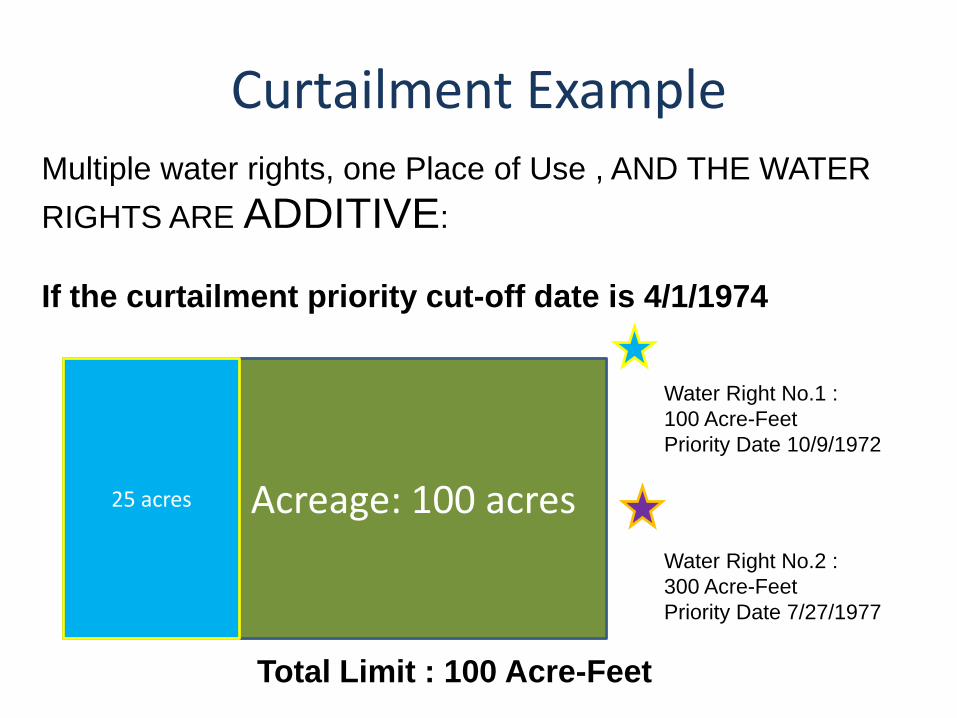
75 acres Irrigated Acreage: 100 acres 25 acres
Curtailment Example Multiple water rights, one Place of Use , AND THE WATER
RIGHTS ARE ADDITIVE:
If the curtailment priority cut-off date is 4/1/1974
Water Right No.1 :
100 Acre-Feet
Priority Date 10/9/1972
Water Right No.2 :
300 Acre-Feet
Priority Date 7/27/1977
Total Limit : 100 Acre-Feet
Irrigated Acreage: 100 acres 75 acres
50 Acres of Overlap
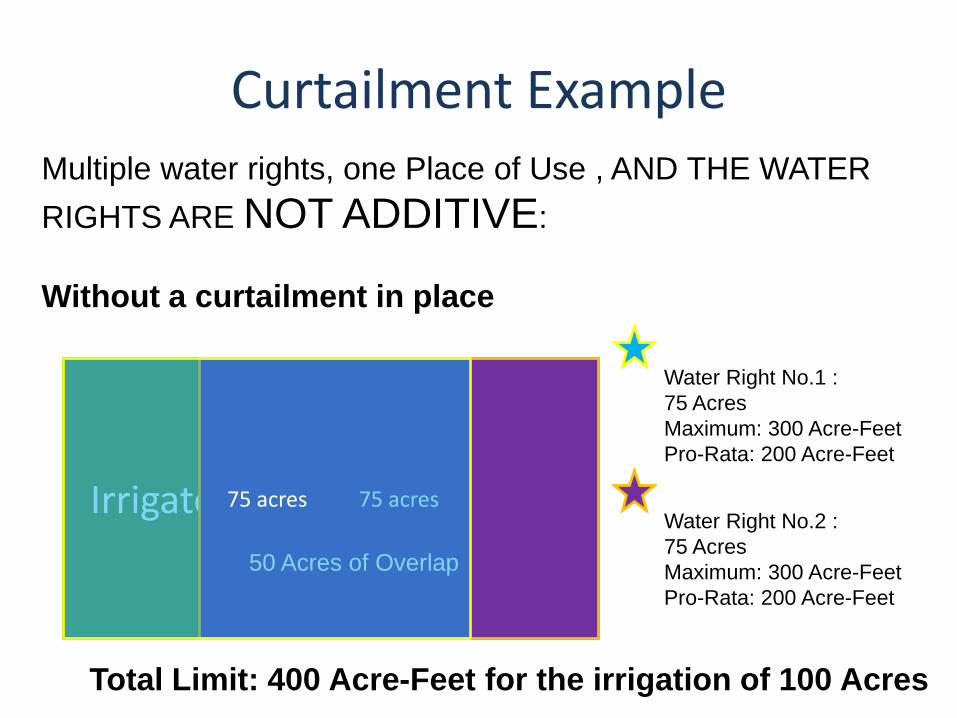
Curtailment Example Multiple water rights, one Place of Use , AND THE WATER
RIGHTS ARE NOT ADDITIVE:
Without a curtailment in place
Water Right No.1 :
75 Acres
Maximum: 300 Acre-Feet
Pro-Rata: 200 Acre-Feet
Water Right No.2 :
75 Acres
Maximum: 300 Acre-Feet
Pro-Rata: 200 Acre-Feet
Total Limit: 400 Acre-Feet for the irrigation of 100 Acres
75 acres
Irrigated Acreage: 100 acres 75 acres 75 acres
50 Acres of Overlap
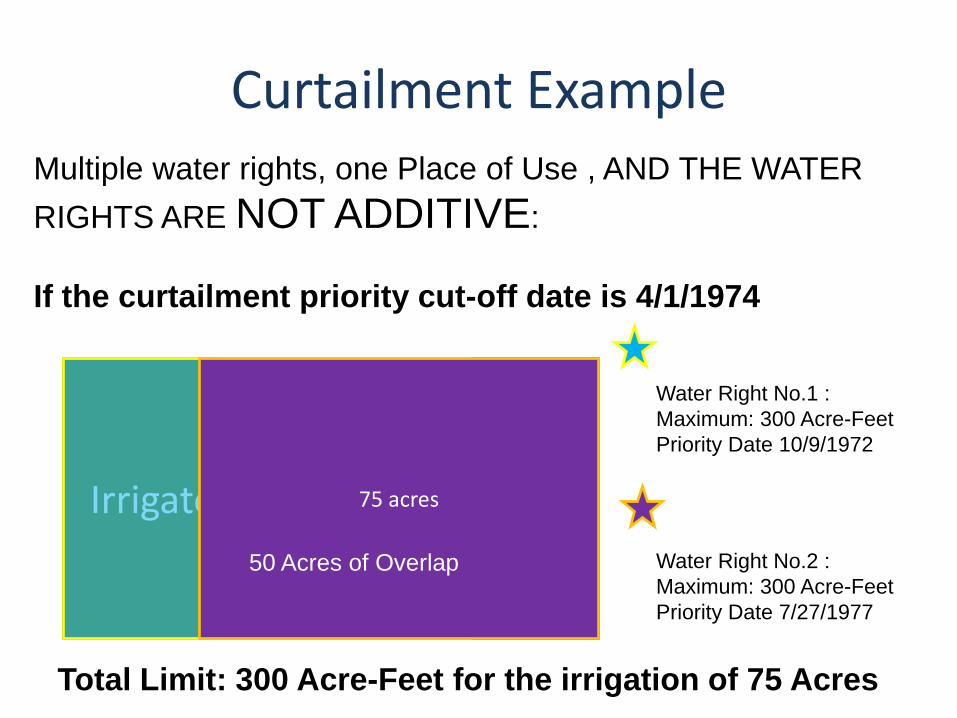
Curtailment Example
Water Right No.1 :
Maximum: 300 Acre-Feet
Priority Date 10/9/1972
Water Right No.2 :
Maximum: 300 Acre-Feet
Priority Date 7/27/1977
Total Limit: 300 Acre-Feet for the irrigation of 75 Acres
Multiple water rights, one Place of Use , AND THE WATER
RIGHTS ARE NOT ADDITIVE:
If the curtailment priority cut-off date is 4/1/1974

Why Only Supplemental Rights
are Curtailed
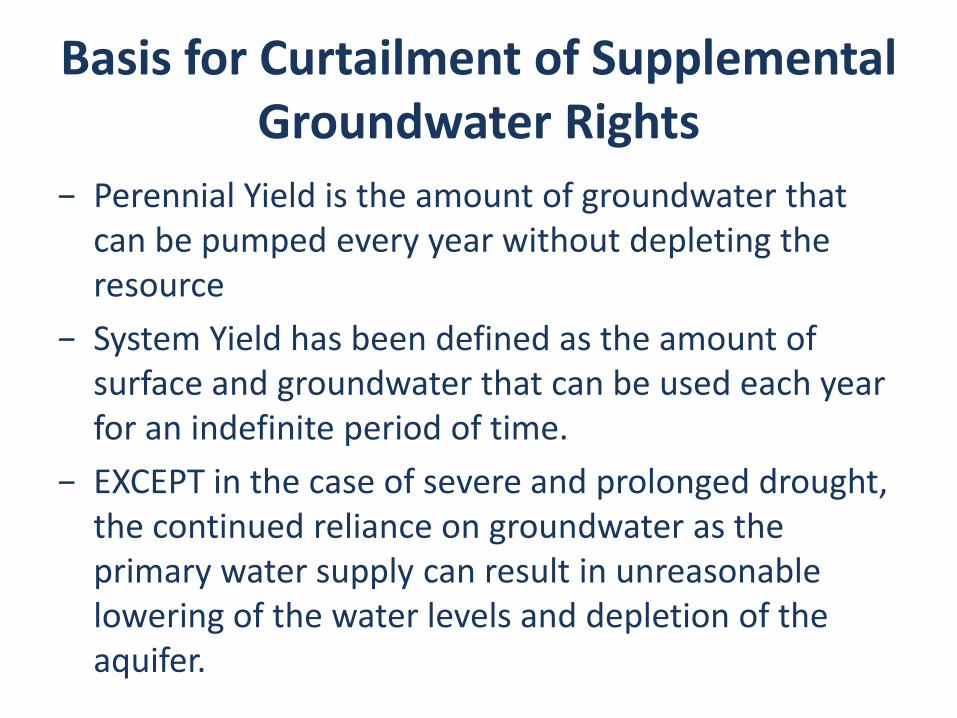
Basis for Curtailment of Supplemental Groundwater Rights
− Perennial Yield is the amount of groundwater that can be pumped every year without depleting the resource
− System Yield has been defined as the amount of surface and groundwater that can be used each year for an indefinite period of time.
− EXCEPT in the case of severe and prolonged drought, the continued reliance on groundwater as the primary water supply can result in unreasonable lowering of the water levels and depletion of the aquifer.
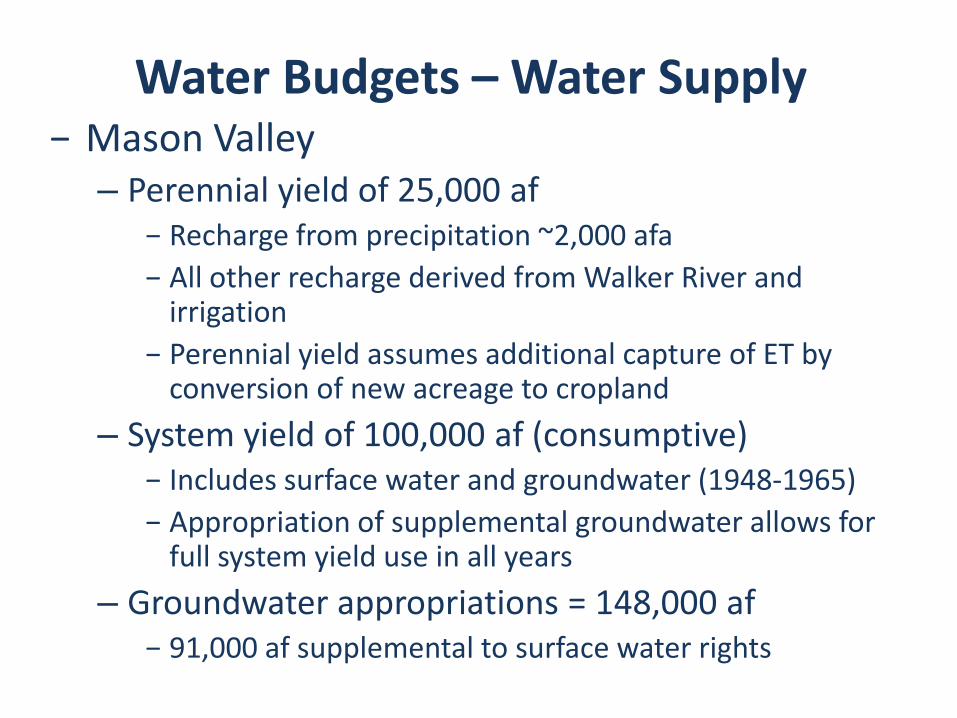
Water Budgets – Water Supply − Mason Valley
– Perennial yield of 25,000 af − Recharge from precipitation ~2,000 afa
− All other recharge derived from Walker River and irrigation
− Perennial yield assumes additional capture of ET by conversion of new acreage to cropland
– System yield of 100,000 af (consumptive) − Includes surface water and groundwater (1948-1965)
− Appropriation of supplemental groundwater allows for full system yield use in all years
– Groundwater appropriations = 148,000 af − 91,000 af supplemental to surface water rights
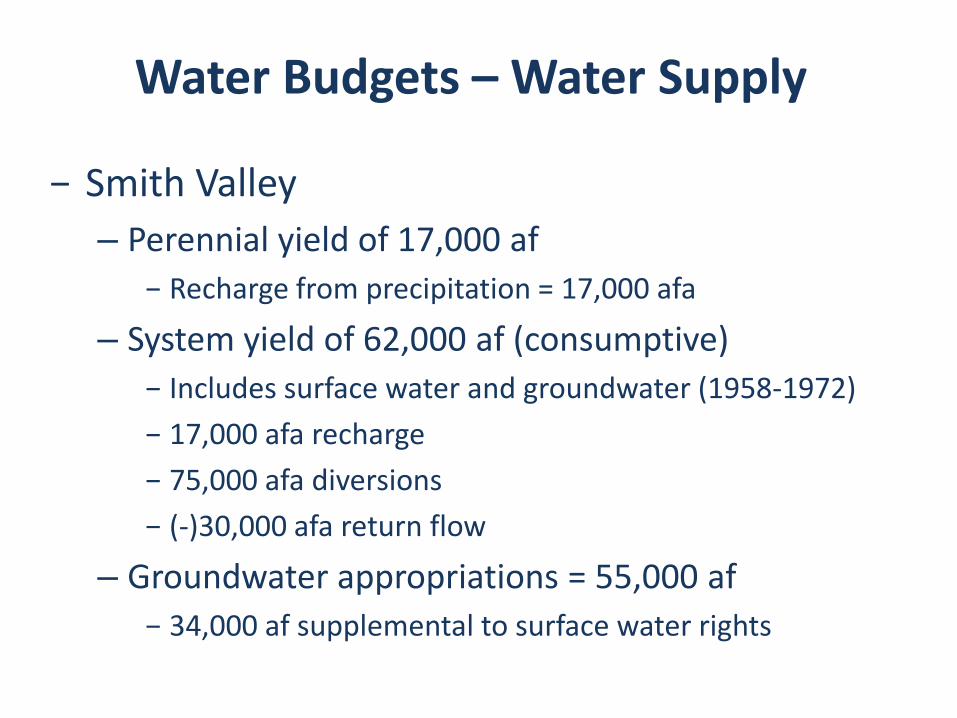
Water Budgets – Water Supply
− Smith Valley
– Perennial yield of 17,000 af
− Recharge from precipitation = 17,000 afa
– System yield of 62,000 af (consumptive)
− Includes surface water and groundwater (1958-1972)
− 17,000 afa recharge
− 75,000 afa diversions
− (-)30,000 afa return flow
– Groundwater appropriations = 55,000 af
− 34,000 af supplemental to surface water rights
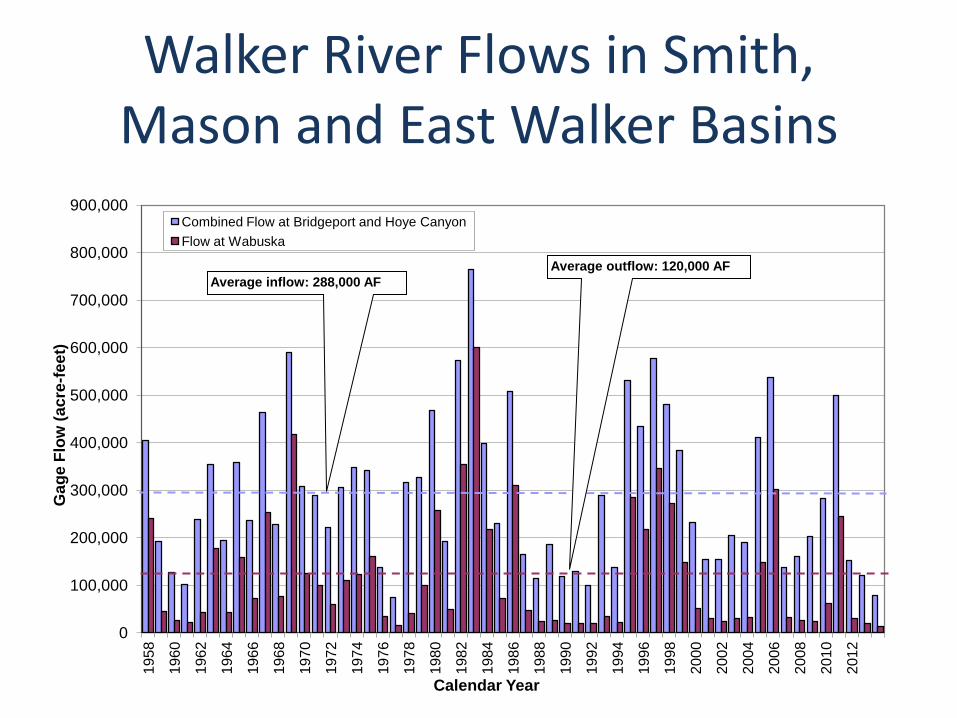
Walker River Flows in Smith, Mason and East Walker Basins
0
100,000
200,000
300,000
400,000
500,000
600,000
700,000
800,000
900,000
1958
1960
1962
1964
1966
1968
1970
1972
1974
1976
1978
1980
1982
1984
1986
1988
1990
1992
1994
1996
1998
2000
2002
2004
2006
2008
2010
2012
Ga
ge F
low
(ac
re-f
ee
t)
Calendar Year
Combined Flow at Bridgeport and Hoye Canyon
Flow at Wabuska
Average inflow: 288,000 AF
Average outflow: 120,000 AF
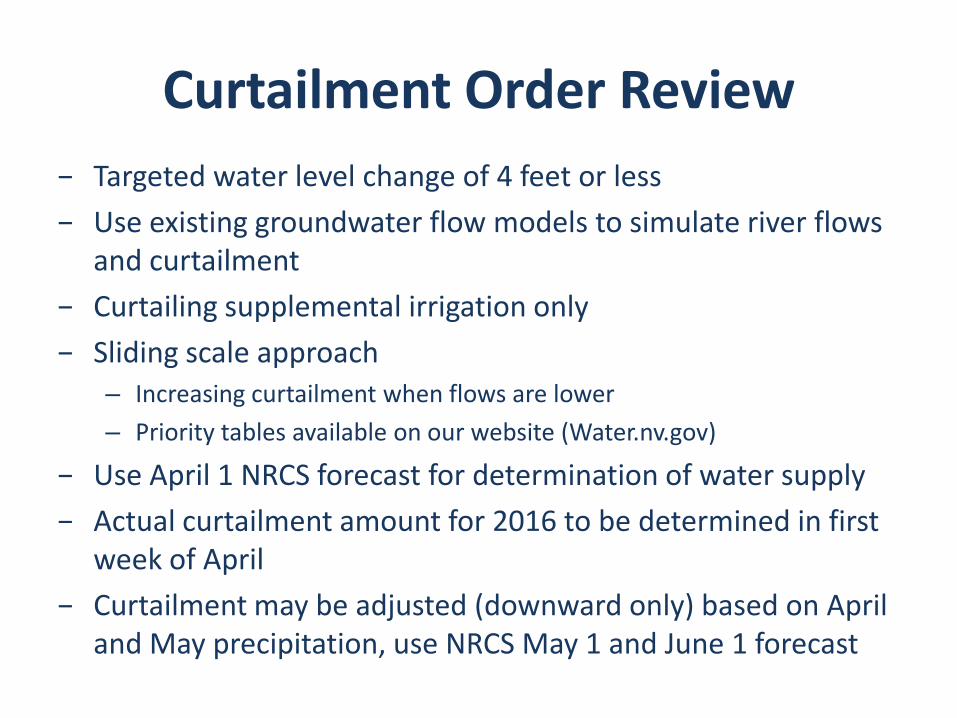
Curtailment Order Review
− Targeted water level change of 4 feet or less
− Use existing groundwater flow models to simulate river flows and curtailment
− Curtailing supplemental irrigation only
− Sliding scale approach – Increasing curtailment when flows are lower
– Priority tables available on our website (Water.nv.gov)
− Use April 1 NRCS forecast for determination of water supply
− Actual curtailment amount for 2016 to be determined in first week of April
− Curtailment may be adjusted (downward only) based on April and May precipitation, use NRCS May 1 and June 1 forecast
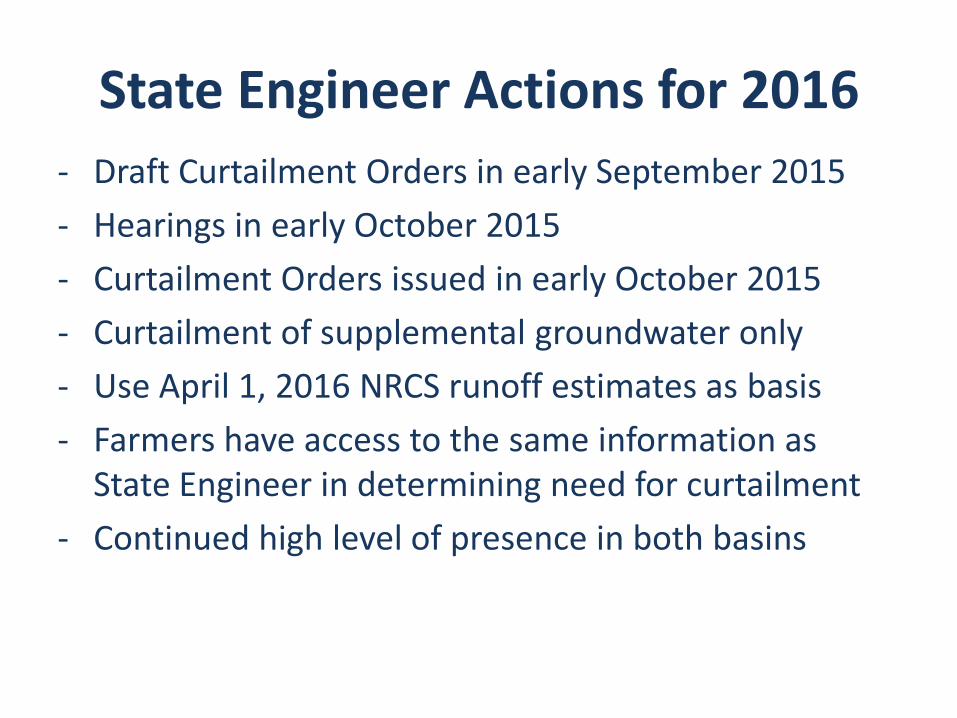
State Engineer Actions for 2016
- Draft Curtailment Orders in early September 2015
- Hearings in early October 2015
- Curtailment Orders issued in early October 2015
- Curtailment of supplemental groundwater only
- Use April 1, 2016 NRCS runoff estimates as basis
- Farmers have access to the same information as State Engineer in determining need for curtailment
- Continued high level of presence in both basins
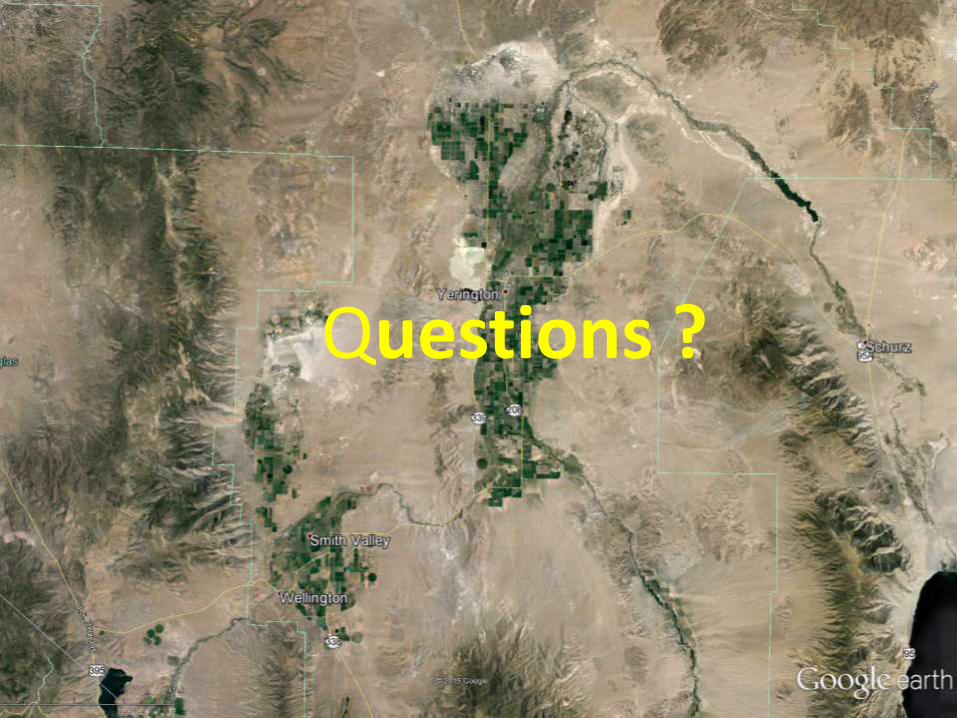
Questions ?
Recommended