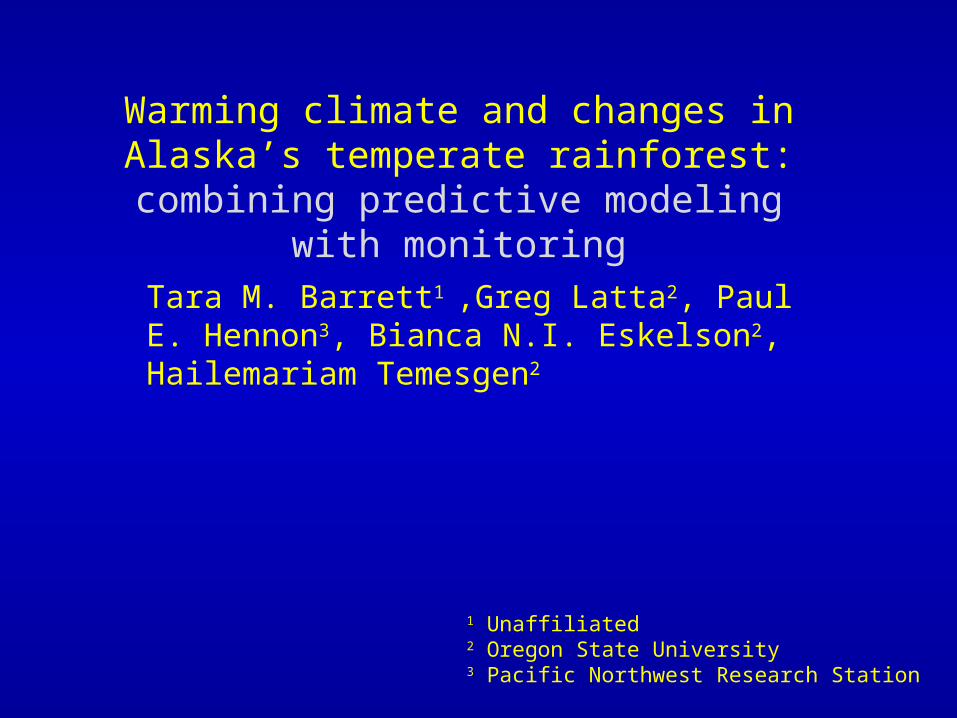
Warming climate and changes in Alaska’s temperate rainforest: combining predictive
modeling with monitoring
Tara M. Barrett1 ,Greg Latta2, Paul E. Hennon3, Bianca N.I. Eskelson2, Hailemariam Temesgen2
1 Unaffiliated2 Oregon State University3 Pacific Northwest Research Station

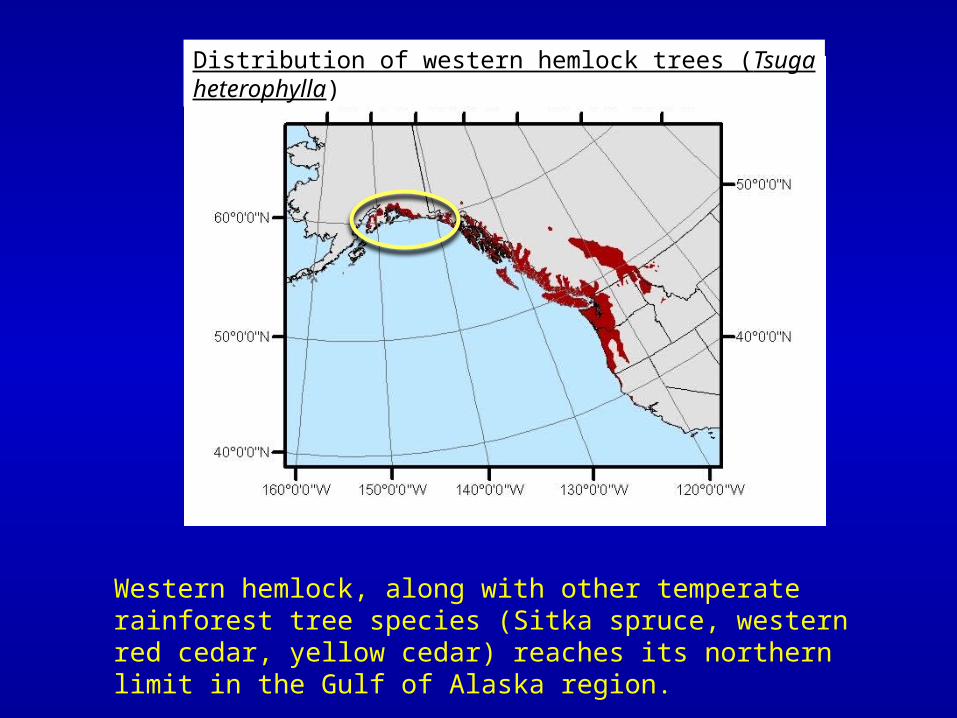
Distribution of western hemlock trees (Tsuga heterophylla)
Western hemlock, along with other temperate rainforest tree species (Sitka spruce, western red cedar, yellow cedar) reaches its northern limit in the Gulf of Alaska region.
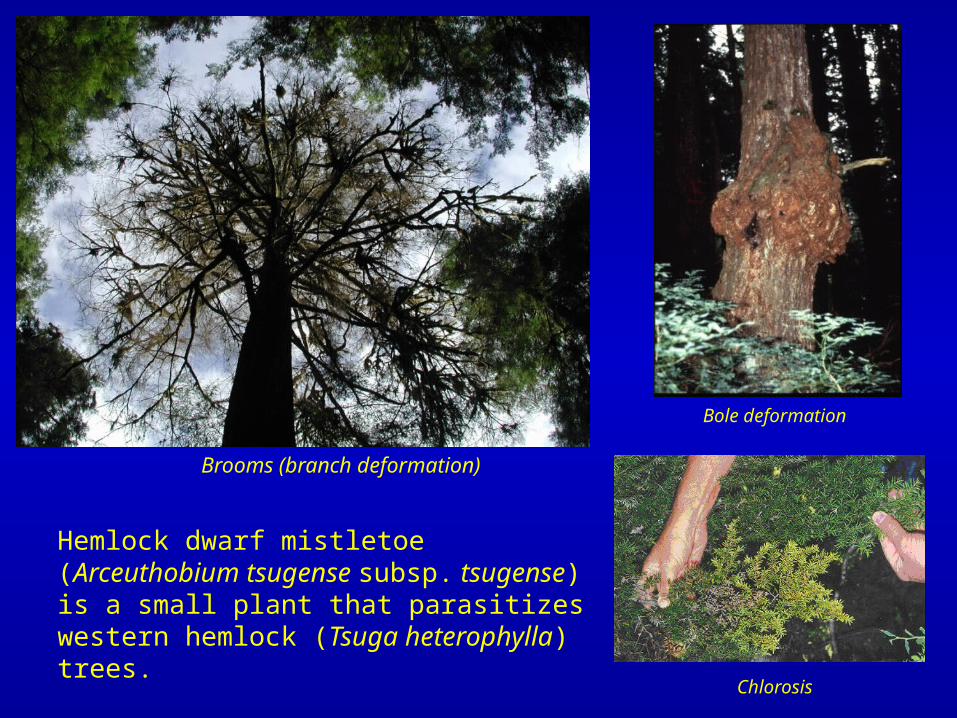
Hemlock dwarf mistletoe (Arceuthobium tsugense subsp. tsugense) is a small plant that parasitizes western hemlock (Tsuga heterophylla) trees.
Brooms (branch deformation)
Bole deformation
Chlorosis

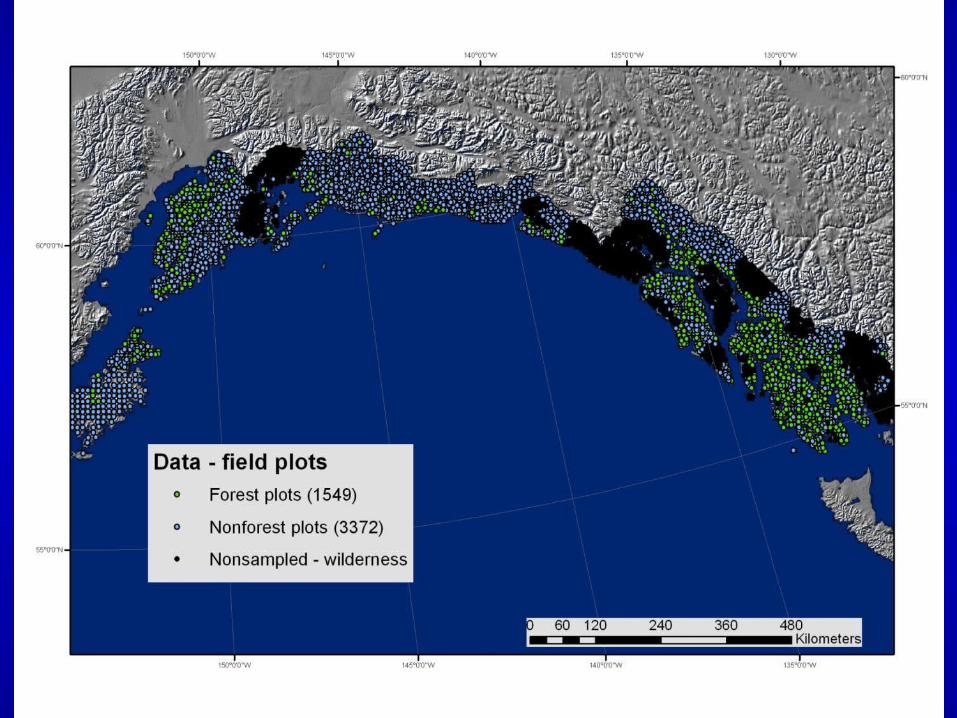
Both western hemlock and western hemlock dwarf mistletoe distributions are at the northern part of their geographic range in
Alaska
Map by Dustin Wittwer

Population size of host (Tsuga heterophylla) and parasite (Arceuthobium tsugense subsp. tsugense) by elevation
0-30
31-60
61-91
92-121
122-
152
153-
182
183-
213
214-
243
244-
274
275-
304
305-
335
336-
365
366-
396
397-
426
427-
457
458-
487
488-
518
518-
548
549-
579
580-
609
610-
640
641-
670
671-
701
702-
731
732-
762
762+
0
10000000
20000000
30000000
40000000
50000000
60000000
70000000
-
5
10
15
20
25
Trees with mistletoe Western hemlock trees Percentage of mistletoe infection
Elevation (meters)
Mis
tle
toe
infe
cti
on
(p
erc
en
t)


1950 1960 1970 1980 1990 2000 2010 (8)
(6)
(4)
(2)
-
2
4
6
8
10
12 Average annual temperature 1954-2008
AnnetteJuneauKodiakYakutatHomerAnchorageTalkeetnaGulkana
Year
Degr
ees C
elsiu
s

Projections are for further increases in temperature over the next half century
Map from SNAP modeling group, Univ. of Alaska Fairbanks (www.snap.uaf.edu)
Climate envelope models
Distribution is limited by a climate envelope outside of which a species cannot survive
For prediction, assumes distribution across climate-space remains the same, but spatial distribution shifts as climate changes
empirical – not process based habitat only, does not predict actual presence many different approaches:
GAM, neural nets, customized models logistic modeling Most Similar Neighbors imputation Random Forest imputation

Prediction modeling for hemlock dwarf mistletoe and western hemlock
Methods
1. Reviewed literature for climate-related mechanisms that might explain mistletoe distributions and abundance.
2. Created climate variables that corresponded to possible explanatory mechanisms.
3. Tested predictive models against field data.4. Predicted future distribution

Western dwarf mistletoe seed and holdfast
Reviewed previous research:
• Extreme minimum winter temperatures reduce seed viability.• Snow reduces seed establishment and germination.• Rain reduces seed establishment and germination?• Spring frosts damage pollen viability• Fall frosts damage fruit
• Life cycle takes longer to complete in Alaska (e.g., 12 yrs) than British Columbia (e.g. 5 yrs)
• Transplanted to 120 m higher elevation, fruits never matured

Predictive Variables Used
Growing season variables:GDD (growing degree days above 0 C)RADIANS (modeled solar radiation)
Low winter temperaturesMINTEMP (min of mean min monthly temp)MINTEMPSD (standard deviation of mean min temps)
PrecipitationSNOW (modeled precipitation as snow)RAIN (mean annual precipitation - SNOW)
Autumn freezesMINFALLTEMP (mean min Sept. temp)
Spring freezesMINSPRINGTEMP (mean min April temp)
OtherSLOPEET (modeled evapotranspiration)CMI (modeled precip – evapotranspiration)

8
-12Mean annual temperature (C)
Used 1961-1990 PRISM climate data from Oregon State Univ.: a spatial model of climate normals (monthly temperature and precipitation) to develop climate variables
PRISM data was 2 km resolution, so rescaled using 2 dimensional linear interpolation for precipitation and geographically weighted regression for temperature

Results – hemlock dwarf mistletoeSensitivity (correct prediction of presence)
MSN Random Forests Logistic
Development data set 29 37 38
Validation data set 24 20 37
Specificity (correct prediction of absence)
MSN Random Forests Logistic
Development data set 92 98 93
Validation data set 90 96 93
Predicted proportions
MSN Random Forests ActualDevelopment data set 10.5 5.6 10.0
Validation data set 11.0 5.5 8.9
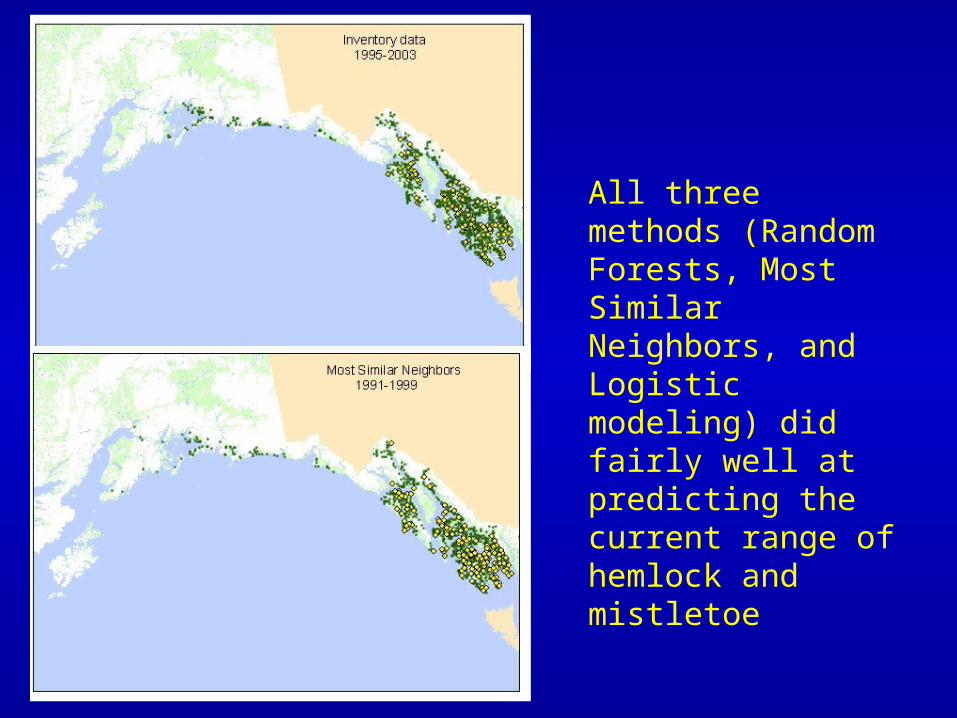
All three methods (Random Forests, Most Similar Neighbors, and Logistic modeling) did fairly well at predicting the current range of hemlock and mistletoe

Methods
1. Reviewed literature for climate-related mechanisms that might explain mistletoe distributions and abundance.
2. Created climate variables that corresponded to possible explanatory mechanisms.
3. Tested predictive models against field data.4. Predict future distribution

We used downscaled GCM composites created by the Scenarios Network for Alaska Planning (SNAP 2011). The composite models were made from
the MPI ECHAM5, the GFDL CM2.1, the 324 MIROC 3.2 (medres), the UKMO HADCM3, and the CCCma CGCM3.1 models
which had been chosen based on relatively good performance in a review of GCMs for Alaska and Greenland by Walsh et al. (2008).
PRISM + (GCM_future – GCM_present) = Predicted
Scenarios Network for Alaska Planning [SNAP]. 2011. Alaska climate datasets online. Available from www.snap.uaf.edu/downloads/alaska-climate-datasets
Walsh, J.E., Chapman, W.L., Romanovsky, V., Christensen, J.H., and Stendel, M. 2008. Global climate model performance over Alaska and Greenland. J. Clim. 21:6156-6171.
Future Climate Models

Approach A1B A2 B1
MSN 137 141 118
RF 112 113 107
Logistic 134 136 115
Scenario
Prediction for 2100 western hemlock habitat as a percent of present (=100), bias adjusted
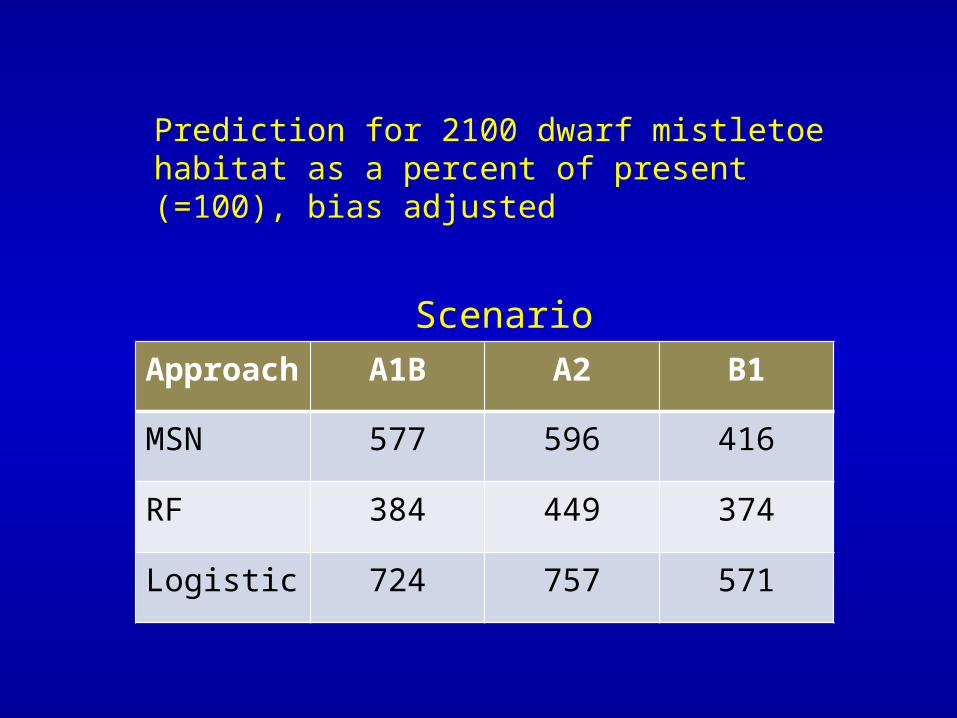
Approach A1B A2 B1
MSN 577 596 416
RF 384 449 374
Logistic 724 757 571
Scenario
Prediction for 2100 dwarf mistletoe habitat as a percent of present (=100), bias adjusted

BUT …
Habitat is not presenceTrees migrate slowly
eg, Sitka spruce on Kodiak island, roughly 1 mile per century (per Griggs, 1930s)
Dwarf mistletoe is dioecious; seeds can only travel (beyond a few dozen meters) with the help of birds or mammals

BUT …
Western red cedar Yellow cedar

Weste
rn hemlock
(556)
Sitka
spru
ce (5
45)
Mountai
n hemlock (4
32)
Yellow-ce
dar (266)
Weste
rn re
dcedar
(141)
Shore pine (1
30)-6%
-4%
-2%
0%
2%
4%
6%
Net change in live-tree carbon by species between 1995-2003 and 2004-2008, southeast and southcentral Alaska
Chan
ge a
s a
perc
ent o
f ini
tial (
1995
-200
3)
carb
on m
ass
Numbers in parenthesis indicate number of forested plots with this species present
Forested lands, excludes National Forest wilderness and Glacier Bay NP, only trees >= 5” d.b.h.

Summary
• Plot level imputation is promising for climate/host/parasite mapping as it can be used for (1) range mapping (2) area affected estimates and (3) impact estimates
• For this case study: Both Most Similar Neighbors and Random Forest do poorly at predicting presence/absence of western hemlock dwarf mistletoe at the plot level.
• Most Similar Neighbors does moderately well at predicting abundance and distribution.
• Random Forests does well at predicting distribution, but tends to underestimate abundance
Summary
For future predictions:
Climate Envelope Models may be most useful for• discussing why we think they are wrong• formulating hypotheses to test
Long-term monitoring using stable protocols really needs to accompany predictive modeling

For more information:
Barrett, T.M.; Latta, G.; Hennon, P.E.; Eskelson, B.N.I.; Temesgen, H. 2012. Host-parasite distributions under changing climate: Tsuga heterophylla and Arceuthobium tsugense in Alaska. Canadian Journal of Forest Research 42:4:642-656
Barrett, T.M. 2011. Change in forests between 1995-2003 and 2004-2008. In Forest Service Pacific Northwest Research Station General Technical Report PNW-GTR-835.
Recommended