WATER RESOURCES BULLETIN VOL. 10, NO. 4 AMERICAN WATER RESOURCES ASSOCIATION AUGUST 1974
WATER QUALITY AND POLLUTION -- SOUTH FORK OF LONG ISLAND, NEW YORK’
C. W. Fetter, Jr.’
ABSTRACT. The South Fork of Long Island, New York is an area which relies enthely on ground water for water supply. Most of the water which is pumped is artifically recharged, without treatment, via cesspools. The natural quality of the ground water is very high. Some areas show increasing nitrate in the ground water. This comes from both cesspools and agricultural fertilizer. Saline water intrusion is a potential problem in coastal areas. High ammonia in surface ponds may result in eutrophication. (KEY TERMS: water quality; nitrate pollution; ground water pollution)
INTRODUCTION
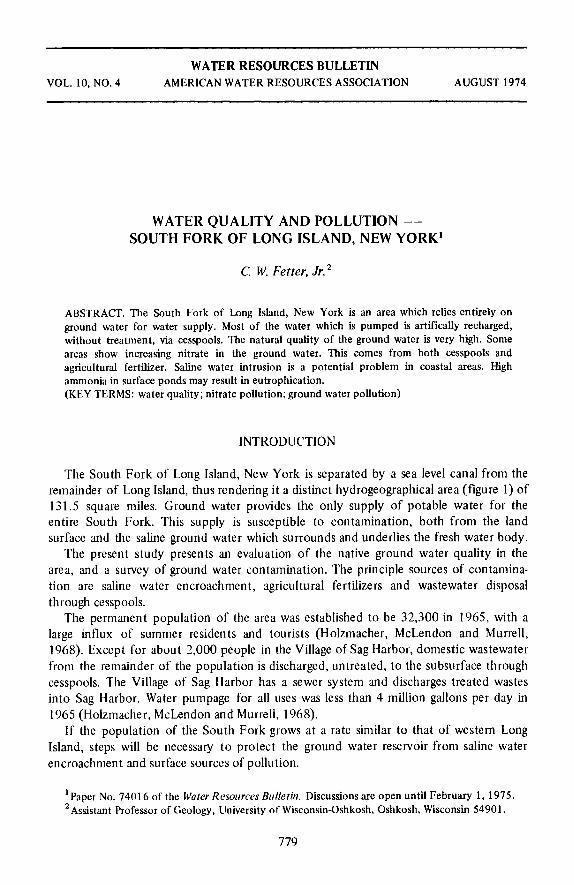
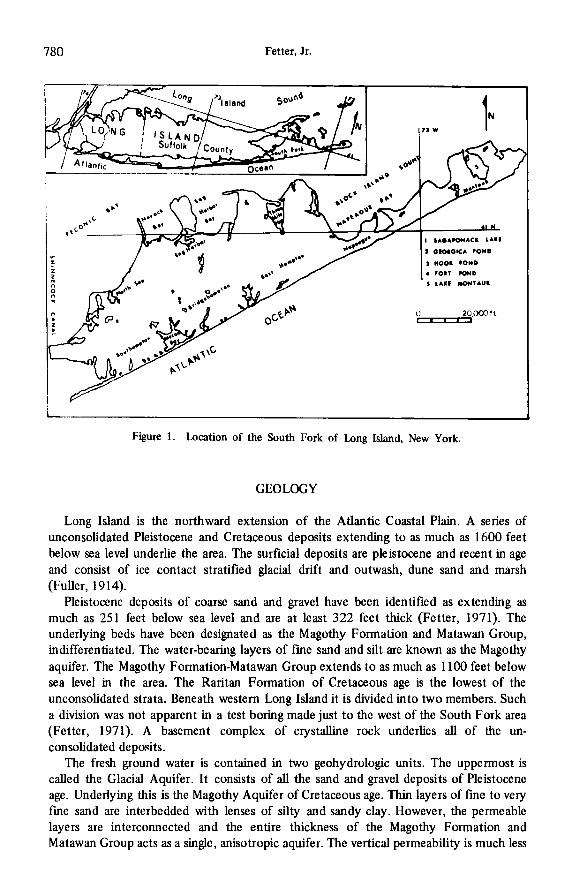
The South Fork of Long Island, New York is separated by a sea level canal from the remainder of Long Island, thus rendering it a distinct hydrogeographical area (figure 1) of 131.5 square miles. Ground water provides the only supply of potable water for the entire South Fork. This supply is susceptible t o contamination, both from the land surface and the saline ground water which surrounds and underlies the fresh water body.
The present study presents an evaluation of the native ground water quality in the area, and a survey of ground water contamination. The principle sources of contamina- tion are saline water encroachment, agricultural fertilizers and wastewater disposal through cesspools.
The permanent population of the area was established t o be 32,300 in 1965, with a large influx of summer residents and tourists (Holzmacher, McLendon and Murrell, 1968). Except for about 2,000 people in the Village of Sag Harbor, domestic wastewater from the remainder of the population is discharged, untreated, t o the subsurface through cesspools. The Village of Sag Harbor has a sewer system and discharges treated wastes into Sag Harbor. Water pumpage for all uses was less than 4 million gallons per day in 1965 (Hobmacher, McLendon and Murrell, 1968).
If the population of the South Fork grows at a rate similar t o that of western Long Island, steps will be necessary to protect the ground water reservoir from saline water encroachment and surface sources of pollution.
‘Paper No. 7401 6 of the Wafer Resources Bulletin. Discussions are open until February 1,1975. ’ Assistant Professor of Geology, University of Wisconsin-Oshkosh, Oshkosh, Wisconsin 54901.
779
780 Fetter, Jr.
Figure 1. Location of the South Fork of Long Island, New York.
I
Long Island is the northward extension of the Atlantic Coastal Plain. A series of
GEOLOGY
unconsolidated Pleistocene and Cretaceous deposits extending to as much as 1600 feet below sea level underlie the area. The surficial deposits are Pleistocene and recent in age and consist of ice contact stratified glacial drift and outwash, dune sand and marsh (Fuller, 1914).
Pleistocene deposits of coarse sand and gravel have been identified as extending as much as 251 feet below sea level and are at least 322 feet thick (Fetter, 1971). The underlying beds have been designated as the Magothy Formation and Matawan Group, indlfferentiated. The water-bearing layers of fine sand and silt are known as the Magothy aquifer. The Magothy Formation-Matawan Group extends to as much as 1100 feet below sea level in the area. The Raritan Formation of Cretaceous age is the lowest of the unconsolidated strata. Beneath western Long Island it is divided into two members. Such a division was not apparent in a test boring made just to the west of the South Fork area (Fetter, 1971). A basement complex of crystalline rock underlies all of the un- consolidated deposits.
The fresh ground water is contained in two geohydrologic units. The uppermost is called the Glacial Aquifer. It consists of all the sand and gravel deposits of Pleistocene age. Underlying this is the Magothy Aquifer of Cretaceous age. Thin layers of fine to very fine sand are interbedded with lenses of silty and sandy clay. However, the permeable layers are interconnected and the entire thickness of the Magothy Formation and Matawan Group acts as a single, anisotropic aquifer. The vertical permeability is much less
WATER QUALITY AND POLLUTION 781
than horizontal. The lower layers of the Magothy Aquifer and the Raritan Formation contain saline water.
HYDROLOGY
The sole source of natural recharge to the aquifer system is the precipitation whch falls on the South Fork. A secondary source of recharge is the artificial recharge of sanitary wastewater through subsurface disposal units. There are a limited number of basins for the inland recharge of storm water runoff from highways and subdivisions.
Natural recharge can be considered to be the recharge of precipitation as opposed to the artificial recharge of wastewater. Highway drainage into recharge basins is by this defmition natural recharge. The water balance equation (Recharge = Precipitation - Evapotranspiration - Direct Runoff) can be used to compute the amount of natural recharge.
The average annual precipitation is between 44 and 45 inches for the South Fork. By using the Thomthwaite method for computing evapotranspiration, the average actual evapotranspiration was computed as 23 inches. Because of the very permeable surface soils, there is very little direct runoff of precipitation, less than one inch a year. Thus the average annual recharge for the South Fork is about 21 to 22 inches. From 1951 to 1969 it ranged between 12 and 37 inches, primady because of fluctuations in precipitation.
The homes and businesses of most of the area have cesspools for waste disposal. Because of the preponderance of this method of waste disposal, an estimated 4 million gallons per day of domestic water usage is presently being artifically recharged. Since this water was pumped from the aquifers, the artificial recharge does not represent a net addition to the total recharge.
The recharged water moves downward through the unsaturated zone until it reaches the water table. Then it begins to move in a direction dependent upon the slope of the water table. The fresh ground water reservoir is a classic freshwater lens “floating” on denser satme water which underlies the entire area. In this situation groundwater moves downward and laterally away from the high portions of the water table. It then moves upward along the coast and discharges as small springs and streams, diffusion along the salt water interface and upflow into the bottom of the ocean or tidal estuaries. The shape and position of the fresh water reservoir beneath the South Fork area have been described by Fetter (1972).
WATER QUALITY
Ground Water
Natural Quality
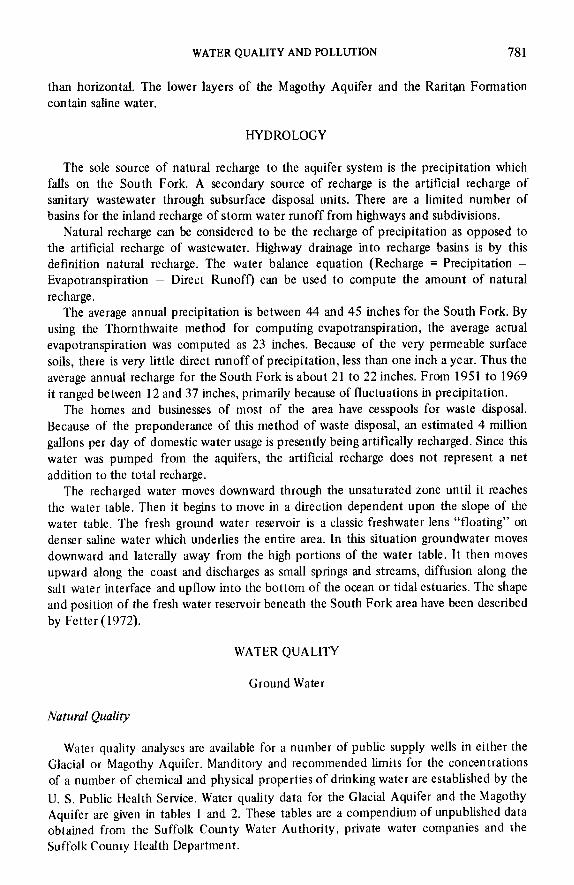
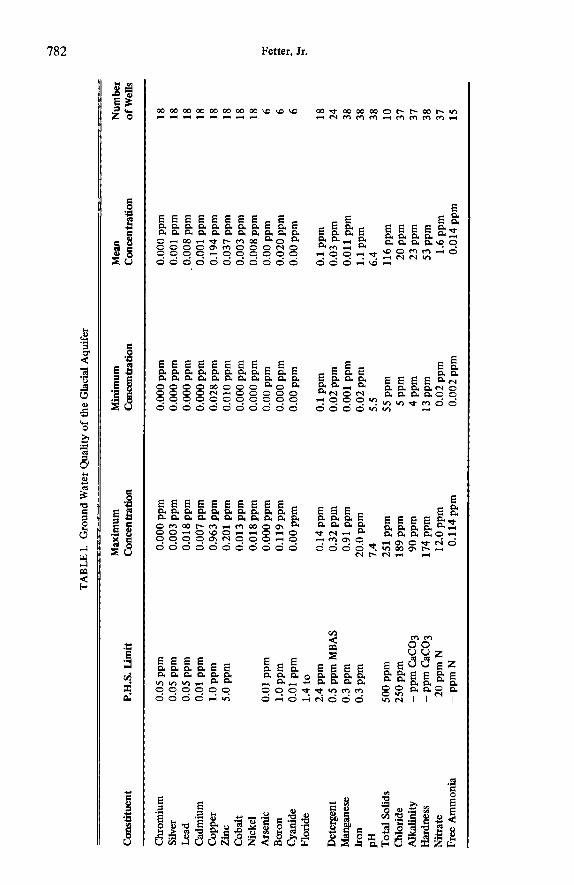
Water quahty analyses are available for a number of public supply wells in either the Glacial or Magothy Aquifer. Manditory and recommended limits for the concentrations of a number of chemical and physical properties of drinking water are established by the U. S. Public Health Service. Water quality data for the Glacial Aquifer and the Magothy Aquifer are given in tables 1 and 2. These tables are a compendium of unpublished data obtained from the Suffolk County Water Authority, private water companies and the Suffolk County Health Department.
TABL
E 1.
Gro
und
Wat
er Q
ualit
y of
the
Gla
cial
Aqu
ifer
Con
stitu
ent
P.H
.S.
Lim
it M
axim
um
Min
imum
M
a
Num
ber
Con
cent
ratio
n C
once
ntra
tion
Con
cent
ratio
n of
Wel
ls
Chr
omiu
m
Sie
r Le
ad
Cad
miu
m
Cop
per
Zinc
C
obal
t N
icke
l A
rsen
ic
Boro
n C
yani
de
Flor
ide
Det
erge
nt
Man
gane
se
Iron
PH
T
otal
Sol
ids
Chl
orid
e A
Jkat
inity
H
ardn
ess
Nitr
ate
Free
Am
mon
ia
0.05
ppm
0.
05 p
pm
0.05
ppm
0.
01 p
pm
1.0
ppm
5.
0 pp
m
0.01
ppm
1.
0 pp
m
0.01
ppm
1.
4 to
2.
4 pp
m
0.5
ppm
MBA
S 0.
3 pp
m
0.3
ppm
500
ppm
25
0 pp
m
- p
pm C
aCO
3 - p
pm C
aCO
3
- P
Pm N
20 p
pm N
0.00
0 pp
m
0.00
3 pp
m
0.01
8 p
pm
0.00
7 pp
m
0.96
3 pp
m
0.20
1 pp
m
0.01
3 p
pm
0.01
8 p
pm
0.00
0 pp
m
0.11
9 pp
m
0.00
ppm
0.14
ppm
0.
32 p
pm
0.91
ppm
20
.0 p
pm
7.4 251
ppm
18
9 pp
m
90 p
pm
174
ppm
12
.0 p
pm
0.11
4 pp
m
0.00
0 pp
m
0.00
0 pp
m
0.00
0 pp
m
0.00
0 pp
m
0.02
8 pp
m
0.01
0 pp
m
0.00
0 pp
m
0.00
0 pp
m
0.00
ppm
0.
000
ppm
0.
00 p
pm
0.1
ppm
0.
02 p
pm
0.00
1 pp
m
0.02
ppm
5.5
55
PPm
5
ppm
4
PPm
13
PPm
0.
02 p
pm
0.00
2 pp
m
0.00
0 pp
m
0.00
1 pp
m
0.00
8 pp
m
0.00
1 pp
m
0.19
4 pp
m
0.03
7 pp
m
0.00
3 pp
m
0.00
8 pp
m
0.00
ppm
0.
020
ppm
0.
00 p
pm
0.1
ppm
0.
03 p
pm
0.01
1 pp
m
1.1
ppm
6.
4 11
6 pp
m
20 P
Pm
23 P
Pm
53 P
Pm
1.6
ppm
0.
014
ppm
~~
~
18
18
18
18
18
18
18
18
6 6 6 18
24
38
38
38
10
31
3
1
38
37
15
TA
BL
E 2
. G
roun
d W
ater
Qua
lity
of th
e M
agot
hy A
quife
r
Con
stitu
ent
P.H
.S.
Lim
it M
axim
um
Con
cent
ratio
n M
inim
um
Con
cent
ratio
n
~ ~~
~~
Mean
Con
cent
ratio
n Number
of W
ells
Chl
orid
e Iron
Man
gane
se
PH
Har
dnes
s A
lkal
inity
N
itrat
e
250
ppm
19
PPm
0.
3 pp
m
2.2
ppm
0.
3 pp
m
0.05
ppm
6.
4 - p
pm C
aCO
3 42
ppm
- p
pm C
aCO
3 24
PPm
10
ppm
N
2.0
ppm
8 PP
m
0.04
ppm
0.
05 p
pm
5.8
10 P
Pm
8 P
P~
0.
02 p
pm
Tot
al S
olid
s 30
0 pp
m
106
ppm
20
PPm
13 P
P~
0.
49 p
pm
0.05
ppm
6.
1 23
PPm
15
PPm
0.
47 p
pm
67 P
Pm
6 s a s
Y
Figu
re 2
. N
itrat
e an
d ir
on in
the
goun
dwat
er o
f th
e G
laci
al A
quife
r.
hb
lr S
uppl
y W
enlr
ld W
ith L
OW
Ir
on I
n Tn
e G
lacl
al
Aqu
ifer
p?ppyI
L A
rea
W
itn
Gen
eral
ly A
ccep
tabl
e C
on
cen
trat
ims
of N
itra
te
Are
a
With
M
arg
inal
Wat
erO
Lalit
y D
ue
To
Nit
rate
Con
tam
inat
ion
4
M
ww
A
rea
W
tth
Exc
elle
nt W
ater
Od
ity
With
Res
pect
To
N
itra
te
w
784 Fetter, Jr.
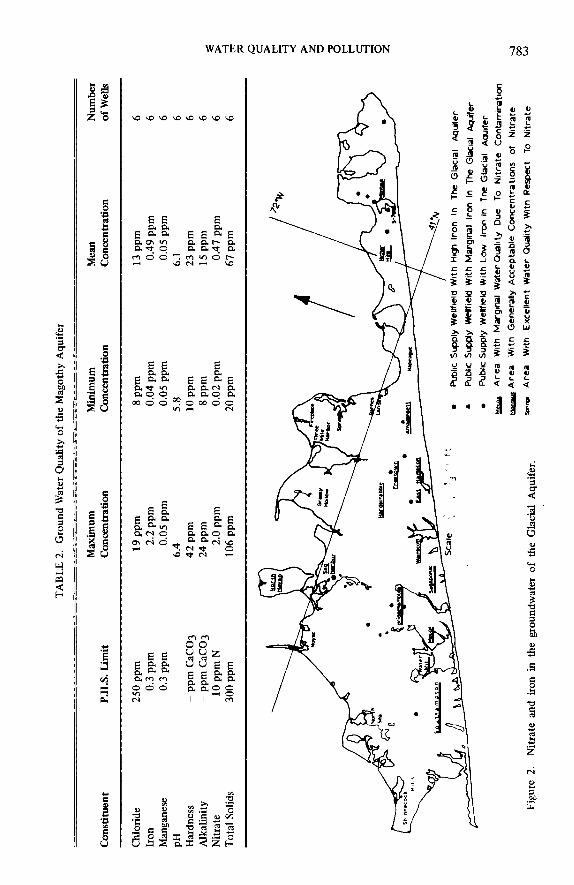
The natural quality of the water is excellent in most cases. Of the constituents, only iron, manganese, chloride and nitrate ever exceed the drinking water standards.
Iron concentration presents serious water quality problems in some areas of the South Fork. In 23 of the 38 wells for which iron analyses were available, there was at least one analysis where the iron standard of 0.3 ppm was exceeded.
Concentrations of iron in a given well can fluctuate. In Well S-184 at Sag Harbor, the iron content ranged from 0.3 ppm to 10.6 ppm, with a mean of 5.8 ppm for 12 analyses. High content is apparently related to specific areas. Glacial Aquifer wells with low iron content are all located in the central portion of the South Fork, and the wells with high iron content are located at the margins of the island. There are some wells with iron content about 0.3 ppm located intermediate between the high iron content and low iron content wells (figure 2). This distribution does not hold in the Magothy Aquifer where Magothy Aquifer test zones at Wells S-33922 and S-3 1037 had a high iron content and Glacial Aquifer test zones had low iron content.
Appreciable amounts of ferrous iron cannot exist in water with significant amounts of dissolved oxygen which causes a high oxidation potential. Glacial Aquifer wells with low iron content are in ground water recharge areas where the shallow water presumably contains considerable dissolved oxygen. T h s implies conversely that a lack of dissolved oxygen (i.e., low oxidation potential) as well as an available iron source will result in more dissolved iron in the ground water, other factors remaining the same. Since none of the Magothy Aquifer test wells had detectable dissolved oxygen in the water, wells with high iron content can occur anywhere in this aquifer.
Manganese is soluble as Mnt2 under similar conditions as ferrous iron, although it is somewhat less easily oxidized to its relatively insoluble higher oxidation states Mnt3 and MnC4. The occurrence of wells with high manganese content (four out of 28 wells) is much more limited than high iron content wells. It is probable that manganese is less abundant in the sediments than iron.
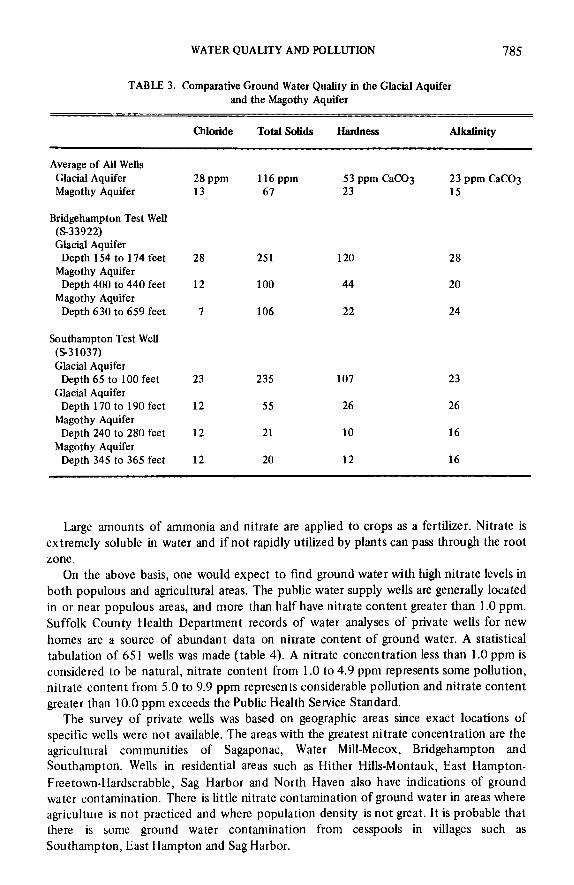
On the basis of a limited number of anlayses, the water quality of the Magothy Aquifer appears to differ from that of the Glacial Aquifer. The deeper ground water has lower total solids as well as lower hardness, chloride and alkalinity (table 3). Data are lacking for other constituents. There is a significant amount of interstitial clay in the Magothy Aquifer so that anion and cation exchange with the clay minerals may cause the observed change in ground water quality.
Changes in Ground Water Quality Due to the Activities of Man
Of the constituents found in the ground water, nitrate, detergent (MBAS) and chloride show evidence of having been induced at least partly by man.
Nitrate. Small quantities of nitrate can naturally be present in ground water from the microbial decomposition of organic matter at the surface. This is a rather low amount and 16 of the 38 public supply wells tested had a nitrate content of less than 1 .O ppm (as N). Wells with nitrate content above this level probably contain some nitrate from other sources.
Human waste contains ammonia which can be nitrified by aerobic soil bacteria to nitrate. Almost all waste water on the South Fork is disposed via cesspools. Ammonia in the waste is converted to nitrate in the unsaturated soil zone. This nitrate is a potential source of ground water contamination.
WATER QUALITY AND POLLUTION 785
TABLE 3. Comparative Ground Water Quality in the Glacial Aquifer and the Magothy Aquifer
Chloride TotalSolids Hardness Alkalinity
Average of All Wells Glacial Aquifer 28 PPm Magothy Aquifer 13
Bridgehampton Test Well ($33922) Glacial Aquifer
Magothy Aquifer
Magothy Aquifer
Depth 154 to 174 feet
Depth 400 to 440 feet
Depth 630 to 659 feet
28
12
7
Southampton Test Well ( S 3 1037) Glacial Aquifer
Glacial Aquifer
Magothy Aquifer
Magothy Aquifer
Depth 65 to 100 feet
Depth 170 to 190 feet
Depth 240 to 280 feet
Depth 345 to 365 feet
23
12
12
12
116 ppm 67
25 1
100
106
53 ppm CaC03 23
120
44
22
235 107
55 26
21 10
20 12
23 ppm CaC03 15
28
20
24
23
26
16
16
Large amounts of ammonia and nitrate are applied to crops as a fertilizer. Nitrate is extremely soluble in water and if not rapidly utilized by plants can pass through the root zone.
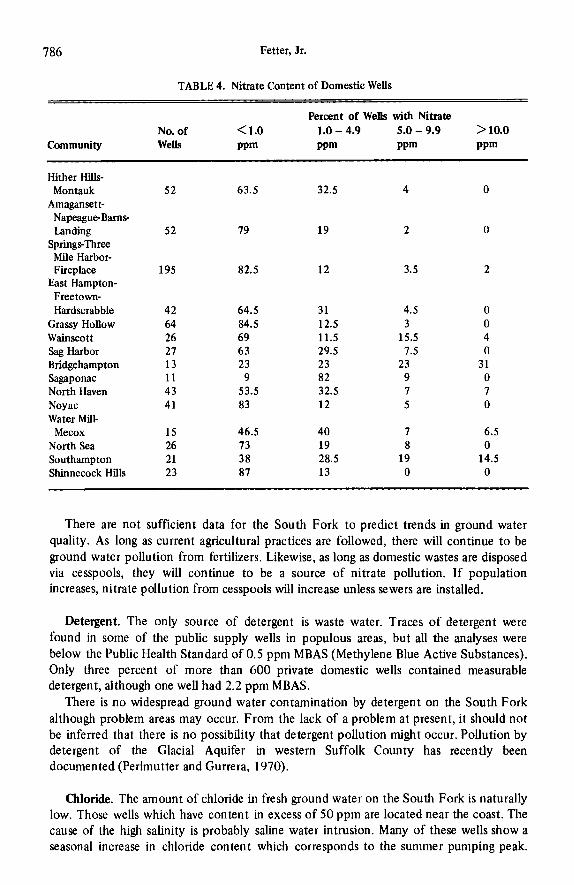
On the above basis, one would expect to find ground water with high nitrate levels in both populous and agricultural areas. The public water supply wells are generally located in or near populous areas, and more than half have nitrate content greater than 1 .O ppm. Suffolk County Health Department records of water analyses of private wells for new homes are a source of abundant data on nitrate content of ground water. A statistical tabulation of 65 I wells was made (table 4). A nitrate concentration less than 1 .O ppm is considered to be natural, nitrate content from 1 .O to 4.9 ppm represents some pollution, nitrate content from 5.0 to 9.9 ppm represents considerable pollution and nitrate content greater than 10.0 pprn exceeds the Public Health Service Standard.
The survey of private wells was based on geographic areas since exact locations of specific wells were not available. The areas with the greatest nitrate concentration are the agricultural communities of Sagaponac, Water Mill-Mecox, Bridgehampton and Southampton. Wells in residential areas such as Hither Hills-Montauk, East Hampton- Freetown-Hardscrabble, Sag Harbor and North Haven also have indications of ground water Contamination. There is little nitrate contamination of ground water in areas where agriculture is not practiced and where population density is not great. It is probable that there is some ground water contamination from cesspools in villages such as Southampton, East Hampton and Sag Harbor.
786 Fetter, Jr.
TABLE 4. Nitrate Content of Domestic Wells
Percent of Wells with Nitrate No. of < 1.0 1.0 - 4.9 5.0 - 9.9 > 10.0
Community Wells PPm PPm PPm PPm
Hither Hills- Montauk
Amagansett- NapeagueBams- Landing
Springs-Three Mile Harbor- Fireplace East Hampton-
Freetown- Hardscrabble
Grassy Hollow Wainscott Sag Harbor Bridgehampton Sagaponac North Haven Noyac Water Mill-
Mecox North Sea Southampton Shinnecock Hills
52
52
195
42 64 26 27 13 1 1 43 41
15 26 21 23
63.5
79
82.5
64.5 84.5 69 63 23
9 53.5 83
46.5 73 38 87
32.5
19
12
31 12.5 11.5 29.5 23 82 32.5 12
40 19 28.5 13
4
2
3.5
4.5 3
15.5 1.5
23 9 I 5
7 8
19 0
0
0
2
0 0 4 0
31 0 I 0
6.5 0
14.5 0
There are not sufficient data for the South Fork to predict trends in ground water quality. As long as current agricultural practices are followed, there will continue to be ground water pollution from fertilizers. Likewise, as long as domestic wastes are disposed via cesspools, they will continue to be a source of nitrate pollution. If population increases, nitrate pollution from cesspools will increase unless sewers are installed.
Detergent. The only source of detergent is waste water. Traces of detergent were found in some of the public supply wells in populous areas, but all the analyses were below the Public Health Standard of 0.5 ppm MBAS (Methylene Blue Active Substances). Only three percent of more than 600 private domestic wells contained measurable detergent, although one well had 2.2 ppm MBAS.
There is no widespread ground water contamination by detergent on the South Fork although problem areas may occur. From the lack of a problem at present, it should not be inferred that there is no possibility that detergent pollution might occur. Pollution by detergent of the Glacial Aquifer in western Suffolk County has recently been documented (Perlmutter and Currera, 1970).
Chloride. The amount of chloride in fresh ground water on the South Fork is naturally low. Those wells which have content in excess of 50 ppm are located near the coast. The cause of the high salinity is probably saline water intrusion. Many of these wells show a seasonal increase in chloride content which corresponds to the summer pumping peak.
WATER QUALITY AND POLLUTION 787
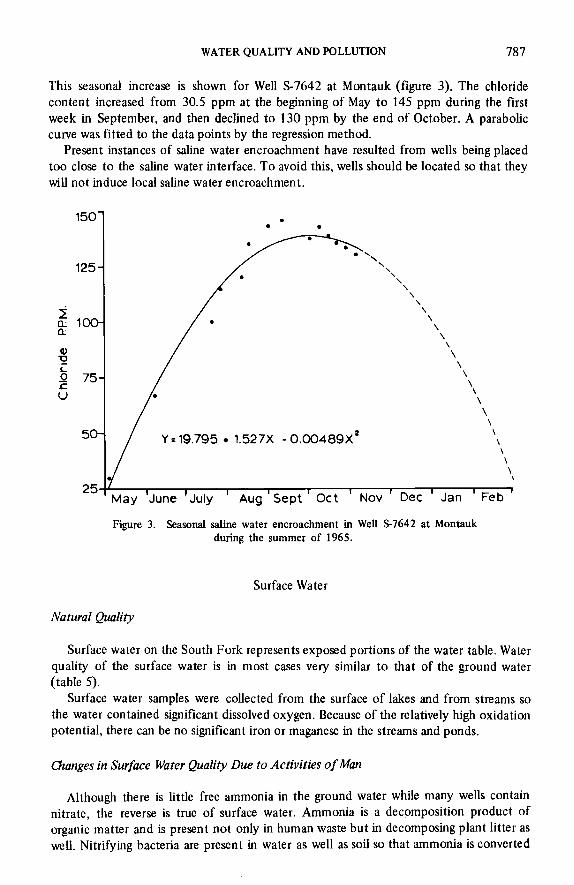
This seasonal increase is shown for Well S-7642 at Montauk (figure 3). The chloride content increased from 30.5 ppm at the beginning of May to 145 ppm during the first week in September, and then declined to 130 ppm by the end of October. A parabolic curve was fitted to the data points by the regression method.
Present instances of saline water encroachment have resulted from wells being placed too close to the saline water interface. To avoid h s , wells should be located so that they will not induce local saline water encroachment.
1501 .
/ \
/ \
Y = 19.795 1.527X - 0.00489X2
5 4 / \ \ \ \
\\
ay 'June 'July Aug 'Sept Oct Nov I Dcc I Jan I Feb I
\\
ay 'June 'July Aug 'Sept Oct Nov I Dcc I Jan I Feb I
Figure 3. Seasonal saline water encroachment in Well $7642 at Montauk during the summer of 1965.
Surface Water
Natural Quality
Surface water on the South Fork represents exposed portions of the water table. Water quality of the surface water is in most cases very similar to that of the ground water (table 5).
Surface water samples were collected from the surface of lakes and from streams so the water contained significant dissolved oxygen. Because of the relatively h g h oxidation potential, there can be no significant iron or maganese in the streams and ponds.
Changes in Surface Water Quality Due to Activities of Man
Although there is little free ammonia in the ground water while many wells contain nitrate, the reverse is true of surface water. Ammonia is a decomposition product of organic matter and is present not only in human waste but in decomposing plant litter as well. Nitrifying bacteria are present in water as well as soil so that ammonia is converted
Fetter, Jr.
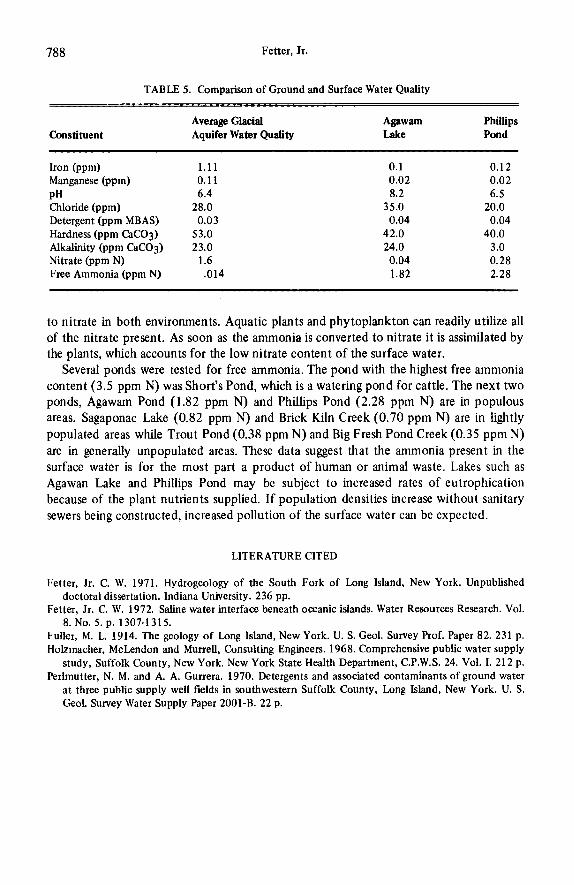
TABLE 5. Comparison of Ground and Surface Water Quality
Constituent Average Glacial Aquifer Water Quality
Agawam Phillips Lake Pond
Iron @pm) Manganese (pprn) PH Chloride (ppm) Detergent (ppm MBAS) Hardness (ppm CaCO3) Alkalinity (ppm CaC03) Nitrate (ppm N) Free Ammonia (ppm N)
1.11 0.11 6.4
28.0 0.03
53.0 23.0
1.6 .014
0.1 0.02 8.2
35.0 0.04
42.0 24.0 0.04 1.82
0.12 0.02 6.5
20.0 0.04
40.0 3.0 0.28 2.28
to nitrate in both environments. Aquatic plants and phytoplankton can readily utilize all of the nitrate present. As soon as the ammonia is converted to nitrate it is assimilated by the plants, which accounts for the low nitrate content of the surface water.
Several ponds were tested for free ammonia. The pond with the highest free ammonia content (3.5 ppm N) was Short’s Pond, which is a watering pond for cattle. The next two ponds, Agawam Pond (1.82 ppm N) and Phillips Pond (2.28 ppm N) are in populous areas. Sagaponac Lake (0.82 ppm N) and Brick Kiln Creek (0.70 ppm N) are in lightly populated areas while Trout Pond (0.38 ppm N) and Big Fresh Pond Creek (0.35 ppm N) are in generally unpopulated areas. These data suggest that the ammonia present in the surface water is for the most part a product of human or animal waste. Lakes such as Agawan Lake and Phillips Pond may be subject to increased rates of eutrophication because of the plant nutrients supplied. If population densities increase without sanitary sewers being constructed, increased pollution of the surface water can be expected.
LITERATURE CITED
Fetter, Jr. C. W. 1971. Hydrogeology of the South Fork of Long Island, New York. Unpublished
Fetter, Jr. C. W. 1972. Saline water interface beneath oceanic islands. Water Resources Research. Vol.
Fuller, M. L. 1914. The geology of Long Island, New York. U. S. Geol. Survey Prof. Paper 82. 231 p. Holzmacher, McLendon and Murrell, Consulting Engineers. 1968. Comprehensive public water supply
study, Suffolk County, New York. New York State Health Department, C.P.W.S. 24. Vol. I. 212 p. Perlmutter, N. M. and A. A. Gurrera. 1970. Detergents and associated contaminants of ground water
at three public supply well fields in southwestern Suffolk County, Long Island, New York. U. S. Geol. Survey Water Supply Paper 2001-B. 22 p.
doctoral dissertation. Indiana University. 236 pp.
8. NO, 5. p. 1307-1 31 5.
Recommended