Policy Research Working Paper 5864
What Drives the Global “Land Rush”?Rabah Arezki
Klaus Deininger Harris Selod
The World BankDevelopment Research GroupAgriculture and Rural Development TeamOctober 2011
WPS5864P
ublic
Dis
clos
ure
Aut
horiz
edP
ublic
Dis
clos
ure
Aut
horiz
edP
ublic
Dis
clos
ure
Aut
horiz
edP
ublic
Dis
clos
ure
Aut
horiz
edP
ublic
Dis
clos
ure
Aut
horiz
edP
ublic
Dis
clos
ure
Aut
horiz
edP
ublic
Dis
clos
ure
Aut
horiz
edP
ublic
Dis
clos
ure
Aut
horiz
ed

Produced by the Research Support Team
Abstract
The Policy Research Working Paper Series disseminates the findings of work in progress to encourage the exchange of ideas about development issues. An objective of the series is to get the findings out quickly, even if the presentations are less than fully polished. The papers carry the names of the authors and should be cited accordingly. The findings, interpretations, and conclusions expressed in this paper are entirely those of the authors. They do not necessarily represent the views of the International Bank for Reconstruction and Development/World Bank and its affiliated organizations, or those of the Executive Directors of the World Bank or the governments they represent.
Policy Research Working Paper 5864
The 2007–2008 upsurge in agricultural commodity prices gave rise to widespread concern about investors causing a “global land rush”. Large land deals can provide opportunities for better access to capital, transfer of technology, and advances in productivity and employment generation. But they carry risks of dispossession and loss of livelihoods, corruption, deterioration in local food security, environmental damage, and long-term social polarization that led some countries to recently pass legislation restricting foreign land acquisition. To stimulate evidence-based debate, this paper explores determinants of foreign land acquisition for large-scale agriculture. It quantifies demand for land deals, showing it focused on Africa where land expansion
This paper is a product of the Agriculture and Rural Development Team, Development Research Group. It is part of a larger effort by the World Bank to provide open access to its research and make a contribution to development policy discussions around the world. Policy Research Working Papers are also posted on the Web at http://econ.worldbank.org. The authors may be contacted at [email protected], [email protected] and [email protected].
is about 20 times the level it was in the past. The analysis uses data on bilateral investment relationships, together with newly constructed indicators of agro-ecological suitability in non-protected and forested areas with low population density as well as land rights security. It estimates gravity models that can help identify determinants of foreign land acquisition dedicated to large-scale agriculture. The results confirm the central role of agro-ecological potential as a pull factor. In contrast to the literature on foreign investment in general, the quality of the business climate is insignificant, whereas weak land governance and tenure security for current users make countries more attractive for investors. Implications for policy are discussed.
What drives the global “land rush”? 1
Rabah Arezki2
Klaus Deininger3
Harris Selod4
Keywords: Land Acquisition, Large-Scale Agriculture, Foreign Investments Agro-Ecological
Potential, Land Availability, Land Governance, Property Rights
JEL codes: F21, O13, Q15, Q34
1 The authors thank Charlotte Coutand and Caroline Silverman for helping with data coding, Daniel Monchuk,
Siobhan Murray, as well as Gunther Fischer and Mahendra Shah (International Institute for Applied Systems
Analysis) for their contribution to the construction of indicators of land availability, Jean-François Eudeline for
building the synthetic indicator of tenure security, and Thierry Mayer and Jacques Ould Aoudia for their guidance
and suggestions regarding the use of data on governance. They are also grateful to Derek Byerlee, Will Martin and
Jo Swinnen, for insightful discussions and suggestions, and to participants of the 2010 AAEA and NARSC
conferences for useful comments. Financial support from the TF-ESSD Trust Fund, PROFOR, the Bill and Melinda
Gates Foundation, the Hewlett Foundation and CEPREMAP is gratefully acknowledged. The views expressed in
this paper are those of the authors and do not necessarily reflect those of the International Monetary Fund or of the
World Bank , its Board of Directors or the countries they represent. 2 International Monetary Fund
3 The World Bank
4 The World Bank, Paris School of Economics – INRA, CREST and CEPR

2
1. Introduction
After decades of stagnant or declining commodity prices when agriculture was considered a ‗sunset
industry‘, recent increases in the level and volatility of commodity prices and the resulting demand for
land have taken many observers by surprise. This phenomenon has been accompanied by a rising interest
in acquiring agricultural land by investors, including sovereign wealth and private equity funds,
agricultural producers, and key players from the food and agri-business industry. Investors‘ motivations
include economic considerations, mistrust in markets and concern about political stability, or speculation
on future demand for food and fiber, or future payment for environmental services including for carbon
sequestration. Some stakeholders, including many host-country governments, welcome such investment
as an opportunity to overcome decades of under-investment in the sector, create employment, and
leapfrog and take advantage of recent technological development. Others denounce it as a ―land grab‖
(Zoomers 2010). They point to the irony of envisaging large exports of food from countries which in
some cases depend on regular food aid. It is noted that specific projects‘ speculative nature, questionable
economic basis, or lack of consultation and compensation of local people calls for a global response (De
Schutter 2011). In a context of diametrically opposite perceptions, the objective of the present paper is to
provide greater clarity on the numbers involved and the factors driving such investment. This is done by
quantifying demand for land deals, and exploring the determinants of foreign land acquisition for large-
scale agriculture using data on bilateral investment relationships. This work is an important first step to
assess potential long-term impacts and discuss policy implications.
The analysis of large-scale land deals is relevant for a number of key development issues. One such issue
is the debate on the most appropriate structure of agricultural production. The exceptionally large poverty
elasticity of growth in smallholder agriculture (de Janvry and Sadoulet 2010, Loayza and Raddatz 2010)
that is reflected in rapid recent poverty reduction in Asian economies such as China, and the fact that the
majority of poor are still located in rural areas led observers to highlight the importance of a smallholder
structure for poverty reduction (Lipton 2009, World Bank 2007). At the same time, disillusion with the
limited success of smallholder-based efforts to improve productivity in Sub-Saharan Africa (Collier 2008)
and apparent export competitiveness of ―mega-farms‖ in Latin America or Eastern Europe during the
2007/8 global food crisis have led to renewed questions about whether, despite a mixed record, large scale
agriculture can be a path out of poverty and to development.
Whatever the envisaged scenario, renewed pressure on land raises the issue of whether there is sufficient
competition and transparency to ensure that land owners or users are able to either transfer their land at a
fair price or hold on to it as opposed to having it taken away without their consent and in what may be
perceived an unfair deal. This resonates with recent contributions to the literature that suggest that
3
resource abundance can contribute to more broad-based development only if well-governed institutions to
manage these resources exist (Oechslin 2010). This is borne out by empirical evidence both across
countries (Cabrales and Hauk 2011) and within more specific country contexts where resource booms
may have fuelled widespread rent-seeking and corruption (Bhattacharyya and Hodler 2010) or even
violence (Angrist and Kugler 2008) rather than economic development.
To better understand this phenomenon and its potential impact, an empirical analysis of the factors
driving transnational land acquisition is needed. To this end, we constructed a global database with
country-level information on both foreign demand for land and implemented projects as documented in
international and local press reports. We complement it with country-specific assessments of the amount
of potentially suitable land and other relevant variables. We then use bilateral investment relationships
from the database to estimate gravity models that can help identify determinants of foreign land
acquisition. Results confirm the central role of agro-ecological potential as a pull factor but suggest that,
in contrast to what is found for foreign investment more generally, rule of law and good governance have
no effect on the number of land-related investment. Moreover, and counter-intuitively, we find that
countries where governance of the land sector and tenure security are weak have been most attractive for
investors. This finding, which resonates with concerns articulated by parts of civil society, suggests that,
to minimize the risk that such investments fail to produce benefits for local populations , the micro-level
and project-based approach that has dominated the global debate so far will need to be complemented
with an emphasis and determined action to improve land governance, transparency and global monitoring.
The paper is organized as follows. Section 2 puts recent land demand into broader context, highlighting
the importance of governance in attracting investments. It draws on an analysis of how foreign direct
investment (FDI) is treated in the macro-literature to suggest a methodological approach, and outlines
how we address specific data needs. Section 3 presents our cross-sectional data on land demand, outlines
the econometric approach, and briefly discusses relevant descriptive statistics. Key econometric results in
section 4 support the importance of food import demand as motivations for countries to seek out land
abroad (‗push factors‘) and of agro-ecological suitability as key determinants for the choice of destination
(‗pull factors‘). They also highlight the extent to which weak land governance seems to encourage rather
than discourage transnational demand for land. Section 5 concludes by highlighting a number of
implications for policy.
2. Conceptual framework and empirical evidence
In a historical perspective, the surge of demand for land in the wake of the 2007/2008 commodity price
was but one of a series of booms in farm land. Putting it into context also helps to understand the role of
technical, economic, and institutional factors in shaping the nature and eventual impact of such

4
investment. We also summarize methodological lessons from the macro-literature on bilateral investment
to empirically investigate this phenomenon and discuss some of the specific variables that need to be
considered in the empirical analysis, including cultural and physical proximity, and endowment with
fertile land, and (land) governance.
2.1 A broader perspective
Large trans-national land acquisitions, though rarely via market processes, were first observed in the
context of conquests and colonial expansion. However, as the purposes frequently included promoting the
colonists‘ own operations using cheap labor, the share of land actually utilized often remained small
(Conning and Robinson 2007). In fact, many of the ventures established in this context survived only
because they benefited from subsidies and market distortions in their favor (Binswanger et al. 1995).
Subsequent spikes in acquisition of large tracts of land resulted from changes in the cost of transport such
as those associated with steamships and refrigeration, or with technology shifts that made use of lands
which had previously been thought to be beyond the frontier viable economically. While specific
circumstances varied immensely, some general lessons emerge.
First, numerous studies document the long-term effects of the way in which land was accessed in
developing countries (Banerjee and Iyer 2005, Iyer 2010) as well as in developed countries (Libecap and
Lueck 2011). This implies that the institutions established to make land available had impacts in the long
term and shaped outcomes, in particular the economic and social development of original land users, for
decades and sometimes centuries to come. The differential impact of Central America‘s 19th century
commodity booms provides an interesting illustration. Partly because the economic viability of large
farms depended on a cheap labor force with limited outside options, large scale investments in countries
pursuing a strategy of smallholder land ownership–such as Costa Rica and Colombia–was much more
favorable than in ones–such as El Salvador or Guatemala–whose strategy focused on establishing large
plantations. Literacy rates have differed sharply between the two groups ever since the late 19th century
and significant gaps have emerged with respect to other human development indicators and the
establishment of democracy. Where a large farm strategy had given rise to ‗landlord dominance‘, it took
more than a generation longer, i.e. some 40 years, for democracy to take hold than in countries where the
structure of production focuses on smallholders (Nugent and Robinson 2010). More recently, policies that
required to demonstrate ―productive‖ use of land in Brazil, together with capital subsidies, have
encouraged both deforestation (Pacheco and Poccard Chapuis 2009) and very capital-intensive modes of
production that have a limited impact on employment generation and poverty reduction.
Second, agriculture is a business that faces technical challenges, long gestation periods, low margins, and
a dependence on the vagaries of weather and variation in micro-climatic conditions. In many developing

5
countries, these are exacerbated by past neglect of public spending on technology and infrastructure and
institutional challenges. Overcoming these and making a profit can be difficult even for ventures that are
technically and economically viable in principle. In fact, many well-intended or well-resourced schemes,
including the ―bonanza farms‖ established in the Dakotas in 1860-1900 (Drache 1964), Brazilian rubber
plantations established by Henry Ford in the 1920s (Grandin 2009), and efforts in the 1960s to establish
large-scale agriculture in the Lakeland Downs of Australia‘s far Northeast ended in spectacular failure
and reverted back to smallholder cultivation. As a result, land that had been acquired at high cost during
the boom was later often transferred at a fraction of the initial acquisition price. The challenges of
―greenfield‖ investments in developing countries are also evident from the fact that even not-for profit
institutions with access to large amounts of capital and expertise such as the Commonwealth
Development Corporation only managed success rates of some 20%.5 This would not be a problem in a
well-governed institutional environment where failure is signaled quickly and avenues for smooth
liquidation are available. It can, however, create problems, including attempts by unsuccessful
entrepreneurs to make local communities bear the cost of failure if these conditions do not apply.
Third, a number of examples highlight that targeted support to public goods in priority sectors can have
positive impacts if deployed in a transparent way and in the context of a strategy to exploit a hitherto
underutilized resource in line with the country‘s comparative advantage. In Uruguay for instance, the
provisions for subsidies and tax breaks in the 1987 forestry law helped attract FDI to establish a globally
competitive forestry industry that generated employment and income, provided environmental benefits,
and increased land values (Morales Olmos 2007).6 In Brazil, long term investments in technology to
generate varieties and tillage methods suited to the cerrado’s low latitudes and acid soils provided the
basis for expansion into vast areas of the country‘s hinterland that had not been cultivated in the 1970s,
and generated large economic benefits. Still, this process was far from straightforward and many lessons
regarding the need for public investment, institutional pre-conditions, and environmental protection
emerged (World Bank 2009). In Peru‘s Pacific region, transparent auctions of some 235,500 ha of public
land that aimed to bring in large agricultural investment with strong technical vetting brought in almost
US$50 million in investment over the past 15 years, helping the country to emerge as a major high-value
agro-exporter of horticultural produce, and generating many jobs (Hernandez 2010). In contrast, offering
land below its true opportunity cost is unlikely to attract the right types of investors, and–to the extent that
this involves taking it from local communities without proper process or adequate compensation—may
create large social problems. In Indonesia, efforts to foster development of the palm oil industry by giving
5 This figure is from G. Dixie, in a World Bank personal communication. Even in plantation crops such as bananas or oil palm, where large-scale
cultivation offers advantages, the record of transnational investments is mixed and large companies are often accused of non-competitive
behavior and getting embroiled in local politics, as in Guatemala in the 1950s (Brockett 1988). 6 Subsidies and tax breaks targeted forest plantations or processing industries on marginal lands that had previously been used for cattle ranching.

6
away forested land for free have failed to lead to sustainable investment in numerous cases. Instead, it
contributed to the loss of land with high biodiversity, to rent seeking, and to conflict (Koh and Wilcove
2008).7 In Sudan, the transfer of land for free neglected traditional users‘ rights and led to conflict and soil
mining rather than to the establishment of a competitive farm sector (Johnson 2003).
Fourth, agricultural cultivation has traditionally been dominated by small farms and increases in the
average farm size driven largely by higher non-agricultural wages. New technological developments in
crop breeding, tillage, and information technology all make labor supervision easier. They may also
reduce the diseconomies of scale that have traditionally been associated with large agricultural operations
and transmit benefits from vertical coordination throughout the value chain to the stage of production
(Deininger and Byerlee 2011). This is in some sense similar to plantation crops where such integration
has long provided a strong competitive advantage to larger operations. In some cases, this can lead to
situations where efficient, diversified, and vertically integrated operators can lease farmers‘ land at prices
higher than what these could obtain from self-cultivation (Regunaga 2010). At the same time, many
technical innovations are less scale-biased than often thought–as information technology, for example,
can also be used to better coordinate smallholder farmers. Moreover, very large units of production
emerge in many cases because of their superior ability to deal with market imperfections (access to
finance), lack of public goods (education), and weak governance. If other markets work, removal of these
constraints would then give rise to smaller operational farm sizes. While more detailed research is needed,
anecdotal evidence suggests that in many settings farms are very large not because of inherent advantages
of the technology but because large operators‘ superior ability of to deal with other market imperfections.
2.2 Insights from the macro literature
The recent nature of the phenomenon implies that empirical analysis has thus far been limited. In fact,
most of the literature on land markets in developing countries focuses on transfers among locals, usually
small farmers (Deininger 2003, Deininger and Feder 2001) that may be of limited relevance in this
context. While we know of no cross-country study addressing foreign land acquisition, the literature on
foreign investment flows offers relevant methodological and substantive lessons.
Methodologically, the empirical literature on the determinants of capital flows has distinguished between
pull and push factors to explain the magnitude and distribution of capital flows to developing countries
(Calvo et al. 1996).8 By taking into account country-specific factors such as cultural and geographical
proximity, the analysis of bilateral flows between specific investor and host countries can add significant
insights to our understanding of transnational investments (Benassy-Quere et al. 2007). Gravity models
7 By some estimates up to 12 million ha have been allocated to oil palm and deforested but not planted (Fargione et al. 2008). 8 Push factors (e.g. business cycle in G7 countries) explain the magnitude of capital flows. Pull factors relate to domestic country characteristics (e.g. economic performance) that help explain the distribution of capital flows across developing countries.

7
that empirically relate FDI between two countries to the size of each partner, bilateral distance and a set
of variables accounting for relative costs are consistent with a strand of theoretical literature on trade and
capital flows (Markusen and Venables 1998). They allow us to establish a synthesis of modeling
structures relying on both horizontal and vertical motives for FDI (Markusen and Venables 2000) and
have thus been widely used in the literature to explain bilateral FDI (Wei 2000).9
Substantively, a key stylized fact is that, while liberalization of capital markets over the past decades has
considerably increased capital flows to developing countries (Prasad et al. 2008), the volume of such
flows remained well below the level that would be predicted by neoclassical theory in order to equalize
returns to capital. This finding is commonly referred to as the Lucas paradox (Lucas 1990). In fact,
countries with weak rule of law, high political or default risk, underdeveloped financial markets, or high
transaction cost and deficiencies in governance may attract only limited investment flows even if they
offer high rates of return (Shleifer and Wolfenzon 2002). In this respect, institutional factors have been
shown to play an important role in unilateral models to explain the magnitude and nature of capital flows
towards developing and emerging economies in a cross section of countries (Alfaro et al. 2008).
At the same time, the magnitude and nature of capital flows varies across countries (Schnitzer 2002).
Different forms of investment differ from each other with the main trade-off being between the length of
commitment implied in such investment (or conversely the ease of withdrawing funds) and the ability to
exercise managerial control (Sawant 2010). The share of FDI in total capital flows is likely to be higher in
countries with weak governance because, in such cases, investors will demand ways of investing that will
provide them with greater control (Hausmann et al. 2007).10 Given its long time horizon and the
associated potential to transfer technology, knowledge, and skills, direct foreign investment (FDI) rather
than portfolio investment is often seen as more conducive to local development. Indeed, cross-country
analysis points to a positive effect of FDI on GDP growth (Borensztein et al. 1998).
2.3 Implications for analyzing farmland investment
Applying the above framework to cross-border farmland investment, while straightforward in principle,
requires complementing traditional models with specific variables in three areas. First, as much of the
initial demand for land seems to have been driven by fear of high dependence on food imports and threats
of political instability, bilateral variables such as physical, cultural, and geopolitical proximity (e.g.
9 Horizontal motives for the location of multinational firms abroad relates to their desire to be closer to markets. Vertical motives explain the
same decision from a desire to take advantage of different production costs for different stages of production (Helpman 1984). 10 The OECD defines FDI as "an activity in which an investor resident in one country obtains a lasting interest in, and a significant influence on
the management of, an entity resident in another country. This may involve either creating an entirely new enterprise (―greenfield‖ investment)
or, more typically, changing the ownership of existing enterprises via mergers and acquisitions." A takeover by a foreign firm is considered FDI if the foreign firm holds at least 10% of the voting rights on the board.

8
language or past colonial relationship) will need to be complemented with information on countries‘
dependence on food imports. This is dealt with in a straightforward way by using standard FAO figures.
Second, as the attractiveness of a country for farmland investment will depend on the availability of non-
cultivated land with high agro-ecological potential that is easily accessible, a measure for potential agro-
ecological suitability of land, overlaid with current land use, is needed. Past attempts to measure the
amount of land potentially available for agriculture suffered from conceptual and technical limitations
(Young 2000, Ramankutty et al. 2008). If potentially suitable land is either covered by forest or home to
traditional communities, much of what could potentially be available for agriculture may at the same time
provide environmental and social benefits. A proper definition of potentially ―available‖ land will thus
have to exclude protected areas, forests, and areas that are already occupied. To make this operational we
use the agro-ecological potential for rainfed cultivation11 as defined by the Global Agro-ecological
Zoning project (Fischer et al. 2002). To make this information useful for our purpose, we overlay this
with information on actual land use and population density drawing on a variety of databases12 to derive a
measure of land with high potential for rainfed cultivation that is currently not utilized and that excludes
forests, protected areas, and areas with a population threshold above a certain maximum. Details of the
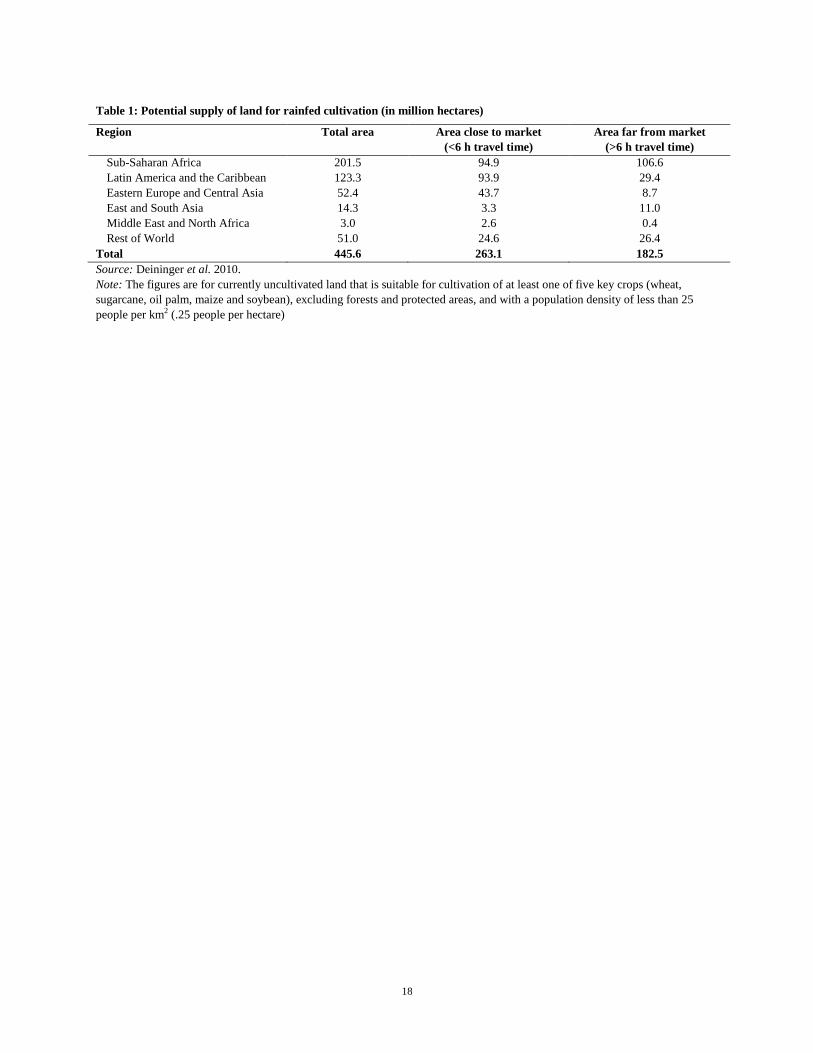
methodology are discussed in Fischer and Shah (2010). Aggregate results, by region and for the world in
total, are illustrated in Table 1. If defined this way, the area of total ―available‖ land amounts to some 445
million ha, compared to about 1.5 billion ha already under cultivation (Deininger et al. 2011a). Most of
this land is in Sub-Saharan Africa, Latin America, and Eastern Europe (201, 123, and 52 million ha,
respectively) although in the latter, relatively higher shares of land are in proximity to markets. As land
availability is a key driver of the ―land rush‖, we expect this variable to be positive and highly significant.
Third, while the link between foreign investment and governance has long been highlighted, special
attention to land governance may be warranted.13 To address this issue, we draw on three complementary
indicators for general and land governance. First, we use the Doing Business database which ranks the
extent to which countries‘ legal and regulatory environment and uses the results to construct an index of
―weak investor protection‖.14 A low value of this index reflects weak protection of investors‘ rights. A
11 We focus on rainfed cultivation as issues related to riparian rights and seasonal availability of water in a certain area as well as the investment
needs for irrigation would require a more in-depth treatment. 12 Our measure of agricultural land outside the forest and protected areas is constructed from various bases, including Global Land Cover 2000
(http://www-gem.jrc.it/glc2000) PAGE Global Agricultural Extent (http://www. ifpri.org / dataset / pilot-analysis-global-Ecosystems-page), Global Forest Resources Assessment 2000 (http://www.fao.org/forestry/32203/en) and World Database on Protected Areas 2009
(http://www.wdpa.org / download.aspx). The extent of arable land outside forest and protected areas and in sparsely populated areas (that is to
say less than 25 inhabitants per km2 or more than 4 ha per capita) uses LandScan 2003 Global Population (http://www .ornl.gov /Landscan/). 13 Key relevant aspects of land governance are the clarity with which rights are assigned and the accessibility of textual and spatial information on
rights, the way in which state land is managed, disposed of, and acquired, the way land is taxed and land use is regulated, and the existence,
accessibility, and impartial nature of institutions for conflict resolution (Deininger et al. 2011b). 14 The index consists of a weighted average of indices measuring the transparency of transactions, the liability of company directors and
shareholders, and the power of administrators to hold directors accountable for misconduct. The underlying premise that excessive regulation and
red tape deters investment and foster corruption is not uncontroversial and has been challenged because it only measures inputs but not the quality of public goods, e.g. property rights, provided (Arrunada 2007) and because it presumes an Anglo-Saxon model that may be less applicable in

9
second measure ranks countries‘ regulatory quality, rule of law, control of corruption, political stability,
absence of violence, and voice and accountability in descending order in terms of percentiles of the
distribution based on the World Governance Indicators (Kaufmann et al. 2004). Low values characterize
countries with poor governance. Finally, for land governance, we use a newly developed cross-country
database assembled by the French Development Agency.
Key variables of the land governance indicator include tenure security and recognition of existing land
rights (even if not formalized), the existence of a land policy, and levels of land-related conflict. We use
the first component from a principal component analysis of these variables as an indicator of overall
tenure security. Low values describe countries with high levels of tenure insecurity. Whether good (land)
governance increases a country‘s attractiveness for land-related investment is difficult to anticipate the
direction of the effect as there are two countervailing forces. On the one hand, given the long time horizon
of any agricultural investment, security of property rights is likely to be a key determinant of long-term
investment decisions as investors will not tie up large amounts of resources in a country where weak or
unclear rights create a danger of opportunistic government behavior and creeping expropriation (Schnitzer
1999) once investments are sunk. The opposite could, however, also be true, i.e. large investors may find
it easier to establish and defend property rights if (land) governance and the state‘s enforcement capacity
and presence are weak. Some investors unfamiliar with customary tenure systems may indeed believe that
it will be easier and more ‗secure‘ to acquire land directly from governments rather than by engaging in a
dialogue with local rural populations. Others are quite outspoken about the perceived need and desire to
enforce property rights through private militias--despite the problematic historical precedents. 15
3. Data, econometric approach, and descriptive statistics
Country as well as cross-country level data on large scale land acquisition suggests that the phenomenon
has reached large proportions. Press reports provide a consistent source of information that can be drawn
upon to analyze the drivers of the phenomenon. We argue that a Poisson model is the most appropriate
structure to econometrically explore the determinants of investment demand as well as of projects with
actual production, and discuss descriptive statistics for key independent variables.
3.1 Recent trends in large-scale land deals
Official data on land deals from registries would, in principle, provide the best source of information on
the phenomenon (at least for signed deals). However, efforts to obtain such data even for a subset of
countries illustrate that, partly because of institutional weaknesses, such information is remarkably
difficult to obtain (Deininger et al. 2011a). In 6 countries where reasonably reliable information could be
other institutional contexts (Fauvarque-Cosson and Kerhuel 2009). 15 For an interesting perspective on this, see the story of Jarch capital in Southern Sudan as reported in various media (e.g. Funk, 2010).

10
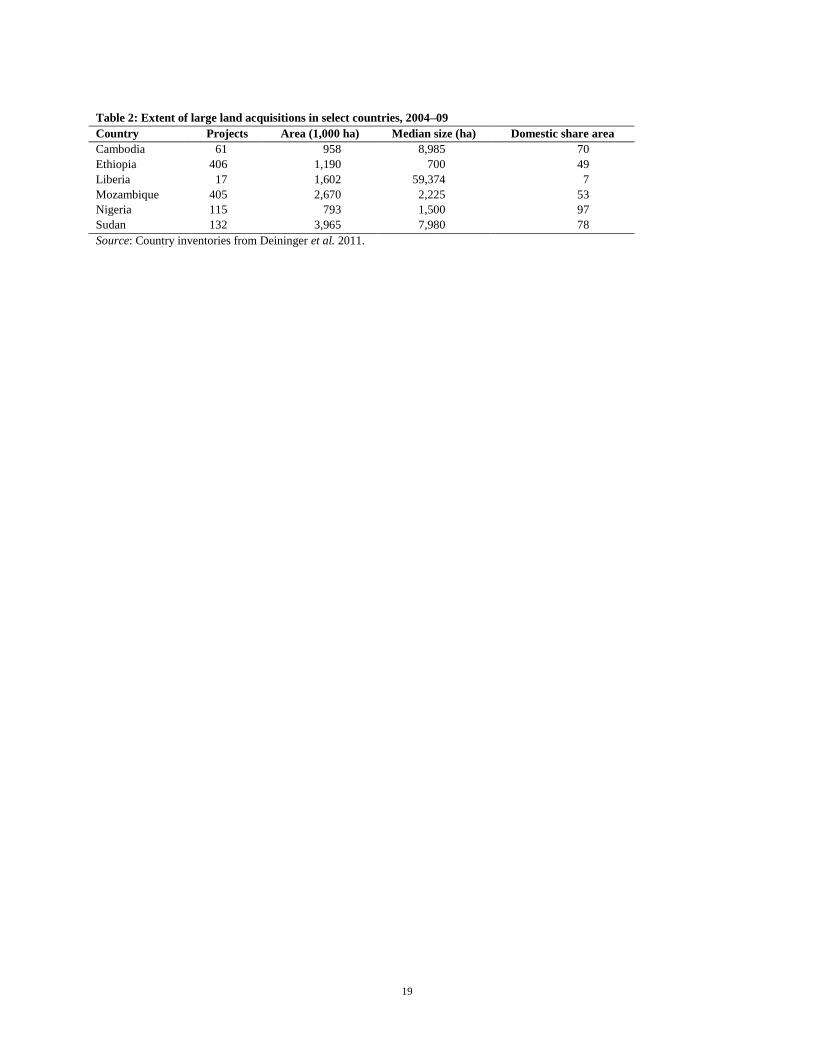
obtained, often by aggregating up from regional registries, we find support for the notion of a recent and
marked increase in land transfers (Table 2). Total confirmed land transfers over the 2004-2009 period
amounted to 4.0 million ha in Sudan, 2.7 million ha in Mozambique, 1.2 million ha in Ethiopia and 1.6
million ha—although mainly through renegotiation of existing agreements—in Liberia. Comparing these
figures to the estimated total available area in each country reveals that this respectively amounts to 8.6%,
16.6%, and 25.4% of the total suitable non-forested non-protected area with a population density of less
than 25 inhabitants per km2 for Sudan, Mozambique, and Ethiopia, respectively.
Given the difficulties of obtaining consistent data from official sources, we use information from press
articles to get a global picture of the recent demand for large scale land acquisition. Our sample is based
on such reports published between Oct. 1, 2008, and Aug. 31, 2009, as reported by the NGO GRAIN.16
Figure 1 plots the evolution of the IMF food price index and the number of recorded press reports on
cross-border land acquisitions. The ―land rush‖, or at least media awareness of it, started with the 2007
2008 commodity price boom. While commodity prices soon returned to more moderate levels, investors‘
interest in land persisted. Using data on the size of projects where available in such reports, Table 3
compares regional rates of land expansion in the 1961-2007 period to demand for land by investors. Press
reports suggest that such demand disproportionately focused on Africa where almost 70% of the area of
interest to investors was located but also that it was quantitatively large: compared to an annual rate of
area expansion in Africa of some 1.8 million ha in 1961-2007, demand for land in Africa in 2009 alone
amounted to some 39.7 million hectares--greater than the total agriculturally cultivated area of Belgium,
Denmark, France, Germany, the Netherlands, and Switzerland combined.
Two comments are in order to interpret this figure. First, it refers to demand for land deals rather than
actual transactions or area brought under production. Second, as reports of land acquisitions are less likely
in countries where press freedom is limited or where land acquisition is not ―new‖ or ―noteworthy‖, it
may be biased downward and covering only the largest projects. Efforts to cross-check the information
from press reports with administrative data in the countries where such information is available supports
this in the sense that while not all the projects mentioned in press reports could be identified in official
data–presumably because some had never made it beyond expressions of interest–most lands actually
transferred could be traced to press reports. Preliminary results from a recent effort to more systematically
cross-check press reports confirm this finding.17 For each project, we code origin and destination
country,18 size, commodities involved, investor type, and whether any activity had started.19 The universe
16 The data can be accessed at www.farmlandgrab.org. 17 Results will soon be posted on ILC‘s website http://www.commercialpressuresonland.org/monitoring-land-transactions. 18 In Sub-Saharan Africa, key target countries are Sudan, Ethiopia, Nigeria, Ghana and Mozambique, which account for 23% of projects. 21% of projects are in Latin America and the Caribbean (mainly Brazil and Argentina), 11% in Europe and Central Asia (Kazakhstan, Russia, and
11
comprises of 464 projects, 21% of which have started production.20 Of these, 405 have information on
crops and 203 on the area involved.21 Among the latter projects, one quarter aims to cultivate more than
200,000 ha each and a median size of 40,000 ha per project illustrates investors‘ ambitions.
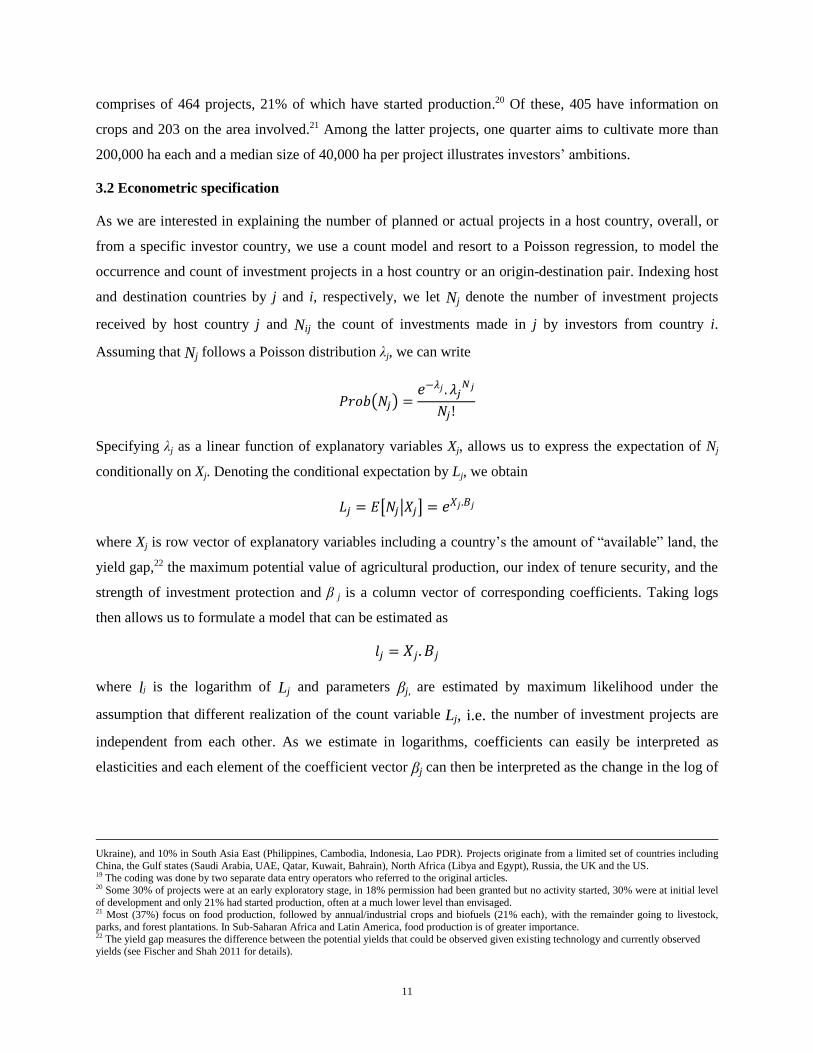
3.2 Econometric specification
As we are interested in explaining the number of planned or actual projects in a host country, overall, or
from a specific investor country, we use a count model and resort to a Poisson regression, to model the
occurrence and count of investment projects in a host country or an origin-destination pair. Indexing host
and destination countries by j and i, respectively, we let Nj denote the number of investment projects
received by host country j and Nij the count of investments made in j by investors from country i.
Assuming that Nj follows a Poisson distribution λj, we can write
Specifying λj as a linear function of explanatory variables Xj, allows us to express the expectation of Nj
conditionally on Xj. Denoting the conditional expectation by Lj, we obtain
where Xj is row vector of explanatory variables including a country‘s the amount of ―available‖ land, the
yield gap,22 the maximum potential value of agricultural production, our index of tenure security, and the
strength of investment protection and β j is a column vector of corresponding coefficients. Taking logs
then allows us to formulate a model that can be estimated as
where lj is the logarithm of Lj and parameters βj, are estimated by maximum likelihood under the
assumption that different realization of the count variable Lj, i.e. the number of investment projects are
independent from each other. As we estimate in logarithms, coefficients can easily be interpreted as
elasticities and each element of the coefficient vector βj can then be interpreted as the change in the log of
Ukraine), and 10% in South Asia East (Philippines, Cambodia, Indonesia, Lao PDR). Projects originate from a limited set of countries including
China, the Gulf states (Saudi Arabia, UAE, Qatar, Kuwait, Bahrain), North Africa (Libya and Egypt), Russia, the UK and the US. 19 The coding was done by two separate data entry operators who referred to the original articles. 20 Some 30% of projects were at an early exploratory stage, in 18% permission had been granted but no activity started, 30% were at initial level
of development and only 21% had started production, often at a much lower level than envisaged. 21 Most (37%) focus on food production, followed by annual/industrial crops and biofuels (21% each), with the remainder going to livestock,
parks, and forest plantations. In Sub-Saharan Africa and Latin America, food production is of greater importance. 22 The yield gap measures the difference between the potential yields that could be observed given existing technology and currently observed yields (see Fischer and Shah 2011 for details).

12
the conditional expectation of the number of investment projects resulting from a one-unit increase in the
value of the corresponding element of Xj.
For the bilateral case, we replace lji with lji i.e., the number of planned or realized investments by investor
origin country i in host j. Similarly, we replace Xj with Xij which can be partitioned into destination
characteristics (VarDestj) origin attributes (VarOrigi), and bilateral variables (VarBilati,j) characterizing
the specific origin-host pair. Formally, the bilateral count model (Poisson regression) is
where variables are defined as above. In our empirical application, VarOrigi includes food dependence
and the population of the country of origin, includes the same variables as in the unilateral case and
VarBilat i,j includes the physical distance between the two countries and the existence of a historic
colonizer / colonized relationship.
Two common problems with log-linear gravity models relating to international trade and investment are
the presence of zeros and heteroskedasticity of errors which can lead to bias and inconsistency of the OLS
estimates. Our use of the Poisson pseudo-maximum-likelihood estimator follows the suggestion to use
this estimator as the best way to deal with these issues (Silva and Tenreyro 2006). It has, however, been
argued that in trade models, large numbers of zeros may pose greater challenges than heteroskedasticity
of errors and that, in this case, a simple Tobit will be preferable to a Poisson if the deviation from the
assumed distribution of residuals is modest (Martin and Pham 2011). We thus complement the Poisson
regressions with standard Tobit regression models, the results of which are reported in appendix tables.
3.3 Key independent variables
Means of key country characteristics, endowments, and institutional quality, are reported in Table 4 for
the entire sample, and separately for all countries of origin, for countries of origin that are not also a
destination country, for all destination countries, and for destination countries that have at least one
project under production (as opposed to only the target of interest in farmland). Origin countries have
higher GDP than destinations (much higher in the case of ‗exclusive‘ origin countries that are not targeted
at all for investment). They are net food importers, with net imports of US$ 12 per capita (US$ 211 for
exclusive origin countries) while destination countries show net exports of US$ 30 per capita (US$ 99 per
capita in destination countries with at least one operating project).
Figure 2 provides a graphical illustration of the information on potential output per ha, a direct reflection
of land quality. Aggregating to the country level suggests that, surprisingly, destinations and origins do
not differ widely from each other in terms of absolute land availability at this level of aggregation though

13
it is worth noting that destination countries with implemented projects are larger and have more abundant
land for cultivation and land under forests (respectively 6.5 and 13.1 million hectares). On the contrary,
origin countries have no such land left, as is most clearly visible for ―exclusive‖ ones, (with 0 and 0.1
million hectares respectively for land for cultivation and land under forest). There is some difference in
agro-ecological potential between the country categories: as one would expect if such investments were to
follow comparative advantage, potential output values from cultivation of uncultivated land are higher in
destination than origin countries, and highest in those with implemented projects. Also, with origin
countries obtaining more than half of the attainable yield already compared to about one-third in
destinations, there appears to be potential for catch-up growth using existing technology. Interestingly,
this potential is even greater in destination countries with implemented projects than in other destination
countries. Data on governance suggest that, overall, regulatory quality, protection of investors‘ rights, and
land governance are significantly weaker in destination countries. Interestingly, there is no significant
difference in governance between destinations with and without implemented projects.
4. Econometric results
Analyzing the determinants of large agricultural investment in unilateral and bilateral models suggests
that (i) agro-ecological suitability is indeed a critical factor for both demand and actual implementation;
(ii) the difference between potential and actual production (i.e. the ―yield gap‖) affects land demand but
not project implementation; and (iii) while conventional governance variables are at most weakly
significant, a measure of land governance that incorporates the security of local land rights is highly
significant, strongly suggesting that demand for land is significantly higher in settings where such rights
are only weakly protected.
4.1 Unilateral relationships
Regressions for the count of projects involving large-scale land acquisition at the country of destination
(unilateral case) are reported in Table 5 (where the top panel refers to all projects and the bottom panel to
projects with some production only). While we only report results from the Poisson model, qualitatively
similar results are obtained if we estimate the equation by OLS instead. Our results are also robust to a
correction of the variance-covariance matrix of the ―sandwich‖ estimator to take into account possible
problems of omitted variable and intra-group correlation of residuals. In all cases, the potentially
cultivable area outside of forests or the potential value of output on suitable non-forest area is highly
significant, suggesting that land availability is a primary motivation for such investment. The coefficients
of 0.496 and 0.688 for area (in col. 1) or 0.526 and 0.684 for potential output value (in col. 2) suggest
that, other things being equal, a 10% increase of potentially suitable area or output value would increase

14
the number of projects by between 5.1% and 7.1%.23 Surprisingly though, the coefficients for potentially
cultivable area under forest or for the value of output in these areas are not significantly different from
zero. Although this does not imply that the land rush does not pose environmental risks, it is consistent
with the notion that, except in some limited circumstances (e.g. oil palm in Indonesia), investor interest
tends to be focused on areas that have already been cleared.
While the coefficient for the yield gap is positive and (marginally) significant in some regressions for all
projects, it lacks significance in the regressions for projects under production only. This would suggest
that, even though investors may be attracted to countries with high yield gaps where returns to investment
could be higher, they have thus far not generally anticipated being able to capitalize on this potential by
introducing new technology. This is in line with the notion that introducing new technology to close yield
gaps requires complementary (public) investment in infrastructure or support services.
Finally, the results regarding the role of governance variables are of interest in two respects. On the one
hand, and in contrast to the literature on FDI, the coefficients on standard governance variables are not
significant.24 We report results for investor protection only, noting that qualitatively similar findings
emerge if other standard governance variables are included. While the point estimate is negative as
expected, it is insignificant throughout, suggesting that a more conducive investment climate will not
make it easier to attract land-related investment. On the other hand, the effect of land governance is
striking. Instead of land acquisition projects being contingent on good land governance and the associated
strong protection of rights, we find that weak land governance makes a country more attractive for land-
related investment. Furthermore, the effect is quantitatively important: a one standard deviation
deterioration in the land governance index (equivalent to the difference between Angola and Brazil)
would be predicted to increase the number of investment projects by 33% even with other factors held
constant (such as land abundance which would be associated with weaker land governance). Although
more detailed work at project level would be required to establish a causal link, a correlation along these
lines suggests that, for much of the investment demand considered here, long-term security of tenure has
been less of a concern for investors. Taken at face value, this coefficient means that expressed concerns of
civil society about the interests at play being mostly extractive with little concern about long-term
benefits to local populations may not be entirely misplaced. Interestingly, the significance of the
coefficient disappears when considering only countries with projects under production (panel 2). This is
consistent with the notion that, in countries with weak land governance or weak recognition of local land
23 The reported coefficient should be interpreted as the change in the logarithm of the conditional expectation of the number of projects associated with a unit increase in the explanatory variable. As the regressor is in logs, we have in the first case for instance dN/N=exp(0.0495)-1=0.051. 24
Note that we do not include GDP per capita in our regressions. One reason is that we want to focus on the effect of some specific
characteristics of the agricultural sector rather than on the effect of overall economic performance. Another reason is that income per capita is often seen as an outcome of institutions and governance structure (Acemoglu et al. 2001) which are already included in our regressions.

15
rights, successful implementation of projects is difficult for a number of reasons, including resistance by
local people during project implementation. Alternatively, it could imply that the phenomenon is too new
to be observed in operations or that much of the interest reflected in press reports may be speculative.
4.2 Bilateral relationships
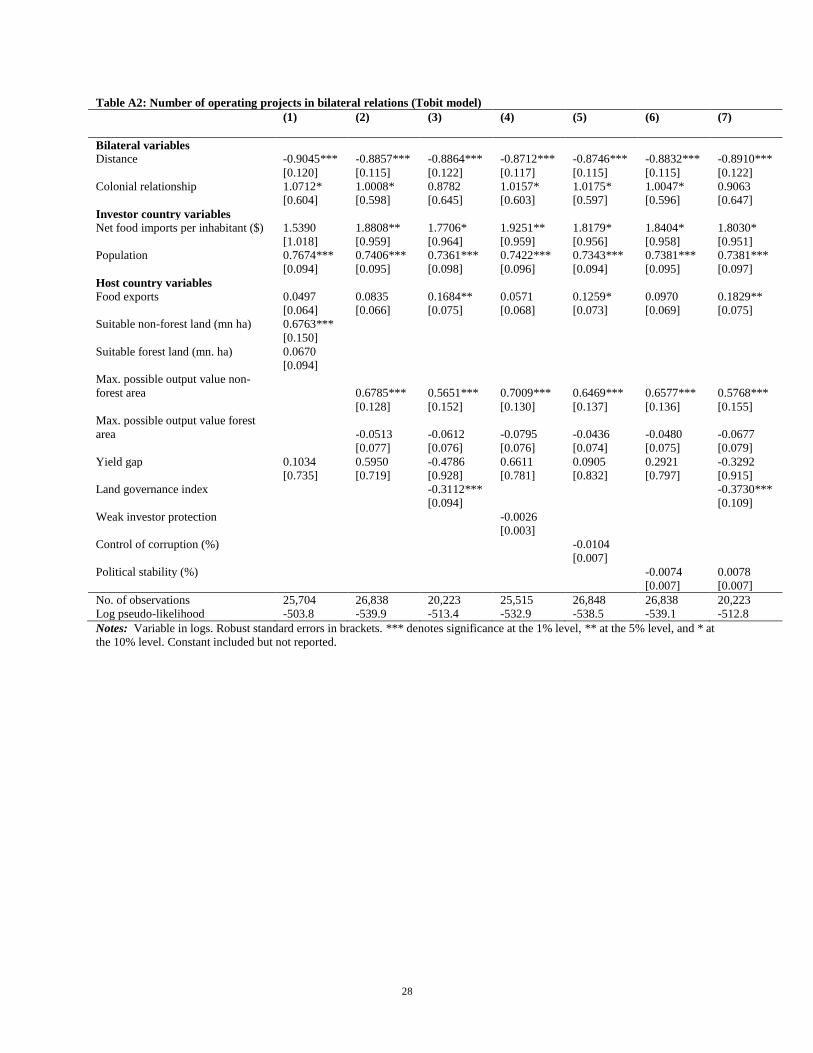
Poisson regressions for bilateral investor/host relationships in Table 6 (for interest in land acquisition) and
in Table 7 (for actual implementation) allow a richer categorization of the phenomenon by considering
investor and host country characteristics separately and by controlling with bilateral variables. The results
from a standard Tobit which are reported in appendix tables A1 and A2 to complement the Poisson
regression allay fears that our results could be driven by our specification only. As the substantive results
from the Tobit are identical to the ones from the Poisson model, we limit our discussion to the Poisson
specification. Overall, we note that the bilateral regressions confirm some of the conclusions from the
unilateral approach, they also provide important and new insights on the drivers of the land rush.
On the demand side, the amount of food imports per inhabitant and overall population size are key
determinants of interest for land acquisition, suggesting that countries with large populations that depend
on trade for food consumption are more likely to engage in investment projects requiring large-scale
acquisition of land. It suggests that a desire to acquire land increasingly complements more traditional
means of dealing with imbalances in food supply through markets and storage. Distance is a significant
predictor of interest in acquiring land as in most gravity models, together with a past colonial relationship,
although the significance of the latter vanishes when considering projects with actual production.
Regarding host country characteristics, bilateral regressions point towards a significant improvement over
unilateral regressions. They support the attractiveness of countries with large amounts of high potential
agricultural land (but not forest land) or with the value of the output that can be obtained from such land,
two variables which are highly significant throughout. For instance in regression (1) of Table 6, the
coefficient of suitable non-forest land is 0.4664, which implies that an increase by 10% of potentially
cultivable land in a host country would increase the number of projects in that country by almost 5%, all
things else being equal (dN/N=exp(0.04664)-1=0.048). Similarly, the coefficient on the yield gap is large
and significant in the regression for total demand but not for country relationships for projects under
production, suggesting that low yields and the associated opportunity to catch up or leapfrog to the
frontier increases a country‘s attractiveness as a target for land acquisition. Translating potential into
reality, however, is not as straightforward as it may appear in the abstract, partly because closing yield
gaps requires a combination of factors, not all of which are easily modifiable by investors or modified
without jeopardizing the economic viability of a venture.

16
Finally, coefficients on governance variables that are traditionally included in gravity models of
investment (Control of corruption, and Political stability) are negative though not consistently significant
suggesting that even once other factors are accounted for, investment tends to be higher in environments
with weak governance. The coefficient on host countries‘ quality of land governance, which accounts in
particular for the extent to which local rights are recognized, is highly significant and negative. For
projects in production only, the significance of coefficients on standard governance variables disappears
but the negative coefficient on land governance remains. This would imply that countries with weak
governance are not only more attractive to prospective investors but that they are also more likely to
actually have initiated production. Our data unfortunately do not provide evidence to suggest whether the
level of production is in line with development plans or if locals actually receive benefits. The significant
impact of weak governance suggested by our model could, of course, be due to the fact that this is the first
wave of a new phenomenon, transparency on investment opportunities is lacking, and investors still have
little experience of such investments. Nevertheless, concerns may be justified given the large amounts of
transferred land in some countries and the necessity to identify and close down non-viable projects and
prevent them from causing negative externalities. Unless more empirical evidence to allay such concerns
is available, calls for a more proactive international response are likely to persist.25
5. Conclusion and policy implications
While the ―land rush‖ has led to an animated debate, an overall view of the phenomenon and the drivers
underlying it has thus far been missing. Combining press reports on demand for land acquisitions with a
characterization of endowments at country level allows us to identify factors underlying demand for
agricultural land and actual projects. Dependence on food imports emerges as a strong driver of demand
for land acquisition which is more likely to be located in countries with ample supply of land that are far
from the technology frontier. While cultural affinity plays a role, weak land governance and protection of
local land rights seem to be associated with higher rather than lower levels of investment even once other
factors are controlled for. We conclude by highlighting implications from this rather surprising result.
First, while this result reinforces the importance of industry standards and vigilance at project-level, 26 it
also highlights that, if they are to be effective and if a race to the bottom is to be prevented, they may need
to be complemented with an effort to increase transparency and address land governance at the country
level. Second, given the size of the phenomenon, a global effort –ideally spearheaded by an international
25 Although agricultural investment has many properties that set it apart from other sectors, there are obvious parallels to mining and other types
of extractive industries that could provide lessons on the nature of a global response to improve transparency. 26 FAO‘s voluntary guidelines (http://www.fao.org/nr/tenure/voluntary-guidelines/en/) devote considerable space to this issue and a separate effort at formulating principles for Responsible Agricultural Investment is underway (http://www.responsibleagroinvestment.org/rai/node/256).
Institutional investors have adopted their own principles (www.unpri.org/farmlandprinciples), mirroring commodity-specific standards such as
those promoted by the roundtable on responsible palm oil. More specific guidelines include multilateral banks‘ safeguards or performance standards which have been adopted by the vast majority of financial institutions as ―Equator Principles‖.

17
institution- to document cross-national investments above a certain size and in a consistent way that
draws on national data seems urgent in order to protect rights and initiate more evidence-based dialogue
and accumulation of norms and experience. Finally, reports stressing large numbers of failed investments
have given rise to legislation or calls for limits on land purchases by foreigners in a number of countries
such as Brazil, Argentina, and Ukraine. However, if a sizeable share of relevant deals involves nationals
rather than foreigners (Deininger et al 2011), this may exacerbate rather than resolve governance
challenges by, for example, limiting competition. Instead of protectionist measures, priority efforts to
improve land governance27 -e.g. by recognizing local rights, educating right holders, and allowing their
voluntary and transparent transfer- are likely to be a more appropriate policy response.
27 Key areas of emphasis could be (i) demarcation of state land (including forests and protected areas and clarification of the rights on these lands
as well as ways in which they can be transferred to investors) and regular monitoring of new encroachment; (ii) provision of a minimum level of information (coordinates, size, projected investments, job creation, taxes and other benefits expected to local communities) to be made available
publicly in a way that facilitates third party verification; (iii) clear procedures for contract enforcement and arbitration, including the dissolution
of non-performing enterprises by any of the parties involved; (iv) education on rights and ways to enforce them before interests in acquisition materialize.
18
Table 1: Potential supply of land for rainfed cultivation (in million hectares)
Region Total area Area close to market
(<6 h travel time)
Area far from market
(>6 h travel time)
Sub-Saharan Africa 201.5 94.9 106.6
Latin America and the Caribbean 123.3 93.9 29.4
Eastern Europe and Central Asia 52.4 43.7 8.7
East and South Asia 14.3 3.3 11.0
Middle East and North Africa 3.0 2.6 0.4
Rest of World 51.0 24.6 26.4
Total 445.6 263.1 182.5
Source: Deininger et al. 2010.
Note: The figures are for currently uncultivated land that is suitable for cultivation of at least one of five key crops (wheat,
sugarcane, oil palm, maize and soybean), excluding forests and protected areas, and with a population density of less than 25
people per km2 (.25 people per hectare)
19
Table 2: Extent of large land acquisitions in select countries, 2004–09
Country Projects Area (1,000 ha) Median size (ha) Domestic share area
Cambodia 61 958 8,985 70
Ethiopia 406 1,190 700 49
Liberia 17 1,602 59,374 7
Mozambique 405 2,670 2,225 53
Nigeria 115 793 1,500 97
Sudan 132 3,965 7,980 78
Source: Country inventories from Deininger et al. 2011.

20
Figure 1: Evolution of the Commodity food price index and number of media reports on foreign land acquisitions
Source: IMF Commodity food price index and GRAIN (http://farmlandgrab.org) for press reports.
0
20
40
60
80
100
120
140
160
0
20
40
60
80
100
120
140
160
180
200
Jul-
05
Sep
-05
No
v-0
5
Jan
-06
Mar
-06
May
-06
Jul-
06
Sep
-06
No
v-0
6
Jan
-07
Mar
-07
May
-07
Jul-
07
Sep
-07
No
v-0
7
Jan
-08
Mar
-08
May
-08
Jul-
08
Sep
-08
No
v-0
8
Jan
-09
Mar
-09
May
-09
Jul-
09
Sep
-09
No
v-0
9
Jan
-10
Mar
-10
May
-10
Pre
ss r
ep
ort
s o
n la
rge
6sc
ale
lan
d a
cqu
isit
ion
Ind
ex
nu
mb
er
Commodity Food Price Index No. of press reports

21
Table 3: Historical land expansion and recent land demand expressed in media reports
Region Cultivated land area (millions of ha) Annual change (%) Land demand 2009
1961 1997 2007 1961-1997 1997-2007 Mn ha year eq.
Sub-Saharan Africa 134.6 192.2 218.5 1.60 2.63 39.7 21.8
East Asia & Pacific 183.9 235.7 262.8 1.44 2.72 8.0 4.6
Eastern Europe & Central Asia 291.5 263.6 241.7 -0.77 -2.19 4.6 n.a.
Latin America 102.6 160.9 168.0 1.62 0.71 3.2 2.2
Middle-East & North Africa 77.9 91.3 89.0 0.37 -0.23 1.4 n.a.
South Asia 197.9 212.9 213.5 0.41 0.06 0.7 2.1
North America 235.3 232.5 225.3 -0.08 -0.72 0.2 n.a.
Western Europe 99.4 86.8 83.5 -0.35 -0.32 0.0 n.a.
Oceania 34.0 42.8 46.7 0.25 0.38 0.0 0.2
World total 1,357.1 1,518.6 1,549.0 4.49 3.04 57.8 13.9
Notes: Cultivated area is land under arable or permanent crops. ‗Land demand 2009‘ refers to intended or actual land acquisitions
based on media reports over a period of 11 months (October 2008 – August 2009). The last column (‗year eq.‘) identifies this
demand in terms of the number of years using average annual expansion over the 1961-2007 period.

22
Table 4: Key descriptive statistics, overall and for origin, destination, and destination with projects
Variable
Total Origin Origin
only
Destination (a) Destination with impl.
projects only (b)
Country level variables
Total Population (mn.) 32 86 26 67
105 *
GDP per capita (USD, 2005 PPP) 11,640 18,028 60,407 6,354 *** 7,295
Value of food imports (mn. USD) 3239 8533 12,514 3,158 *** 4,440 *
Value of food exports (mn. USD) 3,180 8,844 9,217 4,052 ** 6,215 **
Food Dependence 117 12 211 -30 *** -99 **
Land use and endowment
Cultivated Land (mn. Ha) 8.7 20.2 3.9 16.5 * 26.1 ***
Non-Forest Land Suitable for Cultivation (mn. ha) 3.8 6.5 0.6 7.4 ** 12.0 ***
Forest Land Suitable for Cultivation (mn. Ha) 5.8 11.6 0.4 11.5 * 18.1 **
Suitable non-forest land w. low pop. dens. (mn.
ha) 2.0 3.4 0.0 3.9 ** 6.5 ***
Suitable forest land w. low pop. dens. (mn. ha) 4.2 8.7 0.1 8.4
13.1 *
Max potential output value on uncultivated, non-
forested and non protected land (log mn USD) 7.9 8.3 6.8 8.9 *** 9.6 ***
Max potential output value on uncultivated,
forested and non protected land (log mn USD) 7.2 7.7 5.9 8.1 *** 8.8 **
Yield gap (Percent) 0.60 0.47 0.27 0.66 *** 0.62 *
Institutional quality
***
Regulatory Quality Rank (Percent) 49.7 62.5 80.1 38.9 *** 40.4
Rule of Law Rank (Percent) 49.4 59.8 80.0 35.9 *** 37.8
Control of Corruption Rank (Percent) 49.5 58.9 80.5 37.5 *** 37.2
Political Stability & No Violence Rank (Percent) 49.2 49.5 67.5 34.2 *** 35.4
Voice & Accountability Rank (Percent) 49.4 52.2 64.2 36.7 *** 39.0
Weak Investor Protection 85.7 70.6 60 90.4 ** 87.8
Land Tenure Security Index -0.02 0.61 2.15 -0.98 *** -0.95
No. of observations (countries) 215 56 23 84
43
Notes: The table shows unweighted averages of country characteristics. It includes 215 countries of which 107 are either
investors or host countries in the period October 1, 2008 to August 31, 2009 and 33 countries are both host countries and
investors. *** denotes significance at the 1% level, ** at the 5% level, and * at the 10% level.
(a) Significance of t-test for difference between averages in destination countries and countries of origin only.
(b) Significance of t-test for difference between averages in destination countries with implemented projects and destination
countries where no project is under production.
Other notes: Food dependence is defined as the value of net food imports per inhabitant. It is positive for net importers and
negative for net exporters; Suitable non-forest land with low population density is the amount of potentially suitable land that is
neither currently used for agricultural production nor settled with more than 25 inhabitants per km2 is calculated as discussed in
the text and excludes protected areas (Source: FAO and IIASA); The value of potential output is obtained for choosing the best
culture as the market prices and yields. It is expressed in logarithm of the value in millions of dollars (Source: FAO and IIASA);
The yield gap is the difference between performance that is technically achievable and the effective yield observed (Source: FAO
and IIASA); The variables Regulatory Quality, Rule of Law, Control of Corruption, Political Stability and Absence of Violence,
and Voice and Accountability are from the Worldwide Governance Indicators database and are expressed in percentile of the
distribution of descending rank (Source: World Bank). A low value thus characterizes a country where governance is poor; The
index of weak protection of investors is the rank of the variable Strong investor protection in the Doing Business database and is
comprised between 1 and 215 (Source: International Finance Corporation, World Bank). A high value of this index reflects
situations where investors are poorly protected; The tenure security index is constructed by the French Development Agency
(AFD). This is the first projection on the axis of a Principal Component Analysis of the variables contained in the land based
Institutional Profiles (Source: Ministry of Finance and AFD). The index is interpreted as a measure of security of tenure enjoyed
by local people. A low value implies high levels of tenure insecurity.

23
Figure 2: Maximum potential value of agricultural output (in US Dollars per hectare)
Source: Deininger et al. 2011.

24
Table 5: Poisson regressions for the number of projects in a destination country
All projects
Potentially cultivable area non-forest 0.4946***
[0.121]
Potentially cultivable area forest -0.0205
[0.070]
Max. possible output value non-forest area
0.5257*** 0.5296*** 0.5122*** 0.5086***
[0.108] [0.110] [0.139] [0.140]
Max. possible output value forest area
-0.0159 -0.0405 -0.0523 -0.0658
[0.060] [0.060] [0.064] [0.064]
Yield gap 0.6033 0.9061* 1.1224** -0.2444 -0.0245
[0.416] [0.474] [0.524] [0.710] [0.696]
Land governance indicator
-0.1735** -0.1779**
[0.078] [0.081]
Weak investor protection
-0.0017
-0.0022
[0.003]
[0.003]
No. of observations 137 143 135 107 105
Pseudo R2 0.325 0.297 0.293 0.290 0.292
Projects with some production only
Potentially cultivable area non-forest 0.6876***
[0.156]
Potentially cultivable area forest -0.0083
[0.094]
Max. possible output value non-forest area
0.6840*** 0.6894*** 0.6199*** 0.6148***
[0.139] [0.145] [0.165] [0.166]
Max. possible output value forest area
-0.0435 -0.0684 -0.0606 -0.0734
[0.077] [0.079] [0.079] [0.080]
Yield gap 0.1057 0.5362 0.7641 -0.3172 -0.0872
[0.517] [0.617] [0.753] [1.003] [1.017]
Land governance indicator
-0.1422 -0.1456
[0.108] [0.109]
Weak investor protection
-0.0019
-0.0023
[0.003]
[0.003]
No. of observations 137 143 135 107 105
Pseudo R2 0.346 0.271 0.266 0.230 0.229
Notes: Variable in logs. Robust standard errors in brackets. *** denotes significance at the 1% level, ** at the 5% level, and * at
the 10% level. Constant included but not reported.

25
Table 6: Poisson regressions for the number of projects in bilateral relations
(1) (2) (3) (4) (5) (6) (7)
Bilateral variables
Distance -0.5900*** -0.6002*** -0.6165*** -0.5921*** -0.5878*** -0.5960*** -0.6171***
[0.061] [0.060] [0.060] [0.062] [0.060] [0.060] [0.059]
Colonial relationship 1.1699*** 1.1558*** 1.0550*** 1.1714*** 1.1726*** 1.1840*** 1.0545***
[0.263] [0.265] [0.221] [0.265] [0.265] [0.261] [0.220]
Investor country variables
Net food imports per inhabitant 3.3056*** 3.3913*** 3.3203*** 3.3733*** 3.3758*** 3.3843*** 3.3208***
[0.368] [0.354] [0.373] [0.357] [0.351] [0.351] [0.372]
Population 0.7817*** 0.7771*** 0.7634*** 0.7683*** 0.7726*** 0.7753*** 0.7635***
[0.048] [0.047] [0.049] [0.048] [0.047] [0.047] [0.049]
Host country variables
Food exports 0.0320 0.0345 0.0974*** 0.0203 0.0604* 0.0477 0.0984***
[0.032] [0.031] [0.037] [0.033] [0.034] [0.033] [0.035]
Suitable non-forest land 0.4664***
[0.074]
Suitable forest land 0.0320
[0.043]
Max. possible output value non-
forest area
0.5162*** 0.4830*** 0.5307*** 0.4904*** 0.4909*** 0.4846***
[0.072] [0.089] [0.074] [0.076] [0.077] [0.091]
Max. possible output value forest
area
0.0280 -0.0114 0.0050 0.0328 0.0302 -0.0118
[0.041] [0.043] [0.041] [0.040] [0.041] [0.043]
Yield gap 0.9486** 1.3042*** 0.4959 1.3590*** 0.9265** 1.0388** 0.5075
[0.376] [0.404] [0.519] [0.442] [0.472] [0.439] [0.511]
Land governance index -0.2082*** -0.2136***
[0.049] [0.059]
Weak investor protection -0.0013
[0.001]
Control of corruption (%) -0.0072*
[0.004]
Political stability (%) -0.0070* 0.0007
[0.004] [0.004]
No. of observations 25,704 26,838 20,223 25,515 26,838 26,838 20,223
Pseudo R2 0.269 0.265 0.261 0.260 0.266 0.267 0.261
Notes: Variable in logs. Robust standard errors in brackets*** denotes significance at the 1% level, ** at the 5% level, and * at
the 10% level. Constant included but not reported.

26
Table 7: Poisson regressions for the number of operating projects in bilateral relations
(1) (2) (3) (4) (5) (6) (7)
Bilateral variables
Distance -0.7253*** -0.7243*** -0.7066*** -0.7121*** -0.7140*** -0.7209*** -0.7107***
[0.097] [0.094] [0.094] [0.095] [0.091] [0.093] [0.091]
Colonial relationship 0.8934* 0.8914* 0.8718 0.9003* 0.8981* 0.9057* 0.8766
[0.530] [0.513] [0.578] [0.516] [0.513] [0.513] [0.579]
Investor country variables
Net food imports per inhabitant ($) 1.9477* 2.2305** 2.1871** 2.2658** 2.2132** 2.2243** 2.1912**
[1.080] [0.926] [0.953] [0.923] [0.923] [0.924] [0.953]
Population 0.7522*** 0.7379*** 0.7285*** 0.7388*** 0.7344*** 0.7364*** 0.7289***
[0.083] [0.083] [0.085] [0.084] [0.082] [0.083] [0.085]
Host country variables
Food exports 0.0705 0.0783 0.1318** 0.0640 0.0981 0.0864 0.1386**
[0.061] [0.059] [0.065] [0.064] [0.067] [0.062] [0.063]
Suitable non-forest land (mn ha) 0.7015***
[0.149]
Suitable forest land (mn. ha) 0.0154
[0.092]
Max. possible output value non-
forest area
0.7000*** 0.6124*** 0.7121*** 0.6769*** 0.6872*** 0.6218***
[0.126] [0.149] [0.129] [0.138] [0.132] [0.151]
Max. possible output value forest
area
-0.0251 -0.0415 -0.0441 -0.0186 -0.0251 -0.0432
[0.072] [0.077] [0.074] [0.072] [0.073] [0.078]
Yield gap 0.5036 1.1073 0.4565 1.1729 .7851 0.9373 0.5484
[0.681] [0.754] [1.002] [0.817] [0.886] [0.811] [0.983]
Land governance index
-0.1930**
-0.2296**
[0.095]
[0.117]
Weak investor protection
-0.0015
[0.003]
Control of corruption (%)
-0.0057
[0.008]
Political stability (%)
-0.0041 -0.0048
[0.006] [0.007]
No. of observations 25,704 26,838 20,223 25,515 26,848 26,838 20,223
Pseudo R2 0.254 0.231 0.217 0.228 0.231 0.231 0.218
Notes: Variable in logs. Robust standard errors in brackets. *** denotes significance at the 1% level, ** at the 5% level, and * at
the 10% level. Constant included but not reported.

27
Appendix
Table A1: Number of projects in bilateral relations (Tobit model)
(1) (2) (3) (4) (5) (6) (7)
Bilateral variables
Distance -0.7945*** -0.8322*** -0.8683*** -0.8179*** -0.8238*** -0.8298*** -0.8713***
[0.090] [0.090] [0.098] [0.093] [0.090] [0.090] [0.097]
Colonial relationship 1.7922*** 1.7831*** 1.7156*** 1.8470*** 1.8054*** 1.7942*** 1.7244***
[0.367] [0.372] [0.370] [0.376] [0.373] [0.372] [0.370]
Investor country variables
Net food imports per inhabitant 3.1667*** 3.3265*** 3.1637*** 3.3112*** 3.2892*** 3.3007*** 3.1752***
[0.634] [0.638] [0.684] [0.644] [0.636] [0.636] [0.681]
Population 0.9259*** 0.9302*** 0.9272*** 0.9232*** 0.9252*** 0.9278*** 0.9281***
[0.074] [0.075] [0.078] [0.076] [0.075] [0.075] [0.078]
Host country variables
Food exports 0.0102 0.0109 0.1023** -0.0132 0.0413 0.0203 0.1117**
[0.042] [0.041] [0.049] [0.044] [0.046] [0.043] [0.048]
Suitable non-forest land 0.5331***
[0.080]
Suitable forest land 0.0764
[0.052]
Max. possible output value non-
forest area
0.6694*** 0.6271*** 0.6940*** 0.6499*** 0.6529*** 0.6320***
[0.082] [0.099] [0.086] [0.085] [0.086] [0.101]
Max. possible output value forest
area
0.0513 0.0006 0.0166 0.0511 0.0520 -0.0014
[0.054] [0.055] [0.054] [0.053] [0.053] [0.056]
Yield gap 1.0761** 1.3286*** 0.4109 1.3805*** 0.9686* 1.0886** 0.5074
[0.495] [0.501] [0.632] [0.533] [0.553] [0.532] [0.617]
Land governance index -0.2618*** -0.3005***
[0.061] [0.073]
Weak investor protection -0.0016
[0.002]
Control of corruption (%) -0.0077*
[0.005]
Political stability (%) -0.0061 0.0049
[0.004] [0.005]
No. of observations 25,704 26,838 20,223 25,515 26,838 26,838 20,223
Log pseudo-likelihood -1701 -1735 -1558 -1704 -1733 -1734 -1558
Notes: Variable in logs. Robust standard errors in brackets. *** denotes significance at the 1% level, ** at the 5% level, and * at
the 10% level. Constant included but not reported.
28
Table A2: Number of operating projects in bilateral relations (Tobit model)
(1) (2) (3) (4) (5) (6) (7)
Bilateral variables
Distance -0.9045*** -0.8857*** -0.8864*** -0.8712*** -0.8746*** -0.8832*** -0.8910***
[0.120] [0.115] [0.122] [0.117] [0.115] [0.115] [0.122]
Colonial relationship 1.0712* 1.0008* 0.8782 1.0157* 1.0175* 1.0047* 0.9063
[0.604] [0.598] [0.645] [0.603] [0.597] [0.596] [0.647]
Investor country variables
Net food imports per inhabitant ($) 1.5390 1.8808** 1.7706* 1.9251** 1.8179* 1.8404* 1.8030*
[1.018] [0.959] [0.964] [0.959] [0.956] [0.958] [0.951]
Population 0.7674*** 0.7406*** 0.7361*** 0.7422*** 0.7343*** 0.7381*** 0.7381***
[0.094] [0.095] [0.098] [0.096] [0.094] [0.095] [0.097]
Host country variables
Food exports 0.0497 0.0835 0.1684** 0.0571 0.1259* 0.0970 0.1829**
[0.064] [0.066] [0.075] [0.068] [0.073] [0.069] [0.075]
Suitable non-forest land (mn ha) 0.6763***
[0.150]
Suitable forest land (mn. ha) 0.0670
[0.094]
Max. possible output value non-
forest area
0.6785*** 0.5651*** 0.7009*** 0.6469*** 0.6577*** 0.5768***
[0.128] [0.152] [0.130] [0.137] [0.136] [0.155]
Max. possible output value forest
area
-0.0513 -0.0612 -0.0795 -0.0436 -0.0480 -0.0677
[0.077] [0.076] [0.076] [0.074] [0.075] [0.079]
Yield gap 0.1034 0.5950 -0.4786 0.6611 0.0905 0.2921 -0.3292
[0.735] [0.719] [0.928] [0.781] [0.832] [0.797] [0.915]
Land governance index
-0.3112***
-0.3730***
[0.094]
[0.109]
Weak investor protection
-0.0026
[0.003]
Control of corruption (%)
-0.0104
[0.007]
Political stability (%)
-0.0074 0.0078
[0.007] [0.007]
No. of observations 25,704 26,838 20,223 25,515 26,848 26,838 20,223
Log pseudo-likelihood -503.8 -539.9 -513.4 -532.9 -538.5 -539.1 -512.8
Notes: Variable in logs. Robust standard errors in brackets. *** denotes significance at the 1% level, ** at the 5% level, and * at
the 10% level. Constant included but not reported.

29
References:
Alfaro, L., S. Kalemh-Ozcan and V. Volosovych. 2008. "Why doesn't capital flow from rich to poor countries? An empirical
investigation." Review of Economics and Statistics 90 (2): 347-68.
Angrist, J. D. and A. D. Kugler. 2008. "Rural windfall or a new resource curse? Coca, income, and civil conflict in Colombia."
Review of Economics and Statistics 90 (2): 191-215.
Arrunada, B. 2007. "Pitfalls to Avoid When Measuring Institutions: Is Doing Business Damaging Business?" Journal of
Comparative Economics 35 (4): 729-47.
Banerjee, A. and L. Iyer. 2005. "History, Institutions, and Economic Performance: The Legacy of Colonial Land Tenure Systems
in India." American Economic Review 95 (4): 1190-213.
Benassy-Quere, A., M. Coupet and T. Mayer. 2007. "Institutional determinants of foreign direct investment." World Economy 30
(5): 764-82.
Bhattacharyya, S. and R. Hodler. 2010. "Natural resources, democracy and corruption." European Economic Review 54 (4): 608-
21.
Binswanger, H. P., K. Deininger and G. Feder. 1995. "Power, Distortions, Revolt and Reform in Agricultural Land Relations."
Handbook of development economics 3B 2659-772.
Borensztein, E., J. De Gregorio and J. W. Lee. 1998. "How does foreign direct investment affect economic growth?" Journal of
International Economics 45 (1): 115-35.
Brockett, C. D. 1988. Land, power and poverty: agrarian transformation and political conflict in Central America. Boston:
Unwin Hyman.
Cabrales, A. and E. Hauk. 2011. "The Quality of Political Institutions and the Curse of Natural Resources." Economic Journal
121 (551): 58-88.
Calvo, G. A., L. Leiderman and C. M. Reinhart. 1996. "Inflows of capital to developing countries in the 1990s." Journal of
Economic Perspectives 10 (2): 123-39.
Collier, P. 2008. "The Politics of Hunger How Illusion and Greed Fan the Food Crisis." Foreign Affairs 87 (6): 6
de Janvry, A. and E. Sadoulet. 2010. "Agricultural Growth and Poverty Reduction: Additional Evidence." World Bank Research
Observer 25 (1): 1-20.
De Schutter, O. 2011. "The Green Rush: The Global Race for Farmland and the Rights of Land Users." Harvard International
Law Journal 52 (2): 503-59.
Deininger, K. 2003. Land Policies for Growth and Poverty Reduction. A World Bank Policy Research Report. Oxford and New
York: World Bank and Oxford University Press.
Deininger, K. and D. Byerlee. 2011. "The rise of large farms in land abundant countries: Do they have a future?" World
Development forthcoming.
Deininger, K., D. Byerlee, J. Lindsay, A. Norton, H. Selod and M. Stickler. 2011a. Rising global interest in farmland: Can it
yield sustainable and equitable benefits? Washington, D.C.: World Bank.
Deininger, K. and G. Feder. 2001. "Land Institutions and Land Markets." Handbook of Agricultural Economics (B.Gardner and
G.Raussser, Eds) 288-331.
Deininger, K., H. Selod and A. Burns. 2011b. The Land Governance Assessment Framework: Identifying and monitoring good
practice in the land sector. Washington, D.C.: World Bank.
Drache, H. M. 1964. "The day of the bonanza; a history of bonanza farming in the Red River Valley of the North." . Fargo, ND:
Institute for Regional Studies.
Fargione, J., J. Hill, D. Tilman, S. Polasky and P. Hawthorne. 2008. "Land clearing and the biofuel carbon debt." Science 319
(5867): 1235-8.
Fauvarque-Cosson, B. and A. J. Kerhuel. 2009. "Is Law an Economic Contest? French Reactions to the Doing Business World
Bank Reports and Economic Analysis of the Law." American Journal of Comparative Law 57 (4): 811-29.
Fischer, G., H. v. Velthuizen, M. Shah and F. Nachtergaele. 2002. Global agro-ecological assessment for agriculture in the 21st
century: Methodology and results. Laxenburg and Rome: IIASA and FAO.
Fischer, G. and Shah, M. 2010. ― Farmland Investments and Food Security, Statistical Annex‖, Laxenburg, Austria, Report
prepared under World Bank IIASA contract - Lessons for the large-scale acquisition of land from a agricultural land use analysis.
30
Funk, M. 2010. "Will global warming, overpopulation, floods, droughts and food riots make this man rich? Meet the new
capitalists of chaos." Rolling Stone 21 62-6.
Grandin, G. 2009. Fordlandia: The Rise and Fall of Henry Ford's Forgotten Jungle City. New York: Metropolitan Books.
Hausmann, R., F. Sturzenegger, A. Sibert and C. Tille. 2007. "The missing dark matter in the wealth of nations and its
implications for global imbalances." Economic Policy (51): 471-+.
Helpman, E. 1984. "A Simple Theory of International-Trade with Multinational-Corporations." Journal of Political Economy 92
(3): 451-71.
Hernandez, M. 2010. "Establishing a framework for transferring public land: Peru's experience." . Washington DC: Paper
presented at the Annual Bank Conference on Land Policy and Administration, April 26 and 27, 2010.
Iyer, L. 2010. "Direct Versus Indirect Colonial Rule in India: Long-Term Consequences." Review of Economics and Statistics 92
(4): 693-713.
Kaufmann, D., A. Kraay and M. Mastruzzi. 2004. "Governance matters III: Governance indicators for 1996, 1998, 2000, and
2002." World Bank Economic Review 18 (2): 253-87.
Koh, L. P. and D. S. Wilcove. 2008. "Is oil palm agriculture really destroying tropical biodiversity." Conservation Letters 1 (1):
60-4.
Libecap, G. D. and D. Lueck. 2011. "The Demarcation of Land and the Role of Coordinating Property Institutions." Journal of
Political Economy 119 (3): 426-67.
Lipton, M. 2009. Land Reform in Developing Countries: Property Rights and property Wrongs. New York: Routledge (or Taylor
and Francis).
Loayza, N. V. and C. Raddatz. 2010. "The composition of growth matters for poverty alleviation." Journal of Development
Economics 93 (1): 137-51.
Lucas, R. E. 1990. "Why Doesnt Capital Flow from Rich to Poor Countries." American Economic Review 80 (2): 92-6.
Markusen, J. R. and A. J. Venables. 1998. "Multinational firms and the new trade theory." Journal of International Economics 46
(2): 183-203.
Markusen, J. R. and A. J. Venables. 2000. "The theory of endowment, intra-industry and multi-national trade." Journal of
International Economics 52 (2): 209-34.
Martin, W. and C. S. Pham. 2011. "Estimating the gravity model when zero trade flows are frequent." Policy Research Working
Paper. Washington DC: World Bank.
Morales Olmos, V. 2007. The economic impact of the forest sector in Uruguay. Athens, GA: University of Georgia.
Nugent, J. B. and J. A. Robinson. 2010. "Are Factor Endowments Fate?" Revista de Historia Economica 28 (1): 45-82.
Oechslin, M. 2010. "Government Revenues and Economic Growth in Weakly Institutionalised States." Economic Journal 120
(545): 631-50.
Prasad, E., K. Rogoff, S. J. Wei and A. Kose. 2007. "Financial globalization, growth, and volatility in developing countries." In
Harrison, A., ed., Globalization and Poverty. Cambridge, MA: National Bureau of Economic Research.
Pacheco, P. and R. Poccard Chapuis. 2009. "Cattle ranching development in the Brazilian Amazon: Emerging trends from
increasing integration with markets." . Bogor, Indonesia: Center for International Forestry Research.
Regunaga, M. 2010. "The soybean chain in Argentina." Implications of the organization of the commodity production and
processing industry case studies. Washington DC: World Bank, Latin America and the Caribbean Chief Economist Office.
Ramankutty, N., A. Evan, D. Monfreda and J. Foley. 2008. "Farming the planet: Geographic distribution of agricultural lands in
the year 2000." Global Biogeochemical Cycles 22 (3): 1-19.
Sawant, R. J. 2010. "The economics of large-scale infrastructure FDI: The case of project finance." Journal of International
Business Studies 41 (6): 1036-55.
Schnitzer, M. 1999. "Expropriation and control rights: A dynamic model of foreign direct investment." International Journal of
Industrial Organization 17 (8): 1113-37.
Schnitzer, M. 2002. "Debt v. foreign direct investment: The impact of sovereign risk on the structure of international capital
flows." Economica 69 (273): 41-67.
Shleifer, A. and D. Wolfenzon. 2002. "Investor protection and equity markets." Journal of Financial Economics 66 (1): 3-27.

31
Silva, J. M. C. S. and S. Tenreyro. 2006. "The log of gravity." Review of Economics and Statistics 88 (4): 641-58.
Vollrath, D. 2009. "The dual economy in long-run development." Journal of Economic Growth 14 (4): 287-312.
Wei, S. J. 2000. "Local corruption and global capital flows." Brookings Papers on Economic Activity (2): 303-54.
World Bank. 2007. Agriculture for Development: World Development Report 2008. Washington, D.C.: World Bank and Oxford
University Press.
World Bank. 2009. "Awakening Africa's sleeping giant: Prospects for competitive commercial agriclulture in the Guinea
Savannah zone and beyond." . Washington DC: The World Bank.
Young, A. 2000. "How much spare land exisits?" Bulletin of the International Union of Soil Sciences 97 (1): 51-5.
Zoomers, A. 2010. "Globalisation and the foreignisation of space: seven processes driving the current global land grab." Journal
of Peasant Studies 37 (2): 429-47.
Recommended