“WHY CAN’T YOU SIT STILL?:” HYPERACTIVITY AND SCHOOLING OUTCOMES FOR CANADIAN BROTHERS AND SISTERS
Kelly Chen, Nicole Fortin, Philip Oreopoulos and Shelley Phipps

This research is being conducted as part of the Canadian Institute for Advanced Research (CIFAR) Programme on Social Interactions, Identity and Well-Being
We thank CIFAR for funding support and Heather Hobson of the Atlantic Research Data Centre for vetting our output

Motivation
Young women now constitute the majority of undergraduates on most Canadian campuses
Young women have caught up with and surpassed young men in terms of educational attainment In 2008, 36.5 percent of Canadian
women aged 25 to 29 had a university degree compared to 24.1 percent of young men (Drolet, 2011)

Research Questions
What are the roots of this phenomenon?
Are gender differences in educational outcomes apparent from the beginning?
If gender differences already evident for young children, why is this so?
Could a greater tendency to hyperactivity for boys be part of the story?
Conceptualizing “Educational Outcomes”
Test scores important, not the full story
Also important is the development of an identity as a student (Akerlof and Kranton, 2000; 2010) Attitudes toward school? Liking for school? Aspirations?
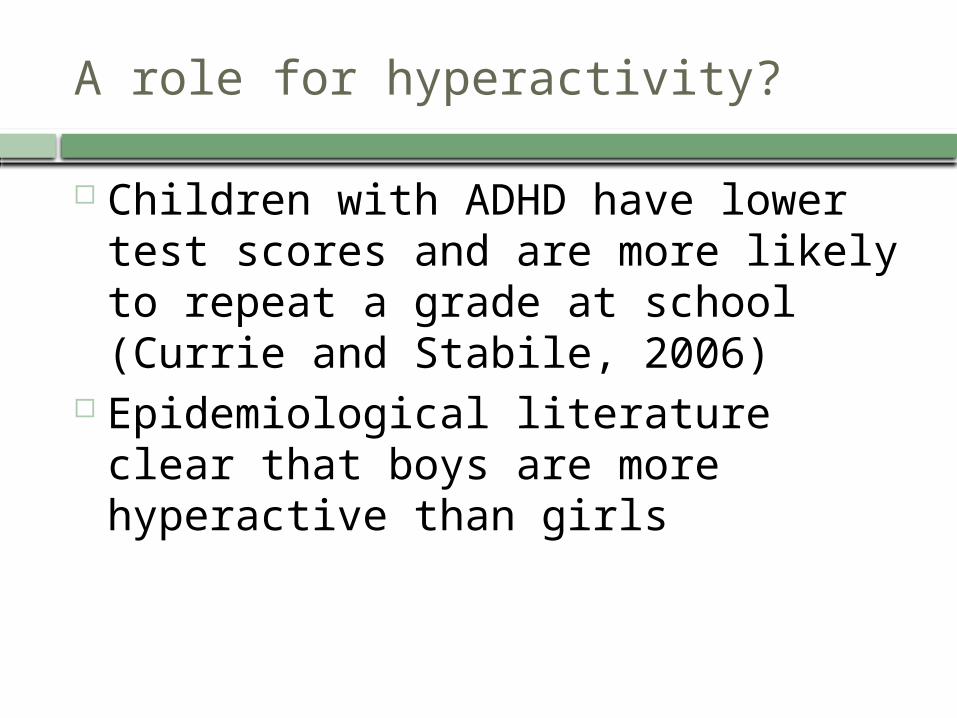
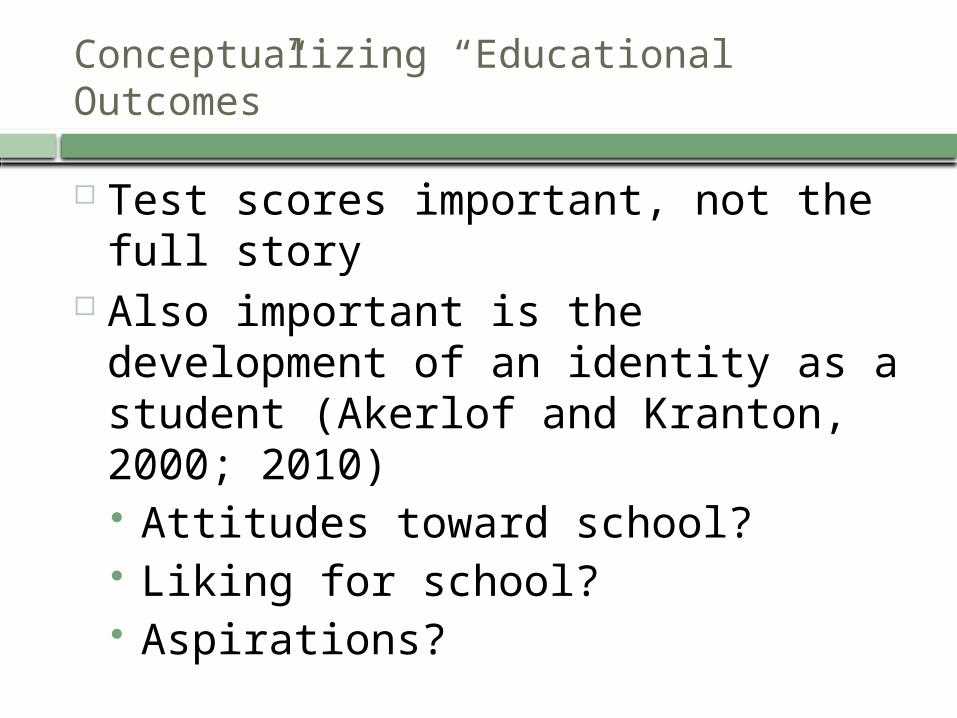
A role for hyperactivity?
Children with ADHD have lower test scores and are more likely to repeat a grade at school (Currie and Stabile, 2006)
Epidemiological literature clear that boys are more hyperactive than girls
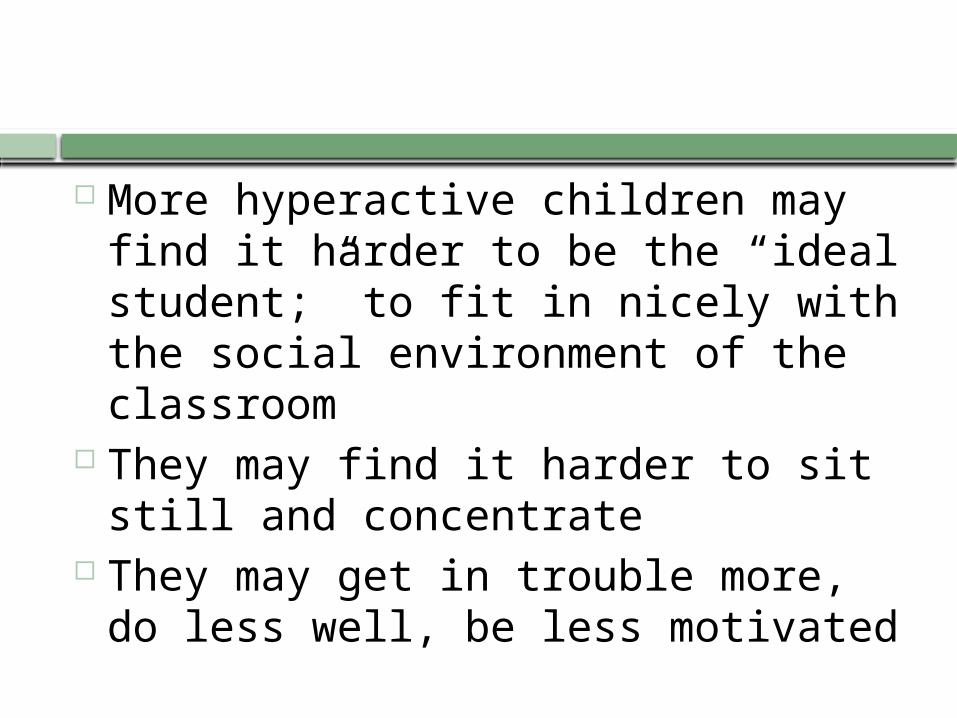
More hyperactive children may find it harder to be the “ideal student;” to fit in nicely with the social environment of the classroom
They may find it harder to sit still and concentrate
They may get in trouble more, do less well, be less motivated
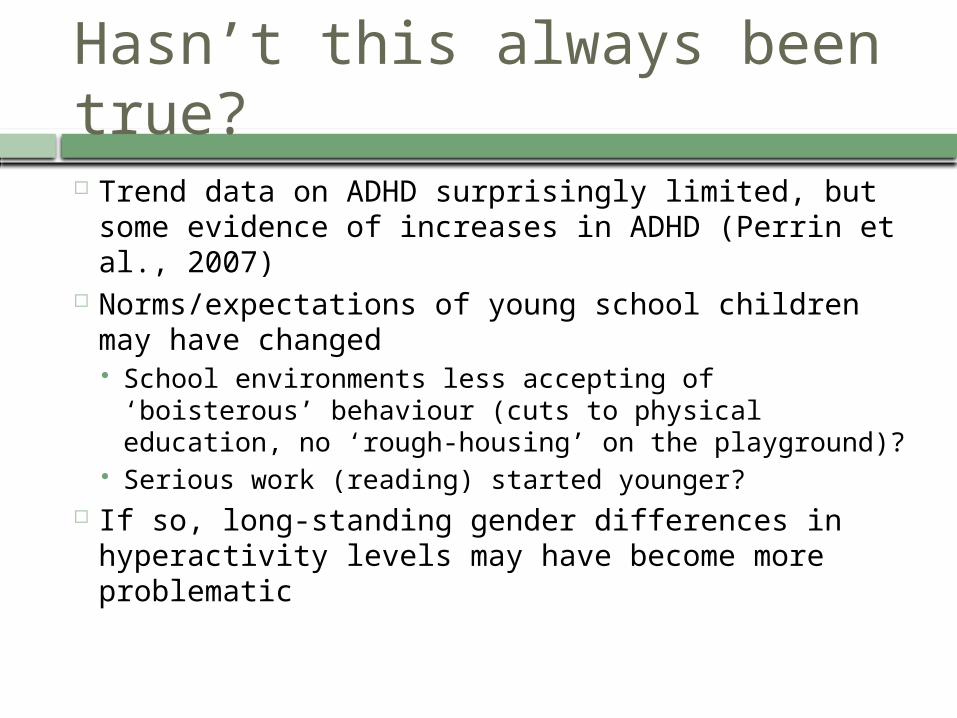
Hasn’t this always been true? Trend data on ADHD surprisingly limited, but
some evidence of increases in ADHD (Perrin et al., 2007)
Norms/expectations of young school children may have changed School environments less accepting of ‘boisterous’
behaviour (cuts to physical education, no ‘rough-housing’ on the playground)?
Serious work (reading) started younger? If so, long-standing gender differences in
hyperactivity levels may have become more problematic
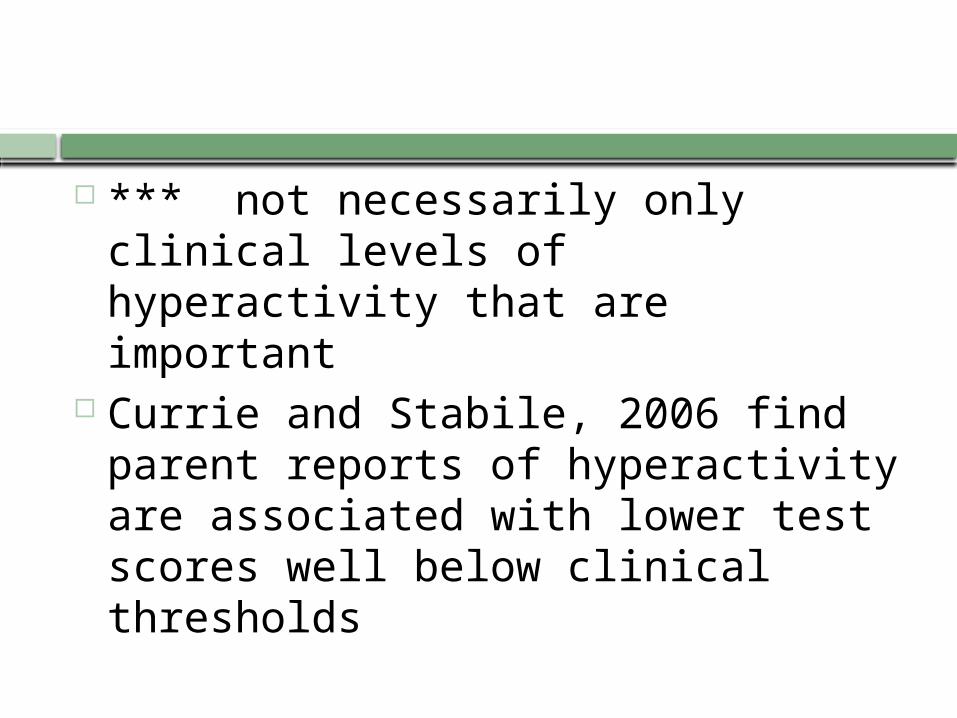
*** not necessarily only clinical levels of hyperactivity that are important
Currie and Stabile, 2006 find parent reports of hyperactivity are associated with lower test scores well below clinical thresholds

Research Strategy
Test for gender differences in test scores plus parent assessments of over-all achievement and motivation for Canadian children aged 6 through 11
Use sibling difference models (to control for family background)
Include index of parent-reported hyperactive symptoms to test hypothesis that hyperactivity of boys helps explain gender differences
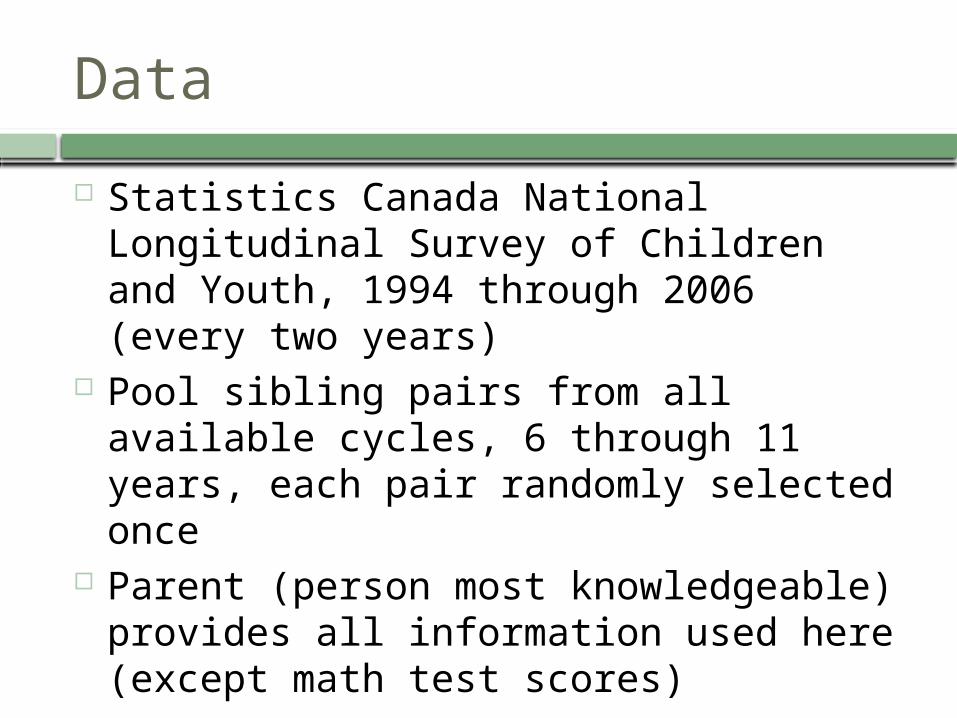
Data
Statistics Canada National Longitudinal Survey of Children and Youth, 1994 through 2006 (every two years)
Pool sibling pairs from all available cycles, 6 through 11 years, each pair randomly selected once
Parent (person most knowledgeable) provides all information used here (except math test scores)
Parent’s Assessment of Child’s Liking for School
Question: “With regard to how he/she feels about school, how often does he/she look forward to going to school?” Almost never, Rarely, Sometimes,
Often, Almost Always
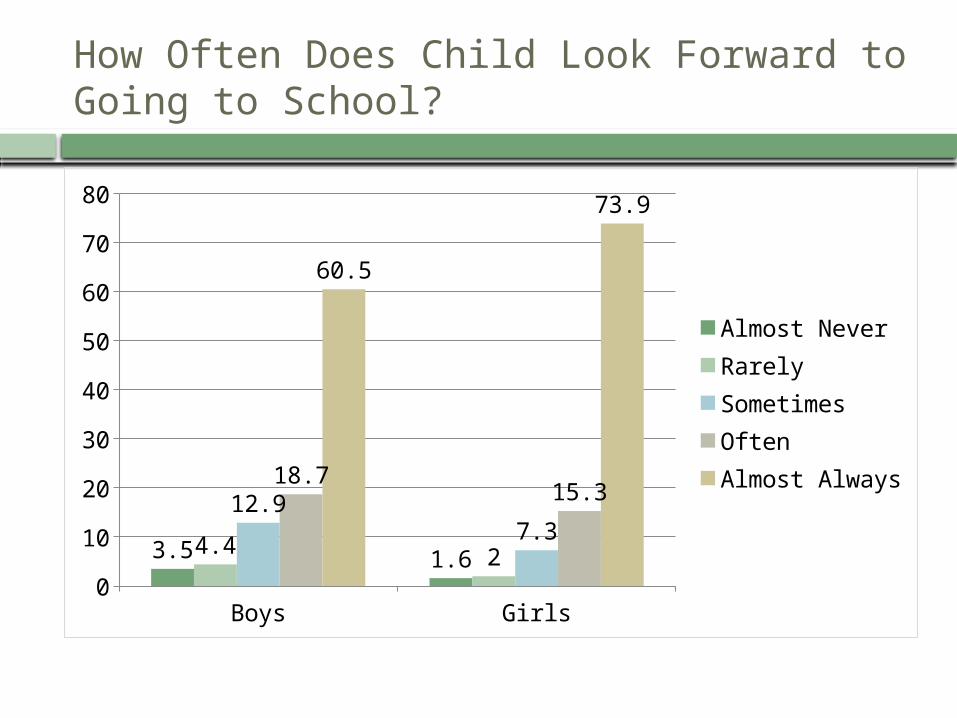
How Often Does Child Look Forward to Going to School?
Boys Girls0
10
20
30
40
50
60
70
80
3.5 1.64.4 2
12.97.3
18.715.3
60.5
73.9
Almost Never RarelySometimesOftenAlmost Always

Relative Liking for School of Brothers Compared to Sisters
Brother Likes School Less
Same Liking for School
Sister Likes School Less
0
10
20
30
40
50
60
32.3
55.2
12.5
Parent’s Assessment of Child’s Over-all School Performance
Question: “Based on your knowledge of his schoolwork, including his/her report cards, How is he doing overall?” Very poorly, poorly, Average, Well,
Very well
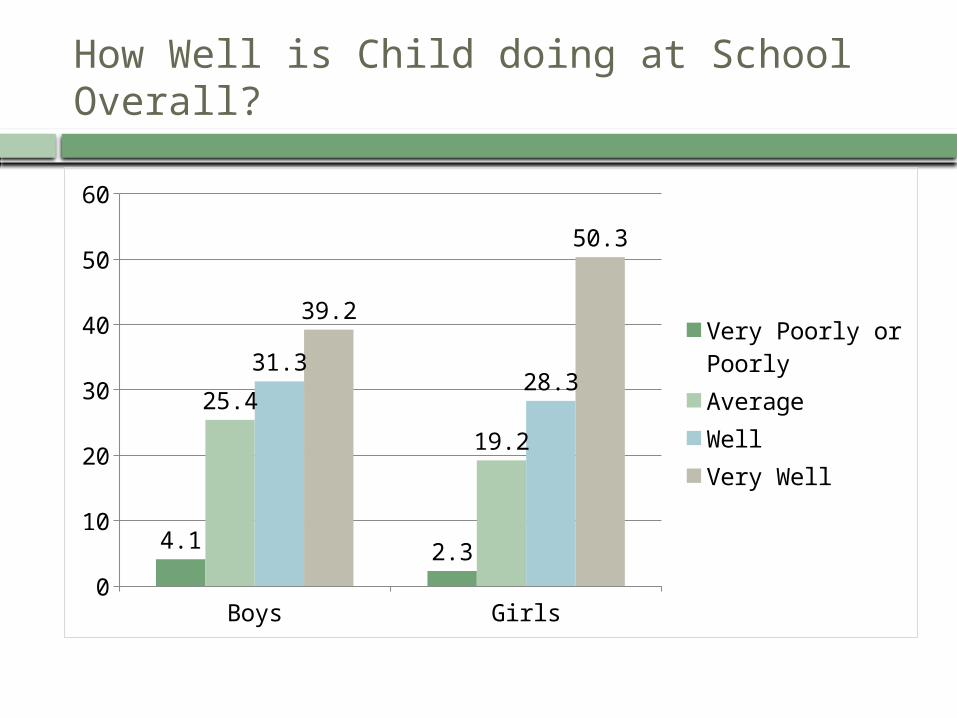
How Well is Child doing at School Overall?
Boys Girls0
10
20
30
40
50
60
4.1 2.3
25.4
19.2
31.328.3
39.2
50.3
Very Poorly or PoorlyAverageWellVery Well

Relative Over-all Success at School of Brothers Compared to Sisters
Brother Worse Same Sister Worse0
5
10
15
20
25
30
35
40
45
38.741.9
19.4
Parental Expectations for Child’s Future Education
Question: “How far do you hope this child will go in school?” High School or Less Some Post-Secondary University
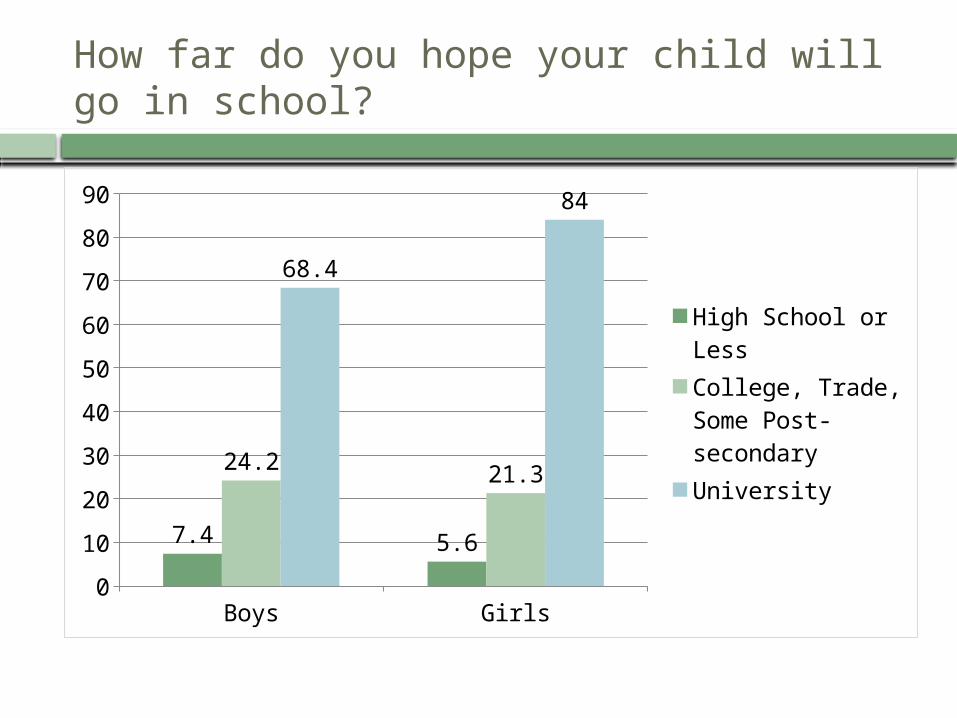
How far do you hope your child will go in school?
Boys Girls0
10
20
30
40
50
60
70
80
90
7.4 5.6
24.2 21.3
68.4
84
High School or LessCollege, Trade, Some Post-secondaryUniversity
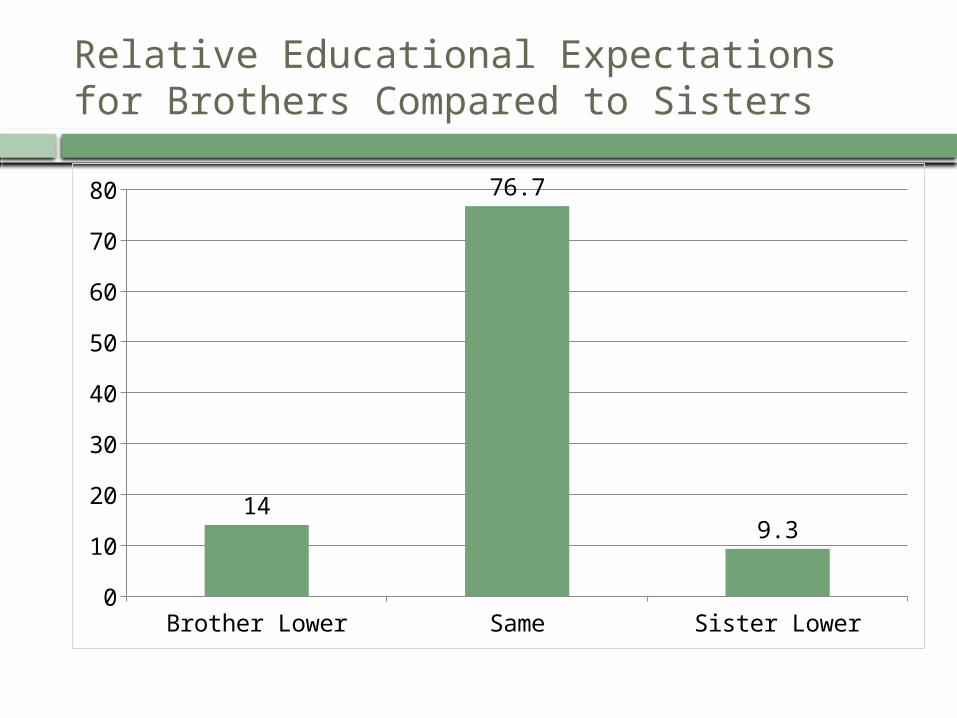
Relative Educational Expectations for Brothers Compared to Sisters
Brother Lower Same Sister Lower0
10
20
30
40
50
60
70
80
14
76.7
9.3
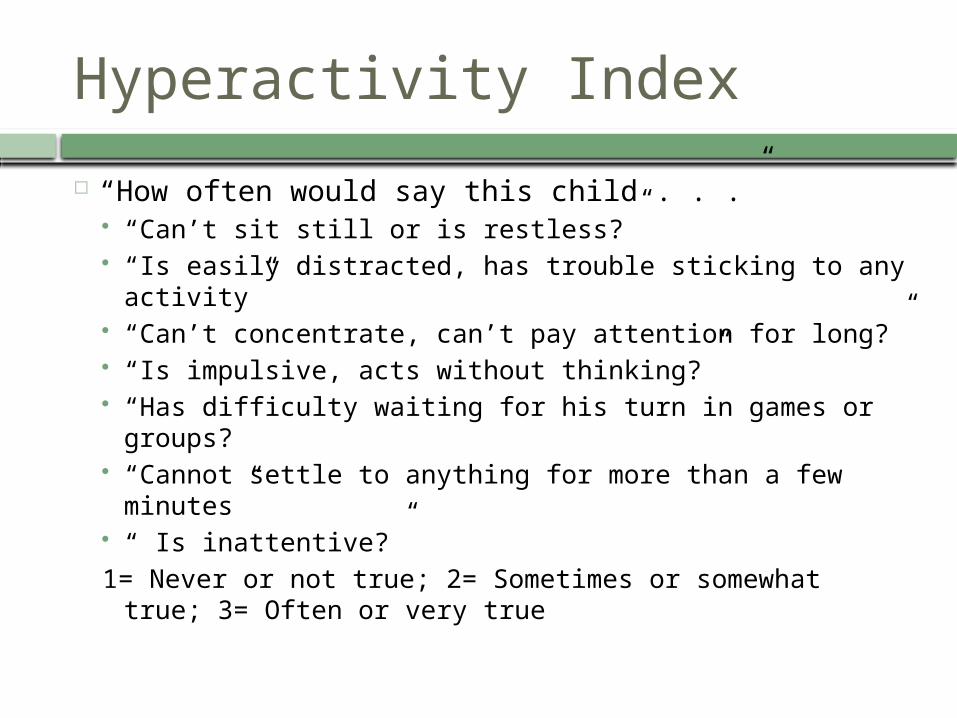
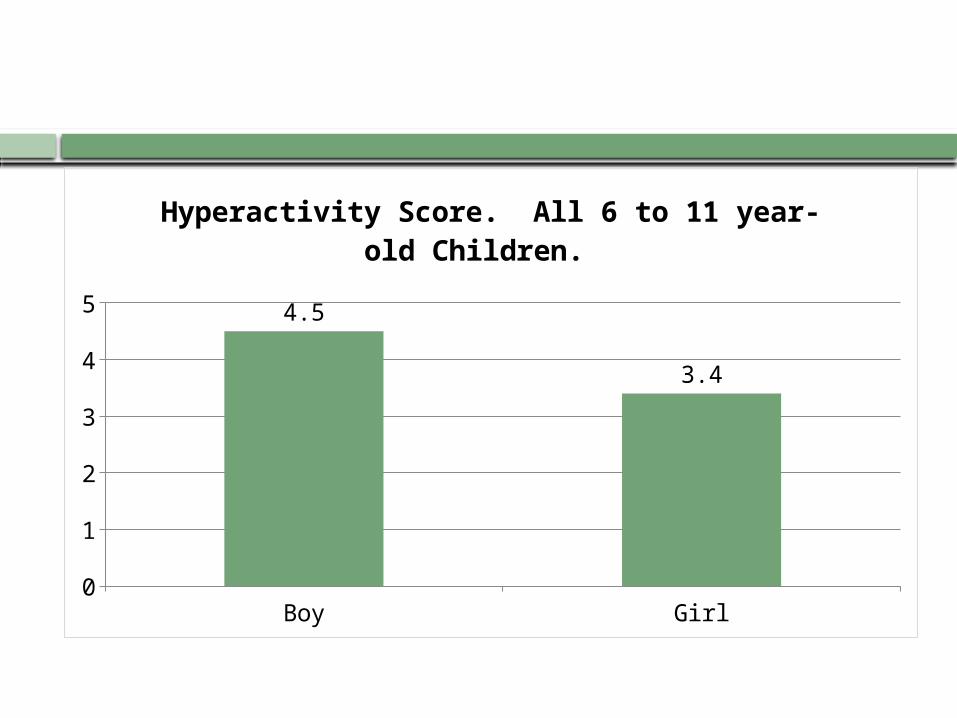
Hyperactivity Index
“How often would say this child . . .” “Can’t sit still or is restless?” “Is easily distracted, has trouble sticking to any
activity” “Can’t concentrate, can’t pay attention for long?” “Is impulsive, acts without thinking?” “Has difficulty waiting for his turn in games or groups? “Cannot settle to anything for more than a few
minutes” “ Is inattentive?”1= Never or not true; 2= Sometimes or somewhat true;
3= Often or very true

Construction of Score
Add for all items Score ranges from 0 to 14, with high
score indicating highest level of hyperactivity
Mean for sample = 4 Children ‘on ritalin’ have mean score =
9.4
Boy Girl0
0.51
1.52
2.53
3.54
4.55 4.5
3.4
Hyperactivity Score. All 6 to 11 year-old Children.
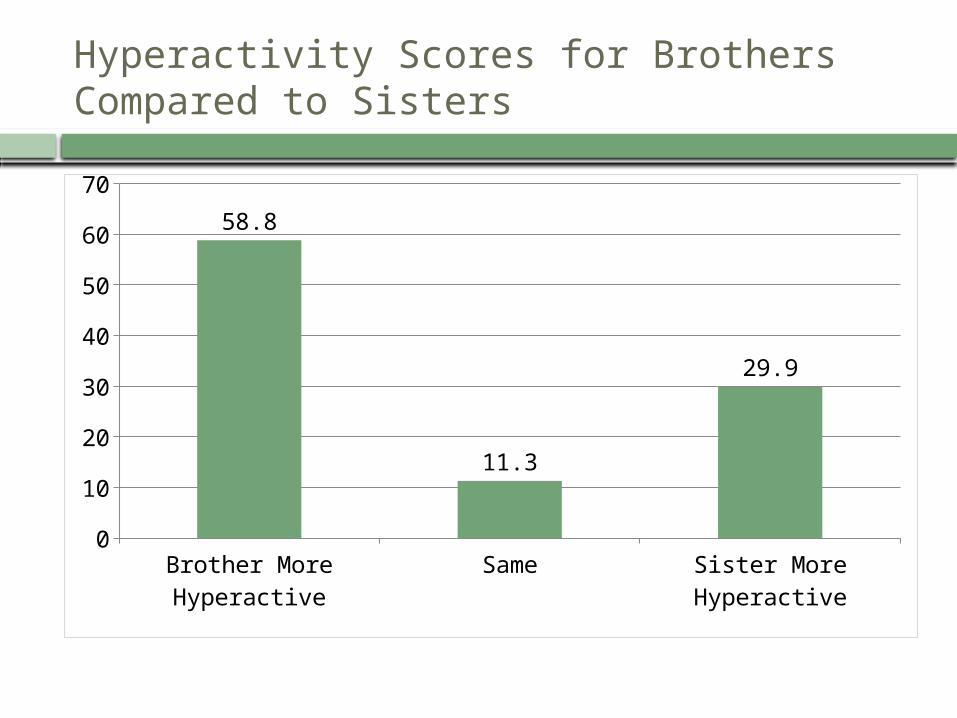
Hyperactivity Scores for Brothers Compared to Sisters
Brother More Hyperactive Same Sister More Hyperactive0
10
20
30
40
50
60
70
58.8
11.3
29.9
0.0
5.1
.15
.2K
ern
el D
ens
ity
0 5 10 15Hyperactivity Scores
Boy Girl
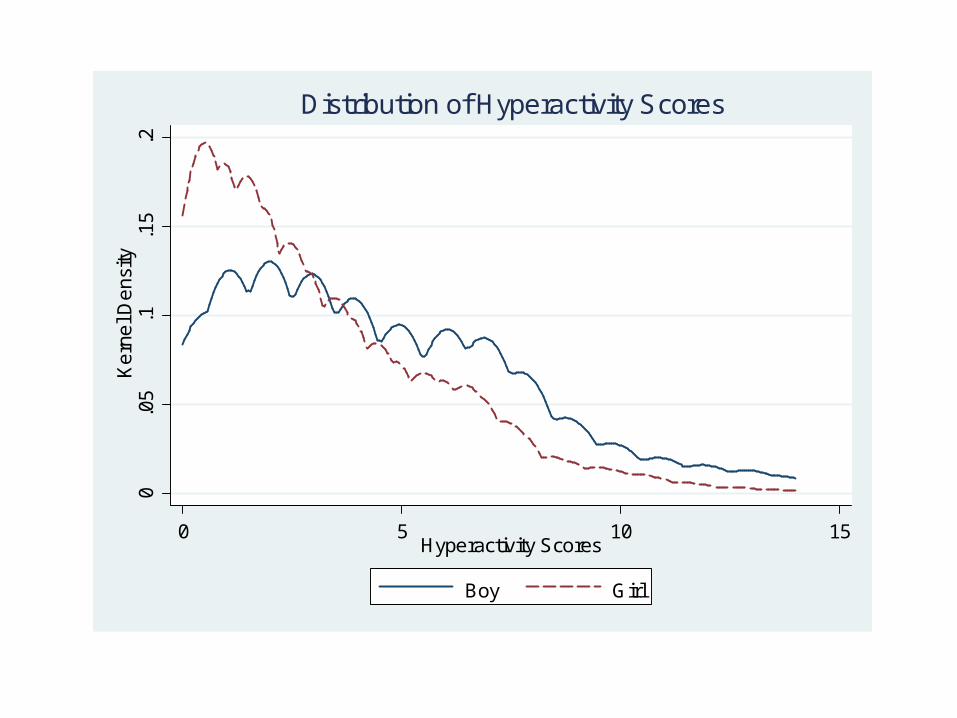
Distribution of Hyperactivity Scores

Estimation. Sibling Fixed Effects Models
To control for permanent, unobservable differences in family background
Yif = a + b1 BOYif + b2 HYPERif + λf + gXif + eif
Xif includes only variables that differ between siblings (e.g., age in months, ‘older child,’ health status and cycle)

Sibling Fixed Effects. Liking for School.
Boy -0.339***(0.027)
-0.331***(0.027)
-0.253***(0.027)
Hyperactivity Score
-0.051***(0.005)
+Covariates yes Yes
Cycle Dummies included in all regressions. Covariates: Child’s Age in Months, Child Health, ‘Oldest Child’ Dummy
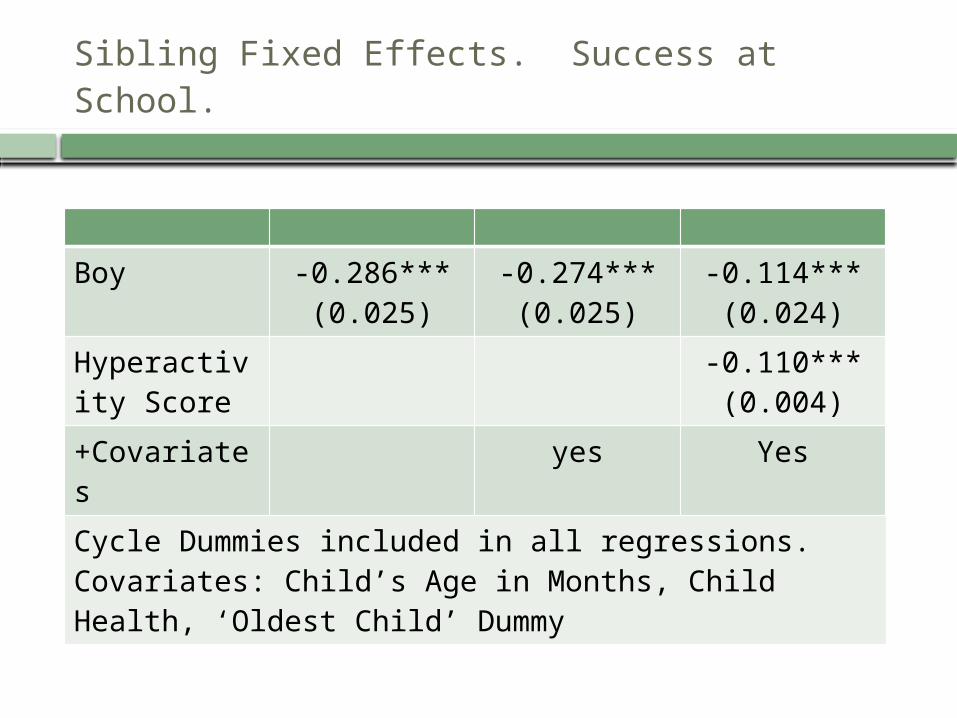
Sibling Fixed Effects. Success at School.
Boy -0.286***(0.025)
-0.274***(0.025)
-0.114***(0.024)
Hyperactivity Score
-0.110***(0.004)
+Covariates yes Yes
Cycle Dummies included in all regressions. Covariates: Child’s Age in Months, Child Health, ‘Oldest Child’ Dummy
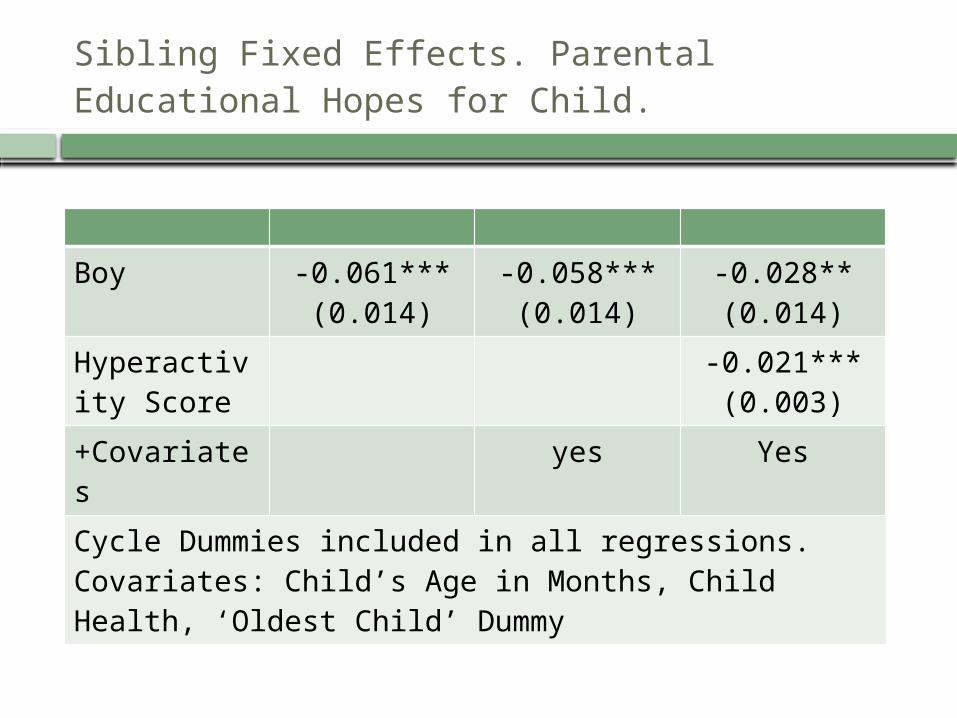
Sibling Fixed Effects. Parental Educational Hopes for Child.
Boy -0.061***(0.014)
-0.058***(0.014)
-0.028**(0.014)
Hyperactivity Score
-0.021***(0.003)
+Covariates yes Yes
Cycle Dummies included in all regressions. Covariates: Child’s Age in Months, Child Health, ‘Oldest Child’ Dummy
Sensitivity Analyses
Use parent report of ‘on ritalin’ rather than hyperactivity score (1.1% of girls; 4.1% of boys)
Use dummy indicator of ‘top decile’ of hyperactivity score
Both highly statistically significant themselves but have less impact on estimated size of ‘boy’ coefficient than full score, suggesting it isn’t just ‘clinical’ hyperactivity than helps explain the gender difference
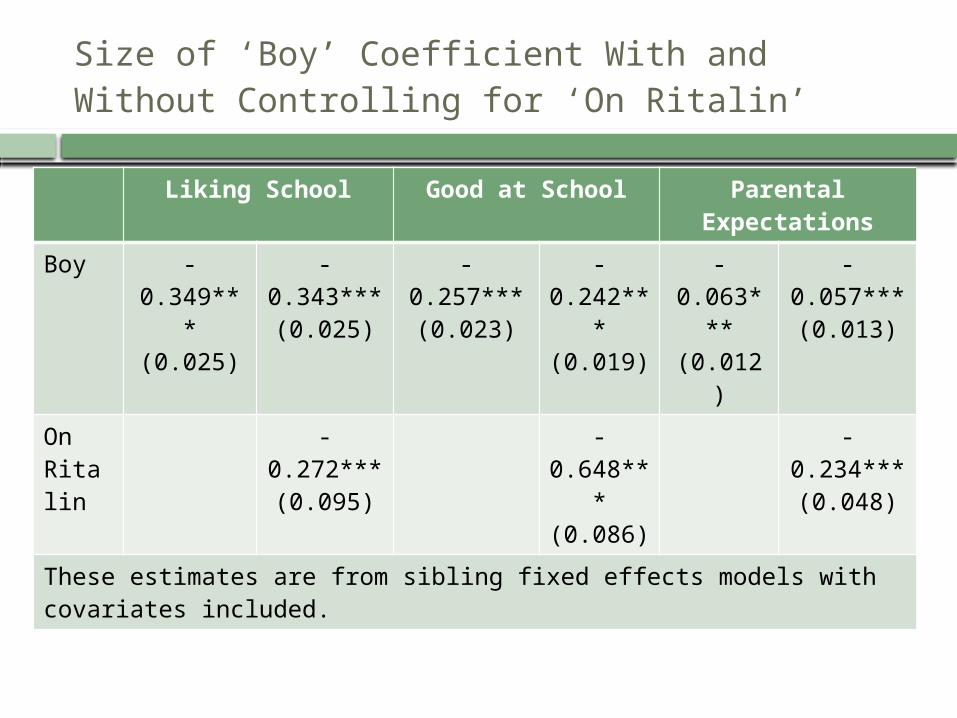
Size of ‘Boy’ Coefficient With and Without Controlling for ‘On Ritalin’
Liking School Good at School Parental Expectations
Boy -0.349***(0.025)
-0.343***(0.025)
-0.257***(0.023)
-0.242**
*(0.019)
-0.063**
*(0.012)
-0.057***(0.013)
On Ritalin
-0.272***(0.095)
-0.648**
*(0.086)
-0.234***(0.048)
These estimates are from sibling fixed effects models with covariates included.
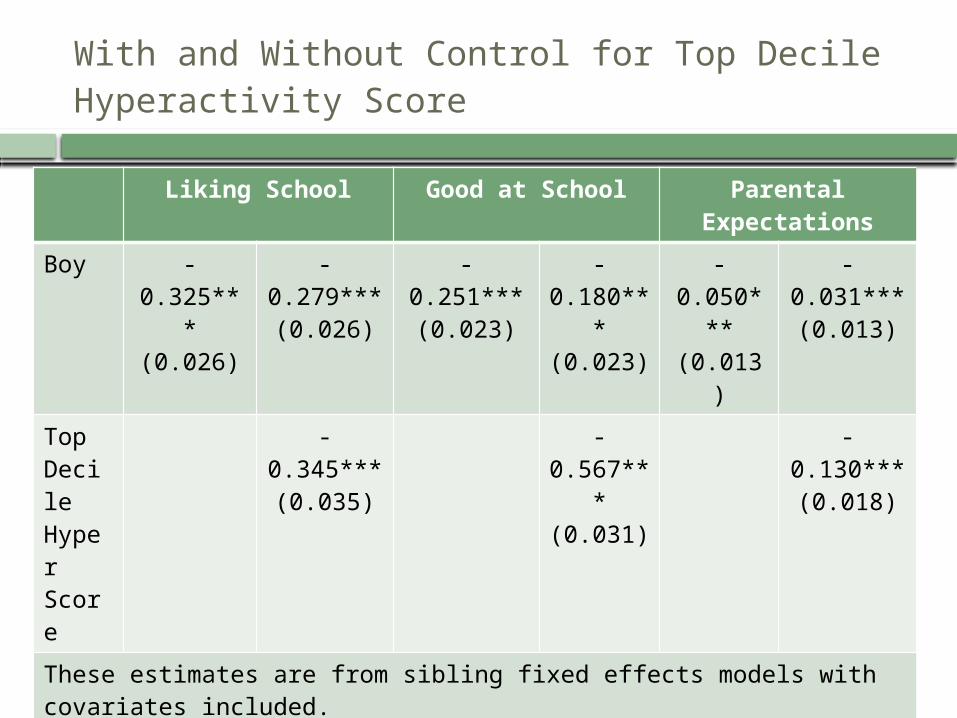
With and Without Control for Top Decile Hyperactivity Score
Liking School Good at School Parental Expectations
Boy -0.325***(0.026)
-0.279***(0.026)
-0.251***(0.023)
-0.180**
*(0.023)
-0.050**
*(0.013)
-0.031***(0.013)
Top Decile Hyper Score
-0.345***(0.035)
-0.567**
*(0.031)
-0.130***(0.018)
These estimates are from sibling fixed effects models with covariates included.
Conclusions
Using parent reports, boys like school less (brothers like school less well than sisters); boys perform less well; boys are not expected to complete as high levels of education
Hyperactivity scores are negatively associated with these outcomes
When hyperactivity is included as a regressor in sibling fixed effects, the size of ‘boy’ coefficient falls
Recommended