Why Do Governments Lend?
Evidence from the Corporate Loan Market
Veljko Fotak*
SUNY Buffalo
Current draft: December 9, 2013
Abstract
Despite the inefficiencies documented in empirical studies, state ownership of productive assets persists
worldwide. One explanation is the “market failure” view, positing that the raison d'être of state-owned
firms is to enable projects the private sector is reluctant to sponsor. I analyze a sample of 148,511
corporate loans worth over USD 37 trillion from 156 countries, initiated between 1980 and 2010, to
investigate whether lending by state-owned institutions is consistent with the market-failure view. I find
that the proportion of loans involving state-owned lenders is higher in countries with weak protection of
property rights, in non-common law countries, and during banking crises. Further, the level of state-
owned lender involvement (loan arranging and sole lending versus passive loan syndicate membership)
escalates in the presence of weak protection of property rights and during banking crises; the share of the
loan retained by state-owned lenders increases in the presence of weak protection of property rights.
Finally, I find that loans involving state-owned lenders display larger lending syndicates, longer
maturities, less frequent collateralization, and lower spreads, with a discount of approximately 21 bps.
Evidence of subsidization is stronger in the presence of weak protection of property rights. Overall, my
findings are mostly consistent with the market-failure view.
JEL Classification: G15, G32, G38
Keywords: State ownership, Syndicated Loans, State-Owned Banks
Please address correspondence to:
Veljko Fotak
236 Jacobs Management Center
Buffalo, NY 14620-4000
Tel: (716) 645-1541
e-mail: [email protected]
* I thank William Megginson, Louis Ederington, Ronald Masulis, Bernardo Bortolotti, Vikas Raman, Kate Holland,
Laura Pellizzola, and Stefano Lugo for valuable comments and insights. I benefited from comments offered at
seminar presentations at the University of Oklahoma, SUNY Buffalo, University of New Mexico, Bocconi
University, University of Cincinnati, and at the 2012 FMA Meeting. I also thank the Center for Financial Studies at
the Price College of Business, University of Oklahoma and the Sovereign Investment Lab at the Paolo Baffi Centre
for Central Banking and Financial Regulation for financial support.
2
Why Do Governments Lend? Evidence from the Corporate Loan Market
From Friedman (1962) to Shleifer (1998), post-war economists have denounced the inefficiencies and the
lack of incentives associated with state ownership, concluding that “private ownership is the crucial source of
incentives to innovate and become efficient” (Shleifer, 1998). Consistently, a vast and growing empirical literature
finds that state ownership is generally associated with operational inefficiency and a peculiar brand of agency
costs due to political interference.1 Yet, worldwide, state ownership of productive assets is remarkably persistent.
Despite the global wave of state privatizations, over the past decade governments have acquired more assets than
they have sold through share-issue privatizations and direct sales and this trend seems to be accelerating.2 This
puzzle is often explained by the “market-failure hypothesis” (Gerschenkron, 1962; Atkinson and Stiglitz, 1980),
which posits that state ownership is a response to market failures with the purpose of enabling projects the private
sector is reluctant to sponsor.
Conversely, the “commercial hypothesis” posits that state-owned firms are not fundamentally different
from private-sector firms and operate with the same commercial objectives. The distinction between the two
hypotheses is crucial in so far that, according to the commercial view, government and private sector activities
tend to intensify, or decline, in unison, while, according to the market-failure view, government involvement
substitutes for the private sector when the latter is inactive. In this paper, I explore lending by governments and
state-owned entities and test whether the observed lending patterns are consistent with the empirical predictions of
the commercial or the market-failure views.
1 One stream of research focusing on the relative efficiency of the state versus private sector is the privatization literature,
which generally finds that the efficiency of state-owned enterprises increases post-privatization. Early publications are
surveyed by Megginson and Netter (2001) and Djankov and Murrell (2002). More recent evidence includes Sun and Tong
(2003), Boubakri, Cosset and Guedhami (2005), and Estrin, et al. (2009), among others. Empirical evidence of inefficiency in
mixed-ownership enterprises is examined by Eckel and Vermaelen (1986) and Boardman and Vining (1989). Additional
evidence of lower performance in state-owned firms is offered by Chen, Firth and Xu (2008). The impact of state ownership
on the banking sector is the focus of La Porta, Lopez-de-Silanes, and Shleifer (2002), Sapienza (2004), Dinç (2005) and
Caprio, Laeven, and Levine (2007).
2 See Borisova, Fotak, Holland and Megginson (2012) for more detail. The authors find that the Thomson Reuters SDC
Platinum database contains approximately 5,900 government divestments worth USD 1.3 trillion and about 4,100
government investments worth approximately USD 1.2 trillion since 1980 to the present. But, since 2000, the database
records USD 725 billion in government divestments and USD 969 billion in government investments. The trend is even more
apparent after 2007 – since May 2007, governments have sold USD 157 billion of assets but purchased USD 470 billion.

3
The financial sector is a particularly apt arena for testing the impact of state ownership. First, state
ownership of banks around the world is pervasive and persistent. La Porta, Lopez-de-Silanes, and Shleifer (2002,
henceforth “LLS”) find that the average state ownership of banks, around the world, is 41.6 percent in 1995 (the
mid-point of my study). Second, the financial sector, being central to both the payment system and to corporate
access to funding, affects all other economic activities.
The work of La Porta, Lopez-de-Silanes, Shleifer, and Vishny (1997 and 1998, henceforth “LLSV”)
highlights the importance of laws and institutions in the development of finance. The relevant finding is that weak
institutions hamper the development of financial markets. Building on their insight, I investigate whether, in the
presence of a market failure (weak protection of property rights and the resulting lack of development),
governments lend more frequently, retain larger shares of loans, escalate their level of involvement (by, for
example, arranging loans) and whether, under weak legal systems, government loans provide terms more
favorable to borrowers than private-sector loans.
A second testing ground for the market-failure view is offered by banking crises. During banking crises,
credit supply is constrained as the private sector is often reluctant to lend (Laeven and Valencia, 2010; Sudheer
and Purnanandam, 2011). This can be viewed as a temporary market failure – and the testable implication of the
market-failure view is that government lending activity should intensify during a banking crisis. Hence, I analyze
government lending patterns and the terms of government loans during banking crises.3
Further, within the market-failure view, government lenders provide credit to firms with otherwise
restricted access to financial markets (unlisted, smaller, and riskier firms), to socially important industries (such as
regulated industries: utilities, transportation, and telecoms) and, given its centrality in economic activity, to the
financial sector. Accordingly, I test whether governments lend more frequently and more actively to such
borrowers.
3 Market failures deriving from institutional weakness and banking crises might be due, in the first place, to the actions of
governments. While it is plausible to presume that governments are responsible for those failures through legislative or
regulatory activity, it is not clear why government lending activity – the focus of this analysis - should cause institutional
weakness or induce a banking crisis. Also, government lending cannot, by definition, cause legal origin, used here as an
exogenous proxy for strength of the legal environment. Further, the analysis here presented includes both domestic and
foreign government lending, and foreign governments are an unlikely cause of domestic market failures. Finally, many of the
state-owned lenders are owned by local or regional governments, rather than the central government, and thus are farther
removed from the legislative process.
4
Given that the market-failure view is predicated on the concept that governments seek to provide support
to the domestic economy, the predicted lending patterns apply mostly to domestic lending activity. LLS (2002)
similarly justify excluding foreign banks from their sample. Accordingly, I isolate loans by domestic and foreign
government lenders, expecting to find domestic lending activity conforming to the market-failure view and
foreign lending activity to be commercial in nature – where “commercial” implies lending patterns akin to those
of private lenders.
I analyze government lending patterns using corporate loan initiations included in the Thomson Reuters
LPC Deal Scan database, augmented with borrower accounting data from Worldscope Global.4 As proxies for the
quality of the legal system, I employ an index of the strength of propriety rights compiled by the Fraser Institute
and identifiers of the legal origin of the borrower’s country.5 In robustness tests, I use, as an alternative metric of
legal system strength, the “Investment Profile” score by the International Country Risk Guide.
I model the probability of government involvement, distinguishing between domestic and foreign
government lending, in probit analysis. In contrast with the commercial view, results point to significant
differences in lending patterns between state-owned and private-sector institutions. Consistent with the market-
failure view, government lending accounts for a higher proportion of loans in countries with weak protection of
property rights and in non-common law countries. While domestic government lending is more likely during a
banking crisis, foreign government lending displays no such bias. Both domestic and foreign government lending
favor regulated industries, though this result is, at least partially, subsumed by a size effect. Government lending
also favors state-owned borrowers. Both domestic and foreign government lenders favor large firms but domestic
government lending is further biased towards firms with higher levels of idiosyncratic risk. Results are both
statistically and economically significant. Holding other predictors at the mean, a decrease in protection of
property rights from an index level of 8 (approximately the mean value for Germany) to 6 (approximately the
4 For the purpose of this investigation, I define as “state-owned” every firm and institution in which the government owns,
directly or indirectly, an equity stake exceeding 50%. The data collection involved in tracking government ownership is
described in Section 2.1. For brevity, I refer to government branches and institutions and state-owned firms as “government”
and to lending by government branches and institutions and state-owned firms as “government lending”. I use the term
“government loans” to indicate loans in which government lenders are either sole-lenders, arrangers or syndicate members.
5 Legal origin has often been used as a proxy for the strength of property rights in prior literature, since LLSV (1998)
documented that common-law (French civil-law) countries generally have the strongest (weakest) legal protections of
investors.
5
mean value for Romania) roughly triples the probability of government lending, increasing the proportion of loans
with government lenders from 1 percent of all loans to 3 percent. Non-common law legal origin increases the
proportion of loans with government lenders by 10 percentage points. A banking crisis increases the proportion of
loans with government lenders by approximately 5 percentage points.
In the dataset, lenders can assume three basic roles: passive syndicate members, loan arrangers, and single
lenders (when the entire loan is provided by one lender). While syndicate membership involves the provision of
credit, syndicate arranging involves the additional functions of negotiating with the borrower, reviewing its
disclosures, funding the loan, and monitoring the loan agreement. Accordingly, arranging a loan is a higher-
involvement task than simple syndicate membership and arrangers not only provide credit, but also facilitate
access to funding markets. Sole lending implies the same level of involvement with the borrower as arranging, but
the entire loan is retained by the single lender. Accordingly, within the market-failure view, government lenders
should arrange loans or single-lend more frequently in the presence of weak protection of property rights and
during banking crises. Within a multinomial-logit framework, I investigate the determinants of government roles
in lending and find that, conditional on government involvement, arranging and sole lending by governments
intensify in the presence of weak protection of property rights and in non-common law countries. This is
consistent with a facilitating role of government lenders, in so far as the arranging activity of state-owned banks
provides access to credit supplied by both state-owned and private sector lenders. Also, consistent with the
market-failure view, arranging activity intensifies during banking crises.
I further investigate which factors determine the stake of the loan retained (not syndicated) by
government lenders. Within the market-failure framework, governments should retain larger portions of loans in
weak legal systems and during banking crises. Results based on a two-stage selection model (in which the first
stage models government participation, while the second models the share of the loan retained) are partially
supportive of the market-failure view. While state-owned lenders retain larger shares of loans in the presence of
weak property rights, state-owned lenders, in particular when lending to domestic borrowers, retain larger shares
of loans in common law countries. Banking crises do not impact the stake retained by government lenders.
To examine the characteristics of government loans, I control for the selection bias in government lending
by propensity-score matching. Comparing loan characteristics between government loans and the propensity-
6
score matched sample, I document that government loans involve larger syndicates: the mean number of lenders
for government loans is 16 versus 9 for the matched sample, which is consistent with the facilitating role of loan
arranging. Government loans also have slightly longer maturities (54 versus 50 months) and are less frequently
collateralized (only 17 percent of government loans are collateralized, versus 23 percent of matched private-sector
loans). Most importantly, after controlling for country and borrower characteristics, government loans carry a 21
bps discount. These differences are, once more, conflicting with the commercial view of government lending, as
government loans involve terms more favorable to borrowers than do private loans. I further investigate how
government lending differs between countries with weak and strong protection of property rights and find results
consistent with the market-failure view. When the index of protection of property rights is above median,
government loans involve larger syndicates and longer maturities, but other loan characteristics are not
statistically different from those of private-sector loans. Conversely, in the presence of weak protection of
property rights, government loans involve larger syndicates, longer maturities, less frequent collateralization,
higher usage of covenants, and significant lower spreads, with a mean discount of 37 bps. This evidence indicates
that governments subsidize loans to a larger extent the weaker the protection of property rights. Comparing
characteristics of domestic and foreign government loans, I surprisingly find stronger evidence of loan
subsidization by foreign governments: foreign government loans involve both more favorable contract terms and
larger discounts than domestic government loans. I do not find a similar distinction when sub-setting the dataset
by legal origin or by banking crises. I further subset results by share of the loan retained by governments, finding
that terms of loans are favorable to borrowers regardless of the size of the stake retained by the government; the
implication is that government lending participation induces other syndicate members to lend at more favorable
terms. Finally, I compare government and private-sector loans to the same borrower during the same year and do
not find government loans to be substantially different: government loans have longer maturities and involve
larger lending syndicates, but are otherwise similar to private loans. This suggests that government lending does
not subsidize firms that already have access to financing through private-sector channels.
This study is the first multi-country loan-level analysis to focus on the reasons behind government
lending. It contributes to the literature on government’s role in the economy first by showing that, contrary to the
commercial view, lending patterns of state-owned institutions are different from those of private-sector banks.

7
Second, evidence is consistent with the market-failure view, as government lending substitutes for private-sector
lending in the presence of weak property rights and during banking crises. Also, analysis of government lending
indicates that state-owned banks not only provide credit, but facilitate access to private-sector credit markets by
assuming the role of loan arrangers and thus attracting large syndicates. Third, in a broader sense, results indicate
that state-ownership persistence is due, at least partially, to weak legal systems presumably leading to reluctant
private-sector involvement in economic activity.6 Overall, the main implication is that state-owned banks, by
providing credit when otherwise scarce and by facilitating access to private-sector lenders, relax financial
constraints that are shown to hamper economic growth.7
The finding that government lending is more frequent in the presence of weak protection of property
rights is close, in spirit, to LLS (2002), who document, amongst other results, that state ownership of banks is
more common in countries with weak legal systems. Yet, the analysis here presented differs in important ways.
First, I base my analysis on lending activity, an outcome-based metric, rather than on bank ownership. Second,
my findings are based on a more comprehensive analysis, in time (my sample covers the years 1980-2010, while
LLS focus mainly on two years, 1970 and 1995), geography (I include 156 countries, while LLS focus on 92) and
coverage (I include all banks, while LLS focus on the ten largest banks from each country). Also, I include, and
contrast, both domestic and foreign lending activity, while the latter is explicitly excluded by LLS. Third, and
most important, my findings cannot be explained by simple state ownership of banks as (1) I control for
government size in the economy in my analysis, (2) results apply to both domestic and foreign lending and (3) I
show that domestic government lending is stronger during banking crises, while LLS find a weak, negative
association between banking crises and state ownership of banks. Finally, I investigate not only the frequency of
government lending activity, but also lender role, shares retained, and loan characteristics. This leads to the
finding that government lending is not only more frequent in the presence of weak protection of property rights,
6 While previous studies document that state ownership of banks is negatively related to the development of a private
financial system, the implication of my evidence is that this relationship is driven by the weakness of the legal environment,
which drives both lack of private activity (LLSV, 1997 and 1998) and the resulting government intervention.
7 Previous research indicates that credit constraints hamper economic growth, in particular under the conditions considered in
this paper: weak legal systems and banking crises. For example, Beck and Demirguc-Kunt (2006) find that lack of credit
impedes growth of small and medium enterprises in countries with weak protection of property rights. Dell’Ariccia,
Detragiache, and Rajan (2008) find that economic sectors that heavily depend on external financing lose approximately 1
percentage point of growth in each crisis year compared to less financially dependent sectors. Chava and Purnanandam
(2011) find that profitability of firms dependent on bank financing suffers during a banking crisis.

8
but the level of government involvement escalates, with government lenders more frequently arranging loans,
thus attracting a larger number of private-sector lenders, resulting in loans with longer maturities and lower
spreads. The important and novel implication is that government activity substitutes for private-sector lending
when the latter is scarce.
A second branch of the literature investigating state ownership of banks focuses on the agency costs
associated with political lending.8 I contribute by showing that lending patterns are also consistent with the
market-failure view of governments, in that government lending is directly related to financial market lack of
development and failure. The political and market-failure views of state ownership are each inconsistent with the
commercial view, but not mutually exclusive.
My research also adds to the literature on syndicated loans. In this respect, the closest works are Esty and
Megginson (2003) and Bae and Goyal (2009), who investigate how the strength of creditor rights impacts the
structure of bank loans and find that lenders react to weak creditor protection by adopting contracting structures
aimed at mitigating risk.9 In this framework, my main contribution is to show that legal structure impacts
syndicate composition and that government presence can ameliorate some of the problems related to legal-system
weakness. Further, while state ownership is not the main focus of their analysis, Qian and Strahan (2007)
anticipate some findings, as they document that state-owned banks own larger shares of syndicated loans in
countries of Scandinavian or socialist legal origin and in countries with weak creditor rights. They also investigate
whether the share of the loan owned by government banks has an impact on loan characteristics, but find no
relationship – contrary to the results of my study – presumably due to the lack of controls for selection biases in
government lending in their analysis.
This paper is organized as follows. Section 1 develops testable hypotheses. Section 2 describes the data
sources and the dataset. Section 3 focuses on the empirical analysis. Section 4 concludes.
8 Existing literature provides strong evidence of political lending. DeBonis (1998) looks at Italian state-owned banks and find
that their lending is biased towards state-owned enterprises and local authorities. He further documents that state-owned
banks are less profitable in their lending activities and suffer from a higher proportion of non-performing loans. Sapienza
(2004) focuses on a sample of Italian banks and finds evidence of lending according to party affiliation. Dinç (2005) finds
that state-owned banks increase lending during election years. Khwaja and Mian (2005) show that, in Pakistan, firms with
politicians amongst directors receive larger loans from governments.
9 The findings indicate that, in the presence of weak protection of property rights, loans are generally smaller, display shorter
maturities, more diffused debt ownership and higher loan interest rates as compensation for the increased level of risk.

9
1. Hypotheses Development
According to the “market-failure view” (Gerschenkron, 1962; Atkinson and Stiglitz, 1980) of state
ownership, governments intervene in economic activity when the private sector is reluctant to participate. My
empirical focus is on government lending activity and the first “market failure” I use as a testing ground is legal
system weakness, which prevents the development of financial markets (LLSV 1997, 1998). The second set of
market failures I investigate are banking crises, which lead to a reduction in the availability of credit (Laeven and
Valencia, 2010; Sudheer and Purnanandam, 2011). A further implication of the market-failure view is that
government lending should provide credit to firms which have limited or costly access to private-sector capital
funding. As metrics for firm access to capital markets I consider firm size (larger firms typically have easier
access to funding), public listing (listed firms have access to public equity markets and a higher level of
transparency, which favors borrowing), and the number of loans from the private sector over the previous years –
a direct measure of ease of access to private capital markets. Accordingly, my first testable hypothesis is that
government lending will be more frequent (account for a larger proportion of loans) when property rights are
weak (low property rights scores and non-common law legal origin), during banking crises, and to firms with less
access to private-sector funding (smaller, unlisted firms with fewer private-sector loans).
A higher level of government involvement, aside from leading to more frequent lending, could also result
into a more active role. In my analysis, lenders can assume three basic roles: passive syndicate members, loan
arrangers, or sole lenders. Syndicate membership involves only the provision of credit, whereas syndicate
arranging involves the additional functions of negotiating with the borrower, reviewing its disclosures, and
monitoring the loan agreement. Accordingly, arranging a loan is a higher-involvement task than simple syndicate
membership and leads not only to the provision of credit, but also to facilitating access to credit markets. Sole
lending involves the same level of involvement with the borrower as arranging, but the entire loan is retained by
the single lender. Accordingly, within the market-failure view, I expect that government lending will involve
more arranging and sole lending in the presence of weak protection of property rights, during banking crises, and
for borrowers with less access to private capital markets.

10
Another measure of government’s involvement in lending is the share of the loan that is retained by the
government lender (rather than syndicated to other lenders). Accordingly, within the market-failure view, I expect
that government lenders will retain larger shares of loans in the presence of weak protection of property rights,
during banking crises, and for borrowers with less access to private-sector capital markets.
A market failure, either a weak legal system or a banking crisis, leads to reluctant lending by the private
sector, and thus to loan terms less favorable to borrowers (Beck and Demirguc-Kunt, 2006). As the market-failure
view predicts governments will provide credit when the private sector is reluctant to do so, the terms of
government loans should be more favorable to lenders (compared to the terms on private-sectors loans) in the
presence of weak property rights or during a banking crisis. In particular, government loans, compared to private-
sector loans, should be larger, have fewer covenants, be less frequently collateralized or senior, have longer
maturities and lower spreads in the presence of weak property rights or during a banking crisis.
The predictions of the market-failure view apply mostly to domestic government activity. Accordingly,
my analysis distinguishes between domestic and foreign government lending, expecting results consistent with the
market-failure for domestic, but not foreign, lenders.
Conversely, the commercial view implies no difference between lending patterns by government and
private institutions.
2. Data Sources, Descriptive Statistics and Univariate Analysis
2.1. Data Sources
The source of data analyzed in this study is the Thomson Reuters Loan Pricing Corporation Deal Scan
database (“DealScan”). DealScan includes loans, high-yield bonds, and private placement transactions from
around the world. The version of the database used here contains loans initiated between January 1980 and May
2010. The database includes information on loan pricing, contract details, terms and conditions, plus limited
information on loan participants (borrower and lender identities and limited financials). The loans are organized
by “package” and by “facility”. Each package represents a loosely-defined “deal” and may contain one or
multiple facilities – on an average, there are approximately 1.5 loans in each package. All loans within the same
package share the same borrower, but the identity of the lender, or composition of the lending syndicate, type of
11
loan, loan initiation date and other contract characteristics can all vary between loans from the same package.10
I limit my analysis to loans identified as ‘364-Day Facility’, ‘Bridge Loan’, ‘Term Loan’ of all types,
‘Revolver line’ of all maturities and ‘Other Loan’, thus excluding not only bonds and private placements, but also
credit letters and guarantees. I further exclude loans whose status is ‘Cancelled’ or ‘Rumor’. Further, I exclude
from my sample all loans for which data on the composition of the lending syndicate is missing and loans with
conflicting information (for example, loans marked as single-lender loans for which multiple lenders are listed).
I first identify state ownership of both lenders and borrowers by using data from DealScan. The database
identifies firms as being either majority (more than 50 percent) or minority (between 5 and 50 percent) state-
owned. I focus on majority ownership, so use “government lender” to indicate any lender in which the
government owns, directly or indirectly, more than 50 percent of equity and “government loans” to indicate any
loans involving at least one “government lender” and “private loans” to identify loans with no government
lenders. I extensively verify majority state ownership by validating the information in DealScan through external
searches. I employ the datasets of state ownership utilized in Bortolotti, Fotak and Megginson (2011) and
Borisova, Fotak, Holland and Megginson (2012) and integrate the data with company filings and news searches. I
find that DealScan correctly identifies government majority ownership, as I find no instances of firms being
identified as state-owned when that is not the case. On the other hand, I identify instances of state-owned firms
not being identified as such in DealScan and I correct such misclassifications.11
The final sample includes various
types of government lenders: state-owned banks and other state-owned financial institutions, governmental
institutions (such as ministries of economy, finance or commerce), supranational entities (such as the European
Investment Bank and the Inter-American Development Bank), and, in rare cases, state-owned operating
companies (such as Électricité de France S.A.).
Accounting data for borrowing firms is obtained from the Thomson Financial Worldscope Global
(“Worldscope”) database. As DealScan identifies firms only by name and ticker symbol, matching between
10
Carey and Hrycray (1999) and Chava and Roberts (2008) describe the database extensively. Some recent empirical studies
using data from this database include Guner (2006), Qian and Strahan (2007), Sufi (2009), Bae and Goyal (2009) and
Haselmann and Wachtel (2010).
11 With the large number of firms in the database some small classification error is still possible. In regards to the analysis
here presented, this hypothetical classification error would lead to conservative results. If firms that truly are state-owned are
not classified as such, differences between private and government loans would be more difficult to detect.

12
DealScan and Worldscope is based on company names; due to differences in spelling, much of the matching is
manual. Out of a total of 91,105 borrowers in the sample, I successfully match 16,766 firms between DealScan
and Worldscope.12
To prevent possible endogeneity issues, I retrieve accounting data for the borrower as of
December 31 of the year preceding loan initiation. This subset of loans with available accounting data is biased
towards larger, publicly traded institutions, so I present results for both the larger sample and for the data subset
including borrowers matched to Worldscope.
Banking crises are identified by making use of the dataset described in Laeven and Valencia (2010).13
The
dataset lists banking crises across the world from 1970 to 2009. Amongst other information, it identifies the
country/years during which a banking crisis took place, based on two conditions: “(1) Significant signs of
financial distress in the banking system (as indicated by significant bank runs, losses in the banking system, and
bank liquidations); and (2) Significant banking policy intervention measures in response to significant losses in
the banking system” (Laeven and Valencia, 2010).
Data on the size of government and protection of creditor rights is from the Economic Freedom of the
World survey by the Fraser Institute. This data is available at five-year interval between 1970 and 2000 and yearly
thereafter. The most recent data available at the time of writing is from the 2010 edition of the survey, which
includes data until 2008.14
In particular, I obtain two variables, described respectively as “Size of the Government:
Expenditures, Taxes and Enterprises” (“Government Size”) and “Legal Structure and Security of Property Rights”
(or “Property Rights”). Government Size ranges from one to ten, with higher scores indicating smaller
government direct intervention in the economy, based on the metrics: (1) general government consumption
spending as a percentage of total consumption, (2) transfers and subsidies as a percentage of GDP, (3)
government enterprise and investments, and (4) top marginal tax rates. Property Rights is similarly coded on a
one-to-ten scale, with higher scores indicating stronger protection of property rights, and is based on the criteria:
12
By comparison, Bae and Goyal (2009) match 4,407 borrowers between the same two databases. Qian and Strahan (2007)
engage in a similar exercise but do not reveal the exact number of matches – yet, their data description lists 4,322 loans for
which they find borrower-level accounting data. Haselmann and Wachtel (2010) match approximately 7,000 firms between
DealScan and Amadeus.
13 Luc Laeven has made the dataset available at http://www.luclaeven.com/Data.htm
14 For the years for which data is not available, I use data for the latest available year. So, for example, I use 1980 data for the
years 1981 to 1984. Similarly, I use 2008 data for the years 2009 and 2010.

13
(1) judicial independence, (2) impartial courts, (3) protection of property rights, (4) military interference in the
role of law and the political process, (5) integrity of the legal system, (6) legal enforcement of contracts, and (7)
regulatory restrictions on the sale of real property.15
As an alternative proxy for the level of development of the legal system, I employ the “Investment
Profile” score published in the International Country Risk Guide (ICRG).16
The index is coded on a twelve-point
scale (1-12) with higher scores indicating a more business-favorable legal environment. The index is based on
three sub-components, measuring the risk of contract non-viability or expropriation, restrictions on profits
repatriation, and payment delays. The index itself is available, yearly, from 1984 to 2008.17
While this index is not
included in the main analysis, due to its high level of correlation with the Property Rights score, it is employed in
robustness tests and thus included in the descriptive analysis.
Data on yearly GDP growth by country is from the World Bank website and information on legal origin is
from a dataset made available by Andrei Shleifer.18
All variables measured in monetary units (such as loan size
and firm’s total assets) are in USD, adjusted for inflation to 2011 by using the Consumer Price Index by the US
Bureau of Labor Statistics. A summary of variable definitions and related sources are included in Table 1.
*** Insert Table 1 about here ***
2.2. Sample Descriptive Statistics
Descriptive statistics for core variables are reported in Table 2. Panel A contains information on binary
variables, while Panel B focuses on continuous variables. The descriptive statistics are based on the raw data; in
the remained of the analysis, continuous variables are winsorized at the first and ninety-ninth percentiles.
The dataset includes 148,511 unique loans to 91,105 distinct borrowers from 156 countries, with a total
value of USD 37 trillion (in ‘2011 USD’). The sample includes 15,807 distinct lenders. In terms of geographical
15
The variables Government Size and Property Rights correspond to the indices labeled as ‘A1’ and ‘A2’. An older version
of the Economic Freedom of the World dataset is discussed – and utilized for empirical analysis - by Easton and Walker
(1997).
16 ICRG data has been used in numerous previous financial studies, including Bae and Goyal (2009).
17 I employ the index values for 1984 for the years 1980-1983 and the 2008 values for the years 2009 and 2010.
18 http://www.economics.harvard.edu/faculty/shleifer/dataset

14
distribution of borrowers, the overall dataset is biased towards common law countries (circa 71 percent of
observations) and, in particular, towards loans to USA-headquartered borrowers (58 percent).19
The subset of the sample involving state-owned lenders includes 10,560 loans (7 percent of the total
number of loans). Of those loans, 4,819 (3 percent) involve domestic government lenders, and 6,455 loans (4
percent) involve foreign government lenders. This suggests that governments lend more frequently abroad than
domestically. This result is unexpected, but should be interpreted with caution, as it could be driven by database
coverage bias. The sample includes 279 distinct state-owned lenders. In terms of geographical distribution of
borrowers, the government-loan data subset includes loans to borrowers in 129 countries. Countries with the
highest number of loans involving state-owned lenders include China (2,382 loans, 22.56% of total number of
loans in this sub-sample), the USA (933 loans, 8.84%), South Korea (876, 8.30%), India (565, 5.35%) and Russia
(463 loans, 4.38%).20
The sample includes 18,628 loans (12.54% of the total number of loans) originated during a banking
crisis. In 3,254 loans, the borrower has a state participation (exceeding 5 percent ownership). Most of the loans in
the dataset are syndicated – only 13,893 loans, or 9 percent of the sample, involve single lenders. The total
number of packages is 104,245, indicating that there are approximately 1.4 loans per package in the final sample.
*** Insert Table 2 about here ***
2.3. Univariate Analysis
As a first analysis of government lending patterns, I compute mean values of the variables of interest for
four subsets of the sample: loans with no government lender involvement (“private loans”), loans in which at least
one of the lenders is state-owned (“government loans”), loans in which at least one of the lenders is owned by the
government of the country in which the borrower headquarters are located, and loans in which at least one of the
lenders is owned by the government not of the country in which the borrower headquarters are located
19
As discussed in the robustness section, I find the empirical analysis robust to exclusion of loans to USA-headquartered
borrowers.
20 Results regarding geographical distribution of loans are untabulated for brevity, but available on request. As discussed in
the robustness section, I find the empirical analysis robust to exclusion of loans to borrowers with headquarters in China.
China, for the present definition, includes the territories of Taiwan and Hong Kong.
15
(respectively, “domestic government loans” and “foreign government loans”). To test for differences in means
across these three sub-samples, I use two different methodologies, depending on the nature of the data. Two-
sample t-tests are used for continuous variables, with standard errors clustered at the loan package level.21
For
binary variables, I use Pearson Chi-square tests with standard errors clustered at the loan package level. Results
are presented in Table 3.
*** Insert Table 3 about here ***
Compared to private loans, government loans have lower spreads (138 bps for government loans vs. 213
bps for private loans),22
a higher number of lenders (13 vs. 6), are more likely to be collateralized (13 vs. 8
percent), less likely to employ covenants (11 vs. 19 percent), less likely to involve a single lenders (6 vs. 10
percent), have longer maturities (66 vs. 51 months), are more likely to involve foreign lenders (83 vs. 57 percent)
and are generally larger (USD 307 million vs. USD 247 million).23
Comparing loans by domestic lenders to those
booked by foreign lenders, I find that the former have lower spreads, fewer lenders, less frequent collateralization
and use of covenants, are less likely to be collateralized and to involve a single lender, have longer maturity,
involve fewer foreign lenders and are significantly smaller.
Somewhat surprisingly, government loans tend to involve borrowers from countries with a smaller size of
government. More in line with expectations, government loans provide credit more frequently to borrowers from
countries that have weaker protection of creditor rights and with a less-favorable investment profile. While 73
percent of loans with no government involvement are to borrowers from common law countries, only 44 percent
of loans with government lenders are to borrowers from common law countries. Further, I find a negative
correlation between government lending and banking crises, as 13 percent of loans with no government lenders
are initiated during banking crises, but only 11 percent of government loans are; however, multivariate analysis,
presented in the following sections, does not support this finding. Finally, mean GDP growth is higher during the
21
Problems related to standard error clustering in finance panel data sets are discussed in Petersen (2009). The estimation
methods employed to cluster standard errors here and in the remainder of the paper are described in Skinner, Holt and Smith
(1989).
22 The spreads here considered are ‘all in drawn’ spreads from DealScan, defined as “The amount the borrower pays (in basis
points) over LIBOR for each dollar drawn down, including both the spread of the loan and any annual or facility fee paid”
(data definition from an electronic file provided by Thomson Reuters with the database).
23 Here and in the remainder of the paper, reported results are statistically significant at the 10% level or lower, unless
otherwise specified.

16
initiation of loans with government involvement (5.2 vs. 2.8 percent). Compared to foreign government loans,
domestic government loans are extended to borrowers from countries with smaller governments, stronger
protection of creditor rights, stronger investment profile, and are less likely to be initiated in common law
countries and during banking crises, but are associated with stronger GDP growth.
Finally, in terms of borrower characteristics, both domestic and foreign government loans are associated
with larger (higher total assets) and more profitable borrowers (higher ROA), and borrowers with lower Tobin Q
scores. While borrowers of loans with domestic government lenders have generally lower leverage than borrowers
of loans from private lenders, the opposite (higher leverage) is true for borrowers of loans with foreign
government lenders.24
Overall, contrary to the commercial view, univariate analysis indicates that government lending patterns
different substantially from those of private institutions. Results further suggest that government lending is more
frequent in the presence of weak legal systems, but less frequent during banking crises, thus providing conflicting
evidence for the market-failure view.
3. Empirical Analysis of Government Lending Patterns
3.1. Determinants of Government Participation
I employ probit analysis to investigate within a multivariate framework which factors affect the
government decision to lend. The response is a binary variable equal to one if state-owned lenders are involved.
As predictors, I use variables which are exogenous to government lending participation, including both country
and borrower characteristics. As the market-failure view of state ownership predicts that government lending is
more likely in the presence of weak creditor rights protection, I add a variable measuring the strength of property
rights. Given the findings of LLSV (1997, 1998) linking legal origin to the strength of creditor rights, I add a
binary variable equal to one for borrowers headquartered in common law countries.25
Since the market-failure
24
The differences, while statistically significant, are marginal: mean debt-to-asset ratio is .65 for all-private loans, .62 for
loans with domestic government lenders and .68 for loans with foreign government lenders.
25
The common law origin dummy variable and the variable measuring the strength of property rights are correlated, as
property rights tend to be weaker in non-common law countries. To investigate whether multicollinearity is affecting

17
view predicts that governments provide credit when access to financing is otherwise restricted, I add a binary
variable equal to one during banking crises. In a similar spirit, I add two measures of access to private lending
markets – the number of private loans obtained by the borrower over the previous five years and a binary variable
equal to one if the borrower is listed on a public exchange. As an additional control and to measure the strength of
previous relationships with the government, I add the number of government loans obtained by the borrower over
the previous five years. Also, since the market-failure view predicts possible industry biases, I add controls for
regulated industries (SIC codes 4000-5000, including telecoms, transportation and utilities) and depository
institutions (SIC codes 6000-6500). As an additional control for the ease of access to financing, I add a binary
variable equal to one if the borrower is publicly traded. Given that government lending might focus on state-
owned enterprises, I include a binary variable equal to one if the borrower has a share of state ownership
exceeding five percent. As additional controls for country characteristics, I include variables measuring country
GDP growth and an index of the size of the government in the economy. Since governments might be prone to
provide credit for specific types of projects, I add fixed effects for loan purpose.26
As in the univariate analysis, I
cluster standard errors at the loan package level.
Results are presented in the first column of Table 4. Consistent with the market failure view, the
proportion of loans with government lenders decreases in protection of creditor right and, consistently, is higher
for non-common law countries. The positive coefficient on the crisis variable indicates that government lending is
more likely during a banking crisis – yet, the probability of government lending is positively related to GDP
growth. Government lending is more likely for both depository institutions and regulated industries. Finally,
government lending is more likely for state-owned borrowers.
In the third and fifth column of Table 4, I present results disaggregated by domestic and foreign
government lenders. Most of the parameter estimates retain similar signs and levels of significance, but some
differences are notable. Domestic governments, unlike foreign governments, are less likely to lend to depository
institutions. Foreign governments, in addition, do not display higher levels of lending during banking crises.
parameter estimates, I re-estimate coefficients for the various models here presented by adding only one of those two
variables at the time, finding parameter estimate to be robust.
26 DealScan identifies 39 different “loan purposes”. For brevity, I do not report coefficient estimates on the loan purpose
dummy variables.
18
To gain further insight into borrower characteristics related to government lending, I estimate alternative
model specifications including accounting variables. I add firm size (total assets), firm leverage, ROA, a measure
of liquidity (the quick ratio) and Tobin’s Q to the model, presuming that each of those could be related to the ease
of obtaining financing. As accounting data is mostly unavailable for non-publicly traded firms – and, as most
government borrowers are non-publicly traded – I remove from this model the two binary variables identifying
publicly traded institutions and government borrowers. Also, I develop a measure of idiosyncratic risk by
regressing the loan spread on country, borrower and loan characteristics and compute the residual from this
model. This residual can be interpreted as an unexplained risk component and is therefore included as an
explanatory variable in the model. Results presented in the second, fourth and sixth column of Table 4 indicate
that government lenders target larger firms, both foreign and domestic. While overall government lending and
foreign government lending appear to be negatively related to the borrower’s Tobin’s Q, the result is not
statistically significant for domestic government lending. Domestic government lending is more likely for firms
with higher idiosyncratic risk. Finally, the addition of accounting variables affects the coefficient estimate for the
banking crisis binary variable (positive, but not statistically significant) and largely subsumes industrial biases, as
only the negative coefficient estimate for domestic government lending remains statistically significant. The
explanatory power of the probit models fitted is quite strong, with the percentage of concordant predictions
ranging between 81 percent and 94 percent.27
Economic interpretation of probit coefficients is non-intuitive, as the impact on the probability of the
modeled event is conditional on the level of all predictors. Nonetheless, I attempt to assess the economic
significance of the observed effects. Based on the coefficient estimates in the first column of Table 4, holding all
other predictors at the mean level, an increase in protection of property rights from an index level of 6
(approximately the mean value for Romania) to 8 (approximately the mean value for Germany) decreases the
probability of government lending by approximately 2.16 percentage points, from 3.35 percent to 1.19 percent.
Similarly, common law legal origin decreases the probability of government participation, at the mean, by 10
27
In probit analysis, to compute the proportion of concordant predictions, estimated coefficients are fitted in-sample to
compute the probability of lending by a state-owned entity. An observation is “concordant” if the predicted probability of
government lending is greater than (is smaller or equal than) 50 percent and the loan involves at least one state-owned lender
(does not involve any state-owned lenders).

19
percentage points. On the other hand, a banking crisis increases the probability of government participation by
approximately 5 percentage points.
Overall, these results lead to rejecting the commercial view of government lending, as there are clear and
systematic differences in the proportion of loans involving government lenders. Most of the findings are
consistent with the market failure view, as the proportion of loans involving at least one government lender
increases in weak property rights, non-common law countries, during banking crises and to borrowers with few
previous government loans. On the other hand, the fact that government lenders seem to prefer larger borrowers is
not supportive of the market failure view, as larger firms generally have easier access to funds.
*** Insert Table 4 about here ***
3.2. Determinants of Government Role
In the lending process as here described, the lender can assume three basic roles: “passive” syndicate
member, arranger, or single lender. While syndicate membership involves a creditor role, syndicate arranging
involves not only the provision of credit, but the additional functions of negotiating with the borrower, reviewing
its disclosures and monitoring the loan agreement. Accordingly, arranging a loan is a higher-involvement task
than simple syndicate membership and facilitates access to other lenders. Similarly, sole lending involves the
same level of involvement with the borrower as arranging, but the entire loan is retained by the single lender, at
least at loan inception. 28
Within the market-failure view, the level of government involvement should escalate in
environments with weak protection of creditor rights and, consistently, in non-common law countries. A similar
prediction (more active involvement by government lenders) applies to banking crises. Finally, the market-failure
view implies more active government involvement for borrowers with restricted access to private credit (small,
unlisted firms with few prior private-sector loans).
To empirically test which factors determine the choice of lending role, I employ a multinomial-logit
framework. In this, I include the same set of predictors used in Table 4 to examine the impact those have on the
28
The loan could be subsequently syndicated. Unfortunately, available data only allow identification of syndication at loan
inception.

20
role of the government.29
As a base case, I use the government being a passive (non-arranging) syndicate member.
Hence, reported parameter estimates should be interpreted as indicating which factors determine the government
being an arranger, rather than a syndicate member and which factors determine the government being a single
lender, rather than a syndicate member. Models include controls for government size and GDP growth.
For the sample of all government investors, results indicate that both arranging and sole lending are more
likely in the presence of weak protection of property rights, consistently with the market-failure view. Somewhat
surprisingly, these results are driven by foreign, rather than domestic, investors. Also consistent with the market-
failure view is the finding that arranging and sole lending are less likely in common law countries – which
indicates a higher level of involvement in non-common law country loans. This finding applies to both domestic
and foreign lenders (but the coefficient estimate is not statistically significant for foreign government arranging).
Also consistent with the market-failure view, governments assume a more active lending role during a banking
crisis. Both domestic and foreign governments are more likely to arrange loans during a crisis, indicating that
government lenders might play a facilitating role, enabling firms not only to borrow from state institutions, but to
access private-sector capital markets as well. Domestic government lenders are more likely to be single lenders
during crises, but not foreign government lenders.
Borrower characteristics also influence the level of government involvement. More active involvement of
government lenders is observed for loans to state-owned borrowers, but the results are statistically significant only
for the sample including all government lenders and for the arranger role of foreign lenders. Government lenders
are more likely to arrange loans for borrowers with previous access to government loans and less likely to arrange
loans for borrowers with previous private loans. Foreign governments are less likely to arrange loans for listed
borrowers.
Overall, results are indicative of a more active role in the presence of market failures (weak property
rights and banking crises). The implications are important. First, arranging implies a facilitating role, as it allows
borrowers to access other, presumably private, lenders. Second, the escalating role of government lenders (their
higher propensity to arrange loans) in the presence of market failures is indicative of the fact that results are not
29
I report results for the model “without accounting data”, as the sample “with accounting data” has too few observations for
government single lenders to reliably estimate the multinomial logit parameters.
21
simply driven by state ownership of banks, which LLS (2002) have shows tends to be higher in weak property
rights countries.
*** Insert Table 5 about here ***
3.3. Share of the Loan Retained by Government Lenders
Given that a large portion of the loans in the sample are syndicated, there are substantial differences in the
share of the loan retained by lenders. I model the size of the stake retained by government lenders as a function of
the same set of predictors used in the previously presented probit models (Table 4). To explore what factors drive
the decision to retain a certain proportion of the loan, I use Heckman two-stage models (Heckman, 1979) to
account for the selection bias – as government lending focuses on countries and firms with certain non-random
characteristics. Accordingly, in the first stage, I model the probability of government lending as a probit – as done
in Table 4. In the second stage, I employ the same set of predictors to investigate the factors determining the size
of the loan retained by government lenders, after controlling for the selection bias (by adding the inverse Mill’s
ratio). The first stage includes ‘loan purpose’ dummy variables, which are excluded from the second stage.30
As
before, I distinguish between domestic and foreign governments. The models are estimated by maximum
likelihood, with standard errors clustered at the package level and adjusted for the truncation of the dependent
variable (bounded at 0 and 100).
Results are presented in Table 6. Coefficient estimates indicate that government lenders retain larger
shares of loans in the presence of weak property rights. But coefficient estimates vary in magnitude across models
and economic significance is limited: after controlling for accounting data, for every one point increase in the
metric of property rights (coded on a one-to-ten scale), government share of the loan decreases by 2 percentage
points. Somewhat surprisingly, the analysis indicates that domestic government investors retain larger shares of
loans in common law countries, but, once more, the magnitude of coefficient estimates varies across models and
economic significance is limited: when controlling for accounting data, the share of loan retained by government
lenders is 2 percentage points higher in common law countries. While results are only marginally significant, the
30
A Sargan test (Sargan, 1958) indicates that loan purpose is correlated with government participation, but not with the
proportion of the loan retained by the government.
22
effect seems opposite for foreign government lenders. During a banking crisis, domestic governments appear to
retain a larger share of the loan (a sizable 30 percentage points more) but the result is not robust to inclusion of
accounting variables.
In terms of borrower characteristics, government lenders retain smaller stakes in loans to borrowers with
previous private loans. Domestic governments retain significantly smaller stakes in loans to listed borrowers.
Foreign governments retain smaller stakes in loans to larger firms and higher stakes in loans to borrowers with
higher idiosyncratic risk. For both domestic and foreign government lenders, the size of the stake retained is
inversely proportional to the borrower’s Tobin’s Q.
In this analysis of stakes, the strongest findings are those concerning property rights: consistent with the
market-failure view, government lenders retain larger stakes of loans in the presence of weak property rights. On
the other side, the results indicating that domestic government lenders retain smaller stakes of loans in common
law countries are contrary to the predictions of the market failure view. Economic significance of the findings is
limited.
*** Insert Table 6 about here ***
3.4. Impact on Loan Characteristics – Propensity Score Matching
To investigate how government loans differ from private-sector loans, I compare characteristics of loans
with government lending to those from a propensity-score matched sample involving only private-sector loans.31
Matching loans on the basis of pre-investment borrower and country characteristics is necessary because the
analysis presented in the previous section clearly indicates that government lending is not random, but rather is
systematically biased in terms of industry (more to regulated industry, less to depository institutions), firm
characteristics (borrowers tend to be larger firms, with lower Tobin’s Q and higher levels of idiosyncratic risk)
and country characteristics (government lending is less likely in common law countries and in general in countries
with stronger protection of creditor rights; further, it tends to increase during banking crises). To control for these
selection biases, I utilize the models “with accounting data” presented in Table 4 to estimate a predicted
31
Propensity-score matching has been widely used in both the economics and finance literature. A recent example is Lowry,
Officer and Schwert (2010).
23
probability of government lending for each loan in my sample. I then match each government loan with the
private loan with the closest predicted probability of government involvement. The rationale is to find the loan
that is closest in terms of exogenous characteristics, thus effectively controlling for government selection bias. For
each variable measuring loan characteristics, I compute means for the sample of government loans and compare
those to means for the matched sample. Statistical significance of difference in means is tested by using paired t-
tests with standard errors clustered at the package level. The findings are presented in Table 7. Panel A reports
results for the overall sample. Government loans involve a higher number of lenders (the mean number of lenders
for government loans is 16, while for private-sector loans it is 9), longer maturities (54 versus 50 months), while a
lower proportion of loans is collateralized (17 percent versus 23 percent). Government loans also involve foreign
lenders more frequently (in 92 percent of cases, versus 81 percent).32
Finally, government loans involve lower
spreads (128 bps versus 149 bps, for an economically and statistically significant discount of 21 bps). Differences
in loan size, covenant usage and frequency of collateralization are not statistically significant. Overall,
government loans appear to subsidize borrowers, as contract terms are more favorable (longer maturities, lower
levels of collateralization) and loans are cheaper (lower spreads). The exception to this is that covenants are used
more frequently. The finding that government loans involve a higher number of lenders indicates that government
loans favor borrowers by facilitating access to a larger lender base.
Panel B presents results for domestic government lenders. Loans by domestic governments involve more
lenders, less frequent use of collateral and longer maturities, but government loans are smaller than matched
private-sector ones (USD 439 million versus USD 580 million). Use of covenants is less frequent and loans are
less likely to be senior. Finally, loans by domestic governments attract foreign lenders less often than the matched
sample. Spreads are slightly higher on domestic government loans, by about 10 bps, than on matched private
credits, but the result is not statistically significant.
Panel C presents results for foreign government lenders. Foreign government loans also involve more
lenders, but loans are generally larger and covenants are used more frequently. Similarly to domestic government
loans, loans by foreign governments are less likely to be senior or collateralized. Spreads, however, are
significantly lower than those originating from the matched sample (120 bps versus 153 bps). Overall, this set of
32
But the result is due to foreign government lenders, as seen in Panels B and C.
24
results points to the somewhat surprising finding that foreign government loans are generally more favorable to
borrowers than domestic government loans.
According to the market-failure view, governments should lend at more favorable terms, compared to
private-sector lenders, when property rights are weak, reflecting a reluctance to lend by private-sector lenders. To
investigate this hypothesis, Panels D and E report results for loans given to borrowers from countries with
property rights indices below and above medians in the year of loan initiation, respectively. Compared to the
matched private-sector loan sample, government loans initiated in countries with weak property rights have more
lenders, longer maturities, more frequent use of covenants but less frequent collateralization, a higher
participation of foreign lenders and lower spreads, with a mean discount of 37 bps. In contrast, government loans
initiated in strong property right protection countries involve more lenders, longer maturities, and greater
participation of foreign lenders, but the other results are not statistically significant and the spread discount is only
5 bps. Overall, this set of results is consistent with the hypothesis that governments subsidize loans more strongly
in the presence of weak property rights.
In unreported analysis, I also split the sample between loans to borrowers in common and non-common
law countries and find no important differences. Similarly, government loans initiated during banking crises do
not differ substantially from loans given during non-crisis periods. I further subset the sample by share of the loan
retained by government lenders and find no substantial differences between subsamples. Overall, this analysis
suggests that presence of government lenders induces private sector lenders to accept more borrower-friendly
terms, especially in the presence of weak property rights. This is consistent with the idea that government
participation provides a “political umbrella”, as discussed by Esty and Megginson (2003).
*** Insert Table 7 about here ***
3.5. Impact on Loan Characteristics – Same Borrower and Year
The above analysis focuses on comparing loan characteristics for government loans to a sample of
private-sector loans matched on the basis of propensity scores. While propensity score matching controls for
observable country and firm characteristics, a selection bias possibly persists, as previous results show that
domestic government lending focuses on firms with high levels of idiosyncratic risk. To fully control for
25
idiosyncratic firm risk factors, I compare government and private-sector loans extended to the same borrower,
during the same year. While this analysis has the advantage of controlling for firm and country characteristics in
the strongest sense, it suffers from a different bias – the sample is restricted to firms that have access to both
private-sector and government lending. In so far as government lending focuses on firms with restricted access to
capital, the selection bias in this analysis should lead to a cautious interpretation of results.
Results for the sample including both domestic and foreign government loans are presented in Table 8,
Panel A. Compared to private-sector loans, government loans involve a larger number of lenders and longer
maturities, more frequent usage of covenants and more frequent involvement of foreign lenders. Levels of
seniority, frequency of collateralization and spreads do not appear statistically different.
I disaggregate results for domestic and foreign government lenders in Panel B and Panel C of Table 8. For
domestic government lending, loans appear to have larger syndicates (11 versus 6 lenders) and longer maturities
(70 versus 64 months). Loan size is slightly larger, but the difference is not statistically significant. Covenants
usage is actually more common for government loans than for the matched sample, while levels of seniority and
frequency of collateralization are not statistically different. Spreads are higher for domestic government loans, by
about 16 bps, but the result is also not statistically significant. Lending by domestic governments is associated
with less frequent presence of foreign lenders. Foreign government lending is also associated with larger
syndicates and longer maturities, but these loans are larger, involve more frequent use of covenants and higher
levels of seniority. Foreign government loan spreads are lower, by about 5 bps, which is consistent with the higher
usage of covenants and seniority of the loans (but not with longer maturities).
Overall, results indicate that government loans extended to borrowers with access to private markets
involve terms very similar to those of contemporaneous (same year) private loans to the same borrowers.
*** Insert Table 8 about here ***
3.6. Interpretation of Empirical Evidence – the “Social” and “Political” Views
A branch of the literature investigating state ownership of banks focuses on the distinction between a
“social” and a “political” motivation for government intervention. According to the social view, state ownership
arises as a response to the private sector’s reluctance to sponsor projects with high social benefits, but presumably

26
low economic profitability, thus contributing to economic development and improving social welfare (Stiglitz,
1993). In contrast, the political view maintains that governments acquire control of productive assets in order to
provide benefits to supporters in exchange for bribes or political support in the form of votes or contributions,
leading to inefficient capital allocation (Shleifer and Vishny, 1998).33
It is not my intention, in the present paper,
to test the social and political motivations underpinning state ownership, as I do not directly explore welfare
effects of government lending. Nonetheless, I briefly discuss in this section whether the evidence presented is
consistent with the social and political views. Clearly, both social and political views of government lending are
not consistent with the commercial view; on the other side, the social and political frameworks are not mutually
exclusive and, while the market failure view would appear more directly related to the social view, it is not
predicated on the same welfare-enhancement predicted by the social view.
The predictions of the social view in regards to the relationship between state ownership of banks and
strength of legal protection of property rights are clear: governments are expected to step in when legal system are
weak to fill the gap in credit availability due to lack of private sector lending. On the other hand, the predictions
of the political view in regards to the relationship between state ownership of banks and strength of legal
protection of property rights are mixed. LLS (2002) argue that both the social and the political view of state
ownership imply stronger government presence being associated with weak property rights. They reason that,
under the political view, governments will own larger shares of the banking sector in the presence of weak
property rights because “the attraction of such political control of banks is presumably greatest in countries with
underdeveloped financial systems and poorly protected property rights, because the government does not need to
compete with the private sector as a source of funds” (LLS 2002). In contrast, Andrianova, Demetriades and
Shortland (2010) discuss evidence that politicians are able to extract more benefits, in the form of donations and
profitable directorships, from private banks, especially in the presence of weak legal systems. Accordingly, the
finding that government lending activity is stronger in the presence of weak protection of property rights is
consistent with the social view of state ownership and with the political view under the LLS (2002) interpretative
framework, but is contrary to the political view as interpreted by Andrianova, Demetriades and Shortland (2010).
33
Empirical studies finding support for this view include DeBonis (1998), Sapienza (2004), Dinc (2005) and Khwaja and
Mian (2005).
27
The social view similarly predicts that government should intensify lending during banking crises, but no such
prediction is made by the political view. Accordingly, the finding that government lending intensifies around a
banking crisis is consistent with the social, but not the political view. The findings are mixed in regards to
borrower’s characteristics. Results indicate that governments tend to lend to firms with weak access to private
credit markets (few private loans), which is consistent with the social view. On the other hand, governments
favor, in lending, state-owned enterprises, which is consistent with both the social view (if we assume that state-
owned enterprises are indeed a means to finance socially beneficial projects, then lending to state-owned
enterprises is socially beneficial as well) and the political view (as state-owned enterprises might be used as a
conduit for political favors). Finally, the political view predicts strong loan subsidization by domestic
governments, but findings actually indicate that spreads on domestic government loans are not significantly
different from those on private-sector loans.
In the aggregate, results presented here do not allow rejecting the political view, but the social view
appears to more successfully explain the overall findings – and the social view is closely related to the market
failure view. Nonetheless, as LLS (2002) discuss, empirical tests aimed at distinguishing between the social and
political view should be based on measuring outcomes – ultimately, the best test is the link between government
involvement and subsequent measures of economic prosperity, which is beyond the scope of this paper.
3.7. Robustness Tests
This section discusses additional robustness tests. Results are unreported but available upon request.
3.7.1. One Observation per Loan Package
In DealScan, loans are grouped into “packages,” wherein larger deals often include multiple loans. The
multiple loans within a package share a common borrower, but the composition of the lending syndicate and loan
terms often differ. The loans within a single package might be contemporaneous (for example, a lending syndicate
offering a short-term loan and a revolving credit line at the same time) or might occur at different points in time,
as in the case of a renegotiated credit line. In the dataset here described, there are on average 1.4 loans per
package. While loan and syndicate characteristics are not necessarily fixed within a package, some degree of
28
correlation might exist. Further, borrower and country characteristics are clearly clustered at the package level.
Accordingly, the assumption of independence, crucial in many of the statistical methodologies applied in this
analysis, does not hold across loans originating from the same package. To alleviate this problem, most of the
analysis so far presented clusters standard errors at the package level. As a further robustness test, I replicate all of
the results presented above with a reduced sample, including only one loan per package. In particular, for each
package I select the earliest loan (based on the loan initiation date) or, if multiple loans share the same “earliest”
initiation date, the largest loan (measured as total loan value, in USD) amongst the contemporaneous ones. In
unreported results, I find that using this reduced sample does not affect any of the findings presented in Tables 4,
5, 7 and 8. Results presented in Table 6 do not employ clustering, due to a lesser dependence problem, as the
decision to retain a certain share of the loan is taken at the loan level, not at the package level.
3.7.2. Clustering by Firm
In the sample used here, loans are not only clustered at the package level, but they are also clustered at the
borrower level, as borrowers are at times recipients of multiple loans. Hence, I re-estimate all parameters from the
various models presented in Tables 4, 5, 7 and 8 by clustering standard errors at the borrower, rather than
package, level. The main findings are unaffected.
3.7.3. ICRG Investment Profile
As an alternative to the Fraser Institute’s measure of protection of property rights, I use the “Investment
Profile” score from the International Country Risk Guide and re-estimate all the results presented in Tables 4 to 8.
Aside from differences in parameter estimates magnitudes (largely due to differences in scaling of the two
indices), all results and levels of statistical significance are unaffected.
3.7.4. Minority State Ownership of the Lender
State ownership of the lender is defined in this paper as majority ownership, meaning direct or indirect
control of over fifty percent of equity of the institution by governments or state-owned entities. Yet DealScan
identifies minority state ownership as well, where “minority” is defined as exceeding five percent of equity.

29
Making use of this data, I replicate this analysis by identifying government lenders in which state ownership,
direct or indirect, exceeds five percent of equity. While signs and significance levels of the coefficient estimates
presented in Tables 4 to 8 are unaffected, the magnitudes of the estimated coefficients are somewhat smaller. The
weaker impact could be due either to weaker government interference or to more noise in the data – as discussed,
the dataset used in the main analysis has been extensively validated and multiple errors have been corrected, while
no such data validation was performed on the variable identifying minority state ownership.
3.7.5. Excluding the Initial Five Years
One of the metrics employed as a measure of access to external financing is the number of previous
private loans obtained by a borrower over the past five years. This metric is biased (downwards) for the early
years of the sample. To check for robustness against this bias, I replicate the analysis by excluding loans initiated
during the first five years of the study period, 1980-1984. The findings presented in Tables 4 to 8 are unaffected.
3.7.6. Excluding Borrowers with Headquarters in USA or China
Due to both the size of the economy and reporting biases, DealScan is heavily biased towards loans
originating from the United States. In order to check whether the main results are driven by this bias, I first add a
binary variable identifying borrowers with headquarters in the USA to the predictors in Tables 4 to 8 and find
core results to be unaffected. As a second robustness check, I exclude loans to borrowers headquartered in the
United States from the analysis. While the statistical significance of some of my results is somewhat reduced,
likely due to the smaller sample size, coefficient estimates presented in Tables 4 to 8 are largely unaffected. That
is not surprising, given that government loans are rare in the United States and mostly associated with foreign
government lenders.
Descriptive analysis also indicates that the subset of loans involving state-owned lenders includes a
substantial portion (approximately one fifth by count) of loans to Chinese companies. Accordingly, I replicate
tables 4 to 8 excluding loans to borrowers based in China. As in the above-described robustness check excluding
USA-based borrowers, while the statistical significance of some results is somewhat reduced, likely due to the
smaller sample size, coefficient estimates are largely unaffected.

30
4. Conclusions
The empirical analysis in this study is structured as a test of the market-failure view of state ownership
(state ownership is a response to a lack of private-sector involvement: Gerschenkron, 1962; Atkinson and Stiglitz,
1980), in contrast with the commercial view (state-owned institutions share the same commercial goals of the
private sector). The “market failures” used as testing grounds are weak legal systems, which have been found to
hamper the development of private financial markets (LLSV, 1997 and 1998), and banking crises, which lead to a
reduction in the availability of private credit (Laeven and Valencia, 2010; Sudheer and Purnanandam, 2011).
Probit model estimation reveals that government lending accounts for a higher proportion of all loans in
countries with weak protection of ownership rights, in non-common law countries, and during banking crises. In
terms of borrower characteristics, results are mixed, as governments tend to lend to institutions that do not have
previous private-sector loans (an indication of restricted access to capital) but also to larger firms (which should
have easier access to funding).
Multinomial logit modeling of the government role in lending indicates that both sole lending and loan
arranging by government lenders are more likely in the presence of weak legal systems and during banking crises.
This evidence indicates that, in the presence of market failures, government lenders not only provide credit, but
facilitate borrower’s access to private credit markets as well. Analysis of the share of the loan retained by
government lenders partially supports the market-failure view. While governments retain (rather than syndicate)
larger shares of loans in the presence of weak protection of creditor rights, government lenders – in particular,
domestic government lenders – retain larger shares of loans in common law counties. Banking crises do not
significantly affect the share of the loan retained by government lenders. Government lenders further retain
smaller loan shares to borrowers with previous private sector loans and domestic government lenders retain
smaller stakes in loans to listed borrowers.
When analyzing loan characteristics, I control for selection biases by employing propensity-score
matching. Results indicate that government loans involve larger syndicates and longer maturities, are less
frequently collateralized, and carry a 21 bps discount. Terms of government loans are especially borrower-
friendly in the presence of weak property rights. Surprisingly, foreign government lenders provide loans at a
31
larger discount than domestic government lenders. Further analysis indicates that government subsidization does
not apply to loans to borrowers that have access to private lending markets, which supports the view that
government lending is not “crowding out” private-sector activity.
Two sets of results open interesting avenues for future extensions. First, the unexpected finding that
foreign government activity is consistent with the market-failure view leads to question why do governments
provide support to foreign markets and firms. One possible explanation is that this result is due to the activities of
supranational lenders (such as the Inter-American Development Bank) or to those of “import-export” banks. I
plan to further investigate the issue in future extensions. Second, the finding that government presence and
arranging activity induces private-sector syndicate members to accept more borrower-friendly loan terms is
suggestive of a facilitating role of government lenders which warrants further investigation.
This study contributes to the literature on state ownership by offering insights into the main motivation
for government intervention in lending markets. Results strongly indicate that government lenders allocate loans
differently than private lenders, in contrast with the commercial view of state ownership. Results are mostly
consistent with the market-failure view of state ownership. The implications of (government) lending activity in
the presence of weak legal systems or during banking crisis should not be underestimated. By providing credit
when otherwise scarce and by facilitating borrower access to private-sector lenders, state-owned lenders relax
financial constraints that are shown to seriously hamper economic growth (Beck and Demirguc-Kunt, 2006;
Dell’Ariccia, Detragiache, and Rajan, 2008).
The practical implications are clear. Regardless of the causes of legal system weakness (and it is plausible
that the government itself is to blame), government lending activity serves an important substitution role for
reluctant private-sector lending. Yet, that should not be interpreted as implying that state ownership is welfare-
maximizing or otherwise desirable – previous research indicates that state ownership might lead to inefficiency
and political distortions in fund allocations. Rather, results suggest that forcing privatizations in an environment
lacking strong protection of property rights could exacerbate financial constraints for corporate borrowers.

32
References
Andrianova, Svetlana, Panicos Demetriades and Anja Shortland (2010), “Is State ownership of Banks Really Harmful to
Growth?,” Working Paper.
Atkinson, Anthony B. and Joseph E. Stiglitz (1980), “Lectures on Public Economics,” London, Mc-Graw Hill.
Bae, Kee-Hong and Vidhan K. Goyal (2009), “Creditor Rights, Enforcement, and Bank Loans,” Journal of Finance, 64(2):
823-860.
Beck, Thorsten and Asli Demirguc-Kunt (2006), “Small and medium-size enterprises: Access to finance as a growth
constraint,” Journal of Banking and Finance, 30(11): 2931-2943.
Boardman, Anthony E. and Aidan R. Vining (1989), “Ownership and performance in competitive environments: a
comparison of the performance of private, mixed, and state-owned enterprises,” Journal of Law and Economics, 32: 1-
33.
Bortolotti, Bernardo, Veljko Fotak and William L. Megginson (2010), “Quiet Leviathans: Sovereign Wealth Fund
Investment, Passivity, and the Value of the Firm,” University of Oklahoma Working Paper.
Borisova, Ginka, Veljko Fotak, Kate Holland and William L. Megginson (2012), “State ownership and Cost of Debt:
Evidence from Government Investments in Publicly Traded Firms”, University of Oklahoma and Iowa State University
Working Paper.
Boubakri, Narjess, Jean-Claude Cosset and Omrane Guedhami (2005), “Postprivatization corporate governance: the role of
ownership structure and investor protection,” Journal of Financial Economics 76: 369-399.
Caprio, Gerard, Luc Laeven and Ross Levine (2007), “Governance and bank valuation,” Journal of Financial Intermediation,
16: 584–617.
Carey, Mark and Mark Hrycray (1999), “Credit Flow, Risk, and the Role of Private Debt in Capital Structure,” Working
Paper, Federal Reserve Board.
Chava, Sudheer and Amiyatosh Purnanandam (2011), “The effect of banking crisis on bank-dependent borrowers,” Journal
of Financial Economics, 99: 116-135.
Chava, Sudheer and Michael R. Roberts (2008), “How Does Financing Impact Investment? The Role of Debt Covenants,”
The Journal of Finance, 63(5): 2085-2121.
Chen, Gongmeng, Michael Firth and Liping Xu (2009), “Does the type of ownership control matter? Evidence from China’s
listed companies,” Journal of Banking & Finance, 33: 171-181.
DeBonis, Riccardo (1998), “Public Sector Banks in Italy: Past and Present,” Working Paper.
Dell’Ariccia, Giovanni, Enrica Detragiache and Raghuram Rajan (2008), “The real effect of banking crises,” Journal of
Financial Intermediation, 17: 89-112.
Dinç, I. Serdar (2005), “Politicians and banks: Political influences on state-owned banks in emerging markets,” Journal of
Financial Economics 77: 453-479.
Djankov, Simeon and Peter Murrell (2002), “Enterprise restructuring in transition: A quantitative survey,” Journal of
Economic Literature, 40: 739-792.
Easton, Stephen T. and Michael A. Walker (1997), “Income, Growth and Economic Freedom,” American Economic Review,
87(2): 328-332.

33
Eckel Catherine C. and Theo Vermaelen (1986), “Internal Regulation: The Effects of State ownership on the Value of the
Firm,” The Journal of Law and Economics, 29: 381-403.
Estrin, Saul, Jan Hanousek, Evžen Kočenda and Jan Svejnar (2009), “The effects of privatization and ownership in transition
economies,” Journal of Economic Literature, 47: 699-728.
Esty, Benjamin C. and William L. Megginson (2003), “Creditor Rights, Enforcement, and Debt Ownership Structure:
Evidence from the Global Syndicated Loan Market,” Journal of Financial and Quantitative Analysis, 38(1): 37-59.
Friedman, Milton (1962), “Capitalism and Freedom,” Chicago, University of Chicago Press.
Gerschenkron, Alexander (1962), “Economic Backwardness in Historical Perspective. A Book of Essays,” Cambridge, MA,
Harvard University Press.
Greenwald, Bruce and Joseph E. Stiglitz (1986), “Externalities in Economies with Imperfect Information and Incomplete
Markets,” Quarterly Journal of Economics, 101: 229-6
Guner, Burak A. (2006), “Loan Sales and the Cost of Corporate,” The Review of Financial Studies, 19 (2): 687-716.
Haselmann, Rainer and Paul Wachtel (2010), “Foreign banks in syndicated loan markets,” Journal of Banking and Finance,
35(10): 2679-2689.
Heckman, James (1979), “Sample selection bias as a specification error,” Econometrica, 47(1): 153-61.
Khwaja, Asim Ijaz and Atif Mian (2005), “Do lenders favor politically connected firms? Rent provision in an emerging
financial market,” Quarterly Journal of Economics, 120: 1371–1411.
Laeven, Luc and Fabian Valencia (2010), “Resolution of Banking Crises: The Good, the Bad, and the Ugly,” IMF Working
Paper.
La Porta, Rafael, Florencio Lopez-de-Silanes, Andrei Shleifer and Robert Vishny (1997), “Legal Determinants of External
Finance,” Journal of Finance, 52: 1131-1150.
La Porta, Rafael, Florencio Lopez-de-Silanes, Andrei Shleifer and Robert Vishny (1998), “Law and Finance,” Journal of
Political Economy, 106: 1113–1155.
La Porta, Rafael, Florencio Lopez-de-Silanes, and Andrei Shleifer (2002), “State ownership of banks”, Journal of Finance,
57(1): 256-301.
Lowry, Michelle, Micha S. Officer and William G. Schwert (2010), “The Variability of IPO Initial Returns,” Journal of
Finance, 65(2): 425-465.
Megginson, William L. and Jeffrey M. Netter (2001), “From state to market: A survey of empirical studies on privatization,”
Journal of Economic Literature, 39: 321-389.
Petersen, Mitchell A. (2009), “Estimating Standard Errors in Finance Panel Data Sets: Comparing Approaches,” Review of
Financial Studies, 22(1): 435-480.
Qian, Jun and Philip E. Strahan (2007), “How Laws and Institutions Shape Financial Contracts: The Case of Bank Loans”,
Journal of Finance, 62(6): 2803-2834.
Sapienza, Paola (2004), “The effects of state ownership on bank lending,” Journal of Financial Economics, 72: 357–384.
Sargan, John D. (1958), “The Estimation of Economic Relationships Using Instrumental Variables,” Econometrica, 26: 393-
415.
Shleifer, Andrei (1998), “State versus Private Ownership,” The Journal of Economic Perspectives, 12: 133-150.
34
Shleifer, Andrei and Robert W. Vishny (1994), “Politicians and Firms,” Quarterly Journal of Economics, 109: 995-1025.
Shleifer, Andrei and Robert W. Vishny (1998), “The Grabbing Hand: Government Pathologies and Their Cures,” Cambridge,
MA, Harvard University Press.
Skinner, Chris J., Holt, D., and Fred T. M. Smith (1989), “Analysis of Complex Surveys,” New York, John Wiley & Sons.
Stiglitz, Joseph E. (1993), “The Role of the State in Financial Markets,” Proceedings of the World Bank Annual Conference
on Economic Development: 19-56.
Stigliz, Joseph E. and Andrew Weiss (1981), “Credit Rationing in Markets with Imperfect Information,” American Economic
Review, 71: 393-410.
Sufi, Amir (2009), “Bank Lines of Credit in Corporate Finance: An Empirical Analysis,” Review of Financial Studies, 22 (3):
1057-1088.
Sun, Qian and Wilson Tong (2003), “China’s share issue privatization: The extent of its success,” Journal of Financial
Economics, 70: 183-222.
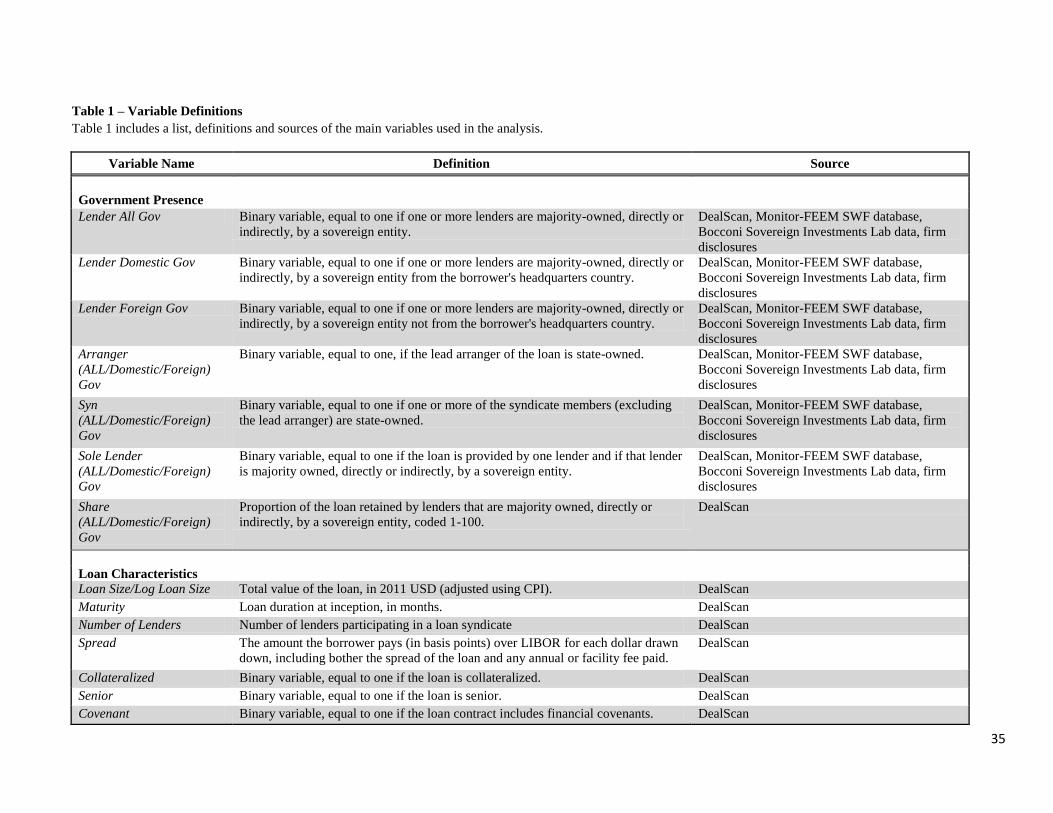
35
Table 1 – Variable Definitions
Table 1 includes a list, definitions and sources of the main variables used in the analysis.
Variable Name Definition Source
Government Presence
Lender All Gov Binary variable, equal to one if one or more lenders are majority-owned, directly or
indirectly, by a sovereign entity.
DealScan, Monitor-FEEM SWF database,
Bocconi Sovereign Investments Lab data, firm
disclosures
Lender Domestic Gov Binary variable, equal to one if one or more lenders are majority-owned, directly or
indirectly, by a sovereign entity from the borrower's headquarters country.
DealScan, Monitor-FEEM SWF database,
Bocconi Sovereign Investments Lab data, firm
disclosures
Lender Foreign Gov Binary variable, equal to one if one or more lenders are majority-owned, directly or
indirectly, by a sovereign entity not from the borrower's headquarters country.
DealScan, Monitor-FEEM SWF database,
Bocconi Sovereign Investments Lab data, firm
disclosures
Arranger
(ALL/Domestic/Foreign)
Gov
Binary variable, equal to one, if the lead arranger of the loan is state-owned. DealScan, Monitor-FEEM SWF database,
Bocconi Sovereign Investments Lab data, firm
disclosures
Syn
(ALL/Domestic/Foreign)
Gov
Binary variable, equal to one if one or more of the syndicate members (excluding
the lead arranger) are state-owned.
DealScan, Monitor-FEEM SWF database,
Bocconi Sovereign Investments Lab data, firm
disclosures
Sole Lender
(ALL/Domestic/Foreign)
Gov
Binary variable, equal to one if the loan is provided by one lender and if that lender
is majority owned, directly or indirectly, by a sovereign entity.
DealScan, Monitor-FEEM SWF database,
Bocconi Sovereign Investments Lab data, firm
disclosures
Share
(ALL/Domestic/Foreign)
Gov
Proportion of the loan retained by lenders that are majority owned, directly or
indirectly, by a sovereign entity, coded 1-100.
DealScan
Loan Characteristics
Loan Size/Log Loan Size Total value of the loan, in 2011 USD (adjusted using CPI). DealScan
Maturity Loan duration at inception, in months. DealScan
Number of Lenders Number of lenders participating in a loan syndicate DealScan
Spread The amount the borrower pays (in basis points) over LIBOR for each dollar drawn
down, including bother the spread of the loan and any annual or facility fee paid.
DealScan
Collateralized Binary variable, equal to one if the loan is collateralized. DealScan
Senior Binary variable, equal to one if the loan is senior. DealScan
Covenant Binary variable, equal to one if the loan contract includes financial covenants. DealScan

36
Table 1 – Variable Definitions, Continued Variable Name Definition Source
Country Characteristics
Size of the Government Index measuring the government role in the economy, coded on a 1-10 scale,
where higher values indicate a weaker role.
Economic Freedom of the World, index for 'Size
of Government: expenditures, Taxes, and
Enterprises' (A1)
Property Rights Index measuring the strength of the legal environment and the security of property
rights, coded on a 1-10 scale, where higher values indicate stronger protection.
Economic Freedom of the World, index for
'Legal Structure and Security of Property Rights'
(A2)
Investment Profile An index measuring factors affecting the risk to investment, based on the
subcomponents: 'Contract Viability/Expropriation', 'Pofits Repatriation' and
'Payment Delays'.
International Country Risk Guide
GDP Growth Percentage change in gross domestic product, yearly. World Bank
Common Law Binary variable, equal to one if the country of borrower headquarters is of common
law origin.
La Porta et al. (2002)
Crisis Binary variable, equal to one if the country of the borrower headquarters is
undergoing a banking crisis in the year of loan initiation.
Laeven and Valencia (2010)
Borrower Characteristics
Gov Borrower Binary variable, equal to one if the borrower is owned, or partially owned (min
5%) by a sovereign entity.
DealScan, Monitor-FEEM SWF database, firm
disclosures
Previous Private Loan N The number of private-sector loans to the borrower over the previous five years. DealScan
Previous Gov Loan N The number of government loans to the borrower over the previous five years. DealScan
Financial Borrower Borrowers with primary SIC code 6000-6500. DealScan
Regulated Borrower Borrowers with primary SIC code 4000-5000. DealScan
Publicly Traded Borrower Binary variable, equal to one if the borrower is publicly traded. Worldscope
TA/Log TA Total Assets, in 2011 USD (adjusted using CPI). Worldscope
DTOA Debt to Assets. Worldscope
ROA Return on Assets. Worldscope
QR Quick Ratio: (Cash and Cash Equivalents+Marketable Securities+Accounts
Receivable)/(Current Liabilities)
Worldscope
TQ Tobin's Q: (Market Value of Equity+Book Value of Debt)/(Book Value of
Equity+Book Value of Debt)
Worldscope

37
Table 2 – Sample Descriptive Statistics Table 2 reports descriptive statistics for the main sample of loans. Variables are as defined in Table 1. Panel A includes
binary variables. Count is the number of observations for which the binary variable is equal to one. Proportion of Total is the
proportion of non-missing observations for which the binary variable is equal to one. Total Non-Missing Obs is the total
number of loans with non-missing data for the variable of interest. Panel B includes all other variables, for which it reports
mean, 1st, 25
th, 50
th, 75
th, and 99
th percentiles, standard deviation, and total number of observations.
Panel A – Binary Variables
Variable Count Proportion
of Total
Total Non-
Missing Obs
Government Presence
Lender All Gov 10,560 7.11% 148,511
Lender Domestic Gov 4,819 3.24% 148,511
Lender Foreign Gov 6,455 4.35% 148,511
Arranger Gov 3,572 2.41% 148,511
Arranger Domestic Gov 2,248 1.51% 148,511
Arranger Foreign Gov 1,468 0.99% 148,511
Syn Gov 6,375 4.29% 148,511
Syn Domestic Gov 2,413 1.62% 148,511
Syn Foreign Gov 4,532 3.05% 148,511
Single lender Gov 613 0.41% 148,300
Single lender Domestic Gov 158 0.11% 148,300
Single lender Foreign Gov 455 0.31% 148,300
Loan
Single lender 13,839 9.33% 148,300
Collateralized 13,029 8.77% 148,511
Covenant 27,185 18.31% 148,511
Senior 146,924 98.93% 148,510
Borrower
Foreign Lender 87,165 58.69% 148,511
Financial Borrower 11,700 8.37% 139,799
Regulate Borrower 21,894 15.66% 139,799
Gov Borrower 3,254 2.19% 148,511
Publicly Traded Borrower 37,421 25.20% 148,511
Country
Crisis 18,628 12.54% 148,511
Common Law 103,102 71.37% 144,467

38
Panel B – Continuous Variables
Variable Mean Std Dev 1st Pctl 25th Pctl Median 75th Pctl 99th Pctl N
Share Gov Lender 1.02% 0.08 0.00% 0.00% 0.00% 0.00% 30.00% 143,022
Share Domestic Gov Lender 0.50% 0.05 0.00% 0.00% 0.00% 0.00% 13.33% 146,298
Share Foreign Gov Lender 0.50% 0.06 0.00% 0.00% 0.00% 0.00% 8.33% 144,801
Government Size (1-10) 6.56 0.97 3.15 6.18 6.88 7.13 9.11 147,369
Property Rights (1-10) 7.83 1.07 3.90 7.51 7.90 8.66 9.23 147,369
Investment Profile (1-12) 10.25 2.02 5.75 9.00 11.50 11.75 12.00 147,591
Maturity (months) 53.38 82.70 5.00 24.00 54.00 66.00 205.00 137,081
Loan Size (USD) 282,230,387 848,304,310 54,224 17,315,193 74,723,240 237,068,928 3,273,263,161 148,200
Previous Gov Loan N 0.13 0.73 0.00 0.00 0.00 0.00 4.00 148,506
Previous Private Loan N 1.74 2.94 0.00 0.00 0.00 3.00 13.00 148,506
GDP Growth 2.95% 0.03 -6.29% 1.93% 2.87% 4.15% 11.30% 148,156
TA 9,709,326 42,126,635 19,358 403,472 1,405,455 5,085,716 135,273,981 37,421
DtoA 0.66 0.52 0.13 0.50 0.64 0.78 1.55 37,086
QR 1.86 22.72 0.09 0.59 0.89 1.31 22.35 32,414
ROA 4.19% 68.28% -44.12% 1.42% 4.59% 7.91% 27.52% 35,078
TQ 1.65 24.51 0.30 0.88 1.16 1.58 6.15 35,551
Spread (bps) 210.86 152.72 15.00 90.00 200.00 300.00 750.00 100,056
Number of Lenders 6.96 7.55 1.00 2.00 4.00 9.00 36.00 148,511

39
Table 3 – Univariate Analysis
Table 3 reports means of the listed variables, defined as in Table 1. The overall sample (148,511 loans) is divided into subsets: the first column includes all loans
not involving government lenders (137,951 loans), the second all loans involving government lenders (10,560 loans), the third all loans involving domestic
government lender (4,819 loans) and the fourth fall loans involving foreign government lenders (6,455 loans). Reported p-values (in gray, italicized) for binary
variables are based on Pearson’s Chi-Square tests for differences in frequencies between each of the government subsets and the set of loans with no government
presence; standard errors are clustered at the loan package level. Reported p-values for non-binary variables are based on two-sample t-tests for differences in
means; standard errors are clustered at the loan package level and levels of significance are two-sided.
No Gov All Gov Domestic Gov Foreign Gov
Loan Characteristics
Spread 213.55 138.28 <0.0001 127.47 <0.0001 142.81 <0.0001
Number of Lenders 6.40 12.86 <0.0001 11.17 <0.0001 14.65 <0.0001
Collateralized 8.47% 12.71% <0.0001 11.37% <0.0001 13.37% <0.0001
Covenants 18.86% 11.10% <0.0001 10.33% <0.0001 11.12% <0.0001
Senior 98.92% 99.03% 0.3624 98.59% 0.1003 99.41% <0.0001
Sole Lender 9.60% 5.81% <0.0001 3.28% <0.0001 7.06% <0.0001
Maturity 51.27 65.94 <0.0001 73.61 <0.0001 60.55 <0.0001
Foreign Lender 56.86% 82.66% <0.0001 62.00% 0.0006 100.00% NA
Loan Size $246,706,874 $307,484,248 <0.0001 $208,700,967 <0.0001 $397,967,096 <0.0001
Country Characteristics
Government Size 6.56 6.62 0.0002 6.57 0.68 6.69 <0.0001
Property Rights 7.92 6.68 <0.0001 6.58 <0.0001 6.75 <0.0001
Investment Profile 10.30 9.73 <0.0001 9.83 <0.0001 9.65 <0.0001
Common Law 73.14% 44.18% <0.0001 34.83% <0.0001 50.98% <0.0001
Crisis 12.68% 10.81% <0.0001 9.79% <0.0001 10.98% 0.0031
GDP Growth 2.75% 5.19% <0.0001 6.13% <0.0001 4.48% <0.0001
Borrower Characteristics
TA $7,546,534 $14,120,081 <0.0001 $9,415,248 0.1968 $18,032,275 <0.0001
DtoA 0.64 0.66 0.0031 0.62 0.0083 0.68 <0.0001
QR 1.41 1.49 0.4975 1.64 0.2005 1.36 0.6318
ROA 3.61% 4.71% <0.0001 4.77% 0.0029 5.11% <0.0001
TQ 1.40 1.13 <0.0001 1.07 <0.0001 1.20 <0.0001
Publicly Traded Borrower 25.53% 20.80% <0.0001 20.96% <0.0001 20.42% <0.0001
Previous Gov Loans 0.08 0.79 <0.0001 0.80 <0.0001 0.81 <0.0001
Previous Priv Loans 1.79 1.06 <0.0001 0.71 <0.0001 1.28 <0.0001
Financial Borrower 7.69% 17.18% <0.0001 6.95% 0.0007 24.36% <0.0001
Regulated Borrower 15.16% 22.13% <0.0001 24.22% <0.0001 20.66% <0.0001
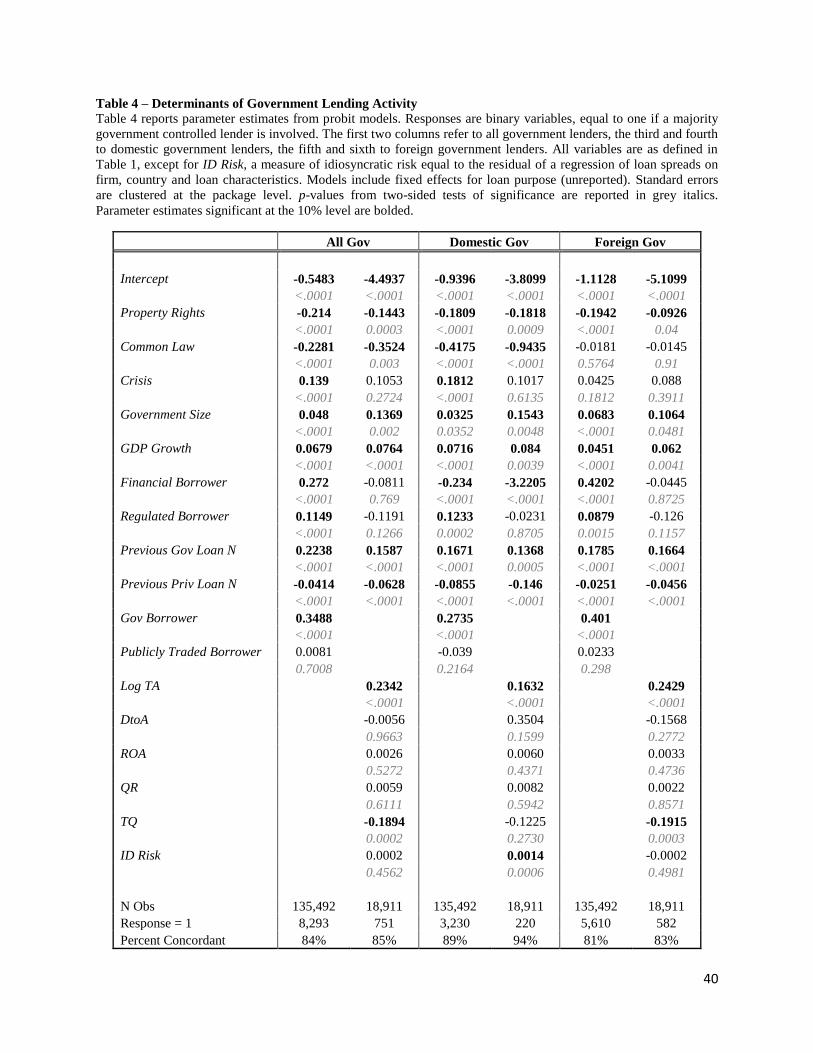
40
Table 4 – Determinants of Government Lending Activity
Table 4 reports parameter estimates from probit models. Responses are binary variables, equal to one if a majority
government controlled lender is involved. The first two columns refer to all government lenders, the third and fourth
to domestic government lenders, the fifth and sixth to foreign government lenders. All variables are as defined in
Table 1, except for ID Risk, a measure of idiosyncratic risk equal to the residual of a regression of loan spreads on
firm, country and loan characteristics. Models include fixed effects for loan purpose (unreported). Standard errors
are clustered at the package level. p-values from two-sided tests of significance are reported in grey italics.
Parameter estimates significant at the 10% level are bolded.
All Gov Domestic Gov Foreign Gov
Intercept -0.5483 -4.4937 -0.9396 -3.8099 -1.1128 -5.1099
<.0001 <.0001 <.0001 <.0001 <.0001 <.0001
Property Rights -0.214 -0.1443 -0.1809 -0.1818 -0.1942 -0.0926
<.0001 0.0003 <.0001 0.0009 <.0001 0.04
Common Law -0.2281 -0.3524 -0.4175 -0.9435 -0.0181 -0.0145
<.0001 0.003 <.0001 <.0001 0.5764 0.91
Crisis 0.139 0.1053 0.1812 0.1017 0.0425 0.088
<.0001 0.2724 <.0001 0.6135 0.1812 0.3911
Government Size 0.048 0.1369 0.0325 0.1543 0.0683 0.1064
<.0001 0.002 0.0352 0.0048 <.0001 0.0481
GDP Growth 0.0679 0.0764 0.0716 0.084 0.0451 0.062
<.0001 <.0001 <.0001 0.0039 <.0001 0.0041
Financial Borrower 0.272 -0.0811 -0.234 -3.2205 0.4202 -0.0445
<.0001 0.769 <.0001 <.0001 <.0001 0.8725
Regulated Borrower 0.1149 -0.1191 0.1233 -0.0231 0.0879 -0.126
<.0001 0.1266 0.0002 0.8705 0.0015 0.1157
Previous Gov Loan N 0.2238 0.1587 0.1671 0.1368 0.1785 0.1664
<.0001 <.0001 <.0001 0.0005 <.0001 <.0001
Previous Priv Loan N -0.0414 -0.0628 -0.0855 -0.146 -0.0251 -0.0456
<.0001 <.0001 <.0001 <.0001 <.0001 <.0001
Gov Borrower 0.3488 0.2735 0.401
<.0001 <.0001 <.0001
Publicly Traded Borrower 0.0081 -0.039 0.0233
0.7008 0.2164 0.298
Log TA 0.2342 0.1632 0.2429
<.0001 <.0001 <.0001
DtoA -0.0056 0.3504 -0.1568
0.9663 0.1599 0.2772
ROA 0.0026 0.0060 0.0033
0.5272 0.4371 0.4736
QR 0.0059 0.0082 0.0022
0.6111 0.5942 0.8571
TQ -0.1894 -0.1225 -0.1915
0.0002 0.2730 0.0003
ID Risk 0.0002 0.0014 -0.0002
0.4562 0.0006 0.4981
N Obs 135,492 18,911 135,492 18,911 135,492 18,911
Response = 1 8,293 751 3,230 220 5,610 582
Percent Concordant 84% 85% 89% 94% 81% 83%

41
Table 5. Government Role
Table 5 reports parameter estimates from multinomial logit models. The first two columns refer to all government
lenders, the third and fourth to domestic government lenders, the fifth and sixth to foreign government lenders. In
each model, the response is a categorical variable equal to ‘1’ if the government lender is a single lender, ‘2’ if the
government lender is a loan arranger, ‘3’ if the government lender is a syndicate member (but not arranger). Results
reported are for comparisons between group 1 (sole lenders) and group 3 (syndicate members) and between group 2
(arrangers) and group 3 (syndicate members). All variables are as defined in Table 1, except for ID Risk, a measure
of idiosyncratic risk equal to the residual of a regression of loan spreads on firm, country and loan characteristics.
All models include loan purpose fixed effects (unreported). Standard errors are clustered at the loan package level.
p-values from two-sided tests of significance are reported under the parameter estimates, in grey italics. Parameter
estimates significant at the 10% level are bolded.
All Government Domestic Government Foreign Government
Arranger Sole Lender Arranger Sole Lender Arranger Sole Lender
Intercept -0.4956 0.0737 -2.2844 -2.0034 -1.1505 -0.5216
0.1912 0.9146 0.0027 0.2152 0.0243 0.5048
Property Rights -0.1354 -0.3944 0.0248 -0.0822 -0.1131 -0.3132
<.0001 <.0001 0.7543 0.5776 0.0102 <.0001
Common Law -0.3475 -0.4227 -0.5281 -0.7671 -0.184 -0.3882
0.0011 0.0092 0.0034 0.0441 0.2008 0.095
Crisis 0.7373 0.1152 1.0641 0.7204 0.6678 -0.1344
<.0001 0.5212 <.0001 0.0343 <.0001 0.5668
Government Size 0.1055 0.0758 0.345 0.1984 0.0869 0.0274
0.0026 0.1957 <.0001 0.1304 0.075 0.6675
GDP Growth 0.0323 -0.0613 0.0682 -0.0646 -0.00517 -0.0509
0.0135 0.0051 0.0071 0.1216 0.7614 0.0678
Financial Borrower -0.7104 -0.8042 -0.571 -1.1536 -0.3915 -0.5999
<.0001 <.0001 0.0017 0.0075 0.0014 0.0057
Regulated Borrower 0.1185 -0.1496 0.1257 0.1678 0.0509 -0.3272
0.2226 0.3072 0.3876 0.508 0.7233 0.0976
Gov Borrower 0.3585 0.3047 0.2678 0.0541 0.3386 0.1403
0.0009 0.0849 0.1789 0.9017 0.0129 0.5751
Previous Gov Loan N 0.1333 0.0693 0.105 -0.0233 0.1198 0.0528
<.0001 0.0509 0.0051 0.6755 <.0001 0.4314
Previous Priv Loan N -0.1241 -0.0251 -0.072 0.1363 -0.1123 -0.0465
<.0001 0.3417 0.0946 0.0051 <.0001 0.2237
Publicly Traded Borrower -0.3008 -0.2005 0.0213 -0.1395 -0.4977 -0.00184
0.0008 0.1827 0.8867 0.617 <.0001 0.9921
N Syndicate Member 5,226 5,226 1,554 1,554 4,133 4,133
N Arranger 2,566 2,566 1,534 1,534 1,118 1,118
N Sole Lender 501 501 142 142 359 359
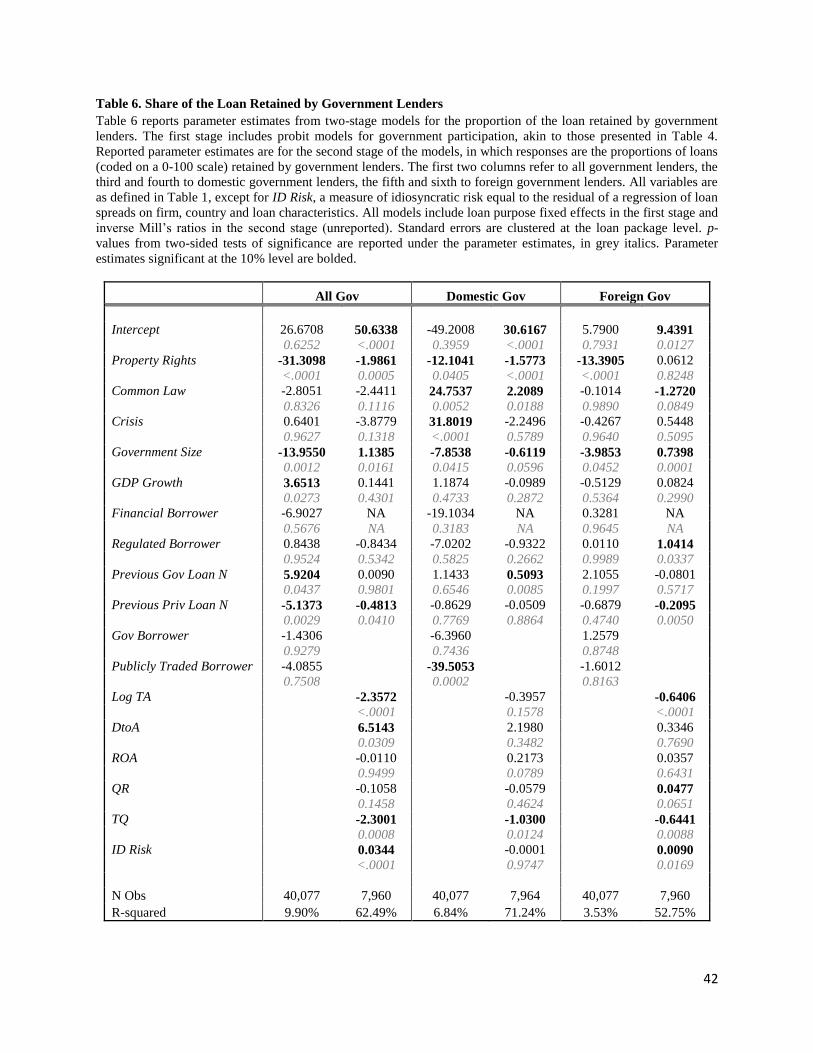
42
Table 6. Share of the Loan Retained by Government Lenders
Table 6 reports parameter estimates from two-stage models for the proportion of the loan retained by government
lenders. The first stage includes probit models for government participation, akin to those presented in Table 4.
Reported parameter estimates are for the second stage of the models, in which responses are the proportions of loans
(coded on a 0-100 scale) retained by government lenders. The first two columns refer to all government lenders, the
third and fourth to domestic government lenders, the fifth and sixth to foreign government lenders. All variables are
as defined in Table 1, except for ID Risk, a measure of idiosyncratic risk equal to the residual of a regression of loan
spreads on firm, country and loan characteristics. All models include loan purpose fixed effects in the first stage and
inverse Mill’s ratios in the second stage (unreported). Standard errors are clustered at the loan package level. p-
values from two-sided tests of significance are reported under the parameter estimates, in grey italics. Parameter
estimates significant at the 10% level are bolded.
All Gov Domestic Gov Foreign Gov
Intercept 26.6708 50.6338 -49.2008 30.6167 5.7900 9.4391
0.6252 <.0001 0.3959 <.0001 0.7931 0.0127
Property Rights -31.3098 -1.9861 -12.1041 -1.5773 -13.3905 0.0612
<.0001 0.0005 0.0405 <.0001 <.0001 0.8248
Common Law -2.8051 -2.4411 24.7537 2.2089 -0.1014 -1.2720
0.8326 0.1116 0.0052 0.0188 0.9890 0.0849
Crisis 0.6401 -3.8779 31.8019 -2.2496 -0.4267 0.5448
0.9627 0.1318 <.0001 0.5789 0.9640 0.5095
Government Size -13.9550 1.1385 -7.8538 -0.6119 -3.9853 0.7398
0.0012 0.0161 0.0415 0.0596 0.0452 0.0001
GDP Growth 3.6513 0.1441 1.1874 -0.0989 -0.5129 0.0824
0.0273 0.4301 0.4733 0.2872 0.5364 0.2990
Financial Borrower -6.9027 NA -19.1034 NA 0.3281 NA
0.5676 NA 0.3183 NA 0.9645 NA
Regulated Borrower 0.8438 -0.8434 -7.0202 -0.9322 0.0110 1.0414
0.9524 0.5342 0.5825 0.2662 0.9989 0.0337
Previous Gov Loan N 5.9204 0.0090 1.1433 0.5093 2.1055 -0.0801
0.0437 0.9801 0.6546 0.0085 0.1997 0.5717
Previous Priv Loan N -5.1373 -0.4813 -0.8629 -0.0509 -0.6879 -0.2095
0.0029 0.0410 0.7769 0.8864 0.4740 0.0050
Gov Borrower -1.4306 -6.3960 1.2579
0.9279 0.7436 0.8748
Publicly Traded Borrower -4.0855 -39.5053 -1.6012
0.7508 0.0002 0.8163
Log TA -2.3572 -0.3957 -0.6406
<.0001 0.1578 <.0001
DtoA 6.5143 2.1980 0.3346
0.0309 0.3482 0.7690
ROA -0.0110 0.2173 0.0357
0.9499 0.0789 0.6431
QR -0.1058 -0.0579 0.0477
0.1458 0.4624 0.0651
TQ -2.3001 -1.0300 -0.6441
0.0008 0.0124 0.0088
ID Risk 0.0344 -0.0001 0.0090
<.0001 0.9747 0.0169
N Obs 40,077 7,960 40,077 7,964 40,077 7,960
R-squared 9.90% 62.49% 6.84% 71.24% 3.53% 52.75%

43
Table 7. Loan Characteristics, Propensity Score Matching
Table 7 compares mean characteristics of loans with government lenders to propensity-score matched loans
involving only private lenders. Tests for significance of mean differences are implemented as paired t-tests with
standard errors clustered at the package level; reported p-values are two-sided. All variables are as defined in Table
1. Differences statistically significant at the 10% level or lower are bolded. Panel A includes all government loans.
Panel B includes only loans by domestic governments, while Panel C includes only loans by foreign governments.
Panel D includes only government loans given to borrowers from a country with Property Rights scores below the
median (during the year of loan initiation). Panel E includes only government loans given to borrowers from a
country with Property Rights scores above the median (during the year of loan initiation).
Panel A – All Government Loans
Mean
Matched Sample
Mean Difference p-value N Obs
Number of Lenders 15.66 9.21 6.45 <.0001 1,216
Maturity (months) 53.97 49.93 4.04 0.0032 1,134
Loan Size $586,984,649 $579,109,309 $7,875,340 0.858 1,203
Covenants 26.07% 25.66% 0.41% 0.8459 1,216
Senior 99.01% 99.34% -0.33% 0.3932 1,216
Collateralized 17.19% 22.70% -5.51% 0.0023 1,216
Spread (bps) 128.03 148.94 -20.91 0.0291 482
Foreign Lender 92.19% 80.92% 11.27% <.0001 1,216
Panel B – Domestic Government Loans
Mean
Matched Sample
Mean Difference p-value N Obs
Number of Lenders 13.09 8.75 4.34 <.0001 472
Maturity (months) 59.40 51.46 7.94 0.0016 436
Loan Size $438,552,677 $579,917,212 -$141,364,535 0.0765 462
Covenants 7.20% 18.01% -10.81% 0.0001 472
Senior 97.67% 98.52% -0.85% 0.3696 472
Collateralized 11.44% 23.73% -12.29% <.0001 472
Spread (bps) 146.74 137.05 9.69 0.6425 137
Foreign Lender 79.87% 86.65% -6.78% 0.0094 472

44
Panel C – Foreign Government Loans
Mean
Matched Sample
Mean Difference p-value N Obs
Number of Lenders 17.43 9.29 8.14 <.0001 829
Maturity (months) 50.73 49.39 1.34 0.3716 781
Loan Size $685,315,385 $566,675,771 $118,639,614 0.0217 826
Covenants 35.34% 28.95% 6.39% 0.0193 829
Senior 99.88% 99.88% 0.00% 1 829
Collateralized 19.30% 23.04% -3.74% <.0001 829
Spread (bps) 119.53 152.69 -33.15 0.0008 374
Foreign Lender 100.00% 79.01% 20.99% <.0001 829
Panel D – Weak Property Rights
Mean
Matched Sample
Mean Difference p-value N Obs
Number of Lenders 14.82 9.04 5.78 <.0001 905
Maturity (months) 56.48 50.55 5.93 0.0003 839
Loan Size $492,903,065 $564,109,828 -$71,206,763 0.1491 896
Covenants 26.30% 22.32% 3.98% 0.0957 905
Senior 99.12% 98.90% 0.22% 0.6703 905
Collateralized 18.12% 21.88% -3.76% 0.0684 905
Spread (bps) 122.99 159.91 -36.92 0.0013 310
Foreign Lender 89.83% 80.99% 8.84% <.0001 905
Panel E – Strong Property Rights
Mean
Matched Sample
Mean Difference p-value N Obs
Number of Lenders 18.22 10.26 7.95 <.0001 285
Maturity (months) 47.97 43.20 4.77 0.0433 257
Loan Size $866,057,395 $800,473,453 $65,583,943 0.5182 285
Covenants 23.86% 27.37% -3.51% 0.3685 285
Senior 98.60% 99.65% -1.05% 0.2552 285
Collateralized 13.68% 17.89% -4.21% 0.2277 285
Spread (bps) 128.23 132.95 -4.72 0.7763 142
Foreign Lender 98.95% 84.56% 14.39% <.0001 285

45
Table 8. Loan Characteristics, Same Borrower and Year
Table 7 compares mean characteristics of loans with government involvement to loans given during the same year to
the same borrower by private entities. Tests for significance of mean differences are implemented as paired t-tests
with standard errors clustered at the package level; reported p-values are two-sided. All variables are as defined in
Table 1. Differences statistically significant at the 10% level or lower are bolded. Panel A includes all government
loans. Panel B includes only domestic government loans, while Panel C includes only foreign government loans.
Panel A – All Government Loans
Mean
Matched Sample
Mean Difference p-value N Obs
Number of Lenders 12.89 7.34 5.55 <.0001 1,505
Maturity (months) 63.30 57.81 5.49 <.0001 1,306
Loan Size $374,686,221 $327,320,599 $47,365,622 0.0042 1,495
Covenants 10.30% 8.24% 2.06% 0.001 1,505
Senior 98.80% 98.07% 0.73% 0.109 1,504
Collateralized 16.81% 17.14% -0.33% 0.7162 1,505
Spread (bps) 138.33 138.66 -0.33 0.9241 537
Foreign Lender 88.11% 85.65% 2.46% 0.0149 1,505
Panel B – Domestic Government Loans
Mean
Matched Sample
Mean Difference p-value N Obs
Number of Lenders 10.55 5.52 5.02 <.0001 497
Maturity (months) 70.44 64.43 6.01 0.0041 432
Loan Size $273,556,079 $238,270,403 $35,285,676 0.1373 494
Covenants 6.04% 4.23% 1.81% 0.0388 497
Senior 97.79% 97.38% 0.40% 0.6554 497
Collateralized 19.11% 21.13% -2.01% 0.15 497
Spread (bps) 133.00 116.86 16.14 0.1501 123
Foreign Lender 63.98% 73.24% -9.26% 0.0001 497
Panel C – Foreign Government Loans
Mean
Matched Sample
Mean Difference p-value N Obs
Number of Lenders 14.21 8.18 6.03 <.0001 1,061
Maturity (months) 59.34 54.72 4.62 <.0001 918
Loan Size $433,141,253 $376,363,710 $56,777,544 0.0073 1,054
Covenants 11.78% 9.80% 1.98% 0.0126 1,061
Senior 99.34% 98.40% 0.94% 0.0591 1,060
Collateralized 16.02% 15.55% 0.47% 0.6843 1,061
Spread (bps) 139.53 144.70 -5.17 0.0799 433
Foreign Lender 100.00% 91.89% 8.11% <.0001 1,061
Recommended