Win or Lose? How the Developer Expects to Make Money on A Redevelopment Project
1
June 5, 2018
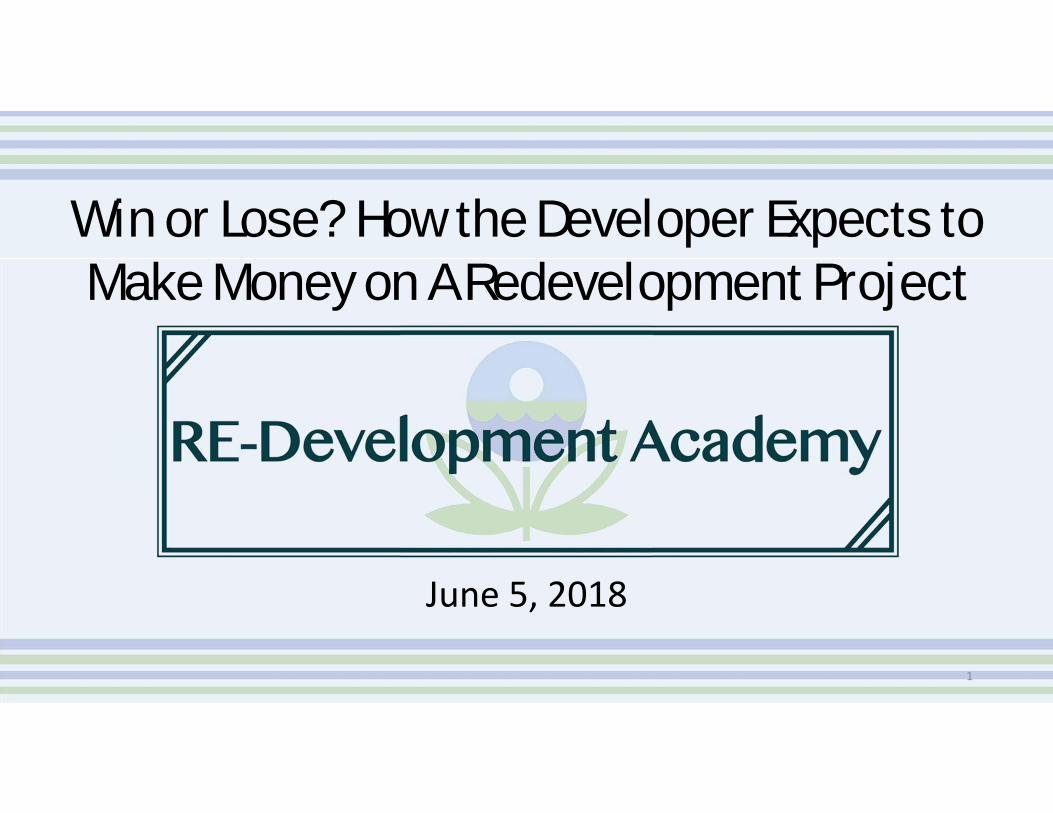
Michael Taylor, President of Vita Nuova LLC, a national consultancy, leads the repositioning and disposition of complex sites including former nuclear sites, refineries, chemical facilities and sites with significant stigma due to off‐site contamination or other issues.
Elaine Richardson has 20 years of experience in senior positions in firms servicing the real estate and environmental industries. She brings leadership and expertise to the position, ensuring that the best possible market based reuse solutions are provided to clients as well as managing tough issues with stakeholders—public, press, government, and industry.
Webinar Instructors
Barry Hersh was one of the leading Brownfields developers in the country, having managed the acquisition and redevelopment of over $500mm in environmentally impacted properties nationwide. His experience in the development field includes over 25 years in various positions including Development Director for a municipality, Executive Director of a Community Development Corporation, and senior development official for a Fortune 50 corporation and now an NYU Professor and member of Vita Nuova.
2
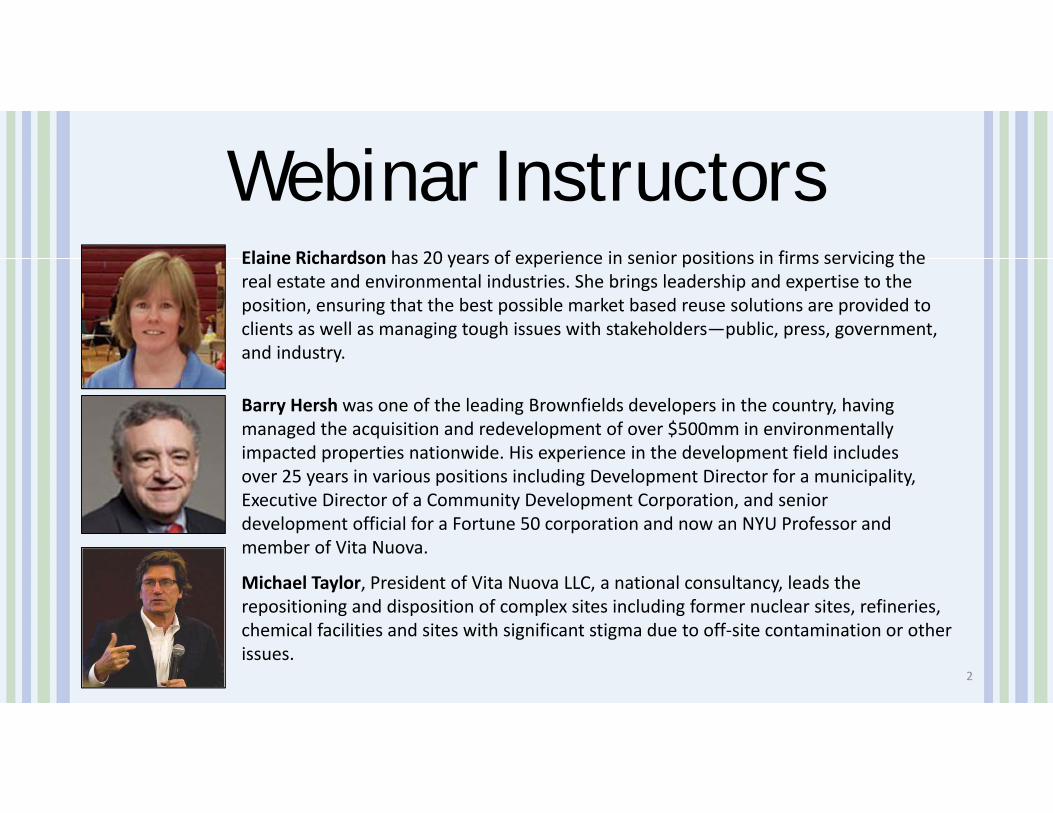
Real Estate Terms and JargonRisk – Reward Pro Forma Analysis Back of the
Envelope
Skin in the Game Cap Rate IRR Internal Rate of Return
Time Value of Money
Sources and Uses of Funds
Hard Money Lender
Leverage NPV Net Present Value
Mezzanine Debt
3
Course Objectives:• Basic understanding of how real estate developments are financed;• How environmental cleanup and liability affects decision‐making and costs;
• How real estate manages risk, and how environmental conditions change the financial equation;
• Enhance leadership and decision‐making skills by learning how regulatory decision interacts with the real estate finance process; and,
• Appreciate the contaminated properties opportunity for economic revitalization.
4
Why Real Estate Finance is Important to Environmental Regulators
• Redevelopment can finance remediation and long term controls.• There can be synergy between remediation and redevelopment that strengthens the long term sustainability of the clean up.
• Understanding how projects are financed helps regulatory agencies to craft better agreements.
• Sustainability for a contaminated property is only achieved through redevelopment. It is not enough to just clean up a site.
5
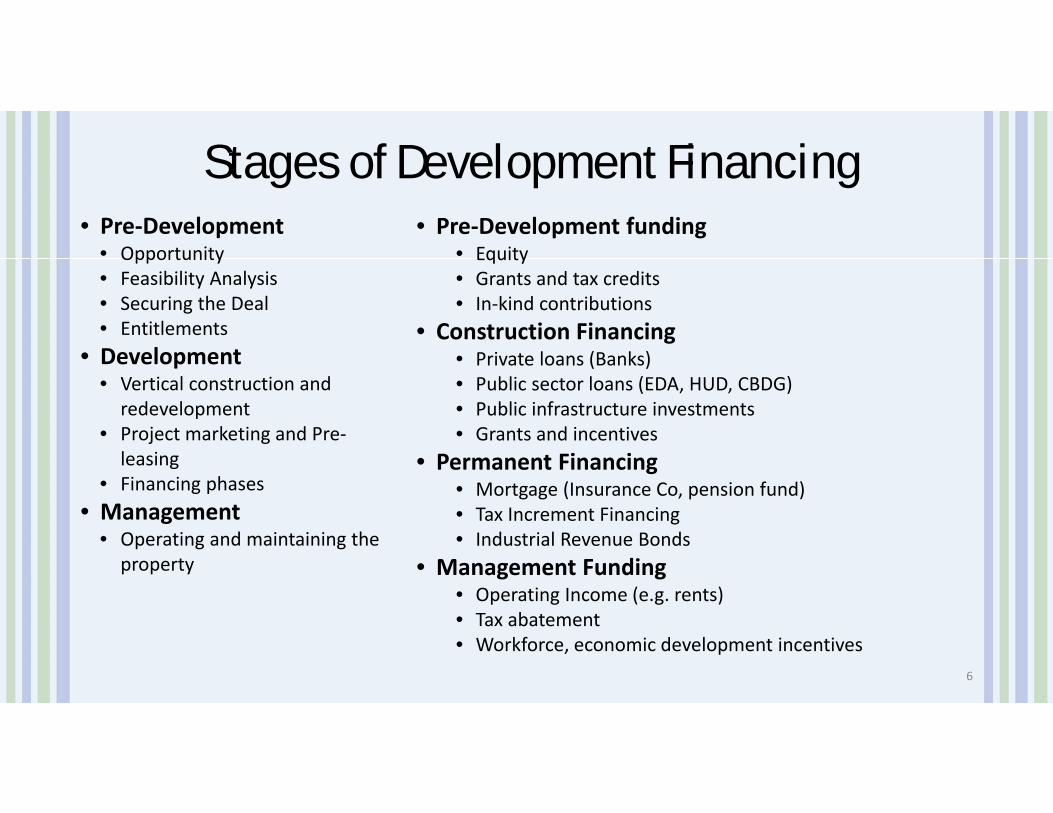
Stages of Development Financing• Pre‐Development
• Opportunity• Feasibility Analysis• Securing the Deal• Entitlements
• Development• Vertical construction and redevelopment
• Project marketing and Pre‐leasing
• Financing phases• Management
• Operating and maintaining the property
• Pre‐Development funding• Equity• Grants and tax credits• In‐kind contributions
• Construction Financing• Private loans (Banks)• Public sector loans (EDA, HUD, CBDG)• Public infrastructure investments• Grants and incentives
• Permanent Financing• Mortgage (Insurance Co, pension fund)• Tax Increment Financing• Industrial Revenue Bonds
• Management Funding• Operating Income (e.g. rents)• Tax abatement• Workforce, economic development incentives
6
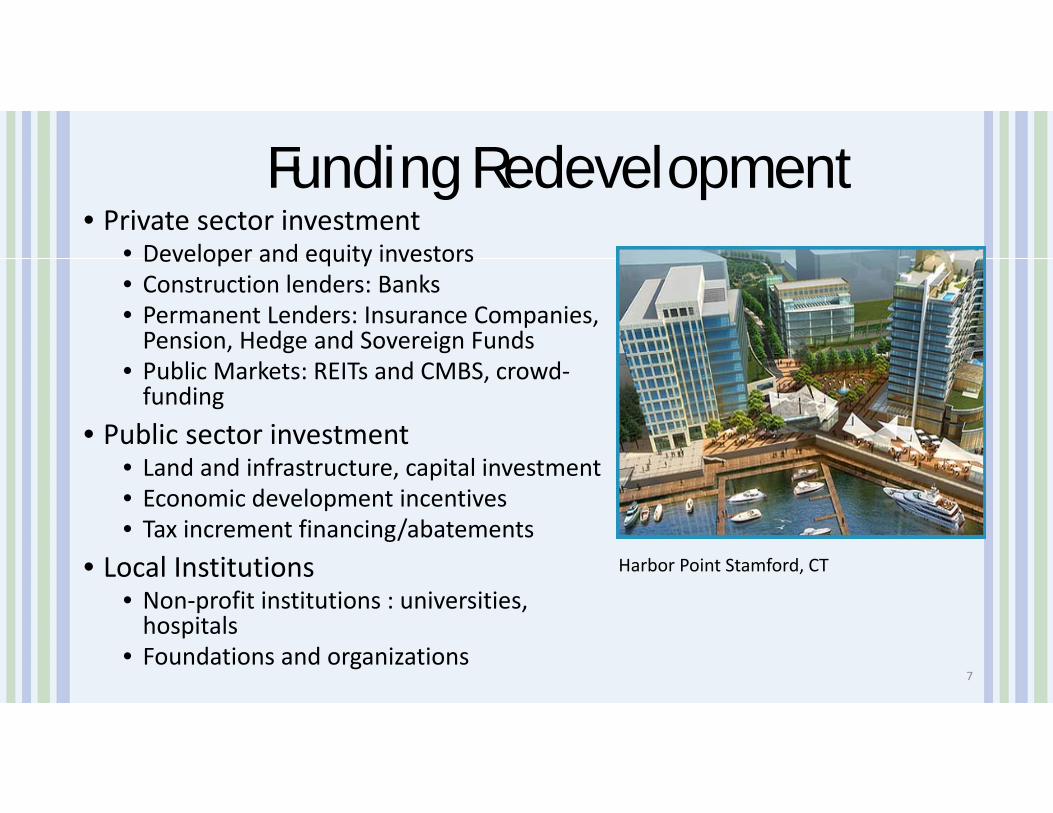
Funding Redevelopment• Private sector investment
• Developer and equity investors• Construction lenders: Banks• Permanent Lenders: Insurance Companies, Pension, Hedge and Sovereign Funds
• Public Markets: REITs and CMBS, crowd‐funding
• Public sector investment• Land and infrastructure, capital investment• Economic development incentives• Tax increment financing/abatements
• Local Institutions• Non‐profit institutions : universities, hospitals
• Foundations and organizations
Ha
Harbor Point Stamford, CT
7
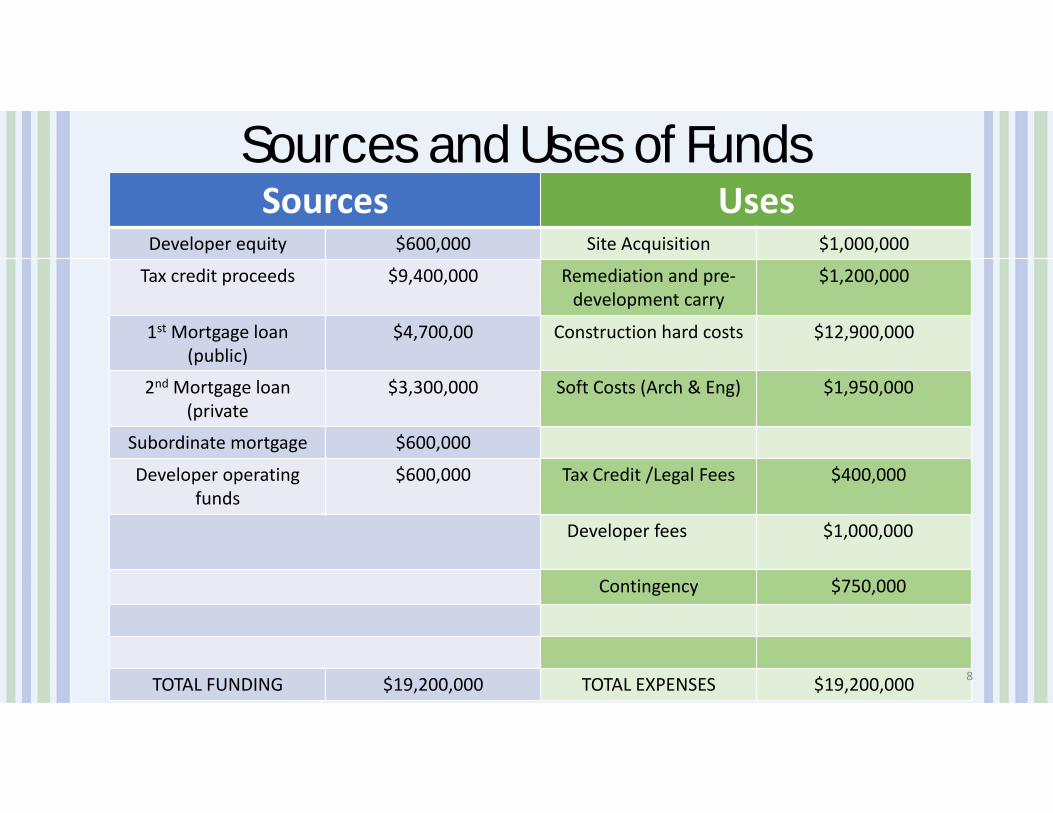
Sources and Uses of FundsSources Uses
Developer equity $600,000 Site Acquisition $1,000,000
Tax credit proceeds $9,400,000 Remediation and pre‐development carry
$1,200,000
1st Mortgage loan (public)
$4,700,00 Construction hard costs $12,900,000
2nd Mortgage loan (private
$3,300,000 Soft Costs (Arch & Eng) $1,950,000
Subordinate mortgage $600,000
Developer operating funds
$600,000 Tax Credit /Legal Fees $400,000
Developer fees $1,000,000
Contingency $750,000
TOTAL FUNDING $19,200,000 TOTAL EXPENSES $19,200,000 8
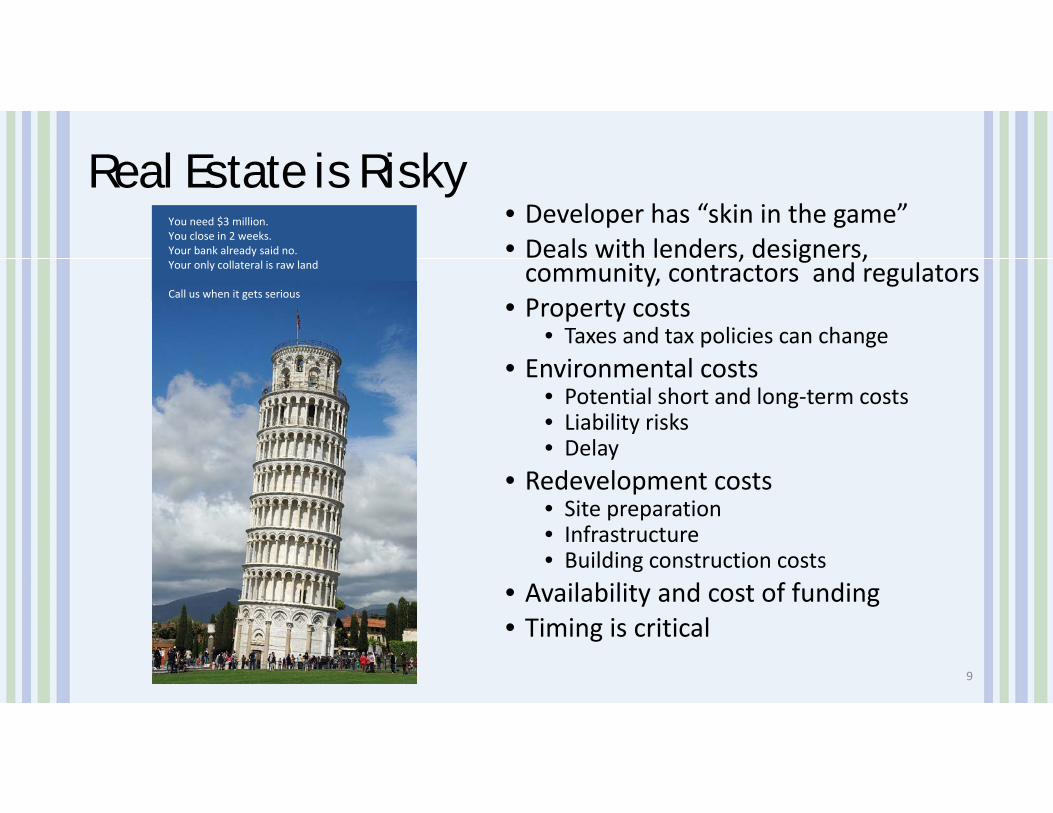
Real Estate is Risky• Developer has “skin in the game”• Deals with lenders, designers, community, contractors and regulators
• Property costs• Taxes and tax policies can change
• Environmental costs• Potential short and long‐term costs• Liability risks • Delay
• Redevelopment costs• Site preparation• Infrastructure • Building construction costs
• Availability and cost of funding• Timing is critical
You need $3 million. You close in 2 weeks. Your bank already said no. Your only collateral is raw land
Call us when it gets serious
9
Financial Feasibility• What is a Proforma?
• A statement, usually a spreadsheet, that provides a clear, numeric representation of future costs and income, and also calculates projected returns on investment.
• Often includes:• Operating or Cash Flow Statement• Income & Expense Analysis• APOD (Annual Property Operating Data)• Return on Equity• Loan information including repayment schedule
10
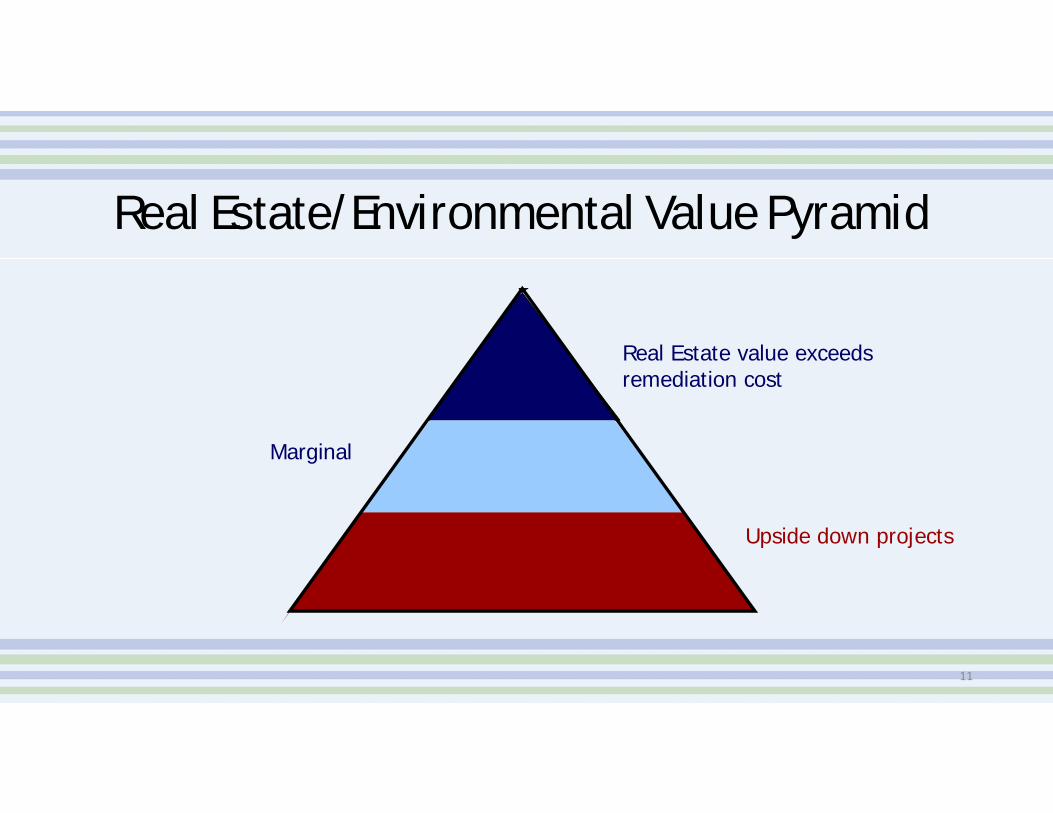
Real Estate/Environmental Value Pyramid
Real Estate value exceeds remediation cost
Marginal
Upside down projects
11
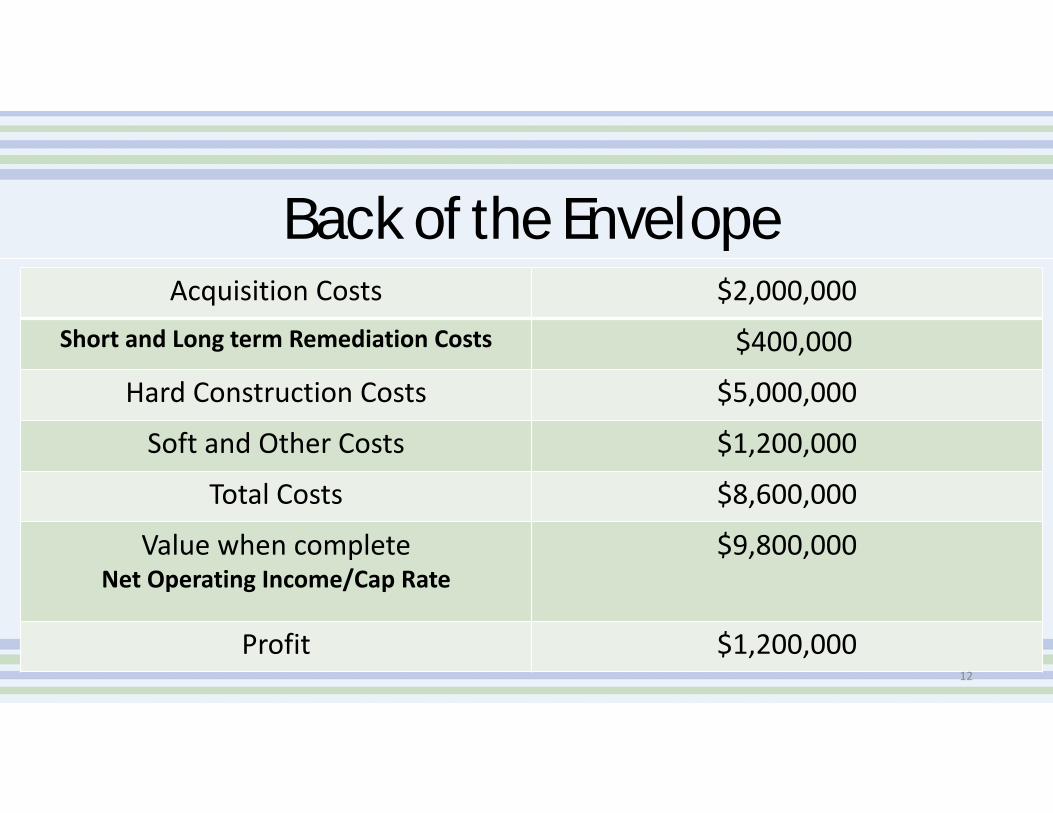
Back of the EnvelopeAcquisition Costs $2,000,000
Short and Long term Remediation Costs $400,000
Hard Construction Costs $5,000,000
Soft and Other Costs $1,200,000
Total Costs $8,600,000
Value when completeNet Operating Income/Cap Rate
$9,800,000
Profit $1,200,00012
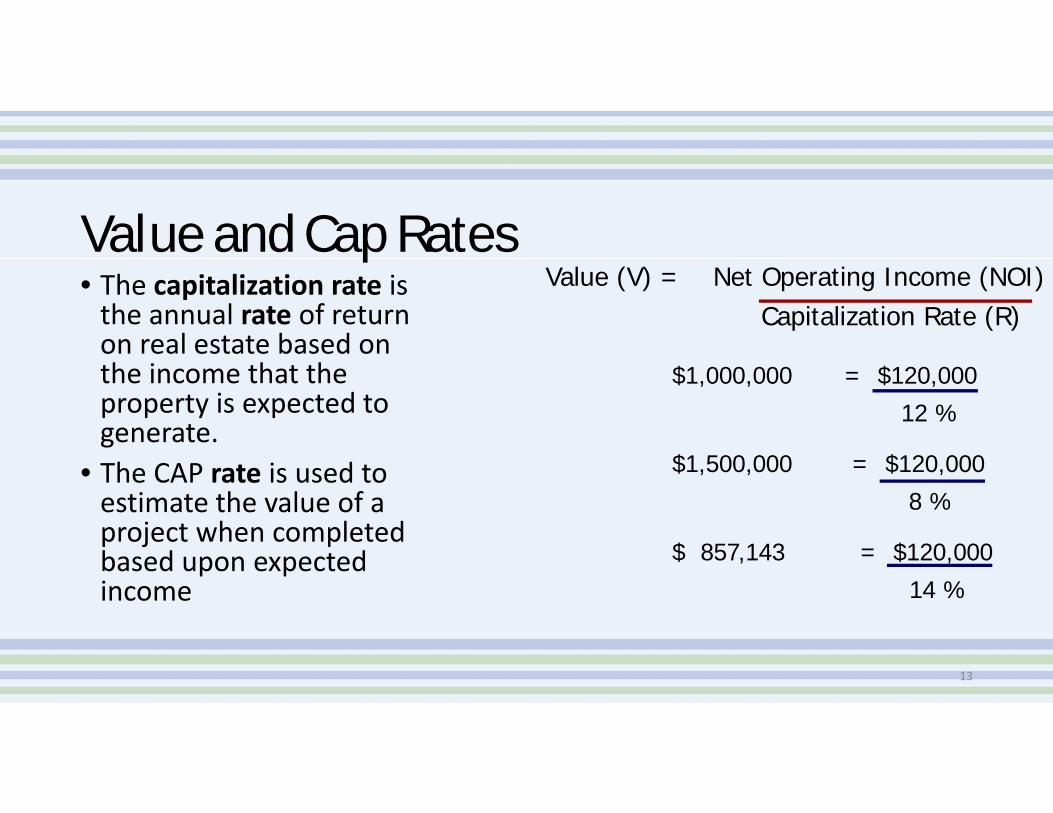
Value and Cap Rates• The capitalization rate is the annual rate of return on real estate based on the income that the property is expected to generate.
• The CAP rate is used to estimate the value of a project when completed based upon expected income
Value (V) = Net Operating Income (NOI)Capitalization Rate (R)
$1,000,000 = $120,00012 %
$1,500,000 = $120,0008 %
$ 857,143 = $120,00014 %
13
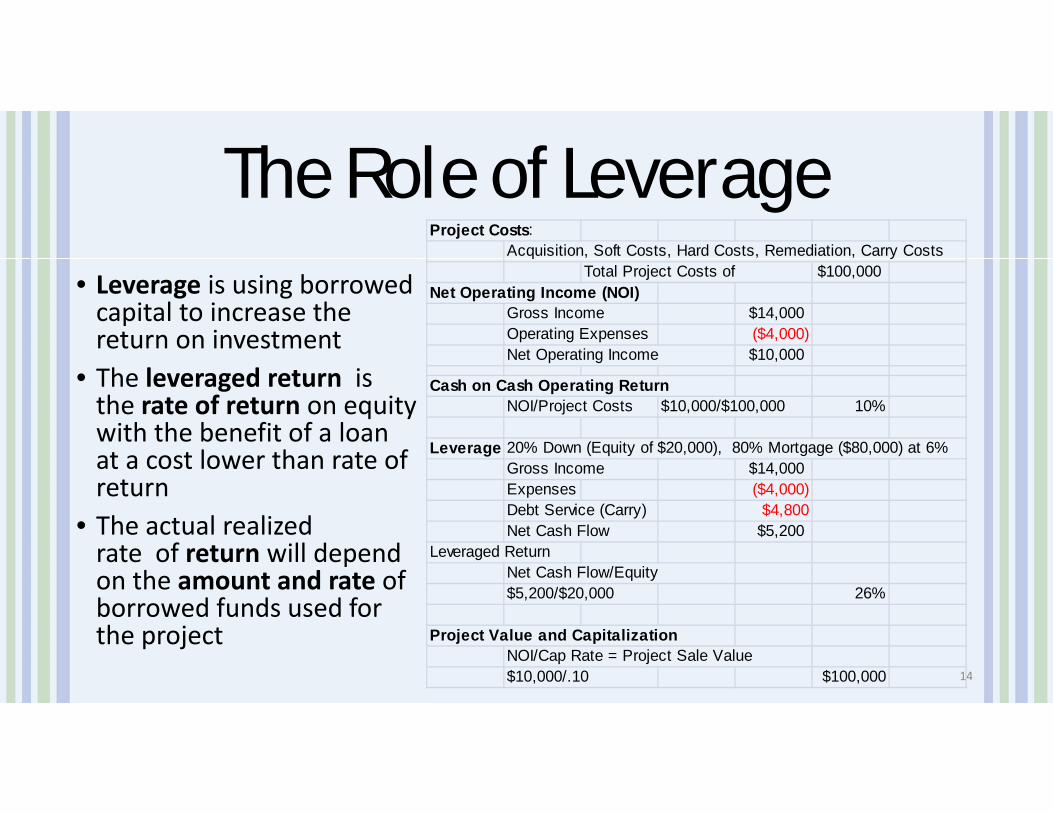
The Role of LeverageProject Costs:
Acquisition, Soft Costs, Hard Costs, Remediation, Carry CostsTotal Project Costs of $100,000
Net Operating Income (NOI)Gross Income $14,000Operating Expenses ($4,000)Net Operating Income $10,000
Cash on Cash Operating ReturnNOI/Project Costs $10,000/$100,000 10%
Leverage 20% Down (Equity of $20,000), 80% Mortgage ($80,000) at 6% Gross Income $14,000Expenses ($4,000)Debt Service (Carry) $4,800Net Cash Flow $5,200
Leveraged ReturnNet Cash Flow/Equity$5,200/$20,000 26%
Project Value and CapitalizationNOI/Cap Rate = Project Sale Value$10,000/.10 $100,000
• Leverage is using borrowed capital to increase the return on investment
• The leveraged return is the rate of return on equity with the benefit of a loan at a cost lower than rate of return
• The actual realized rate of return will depend on the amount and rate of borrowed funds used for the project
14
Understanding The Full
Financial Picture
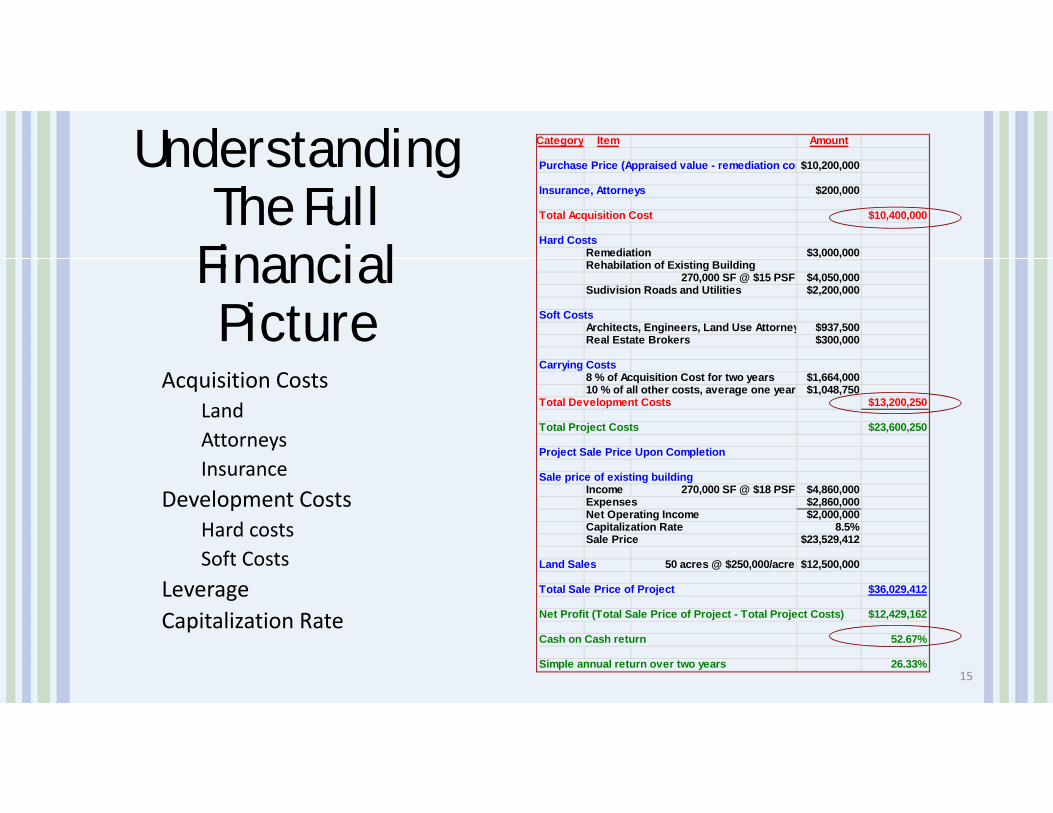
Category Item Amount
Purchase Price (Appraised value - remediation cos$10,200,000
Insurance, Attorneys $200,000
Total Acquisition Cost $10,400,000
Hard CostsRemediation $3,000,000Rehabilation of Existing Building
270,000 SF @ $15 PSF $4,050,000Sudivision Roads and Utilities $2,200,000
Soft CostsArchitects, Engineers, Land Use Attorney $937,500Real Estate Brokers $300,000
Carrying Costs8 % of Acquisition Cost for two years $1,664,00010 % of all other costs, average one year $1,048,750
Total Development Costs $13,200,250
Total Project Costs $23,600,250
Project Sale Price Upon Completion
Sale price of existing buildingIncome 270,000 SF @ $18 PSF $4,860,000Expenses $2,860,000Net Operating Income $2,000,000Capitalization Rate 8.5%Sale Price $23,529,412
Land Sales 50 acres @ $250,000/acre $12,500,000
Total Sale Price of Project $36,029,412
Net Profit (Total Sale Price of Project - Total Project Costs) $12,429,162
Cash on Cash return 52.67%
Simple annual return over two years 26.33%
Acquisition CostsLand AttorneysInsurance
Development CostsHard costsSoft Costs
LeverageCapitalization Rate
15
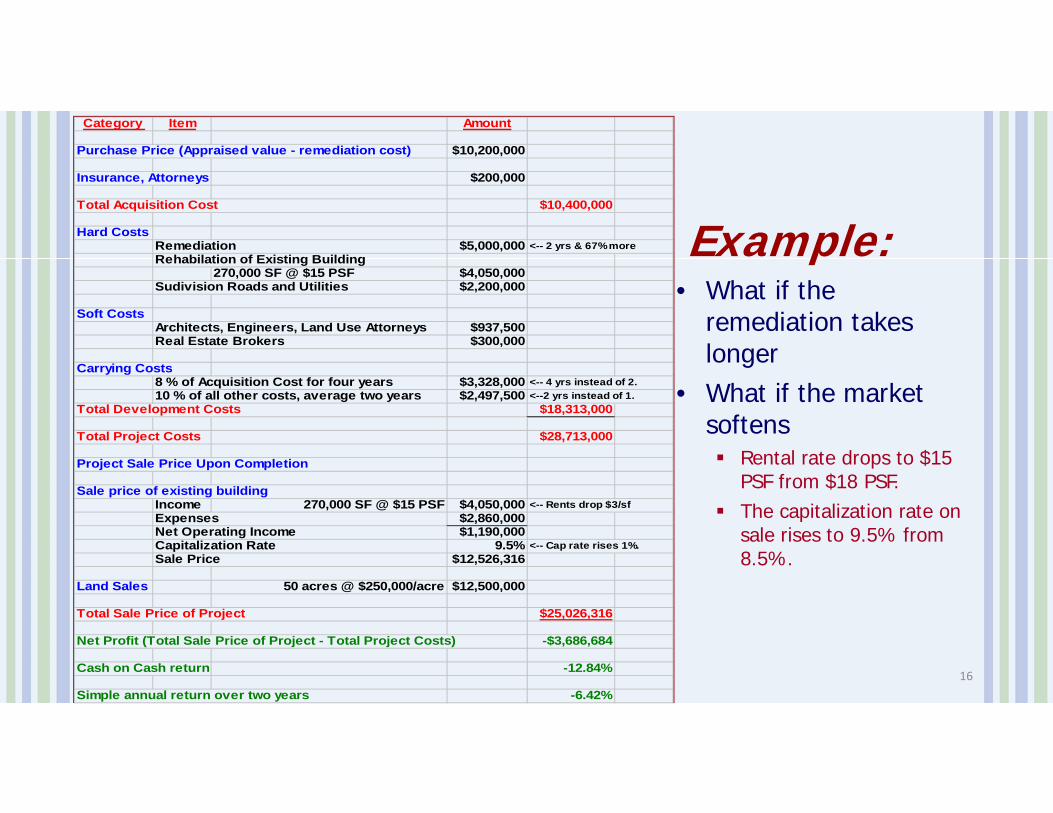
Example:• What if the
remediation takes longer
• What if the market softens Rental rate drops to $15
PSF from $18 PSF. The capitalization rate on
sale rises to 9.5% from 8.5%.
Category Item Amount
Purchase Price (Appraised value - remediation cost) $10,200,000
Insurance, Attorneys $200,000
Total Acquisition Cost $10,400,000
Hard CostsRemediation $5,000,000 <-- 2 yrs & 67% moreRehabilation of Existing Building
270,000 SF @ $15 PSF $4,050,000Sudivision Roads and Utilities $2,200,000
Soft CostsArchitects, Engineers, Land Use Attorneys $937,500Real Estate Brokers $300,000
Carrying Costs8 % of Acquisition Cost for four years $3,328,000 <-- 4 yrs instead of 2.10 % of all other costs, average two years $2,497,500 <--2 yrs instead of 1.
Total Development Costs $18,313,000
Total Project Costs $28,713,000
Project Sale Price Upon Completion
Sale price of existing buildingIncome 270,000 SF @ $15 PSF $4,050,000 <-- Rents drop $3/sfExpenses $2,860,000Net Operating Income $1,190,000Capitalization Rate 9.5% <-- Cap rate rises 1%.Sale Price $12,526,316
Land Sales 50 acres @ $250,000/acre $12,500,000
Total Sale Price of Project $25,026,316
Net Profit (Total Sale Price of Project - Total Project Costs) -$3,686,684
Cash on Cash return -12.84%
Simple annual return over two years -6.42%16
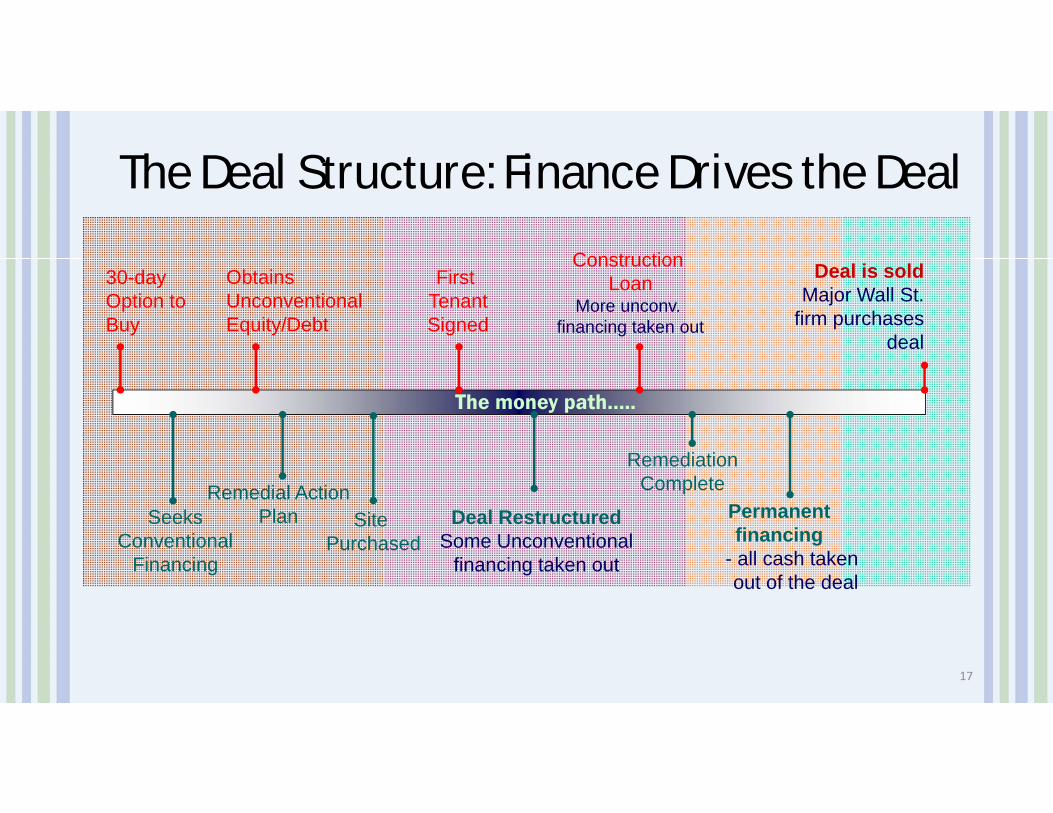
The Deal Structure: Finance Drives the Deal
30-day Option to Buy
SeeksConventional
Financing
ObtainsUnconventionalEquity/Debt
First TenantSigned
Site Purchased
Permanent financing
- all cash taken out of the deal
Deal RestructuredSome Unconventional
financing taken out
Construction Loan
More unconv. financing taken out
The money path…..
Deal is soldMajor Wall St.
firm purchases deal
Remediation CompleteRemedial Action
Plan
17
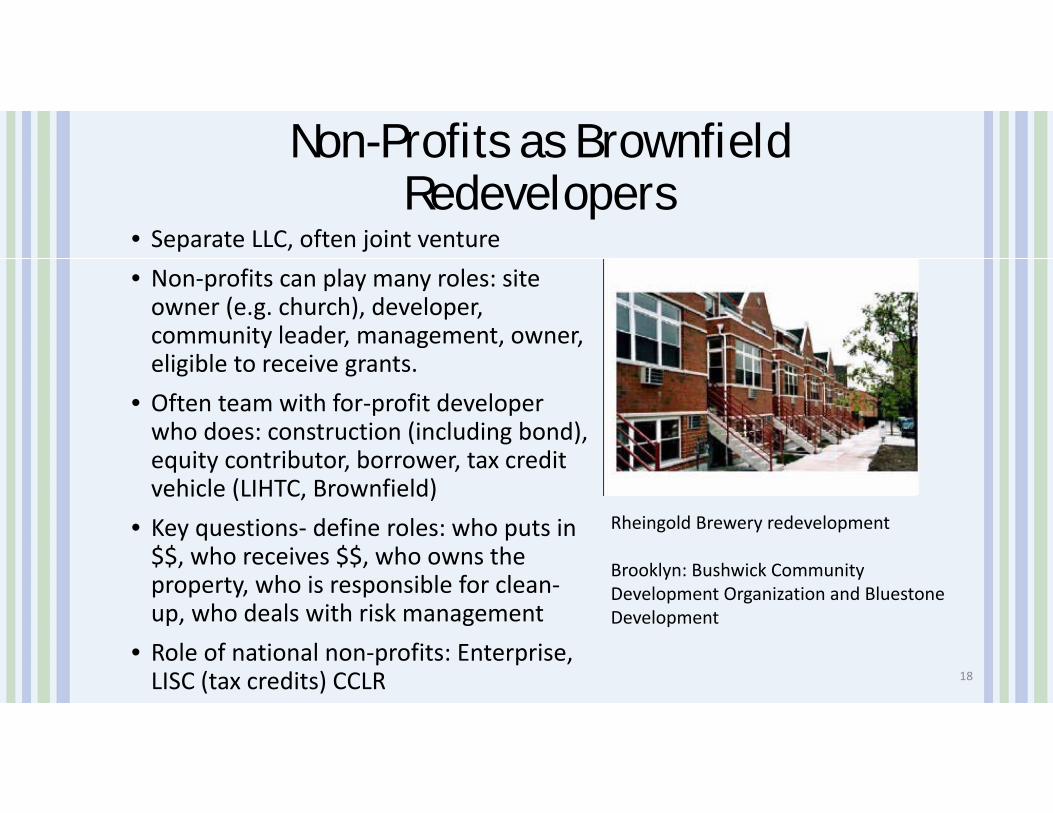
Non-Profits as Brownfield Redevelopers
• Separate LLC, often joint venture• Non‐profits can play many roles: site owner (e.g. church), developer, community leader, management, owner, eligible to receive grants.
• Often team with for‐profit developer who does: construction (including bond), equity contributor, borrower, tax credit vehicle (LIHTC, Brownfield)
• Key questions‐ define roles: who puts in $$, who receives $$, who owns the property, who is responsible for clean‐up, who deals with risk management
• Role of national non‐profits: Enterprise, LISC (tax credits) CCLR
Rheingold Brewery redevelopment
Brooklyn: Bushwick Community Development Organization and Bluestone Development
18
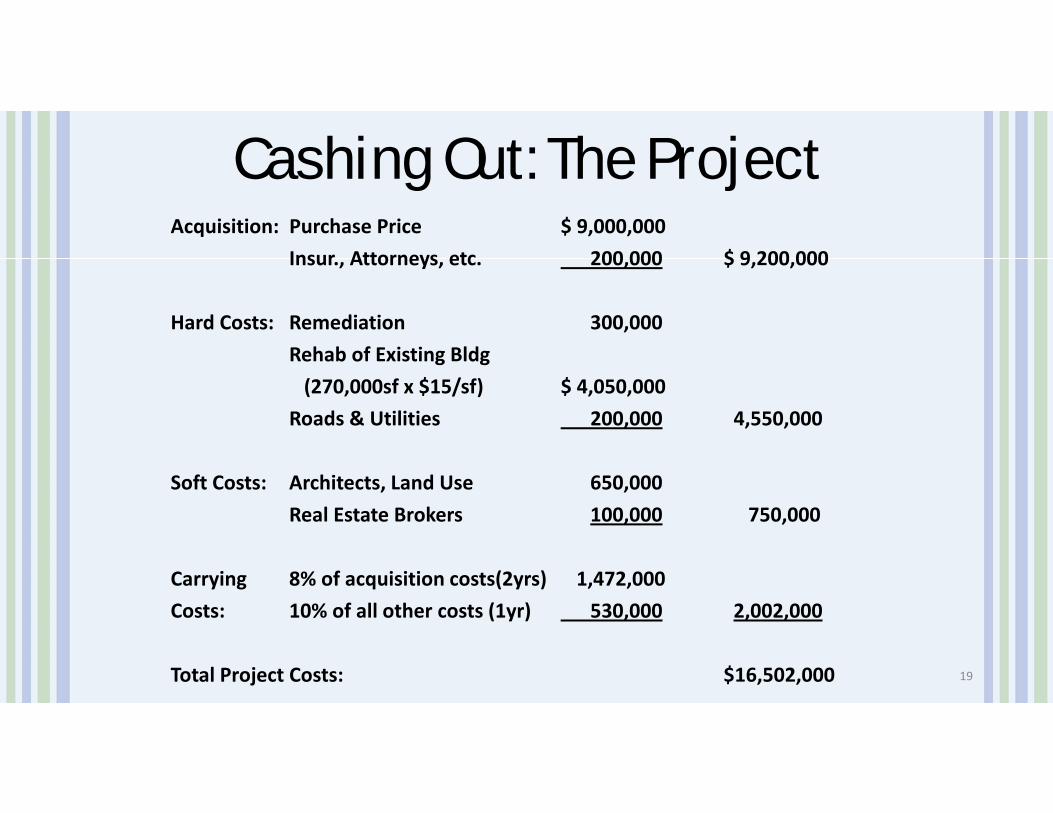
Cashing Out: The ProjectAcquisition: Purchase Price $ 9,000,000
Insur., Attorneys, etc. 200,000 $ 9,200,000
Hard Costs: Remediation 300,000Rehab of Existing Bldg(270,000sf x $15/sf) $ 4,050,000
Roads & Utilities 200,000 4,550,000
Soft Costs: Architects, Land Use 650,000Real Estate Brokers 100,000 750,000
Carrying 8% of acquisition costs(2yrs) 1,472,000Costs: 10% of all other costs (1yr) 530,000 2,002,000
Total Project Costs: $16,502,000 19
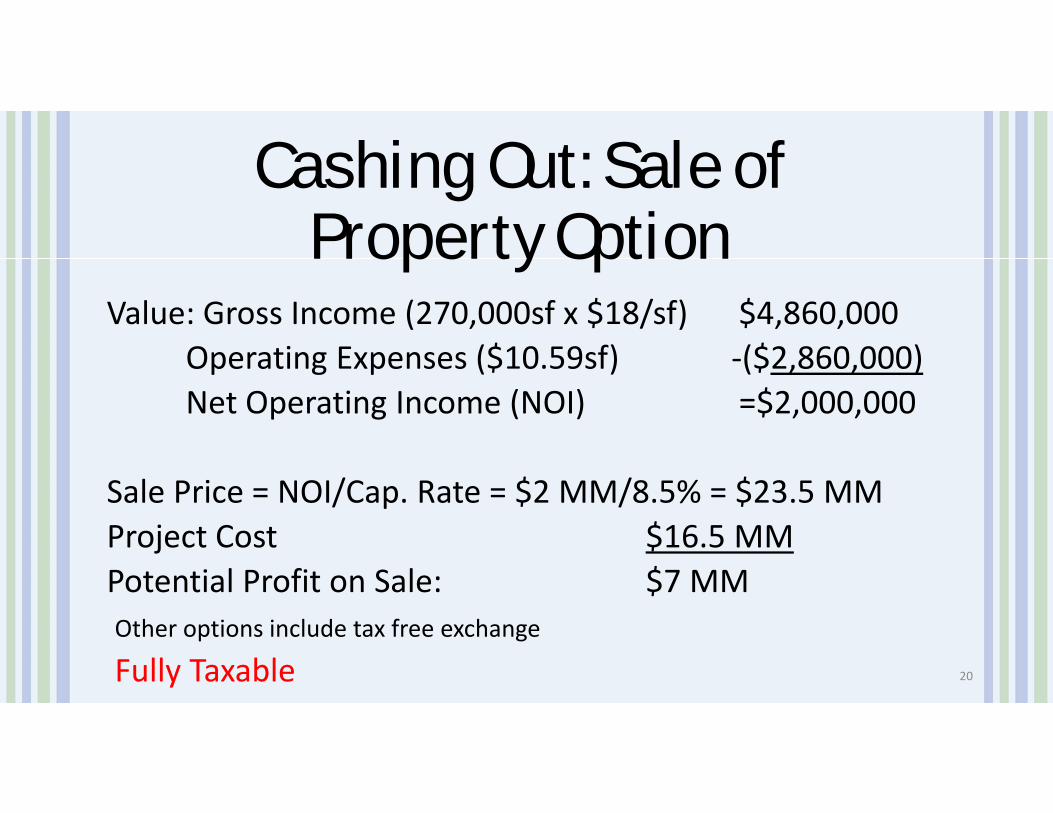
Cashing Out: Sale of Property Option
Value: Gross Income (270,000sf x $18/sf) $4,860,000Operating Expenses ($10.59sf) ‐($2,860,000)Net Operating Income (NOI) =$2,000,000
Sale Price = NOI/Cap. Rate = $2 MM/8.5% = $23.5 MMProject Cost $16.5 MMPotential Profit on Sale: $7 MMOther options include tax free exchange
Fully Taxable 20
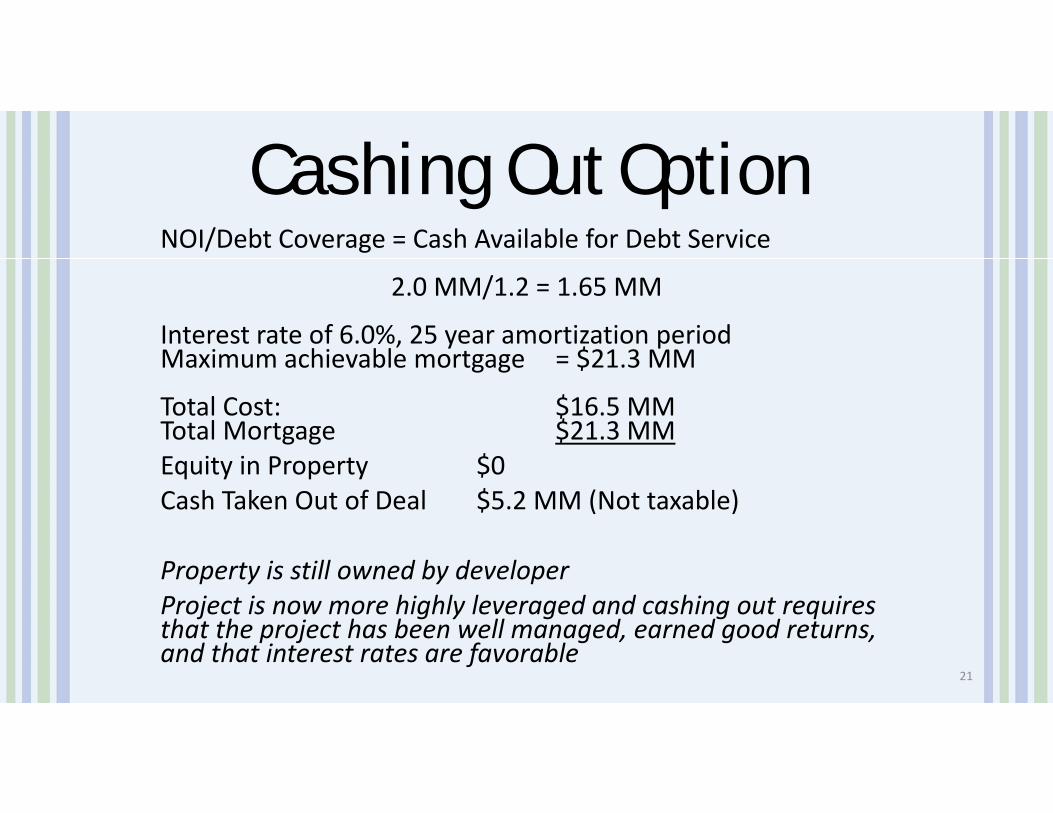
Cashing Out OptionNOI/Debt Coverage = Cash Available for Debt Service
2.0 MM/1.2 = 1.65 MM
Interest rate of 6.0%, 25 year amortization periodMaximum achievable mortgage = $21.3 MM
Total Cost: $16.5 MMTotal Mortgage $21.3 MMEquity in Property $0Cash Taken Out of Deal $5.2 MM (Not taxable)
Property is still owned by developerProject is now more highly leveraged and cashing out requires that the project has been well managed, earned good returns, and that interest rates are favorable
21
Questions?
22
A Tale of Two Developers
23
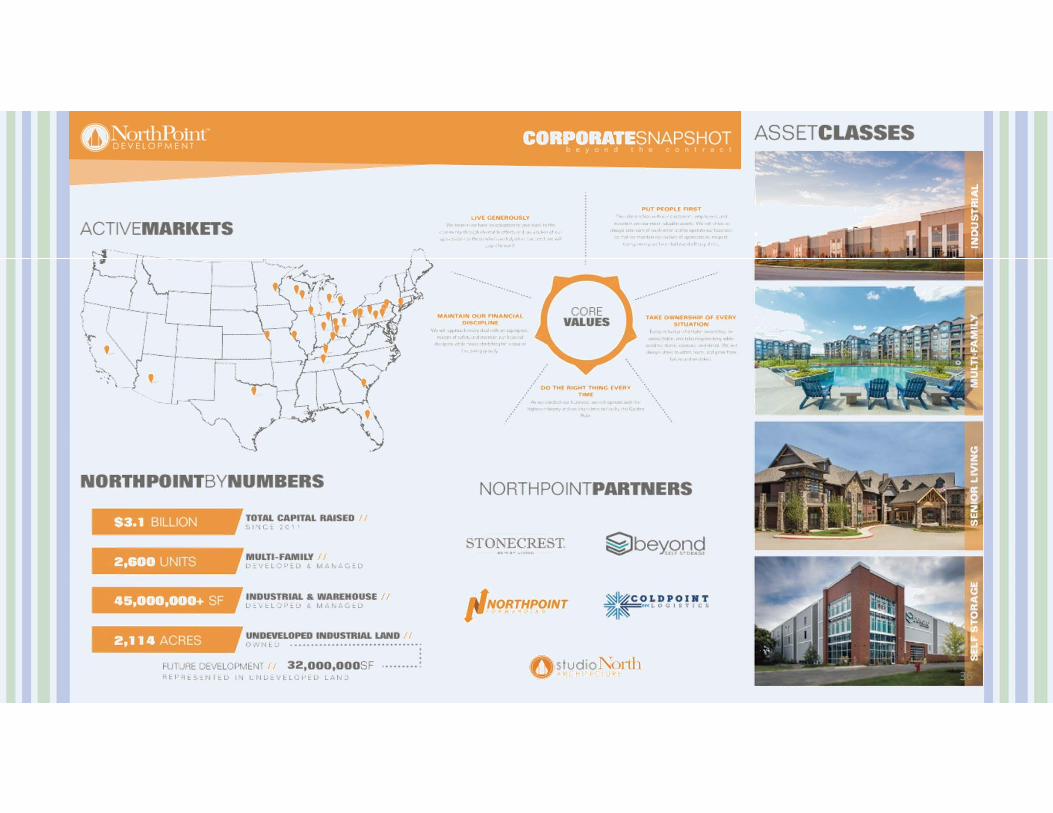
Chad Meyer has 20 years of industrial engineering and construction experience. Chad is responsible for the general oversight & growth of development, brownfield redevelopment and Design‐Build industrial construction for NorthPoint Development projects nationwide. Currently, NorthPoint has over 34,000,000 SF of industrial projects completed, and is on track to double industrial deliveries nationally in the next 24 months.
The DevelopersSteve Parnes has over two decades of real estate development experience in the highly competitive northeast markets, including positions with several high profile development companies. Steve is a Principal and founding member of a national brownfield redevelopment firm with over 6,000,000 SF of industrial development projects currently in the development pipeline.
24
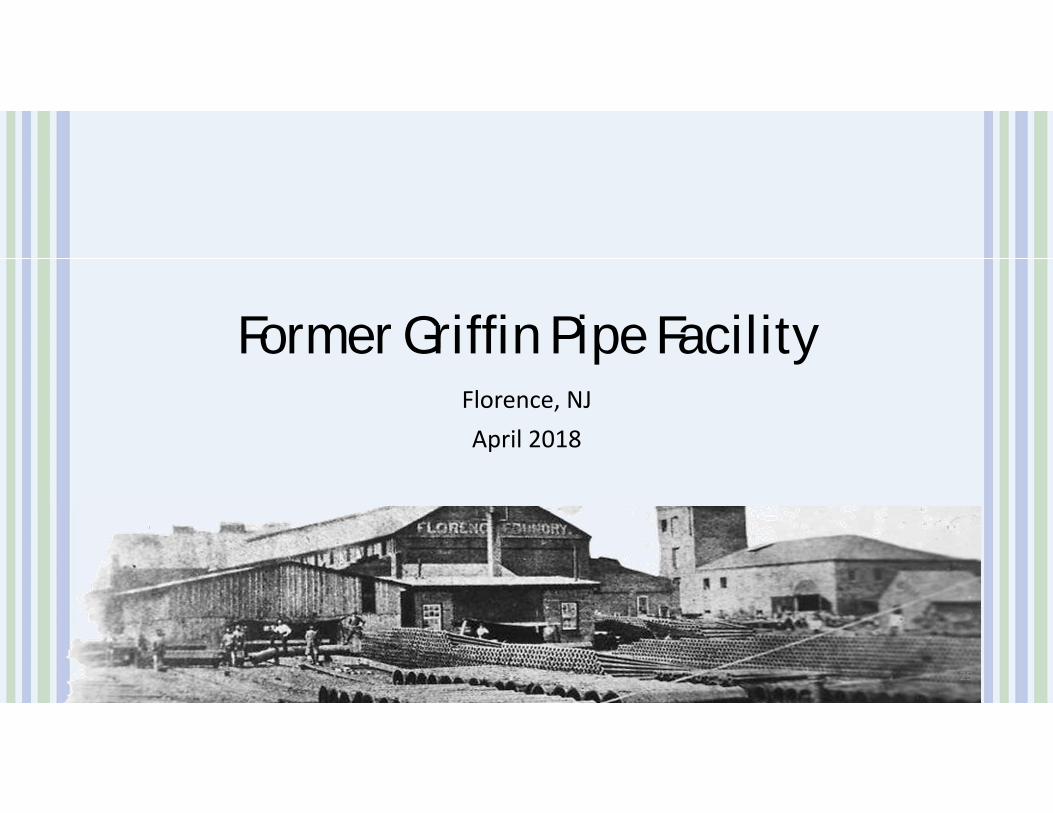
Former Griffin Pipe FacilityFlorence, NJApril 2018
25
DISCLAIMERThis presentation is provided by Catalyst Development Partners. No offer to sell, or solicitation of an offer to buy, any security, or any other advice in respect thereof, is made hereby. Past or projected performance is not necessarily indicative of future results and there can be no guarantee of future results, levels of activity, performance or achievements. Statements contained herein that are not historical facts are based on current expectations, estimates, projections, opinions and/or beliefs, including forward‐looking statements relating to future events or future financial performance. Such statements are subject to known and unknown risks, uncertainties and changes (including changes in economic, operational, political or other circumstances and other risks beyond the control of Catalyst Development Partners), any of which may cause the relevant actual, financial and other results to be materially different from the results expressed, projected or implied in this presentation. Catalyst Development Partners does not provide investment advisory services to the public.
26
Catalyst Development Partners• Catalyst Development Partners, LLC (“Catalyst”) sustainably redevelops under‐utilized, blighted and often environmentally impaired industrial and commercial properties primarily located in the Northeast and California.
• Catalyst acquires, remediates, repositions and entitles property whose historic use has left it contaminated.
• Catalyst is founded by principals with long experience in redevelopment, risk management and remediation on dozens of projects nationwide.
• Catalyst works closely with regulatory agencies, and sees the development of a remedial strategy as a team effort between the developer, the governing agencies, and the local community.
27
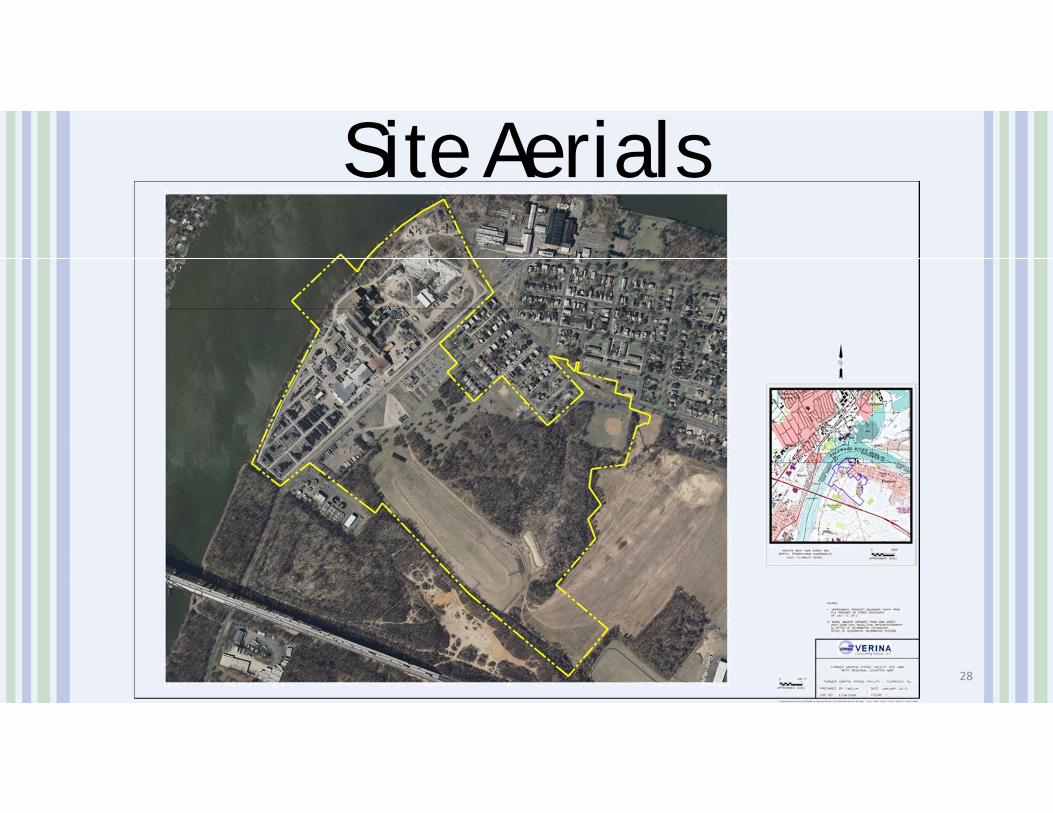
Site Aerials
28
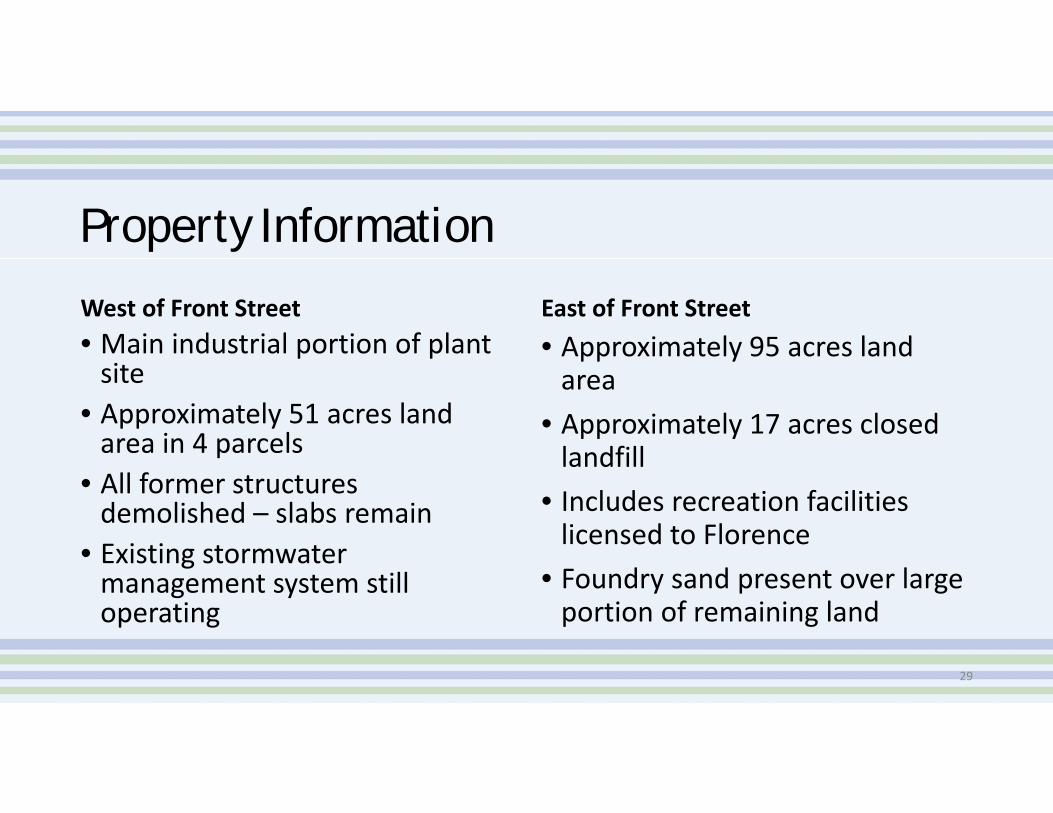
Property Information
West of Front Street• Main industrial portion of plant site
• Approximately 51 acres land area in 4 parcels
• All former structures demolished – slabs remain
• Existing stormwater management system still operating
East of Front Street• Approximately 95 acres land area
• Approximately 17 acres closed landfill
• Includes recreation facilities licensed to Florence
• Foundry sand present over large portion of remaining land
29
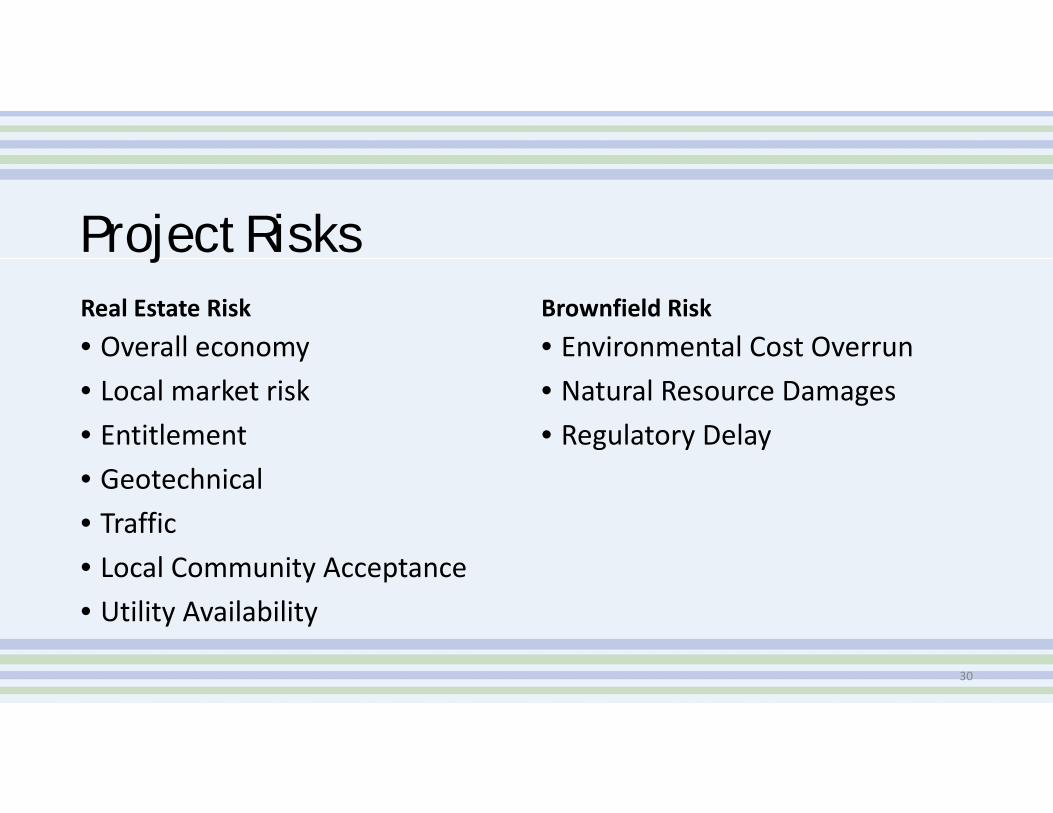
Project RisksReal Estate Risk• Overall economy• Local market risk• Entitlement• Geotechnical• Traffic• Local Community Acceptance• Utility Availability
Brownfield Risk• Environmental Cost Overrun• Natural Resource Damages• Regulatory Delay
30
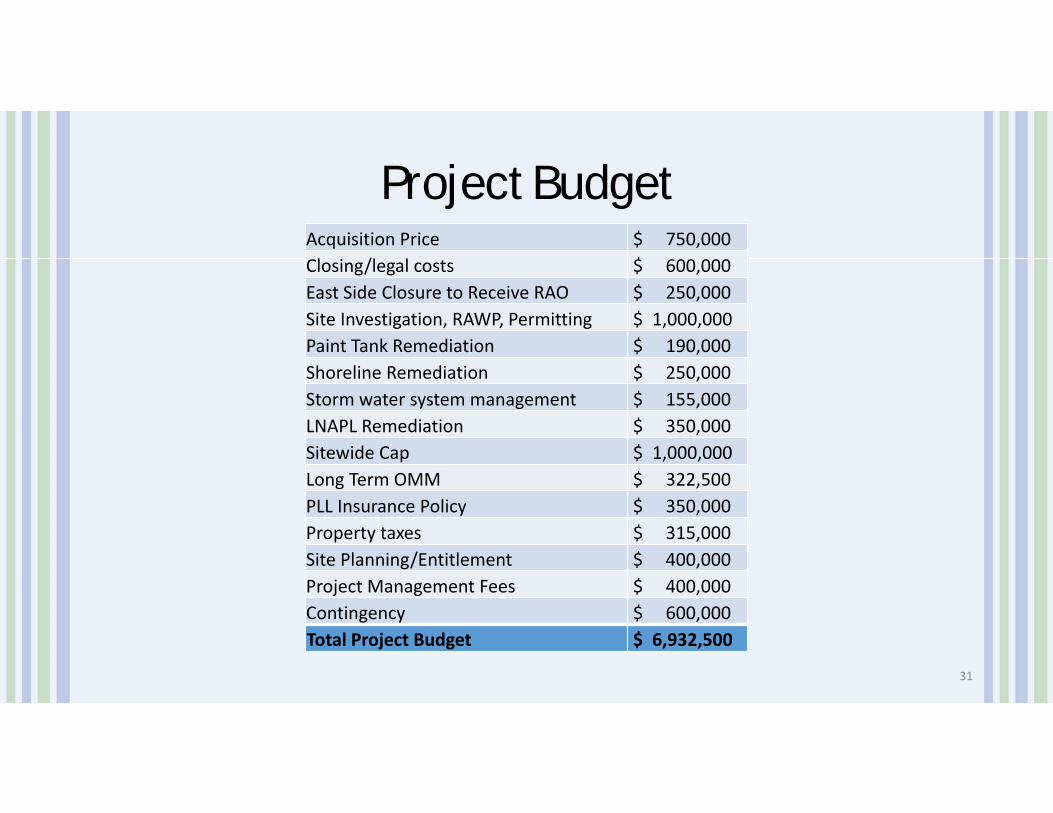
Project BudgetAcquisition Price $ 750,000 Closing/legal costs $ 600,000 East Side Closure to Receive RAO $ 250,000 Site Investigation, RAWP, Permitting $ 1,000,000 Paint Tank Remediation $ 190,000 Shoreline Remediation $ 250,000 Storm water system management $ 155,000 LNAPL Remediation $ 350,000 Sitewide Cap $ 1,000,000 Long Term OMM $ 322,500 PLL Insurance Policy $ 350,000 Property taxes $ 315,000 Site Planning/Entitlement $ 400,000 Project Management Fees $ 400,000 Contingency $ 600,000 Total Project Budget $ 6,932,500
31
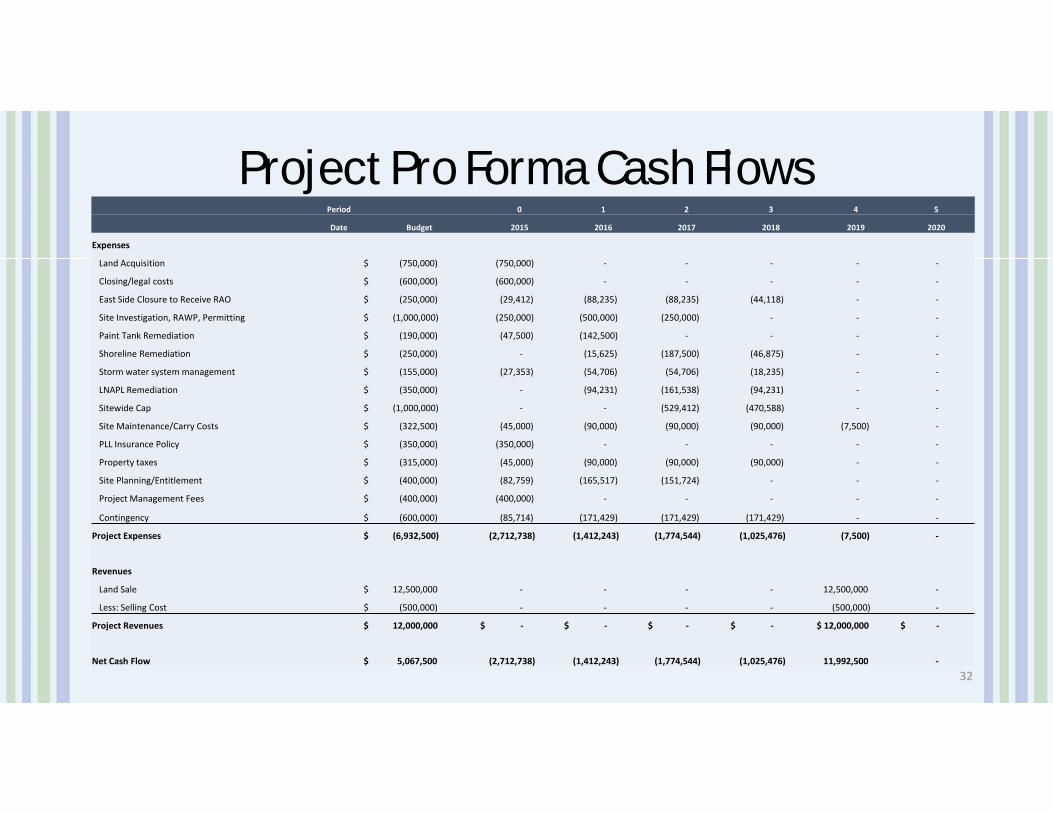
Project Pro Forma Cash FlowsPeriod 0 1 2 3 4 5
Date Budget 2015 2016 2017 2018 2019 2020
Expenses
Land Acquisition $ (750,000) (750,000) ‐ ‐ ‐ ‐ ‐
Closing/legal costs $ (600,000) (600,000) ‐ ‐ ‐ ‐ ‐
East Side Closure to Receive RAO $ (250,000) (29,412) (88,235) (88,235) (44,118) ‐ ‐
Site Investigation, RAWP, Permitting $ (1,000,000) (250,000) (500,000) (250,000) ‐ ‐ ‐
Paint Tank Remediation $ (190,000) (47,500) (142,500) ‐ ‐ ‐ ‐
Shoreline Remediation $ (250,000) ‐ (15,625) (187,500) (46,875) ‐ ‐
Storm water system management $ (155,000) (27,353) (54,706) (54,706) (18,235) ‐ ‐
LNAPL Remediation $ (350,000) ‐ (94,231) (161,538) (94,231) ‐ ‐
Sitewide Cap $ (1,000,000) ‐ ‐ (529,412) (470,588) ‐ ‐
Site Maintenance/Carry Costs $ (322,500) (45,000) (90,000) (90,000) (90,000) (7,500) ‐
PLL Insurance Policy $ (350,000) (350,000) ‐ ‐ ‐ ‐ ‐
Property taxes $ (315,000) (45,000) (90,000) (90,000) (90,000) ‐ ‐
Site Planning/Entitlement $ (400,000) (82,759) (165,517) (151,724) ‐ ‐ ‐
Project Management Fees $ (400,000) (400,000) ‐ ‐ ‐ ‐ ‐
Contingency $ (600,000) (85,714) (171,429) (171,429) (171,429) ‐ ‐
Project Expenses $ (6,932,500) (2,712,738) (1,412,243) (1,774,544) (1,025,476) (7,500) ‐
Revenues
Land Sale $ 12,500,000 ‐ ‐ ‐ ‐ 12,500,000 ‐
Less: Selling Cost $ (500,000) ‐ ‐ ‐ ‐ (500,000) ‐
Project Revenues $ 12,000,000 $ ‐ $ ‐ $ ‐ $ ‐ $ 12,000,000 $ ‐
Net Cash Flow $ 5,067,500 (2,712,738) (1,412,243) (1,774,544) (1,025,476) 11,992,500 ‐
32
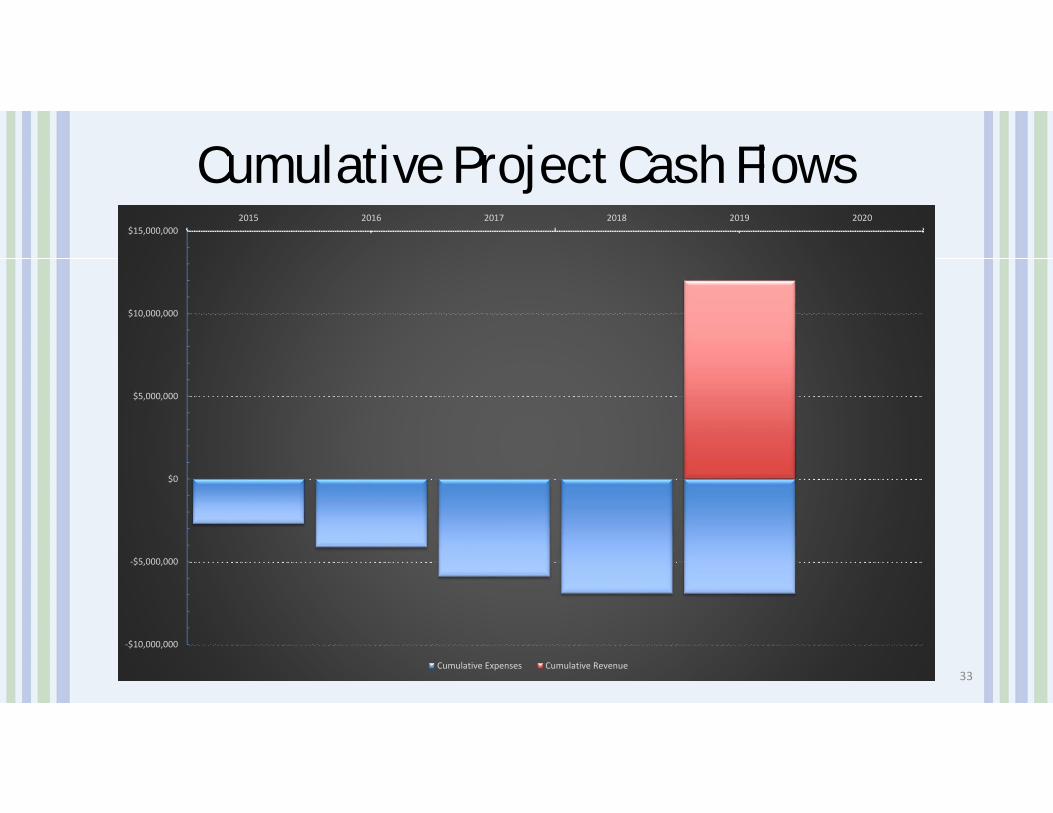
Cumulative Project Cash Flows
‐$10,000,000
‐$5,000,000
$0
$5,000,000
$10,000,000
$15,000,0002015 2016 2017 2018 2019 2020
Cumulative Expenses Cumulative Revenue33
Common Project MetricsInternal Rate of Return (“IRR”): the percentage rate earned on each dollar invested for each period it is invested. IRR is also another term people use for interest. Ultimately, IRR gives an investor the means to compare alternative investments based on their yield.
Return on Investment (“ROI”) or Multiple: a performance measure, used to evaluate the efficiency of an investment or compare the efficiency of a number of different investments. ROI measures the amount of return on an investment, relative to the investment’s cost.
34
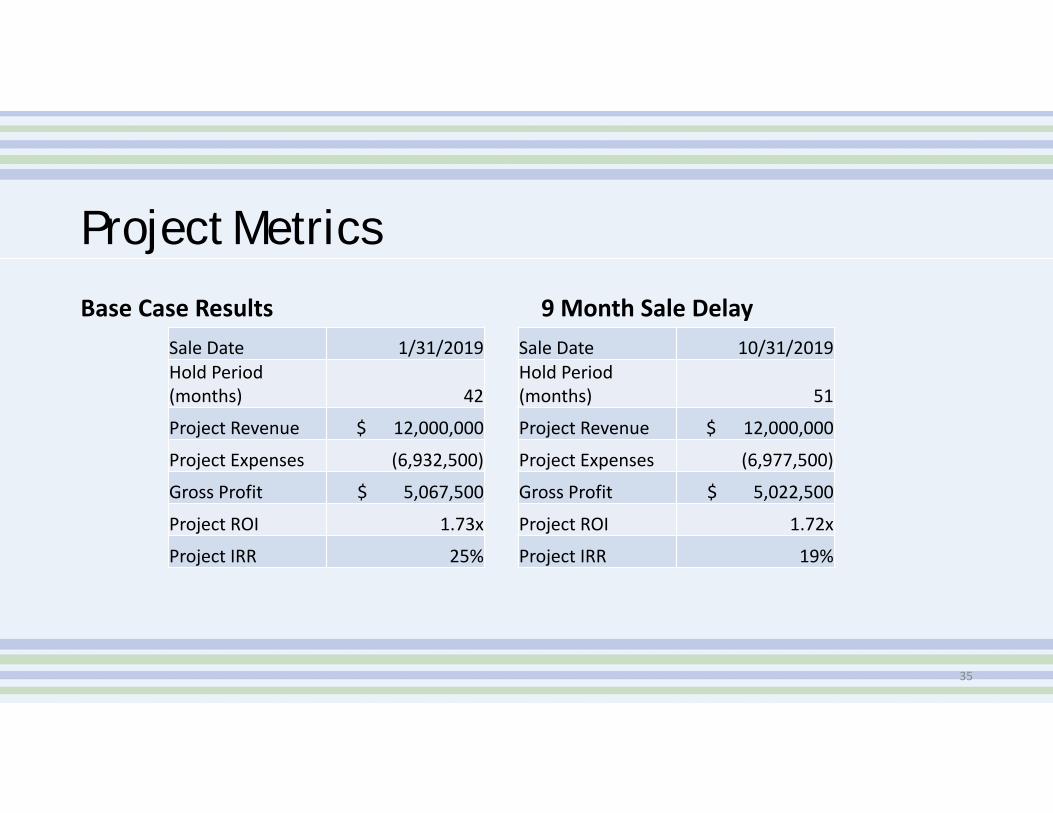
Project Metrics
Base Case ResultsSale Date 1/31/2019Hold Period (months) 42
Project Revenue $ 12,000,000
Project Expenses (6,932,500)
Gross Profit $ 5,067,500
Project ROI 1.73x
Project IRR 25%
9 Month Sale DelaySale Date 10/31/2019Hold Period (months) 51
Project Revenue $ 12,000,000
Project Expenses (6,977,500)
Gross Profit $ 5,022,500
Project ROI 1.72x
Project IRR 19%
35
36
Why invest?• Industrial RE is similar to a bond & provides durable returns to investors• Causing factors for investment and development
• Specific client or industrial occupier need• Expansion• Multiple facility consolidation• Less price sensitive• Represents 20%‐30% of industrial markets nationally
• Market fundamentals support speculative development• High rents + low vacancies• Long term growth projected in MSA in population and industry• Very cost and time sensitive• Represents 70%‐80% of industrial markets nationally
37
38
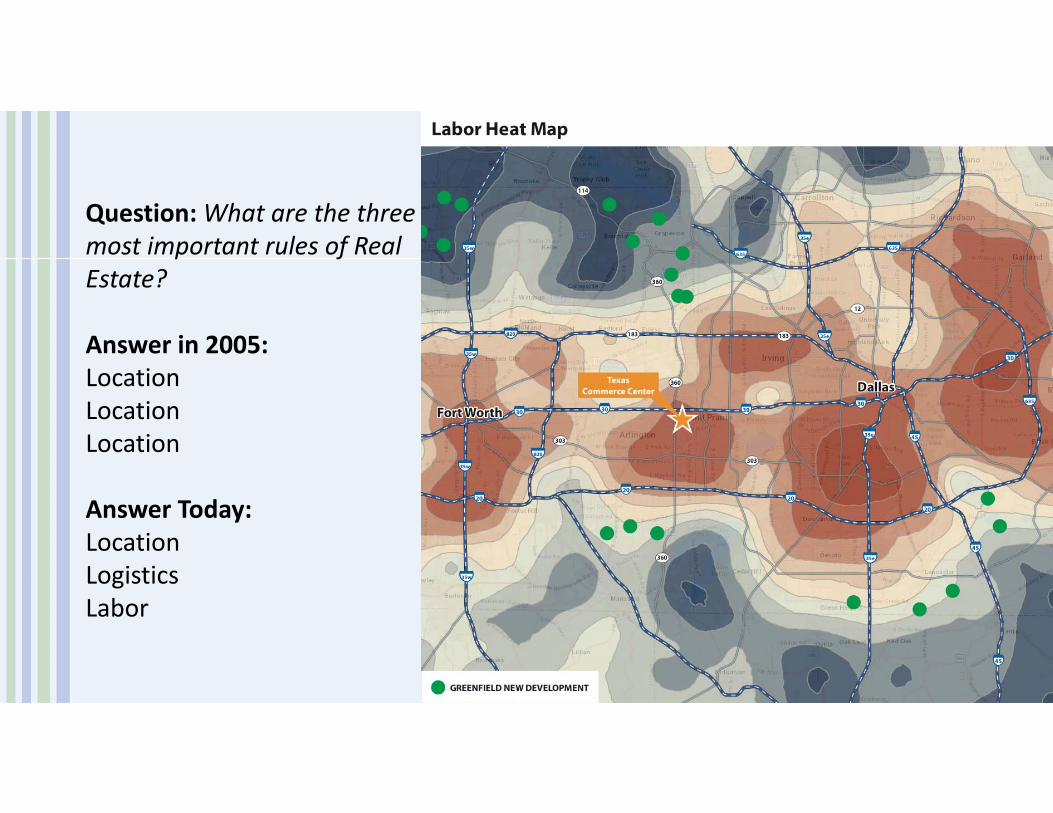
Question: What are the three most important rules of Real Estate?
Answer in 2005:LocationLocationLocation
Answer Today:LocationLogisticsLabor
39
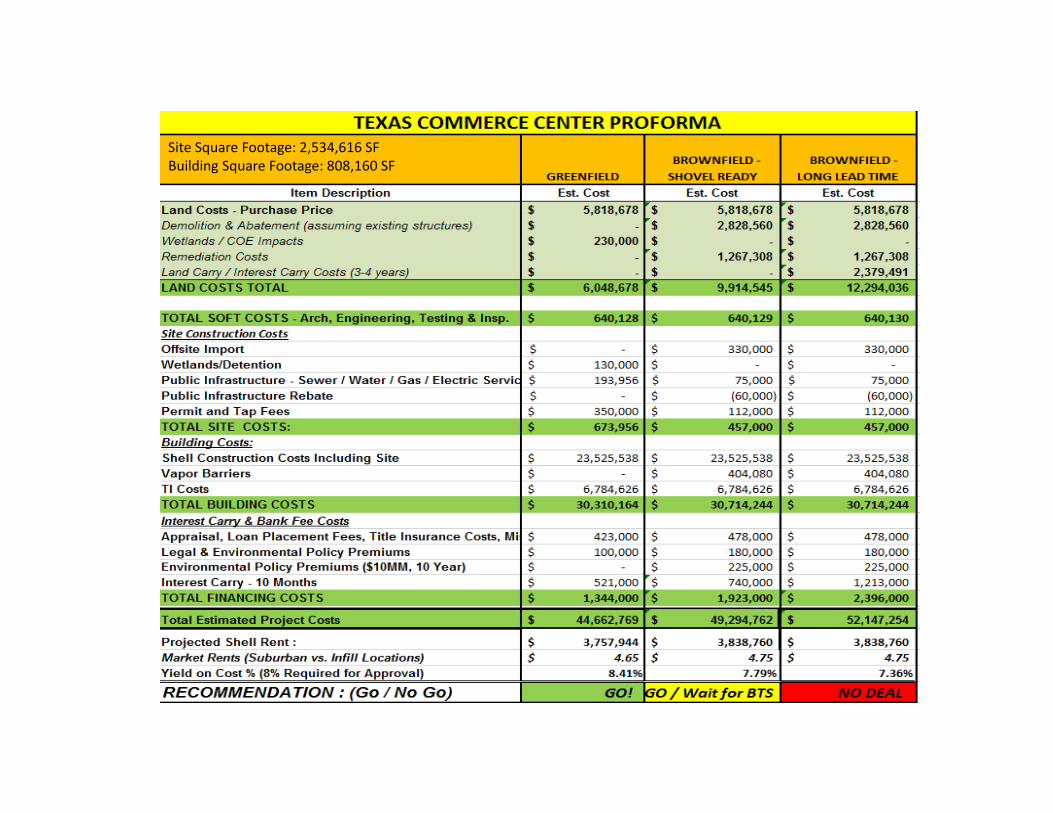
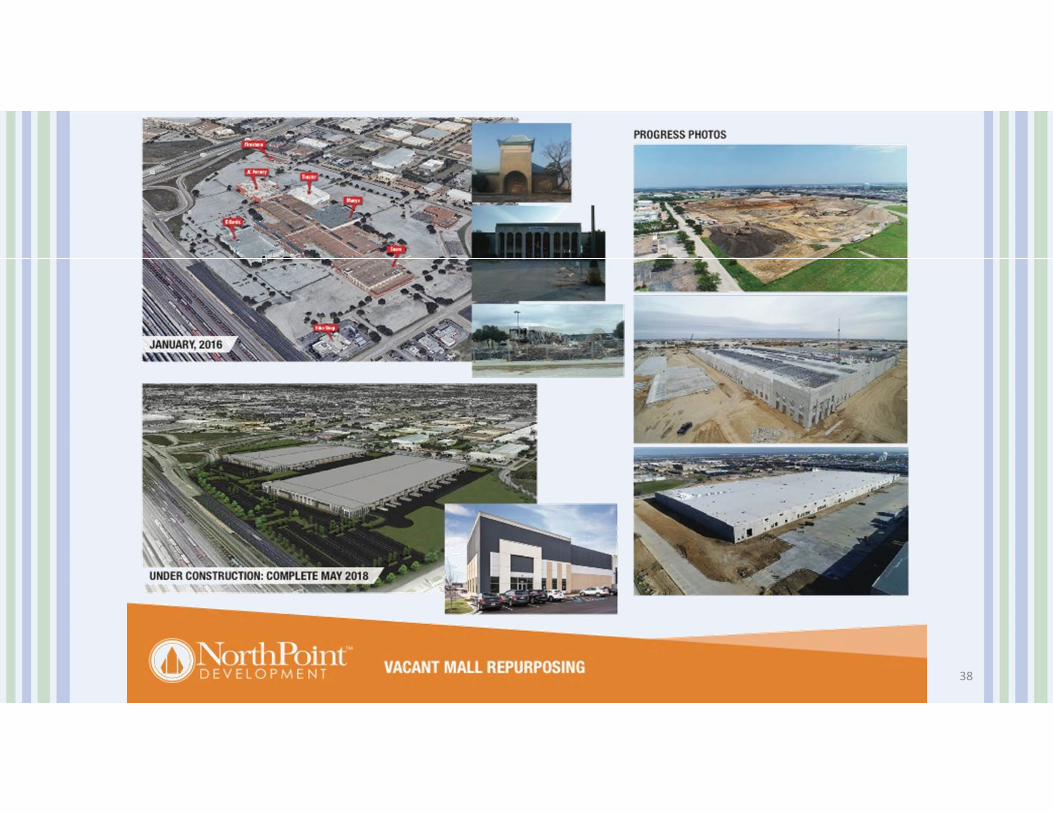
Site Square Footage: 2,534,616 SFBuilding Square Footage: 808,160 SF
RE-Development Upcoming Events
• Workshops• Lenexa, KS ‐ June 7th
• Philadelphia, PA ‐ June 28th ‐ Live Streaming nationwide• San Francisco, CA ‐ July 18th
• Washington, DC ‐ July 25th
41
Recommended