Finding races and memory errorswith LLVM instrumentationAddressSanitizer, ThreadSanitizer
Timur Iskhodzhanov, Alexander Potapenko,
Alexey Samsonov, Kostya Serebryany,Evgeniy Stepanov, Dmitriy Vyukov
LLVM Dev MeetingNovember 18, 2011

Agenda
● AddressSanitizer (memory error detector)● ThreadSantizer (race detector)● Challenges

● Out-of-bounds accesses (OOB, buffer overflow/underflow)○ Heap○ Stack○ Globals
● Use-after-free (UAF, dangling pointer)● Use-after-return (UAR)● Uninitialized memory reads (UMR)● Leaks● Double free● Invalid free● Overapping memcpy parameters● ...
Memory bugs in C++

AddressSanitizer vs Valgrind (Memcheck)
Valgrind AddressSanitizer
Heap out-of-bounds YES YES
Stack out-of-bounds NO YES
Global out-of-bounds NO YES
Use-after-free YES YES
Use-after-return NO Sometimes/YES
Uninitialized reads YES NO
Overhead 10x-30x 1.5x-3x
Platforms Linux, Mac Same as GCC/LLVM *
AddressSanitizer overview
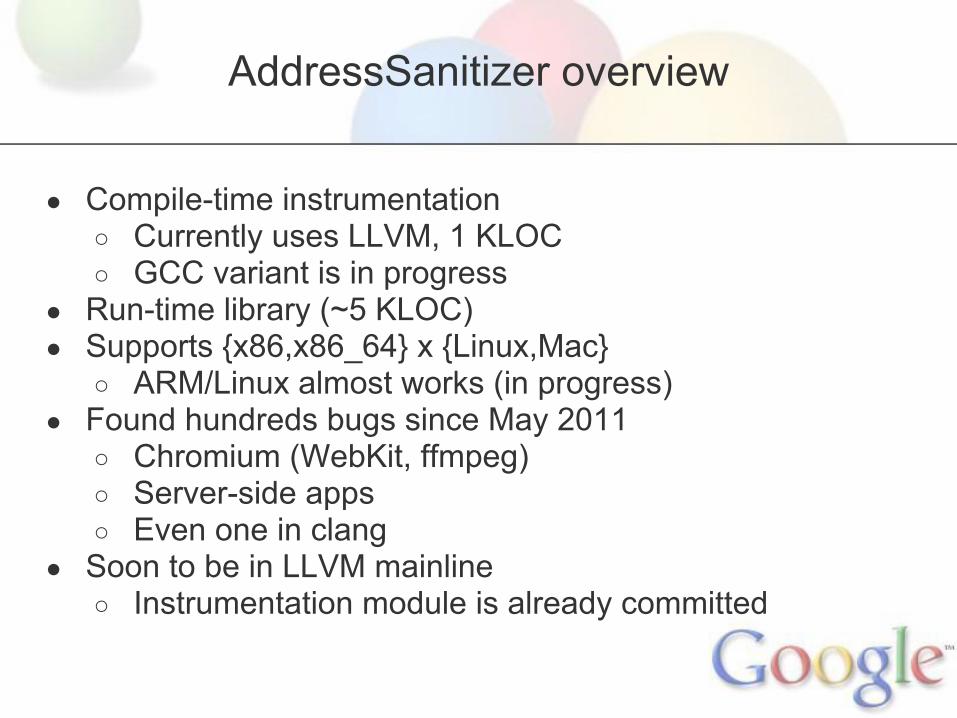
● Compile-time instrumentation○ Currently uses LLVM, 1 KLOC○ GCC variant is in progress
● Run-time library (~5 KLOC)● Supports {x86,x86_64} x {Linux,Mac}
○ ARM/Linux almost works (in progress)● Found hundreds bugs since May 2011
○ Chromium (WebKit, ffmpeg)○ Server-side apps○ Even one in clang
● Soon to be in LLVM mainline ○ Instrumentation module is already committed

Shadow bytes
Every aligned 8-byte word of memory have only 9 states:first k (0<=k<=8) bytes are addressable, the rest are not.
State of every 8-byte word can be encoded in 1 byte(shadow byte)
(Extreme: up to 128 application bytes per 1 shadow byte)

*a = ...
Instrumentation: 8 byte access
char *shadow = MemToShadow(a);if (*shadow) ReportError(a);*a = ...
*a = ...
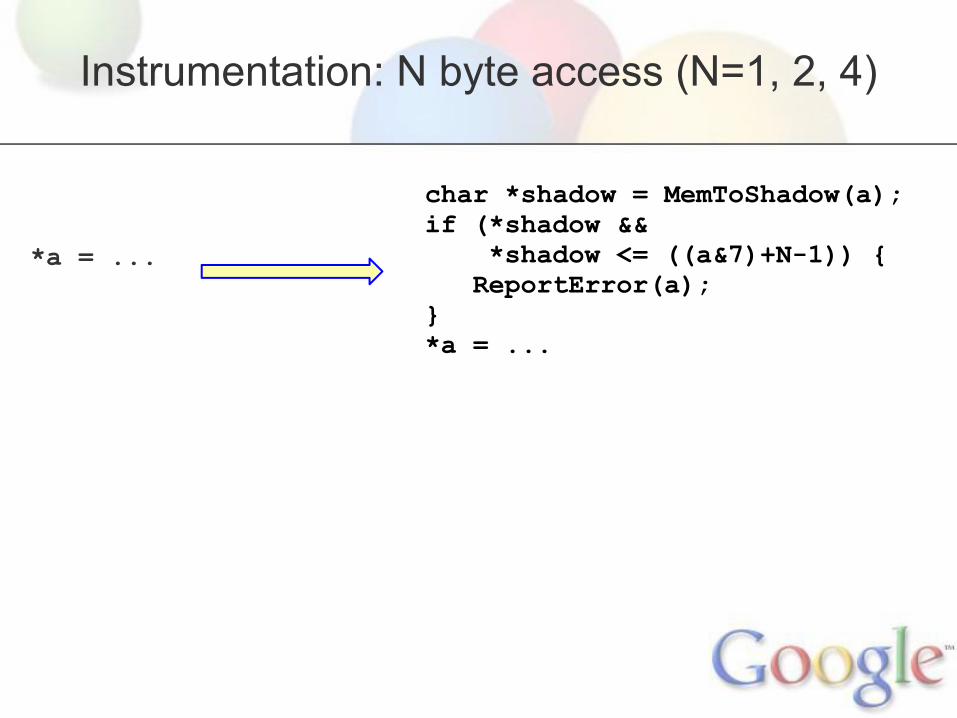
Instrumentation: N byte access (N=1, 2, 4)
char *shadow = MemToShadow(a);if (*shadow && *shadow <= ((a&7)+N-1)) { ReportError(a);}*a = ...

Mapping: Shadow = (Addr>>3) + Offset
0xffffffff0x40000000
0x3fffffff0x28000000
0x27ffffff0x24000000
0x23ffffff0x20000000
0x1fffffff0x00000000
0xffffffff0x40000000
ApplicationMemory
0x3fffffff0x28000000
Shadow
0x27ffffff0x24000000
Prohibited
0x23ffffff0x20000000
Shadow
0x1fffffff0x00000000
Application

Mapping: Shadow = (Addr>>3) + 0
0xffffffff0x20000000
0x1fffffff0x04000000
0x03ffffff0x00000000
0xffffffff0x20000000
Application
0x1fffffff0x04000000
Shadow
0x03ffffff0x00000000
Prohibited
● Requires -fPIE -pie● Gives ~6% speedup● Can this be made default for everyone?

Instrumentation example (x86_64)
shr $0x3,%rax # shift by 3 mov $0x100000000000,%rcx or %rax,%rcx # add offsetcmpb $0x0,(%rcx) # load shadowje 1f <foo+0x1f>mov %rdi,%rax # failing address in %raxud2a # generate SIGILL*movq $0x1234,(%rdi) # original store *Can use call instead of UD2

Instrumenting stack
● Fast protocol○ Poison redzones at function entry○ Unpoison redzones at function exit (must happen)○ Assume the rest of the stack frame is unpoisoned ○ + Fast: O(number of locals) instructions○ - Tricky when exceptions or longjmp are present ○ - Small probability of finding use-after-return
● Slow protocol○ Poison redzones and unpoison locals at function entry ○ Poison the entire frame at function exit (optional)○ + Friendly to exceptions and longjmp○ + Better for use-after-return○ - Slower: O(size of the stack frame) instructions

void foo() { char a[328]; <------------- CODE -------------> }
Instrumenting stack

Instrumenting stack (fast protocol)
void foo() { char rz1[32]; // 32-byte aligned char a[328]; char rz2[24]; char rz3[32]; int *shadow = (&rz1 >> 3) + kOffset; shadow[0] = 0xffffffff; // poison rz1 shadow[11] = 0xffffff00; // poison rz2 shadow[12] = 0xffffffff; // poison rz3 <------------- CODE -------------> shadow[0] = shadow[11] = shadow[12] = 0; }

Instrumenting stack (slow protocol)
void foo() { char rz1[32]; // 32-byte aligned char a[328]; char rz2[24]; char rz3[32]; int *shadow = (&rz1 >> 3) + kOffset; shadow[0] = 0xffffffff; // poison rz1 shadow[1:10] = 0; // unpoison a shadow[11] = 0xffffff00; // poison rz2 shadow[12] = 0xffffffff; // poison rz3 <------------- CODE -------------> shadow[0:13] = 0xffffffff; }

Instrumenting globals
int a; double b;
struct { int original; char redzone[60];} a; // 32-aligned struct { double original; char redzone[56];} b; // 32-aligned

Use-after-return
int LocalPtr() { int local; return &local;} void Bad() { int *p = LocalPtr(); Access(p);}
● Default mode ○ Will report UAR only occasionally as
"strange" stack buffer overflow● Special mode (slower, in progress)
○ Put all stack objects on heap○ Delay reuse

Run-time library
● Initializes shadow memory at startup● Provides full malloc replacement
○ Insert poisoned redzones around allocated memory○ Quarantine for free-ed memory○ Collect stack traces for every malloc/free
● Provides interceptors for functions like strlen● Prints error messages

Report example (use-after-free)
==10613== ERROR: AddressSanitizer heap-use-after-free on address 0x7fe8740a6214 at pc 0x40246f bp 0x7fffe5e463e0 sp 0x7fffe5e463d8 READ of size 4 at 0x7fe8740a6214 thread T0 #0 0x40246f in main example_UseAfterFree.cc:4 #1 0x7fe8740e4c4d in __libc_start_main ??:0 0x7fe8740a6214 is located 4 bytes inside of 400-byte region freed by thread T0 here: #0 0x4028f4 in operator delete[](void*) _asan_rtl_ #1 0x402433 in main example_UseAfterFree.cc:4 previously allocated by thread T0 here: #0 0x402c36 in operator new[](unsigned long) _asan_rtl_ #1 0x402423 in main example_UseAfterFree.cc:2

Performance: 1.73x slowdown on cpu2006
Reads&Writes Only Writes

Real-life performance
● Almost no slowdown for GUI programs○ They don't consume all of CPU anyway
● 1.5x - 4x slowdown for server side apps○ The larger the slower (instruction cache?)○ Up to 8x with -O1 (inlining? instruction cache?)

Memory overhead
● Heap redzones ○ default is 128-255 bytes per allocation○ minimal is 32-63 bytes per allocation
● Stack redzones: 32-63 bytes per address-taken local variable● Global redzones: 32-63 bytes per global● Fixed size Quarantine (250M)● (Heap + Globals + Stack + Quarantine) / 8 for shadow
● Typical overal memory overhead is 2x - 4x
○ Seen between 1.1x and 20x● Stack size increase
○ Seen up to 3x● Maps (but not reserves) 1/8-th of all address space
○ 16T on 64-bit○ 0.5G on 32-bit
ThreadSanitizer
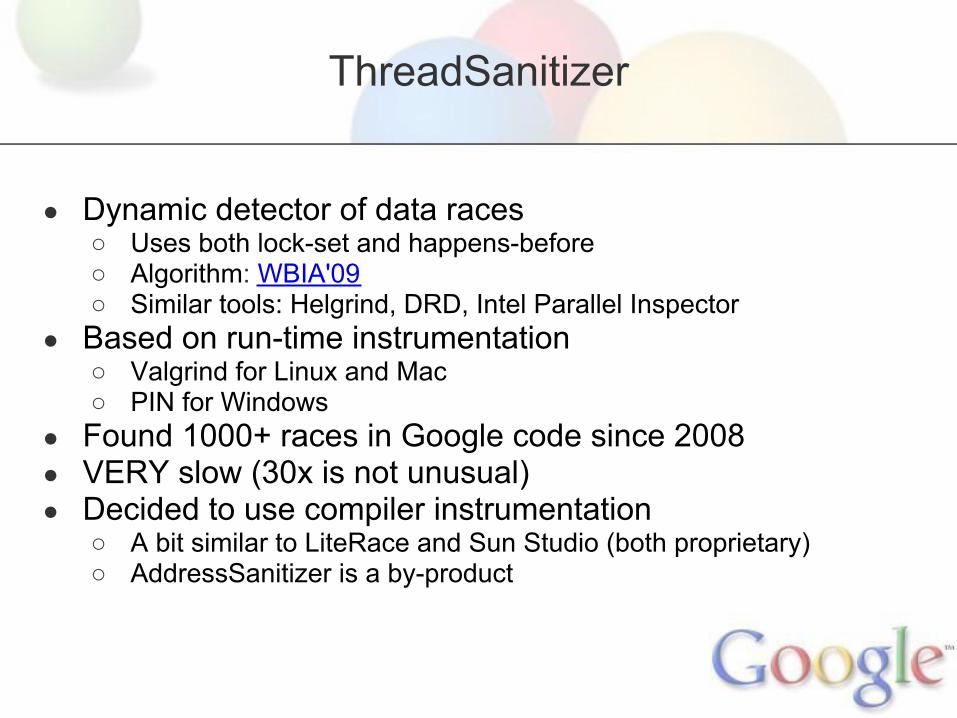
● Dynamic detector of data races○ Uses both lock-set and happens-before○ Algorithm: WBIA'09○ Similar tools: Helgrind, DRD, Intel Parallel Inspector
● Based on run-time instrumentation○ Valgrind for Linux and Mac○ PIN for Windows
● Found 1000+ races in Google code since 2008● VERY slow (30x is not unusual)● Decided to use compiler instrumentation
○ A bit similar to LiteRace and Sun Studio (both proprietary)○ AddressSanitizer is a by-product

● High level: very similar to AddressSanitizer● Compiler:
○ Instrument every memory access (call run-time)○ Instrument function call/entry/exit
■ Unwind is slow, need shadow call stack● The rest happens in run-time
○ Same state machine as used with Valgrind○ Intercept various libc/pthread functions
● ~4x faster than with Valgrind (3x-10x)○ Also parallel
● Status: can build and run Chrome (GCC and LLVM)● State machine under redesign, expect to be even faster
ThreadSanitizer + compiler instrumentation

Challenge: detect UMRs
● Uninitialized Memory Read? Use Valgrind :( ● False positives if some stores are not instrumented● Need to instrument every store instruction in libraries● Hybrid tool?
○ Compiler instrumentation for user code○ Dynamic instrumentation (DynamoRIO?) for libraries

Challenge: statically avoid redundant checks
// Instrument only the first access*a = …if (…) *a = … // Instrument only the second access (?)if (…) … = *a*a = … // Instrument only a[0] and a[n-1]for (int i = 0; i < n; i++) a[i] = i; // Combine two accesses into onestruct { double align; int a, b; } x; …x.a = …; x.b = …

Q&A
http://code.google.com/p/address-sanitizer/
http://code.google.com/p/data-race-test/
Recommended


![Finding Errors in Multithreaded GUI Applications · 2017-05-03 · Invalid Thread Access Errors in practice • Pervasive –One of the top 3 bug categories in SWT [Shanmugam 2010]](https://img.pdfslide.net/doc/110x75/5fa45ad7e28a6c7e7f1c037b/finding-errors-in-multithreaded-gui-applications-2017-05-03-invalid-thread-access.jpg)