AHEC
2010 Indiana Mental Health Professionals Re-Licensure Survey Report
Produced by:
The Indiana Center for Health Workforce Studies
Bowen Research Center, Department of Family MedicineIndiana University School of Medicine
In collaboration with the:
Indiana Area Health Education Centers Program
January 2012
Authors:Cynthia K. Lewis, MPHZachary T. Sheff, BS, BAAmy E. Richard, BSAmy J. Brandt, BS Terrell W. Zollinger, DrPH

i
2010 Indiana Mental Health Professionals Re-Licensure Survey Report
Produced by:
The Indiana Center for Health Workforce Studies
Bowen Research Center, Department of Family Medicine Indiana University, School of Medicine
In Collaboration with:
The Indiana Area Health Education Centers Program
January 2012 Cynthia K. Lewis, MPH Zachary T. Sheff, BS, BA Amy E. Richard, BS Amy J. Brandt, BS Terrell W. Zollinger, DrPH
ii
Table of Contents Acknowledgements ...................................................................................................................................... iv
Executive Summary ....................................................................................................................................... v
Introduction ............................................................................................................................................... v
Methods .................................................................................................................................................... v
Results ....................................................................................................................................................... v
Mental Health Professional Re-Licensure Survey ................................................................................ v
Clinical Psychologists .......................................................................................................................... vi
Psychiatric Physicians ......................................................................................................................... vi
Psychiatric Advanced Practice Nurses ................................................................................................ vi
Location .............................................................................................................................................. vii
Conclusions ............................................................................................................................................. vii
Chapter 1: Introduction ............................................................................................................................... 1
Data Analysis ............................................................................................................................................ 1
Chapter 2: Responses to the 2010 Indiana Mental Health Professionals (Master’s-trained) Re-Licensure Survey............................................................................................................................................................ 2
Methods .................................................................................................................................................... 2
Inclusion and Exclusion Criteria .......................................................................................................... 3
Weighting for County Level Data ......................................................................................................... 4
Survey Response Rate ........................................................................................................................... 4
Demographic Composition ....................................................................................................................... 5
Practice Characteristics ............................................................................................................................. 8
Special Skills or Training ........................................................................................................................ 15
Chapter 3: Responses to the 2010 Clinical Psychologist Re-Licensure Survey ........................................... 16
Methods .................................................................................................................................................. 16
Inclusion and Exclusion Criteria ........................................................................................................ 17
Weighting for County Level Data ....................................................................................................... 18
Survey Response Rate ......................................................................................................................... 18
Demographic Composition ..................................................................................................................... 19
Practice Characteristics ........................................................................................................................... 22
Special Skills or Training ........................................................................................................................ 27
Chapter 4: Responses of 2011 Indiana Physician Survey, Psychiatrists Only ............................................. 28
iii
Methods .................................................................................................................................................. 28
Inclusion and Exclusion Criteria ........................................................................................................ 29
Weighting for County Level Data ....................................................................................................... 30
Survey Response Rate ......................................................................................................................... 30
Demographic Composition ..................................................................................................................... 31
Education or Training ............................................................................................................................. 34
Practice Characteristics ........................................................................................................................... 34
Chapter 5: Responses to the 2011 Indiana Psychiatric Advanced Practice Nurse Electronic Survey ........ 37
Methods .................................................................................................................................................. 37
Inclusion and Exclusion Criteria ........................................................................................................ 37
Weighting for County Level Data ....................................................................................................... 38
Survey Response Rate ......................................................................................................................... 39
Demographic Composition ..................................................................................................................... 39
Education or Training ............................................................................................................................. 40
Professional Characteristics .................................................................................................................... 40
Chapter 6: Location of Mental Health Professionals by County in Indiana ............................................... 44
Masters-trained Mental Health Professionals Distribution ..................................................................... 45
Psychologists Distribution ...................................................................................................................... 50
Psychiatrists Distribution ........................................................................................................................ 51
Psychiatric Advanced Practice Nurses Distribution ............................................................................... 52
Masters Trained Mental Health Professionals Ratios ............................................................................. 63
Psychologists Ratio ................................................................................................................................. 68
Psychiatrists Ratio ................................................................................................................................... 69
Psychiatric Advanced Practice Nurses Ratio .......................................................................................... 70
Chapter 7: Conclusions .............................................................................................................................. 81
Appendix 1- A: 2010 Indiana Mental Health Professionals Re-Licensure Survey ....................................... 83
Appendix I-B: 2010 Clinical Psychologists Re-Licensure Survey ................................................................. 87
Appendix 1-C: 2009 Indiana Physician Re-Licensure Survey ...................................................................... 93
2007 SPECIALTY LIST ......................................................................................................................... 95
Appendix 1D: 2011 Indiana Psychiatric Advanced Practice Nurse On-line Survey ................................... 100
iv
Acknowledgements
We would like to extend our gratitude to all the talented and dedicated individuals who provided
valuable and timely assistance to us during the project. Preparing this report required the assistance,
cooperation, and effort of many individuals and agency staff. The survey data and additional data
elements were provided by the Indiana Professional Licensing Agency through the Indiana State
Department of Health. An advisory committee provided direction and insights regarding the data analysis
and report generation:
Margaret Adamek, PhD, Director of PhD program, Indiana University School of Social Work
Jennifer Bruner, Staff Attorney, Indiana State Department of Health
Andrew Chambers, MD, Associate Professor of Psychiatry, Fellow in Psychiatric Addictionology,
Assistant Medical Director, Indiana Division of Mental Health and Addiction, Indiana University
School of Medicine; Director of Laboratory for Translational Neuroscience of Dual Diagnosis &
Development, Institute of Psychiatric Research
Tasha Coleman, Board Director, Psychology board, Indiana Professional Licensing Agency
Emilee Delbridge, MA, LMFT, Visiting Lecturer, Behavioral Science Intern, Department of Family
Medicine, Indiana University School of Medicine
Josephine Hughes, MSW, LCSW, Executive Director, National Association of Social Workers: Indiana
Chapter
Ernest Klein, RN, CAE, Executive Director, Indiana State Nurses Association
Thomas McGee, Board Director, Behavioral Health and Human Services board, Indiana Professional
Licensing Agency
John McGrew, PhD, Director, Clinical Psychology program, Professor of Psychology, Indiana University
Purdue University-Indianapolis School of Science, Department of Psychology
The cooperation and support of the Indiana State Department of Health was instrumental in obtaining
the survey data delivery and interpretation. The authors are grateful for the financial support received
from the Indiana Area Health Education Centers Program to produce this report.
Cynthia K. Lewis, MPH Zachary T. Sheff, BS, BA Amy E. Richard, BS Amy J. Brandt, BS Terrell W. Zollinger, DrPH
v
Executive Summary
Introduction The 2010 Indiana Mental Health Professionals Re-Licensure Survey, the 2010 Clinical
Psychologists Re-Licensure Survey, and the 2011 Physician Re-Licensure Survey were administered by
the Indiana Professional Licensing Agency under a contract with the Indiana State Department of Health.
The 2011 Psychiatric Advanced Practice Nurse Survey was administered by the Indiana Nursing
Association. This report summarizes the responses to these four surveys. The purpose of this report is to
provide a comprehensive description of the mental health workforce in Indiana.
Methods The survey instruments included items regarding demographic composition, practice
characteristics, and special skills or training. This report includes the survey responses from only those
mental health professionals, clinical psychologists, psychiatric nurses and psychiatrists who met the
inclusion criteria. A total of 4,950 masters-trained mental health professionals were included in the
analyses presented in this report, as were 851 clinical psychologists and 52 psychiatric advanced practice
nurses. All 459 psychiatrists who met the inclusion criteria and identified one of the following
specialties: addiction medicine, psychiatry, addiction psychiatry, child psychiatry, forensic psychiatry,
geriatric psychiatry, pain medicine psychiatry, psychoanalysis psychiatry, or psychosomatic medicine
psychiatry also were included in this report. Inclusion criteria required the professionals to identify their
practice location as a non-federal psychiatric hospital, possess an active or probationary license, identify
Indiana as their primary practice location, and answer at least one question on the survey instrument.
Results
Mental Health Professional Re-Licensure Survey The masters-trained mental health professionals in this chapter include social workers, marriage
and family therapists, mental health counselors and other masters-trained mental health professionals
One-third of the respondents were younger than 44 years of age and forty percent were at or near
retirement age (55 and older). There were more than three times as many female respondents (76.6%) as
there were male (23.4%) respondents. A majority of the respondents were white (92.4%) and 98 percent
were of non-Hispanic origin. The majority of respondents’ professional time was spent in social work
followed by mental health counseling. Mental health professionals specializing in marriage and family
therapy made up only 8.6 percent of respondents, and 41.8 percent of these were between the ages of 55
vi
and 64. The most common specialty areas of respondents were: general mental health, anxiety disorders,
and mood disorders.
Clinical Psychologists Clinical psychologists were evenly split between males and females (50.1% and 49.9%,
respectively). Nearly half of respondents (47.7%) were between the ages of 35 and 54. Gender and age
cross-tabulation revealed that 80.2 percent of psychologists under the age of 35 were female and that 63.1
percent of respondents over the age of 54 were male. The majority of respondents were white (93.9%)
and non-Hispanic (98.1%). Respondents reported that direct patient care took up the majority of their
time at work (79.2%), and only 6.4 percent of respondents performed jobs that did not include patient
care. Over two-thirds of respondents indicated that they worked 40 or more hours per week (70.2%). Of
psychologists working less than 10 hours per week, 58.2 percent were over the age of 55.
Psychiatric Physicians Physicians who indicated that they were practicing in one of the following specialties: addiction
medicine, psychiatry, addiction psychiatry, child psychiatry, forensic psychiatry, geriatric psychiatry, pain
medicine psychiatry, psychoanalysis psychiatry, or psychosomatic medicine psychiatry, were included in
this report. There are nearly twice as many males (64.8%) as females (35.2%) and most respondents were
white (70.0%) and of non-Hispanic origin (96.0%). Almost half of all respondents (48.1%) were between
the ages of 35 and 54, and the mean age of respondents was 52.6 years old. The majority of survey
respondents completed residency and/or fellowship training in the United States, but in a state other than
Indiana. Over half spent 40 or more hours per week performing all psychiatric physician activities. The
majority did accept Medicaid patients.
Psychiatric Advanced Practice Nurses The majority of psychiatric advanced practice nurses were white (96.2%), female (92.2%), and
non-Hispanic (98.0%). The most common degree obtained by psychiatric advanced practice nurses was a
Master’s (75.0%). Psychiatric advanced practice nurses most often worked in public/community health
settings (30.8%) and hospitals (26.9%). Approximately one-half (47.1%) of psychiatric advanced
practice nurses worked more than 40 hours per week. The primary work activity for 55.8 percent of
respondents was psychopharmacological intervention. One-quarter of the respondents worked multiple
jobs. Only 3.83 percent of respondents indicated that they were two to three years from retirement while
55.8 percent said that they were more than 10 years from retiring.
vii
Location Graphic information system (GIS) maps illustrated that, as expected, the counties with the highest
populations generally had the most mental health professionals. The maps illustrate estimated number of
mental health professionals, social workers, marriage and family therapists, mental health counselors and
other mental health professions separately.
Conclusions Mental health professionals and psychiatric advanced practice nurses were predominantly white,
non-Hispanic females. Clinical psychologists were evenly distributed among male and females, but
females seem to be entering the field in much greater numbers than males. Psychiatric physicians were
predominantly white, non-Hispanic males. Most respondents reported that the majority of their time at
work was spent providing direct patient care. As expected, the distribution of mental health professionals
was higher in areas with higher population. The gender gap that exists in mental health professionals and
psychiatric advanced practice nurses should be addressed, as well as the lack of racial and ethnic diversity
and need for more bilingual mental health professionals. Individuals considering a career in healthcare
should be encouraged to enter the mental health field.
1
Chapter 1: Introduction Understanding the personal and professional characteristics of mental health professionals
licensed in Indiana is essential for the development and management of programs that effectively recruit
and retain mental health professionals where they are most needed in the state. Quality data about mental
health professionals in Indiana will help policymakers and other stakeholders make better-informed
decisions regarding the mental health professional workforce in our state. The purpose of this report is to
provide those data. The findings from this report may be used to identify mental health professional
shortage areas and develop more effective recruitment and retention strategies.
The Indiana State Department of Health (ISDH) and the Indiana Professional Licensing Agency
(IPLA) collaborated in implementing the 2010 Indiana Mental Health Professionals Re-Licensure Survey,
the 2010 Clinical Psychologists Re-Licensure Survey, and the 2011 Physician Re-Licensure Survey. The
2011 Psychiatric Advanced Practice Nurse Survey was administered by the Indiana Nursing Association.
All mental health professionals who renewed their licenses online, as well as the psychiatric advanced
practice nurses were asked to complete a voluntary survey instrument. This report summarizes the
responses to these surveys to provide a comprehensive description of the mental health workforce in
Indiana.
Data Analysis Frequency and cross-tabulation analyses were performed to describe the characteristics of the
mental health professionals within Indiana. The data were coded in Microsoft Excel 2007® and analyzed
using SAS 9.3 and IBM SPSS Statistics 19. Graphical information system (GIS) maps were developed to
illustrate the number of mental health professionals per Indiana county, as well as the number of mental
health professionals per 100,000 residents. Rural counties are defined by the United States Department of
Agriculture as non-metropolitan counties and are designated by hash marks on the maps. The GIS maps
were designed in ArcGIS™ 9.3. The estimated number of mental health professionals per county was
based on the respondents’ principal practice location. The total number of respondents in each county
was adjusted using a weight calculated for each profession, except for psychiatric advanced practice
nurses, in order to estimate the total number of mental health professionals available to serve the
community in each county. Thus, the counts of the masters-trained mental health professionals, clinical
psychologists, and psychiatrists are estimates of the actual number of mental health professionals in each
county. The counts of psychiatric advanced practice nurse are the number of survey respondents in each
county. The weights and how each was calculated are described in the Methods section of each chapter.
2
Chapter 2: Responses to the 2010 Indiana Mental Health Professionals (Master’s-trained) Re-Licensure Survey
The results in this chapter reflect the personal and professional characteristics of those master’s-
trained mental health professionals licensed in Indiana who responded to the 2010 Indiana Mental Health
Professionals Re-Licensure Survey. The master’s-trained professionals included in this chapter are social
workers, marriage and family therapists, mental health counselors, and other master’s-trained mental
health professionals.
Caution should be taken when making generalizations about all Indiana mental health
professionals since those who renewed their license by paper, as well as those who did not respond to the
electronic survey, were not included in these results. Consequently, the results shown for the survey
respondents may not be representative of all licensed mental health professionals in Indiana. Each table
shows the number of valid and missing responses to each survey item and the percentage of valid
responses. The text describes the responses to the survey.
Methods The data used for this report were extracted from the 2010 Indiana Mental Health Professionals
Re-Licensure Survey data files provided by the Indiana State Department of Health and included
responses to questions designed to collect information regarding demographic composition, practice
characteristics, and special skills or training. A copy of the 2010 Indiana Mental Health Professional Re-
Licensure Survey is included in Appendix 1-A. The data provided by the IPLA included date of birth for
all licensed mental health professionals who were practicing in Indiana at the time of the survey. The
datasets were merged in order to match the respondents’ approximate age to his or her survey responses.
The datasets were merged by matching the license number of each mental health professional using SAS
9.3 and age was calculated using March 1, 2010 as a reference point since surveys were completed from
January 30, 2010 through March 31, 2010. The merged dataset was then used to filter the records to
include only the respondents who met the inclusion criteria. The merged dataset included only those
mental health professionals who renewed their license electronically.
3
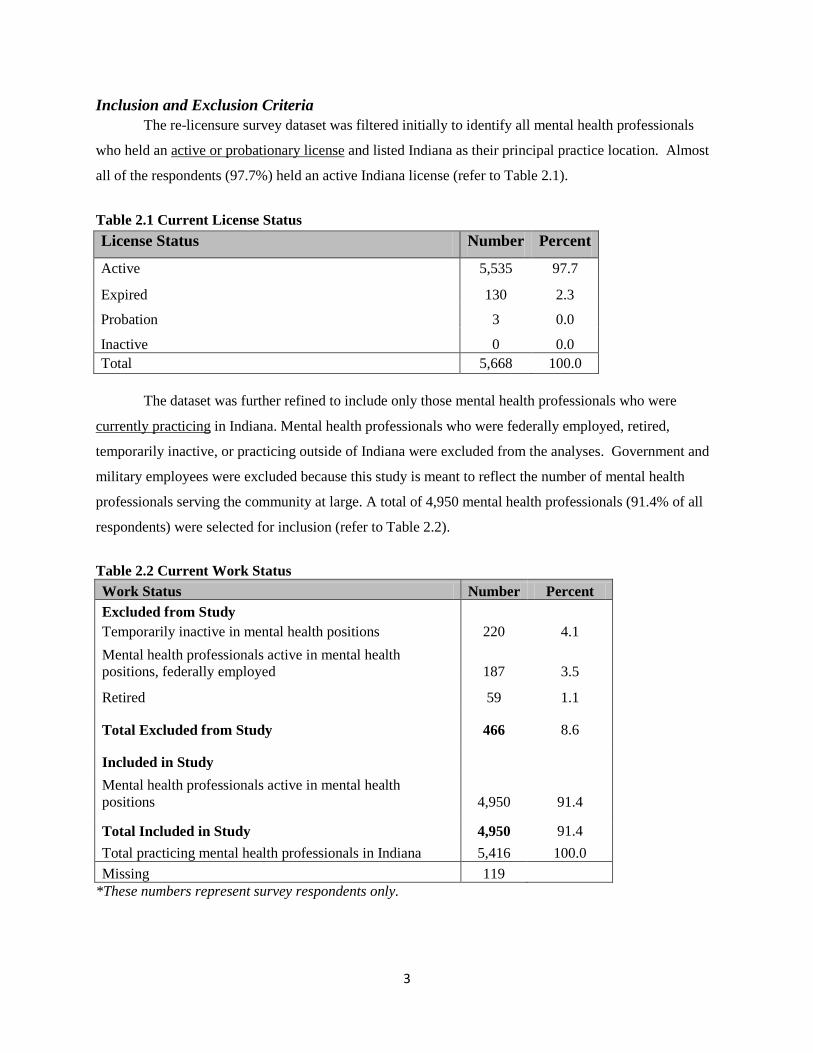
Inclusion and Exclusion Criteria The re-licensure survey dataset was filtered initially to identify all mental health professionals
who held an active or probationary license and listed Indiana as their principal practice location. Almost
all of the respondents (97.7%) held an active Indiana license (refer to Table 2.1).
Table 2.1 Current License Status License Status Number Percent
Active 5,535 97.7
Expired 130 2.3
Probation 3 0.0
Inactive 0 0.0 Total 5,668 100.0
The dataset was further refined to include only those mental health professionals who were
currently practicing in Indiana. Mental health professionals who were federally employed, retired,
temporarily inactive, or practicing outside of Indiana were excluded from the analyses. Government and
military employees were excluded because this study is meant to reflect the number of mental health
professionals serving the community at large. A total of 4,950 mental health professionals (91.4% of all
respondents) were selected for inclusion (refer to Table 2.2).
Table 2.2 Current Work Status Work Status Number Percent Excluded from Study
Temporarily inactive in mental health positions 220 4.1 Mental health professionals active in mental health positions, federally employed 187 3.5
Retired 59 1.1
Total Excluded from Study 466 8.6
Included in Study
Mental health professionals active in mental health positions 4,950 91.4
Total Included in Study 4,950 91.4 Total practicing mental health professionals in Indiana 5,416 100.0 Missing 119
*These numbers represent survey respondents only.
4
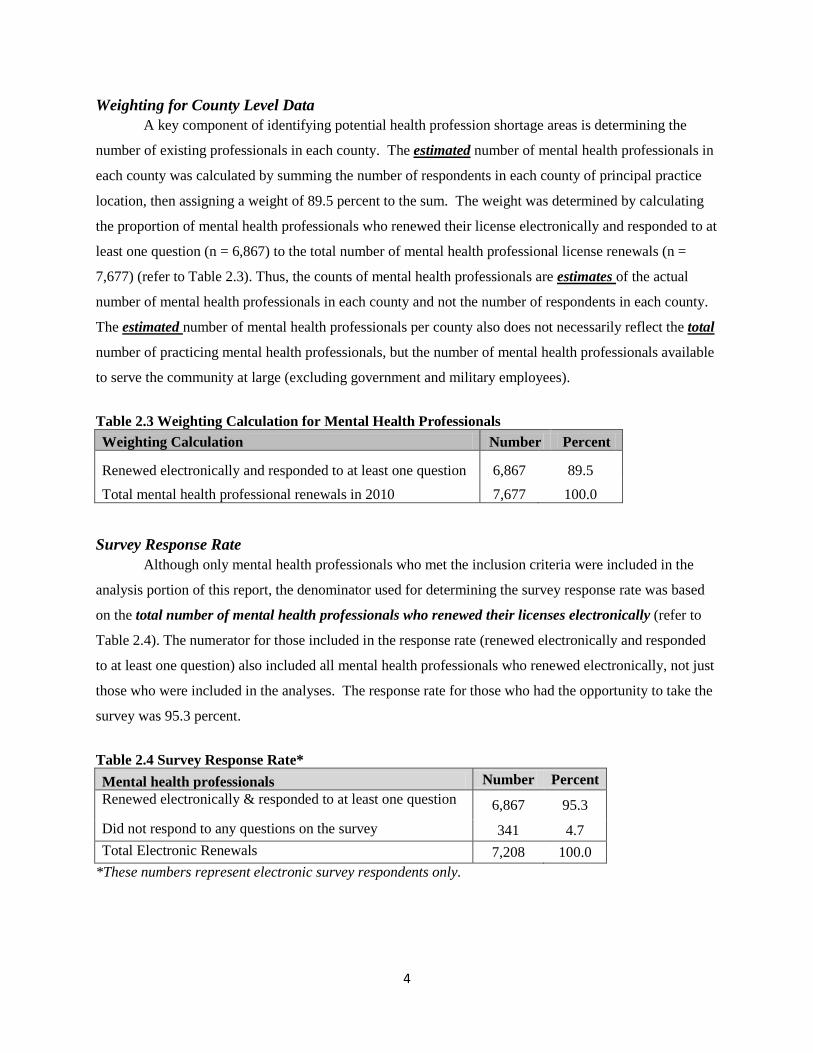
Weighting for County Level Data A key component of identifying potential health profession shortage areas is determining the
number of existing professionals in each county. The estimated number of mental health professionals in
each county was calculated by summing the number of respondents in each county of principal practice
location, then assigning a weight of 89.5 percent to the sum. The weight was determined by calculating
the proportion of mental health professionals who renewed their license electronically and responded to at
least one question (n = 6,867) to the total number of mental health professional license renewals (n =
7,677) (refer to Table 2.3). Thus, the counts of mental health professionals are estimates of the actual
number of mental health professionals in each county and not the number of respondents in each county.
The estimated number of mental health professionals per county also does not necessarily reflect the total
number of practicing mental health professionals, but the number of mental health professionals available
to serve the community at large (excluding government and military employees).
Table 2.3 Weighting Calculation for Mental Health Professionals Weighting Calculation Number Percent
Renewed electronically and responded to at least one question 6,867 89.5 Total mental health professional renewals in 2010 7,677 100.0
Survey Response Rate Although only mental health professionals who met the inclusion criteria were included in the
analysis portion of this report, the denominator used for determining the survey response rate was based
on the total number of mental health professionals who renewed their licenses electronically (refer to
Table 2.4). The numerator for those included in the response rate (renewed electronically and responded
to at least one question) also included all mental health professionals who renewed electronically, not just
those who were included in the analyses. The response rate for those who had the opportunity to take the
survey was 95.3 percent.
Table 2.4 Survey Response Rate* Mental health professionals Number Percent Renewed electronically & responded to at least one question
6,867 95.3 Did not respond to any questions on the survey 341 4.7 Total Electronic Renewals 7,208 100.0
*These numbers represent electronic survey respondents only.
5
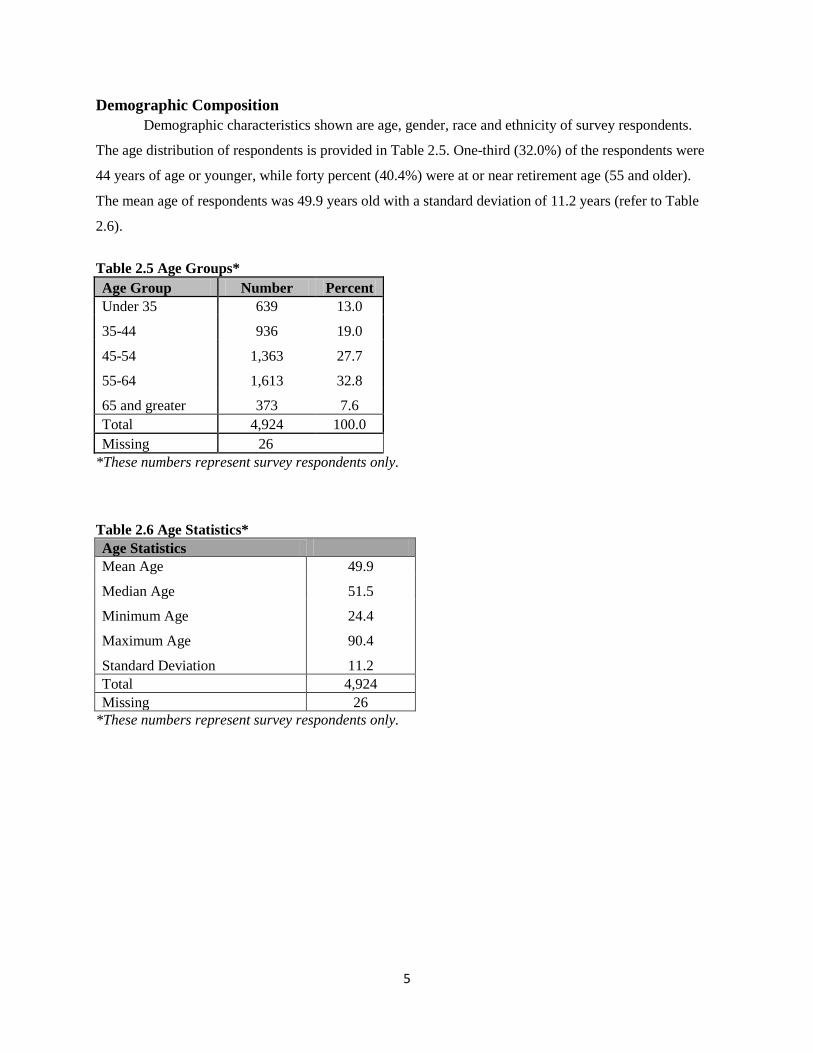
Demographic Composition Demographic characteristics shown are age, gender, race and ethnicity of survey respondents.
The age distribution of respondents is provided in Table 2.5. One-third (32.0%) of the respondents were
44 years of age or younger, while forty percent (40.4%) were at or near retirement age (55 and older).
The mean age of respondents was 49.9 years old with a standard deviation of 11.2 years (refer to Table
2.6).
Table 2.5 Age Groups* Age Group Number Percent Under 35 639 13.0
35-44 936 19.0
45-54
55-64
1,363
1,613
27.7
32.8
65 and greater 373 7.6 Total 4,924 100.0 Missing 26
*These numbers represent survey respondents only. Table 2.6 Age Statistics* Age Statistics Mean Age 49.9
Median Age 51.5
Minimum Age 24.4
Maximum Age 90.4
Standard Deviation 11.2 Total 4,924 Missing 26
*These numbers represent survey respondents only.
6
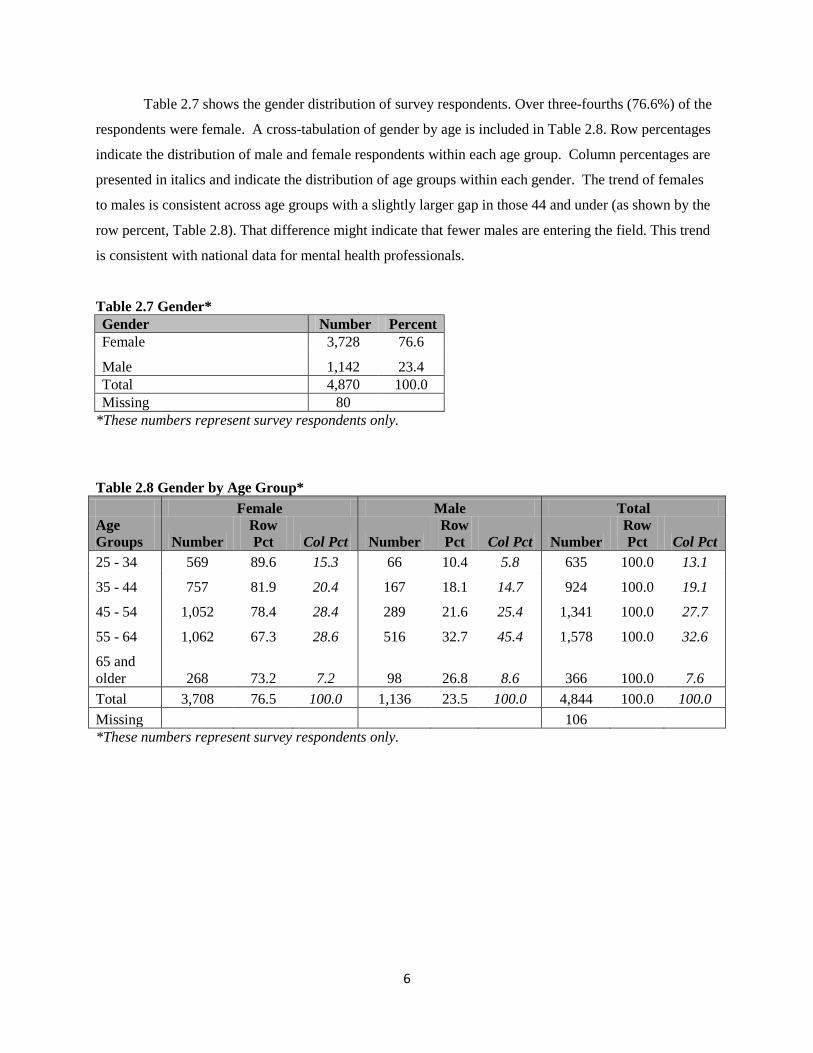
Table 2.7 shows the gender distribution of survey respondents. Over three-fourths (76.6%) of the
respondents were female. A cross-tabulation of gender by age is included in Table 2.8. Row percentages
indicate the distribution of male and female respondents within each age group. Column percentages are
presented in italics and indicate the distribution of age groups within each gender. The trend of females
to males is consistent across age groups with a slightly larger gap in those 44 and under (as shown by the
row percent, Table 2.8). That difference might indicate that fewer males are entering the field. This trend
is consistent with national data for mental health professionals.
Table 2.7 Gender* Gender Number Percent Female 3,728 76.6
Male 1,142 23.4 Total 4,870 100.0 Missing 80
*These numbers represent survey respondents only. Table 2.8 Gender by Age Group* Female Male Total Age Groups Number
Row Pct Col Pct Number
Row Pct Col Pct Number
Row Pct Col Pct
25 - 34 569 89.6 15.3 66 10.4 5.8 635 100.0 13.1
35 - 44 757 81.9 20.4 167 18.1 14.7 924 100.0 19.1
45 - 54 1,052 78.4 28.4 289 21.6 25.4 1,341 100.0 27.7
55 - 64 1,062 67.3 28.6 516 32.7 45.4 1,578 100.0 32.6
65 and older 268 73.2 7.2 98 26.8 8.6 366 100.0 7.6 Total 3,708 76.5 100.0 1,136 23.5 100.0 4,844 100.0 100.0 Missing 106 *These numbers represent survey respondents only.
7
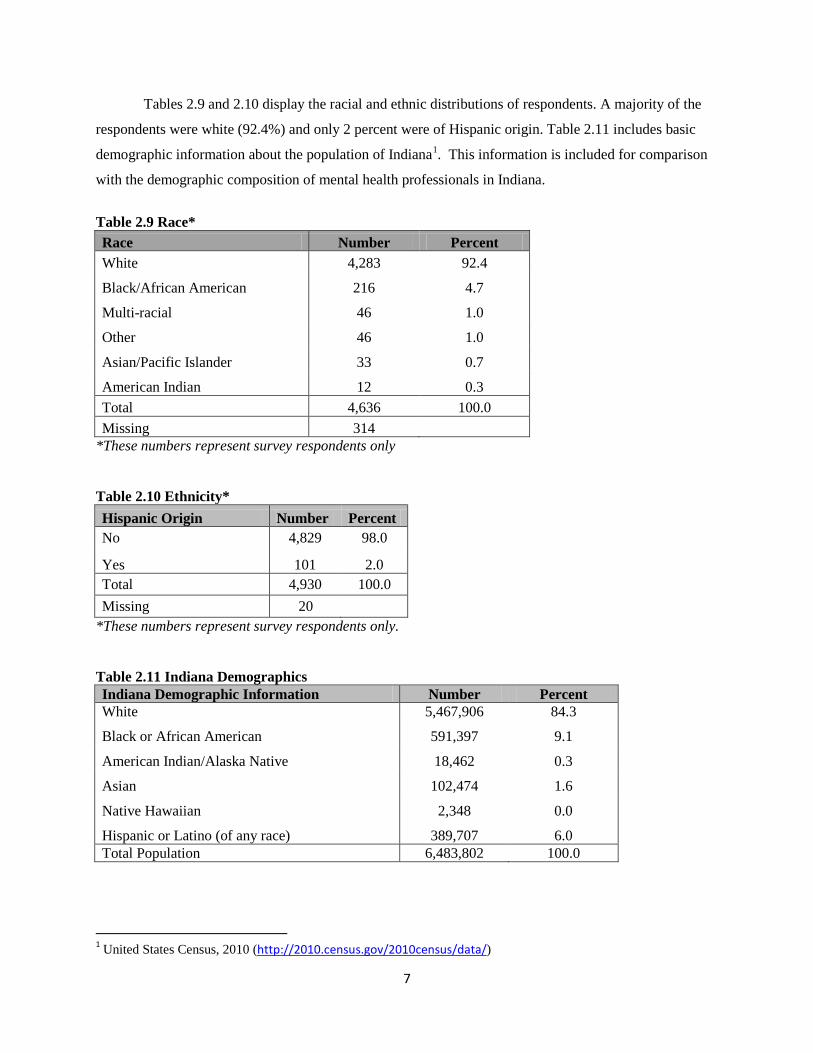
Tables 2.9 and 2.10 display the racial and ethnic distributions of respondents. A majority of the
respondents were white (92.4%) and only 2 percent were of Hispanic origin. Table 2.11 includes basic
demographic information about the population of Indiana1
. This information is included for comparison
with the demographic composition of mental health professionals in Indiana.
Table 2.9 Race* Race Number Percent White 4,283 92.4
Black/African American 216 4.7
Multi-racial 46 1.0
Other 46 1.0
Asian/Pacific Islander 33 0.7
American Indian 12 0.3 Total 4,636 100.0 Missing 314
*These numbers represent survey respondents only
Table 2.10 Ethnicity* Hispanic Origin Number Percent No 4,829 98.0
Yes 101 2.0 Total 4,930 100.0 Missing 20
*These numbers represent survey respondents only. Table 2.11 Indiana Demographics Indiana Demographic Information Number Percent White 5,467,906 84.3
Black or African American 591,397 9.1
American Indian/Alaska Native 18,462 0.3
Asian 102,474 1.6
Native Hawaiian 2,348 0.0
Hispanic or Latino (of any race) 389,707 6.0 Total Population 6,483,802 100.0
1 United States Census, 2010 (http://2010.census.gov/2010census/data/)
8
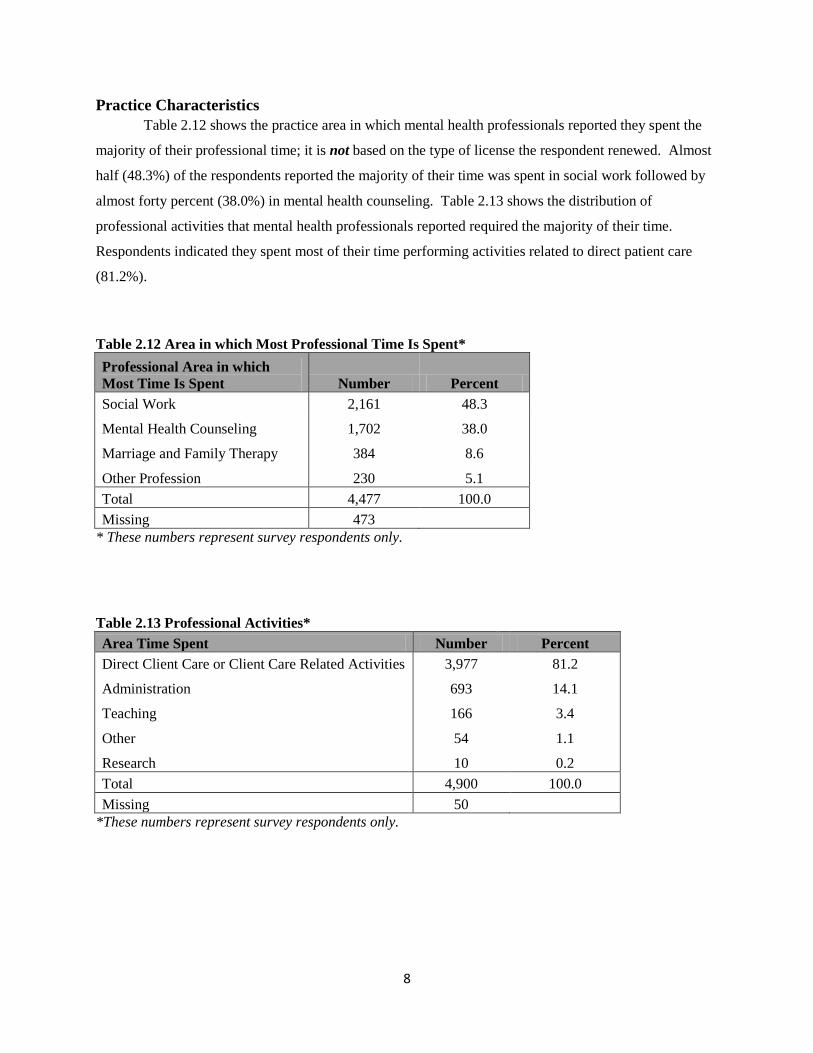
Practice Characteristics Table 2.12 shows the practice area in which mental health professionals reported they spent the
majority of their professional time; it is not based on the type of license the respondent renewed. Almost
half (48.3%) of the respondents reported the majority of their time was spent in social work followed by
almost forty percent (38.0%) in mental health counseling. Table 2.13 shows the distribution of
professional activities that mental health professionals reported required the majority of their time.
Respondents indicated they spent most of their time performing activities related to direct patient care
(81.2%).
Table 2.12 Area in which Most Professional Time Is Spent* Professional Area in which Most Time Is Spent Number Percent Social Work 2,161 48.3
Mental Health Counseling 1,702 38.0
Marriage and Family Therapy 384 8.6
Other Profession 230 5.1 Total 4,477 100.0 Missing 473
* These numbers represent survey respondents only.
Table 2.13 Professional Activities* Area Time Spent Number Percent Direct Client Care or Client Care Related Activities 3,977 81.2
Administration 693 14.1
Teaching 166 3.4
Other 54 1.1
Research 10 0.2 Total 4,900 100.0 Missing 50
*These numbers represent survey respondents only.
9
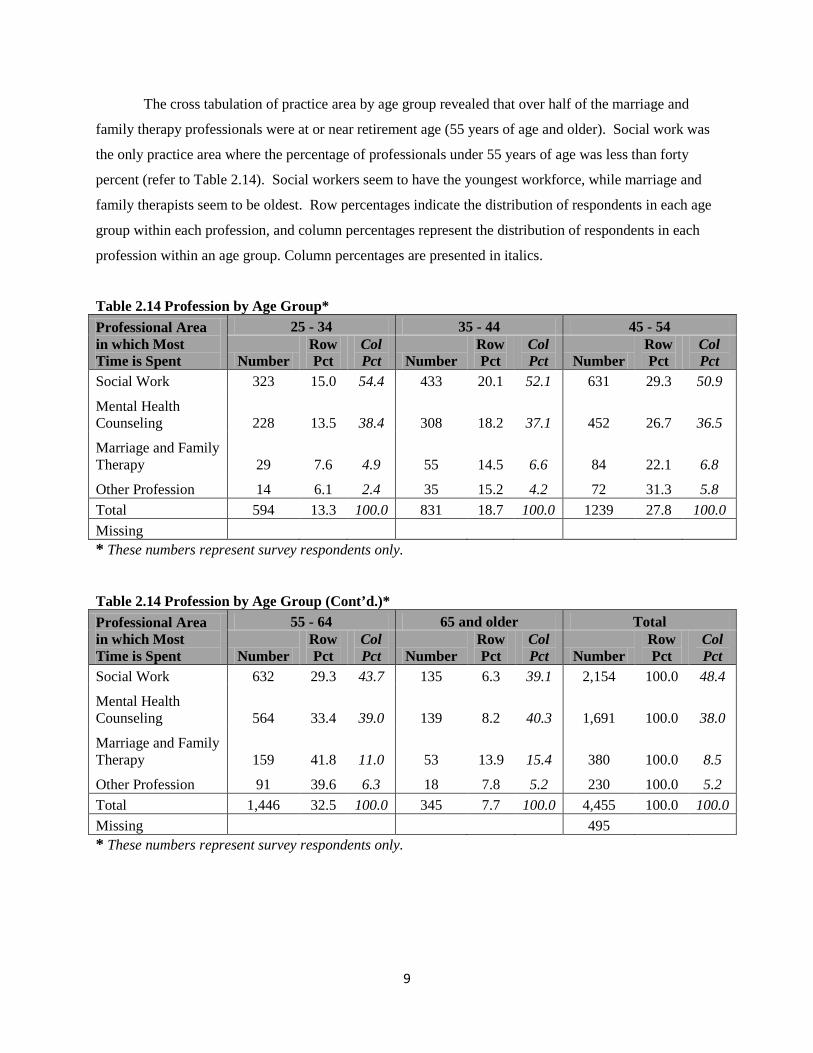
The cross tabulation of practice area by age group revealed that over half of the marriage and
family therapy professionals were at or near retirement age (55 years of age and older). Social work was
the only practice area where the percentage of professionals under 55 years of age was less than forty
percent (refer to Table 2.14). Social workers seem to have the youngest workforce, while marriage and
family therapists seem to be oldest. Row percentages indicate the distribution of respondents in each age
group within each profession, and column percentages represent the distribution of respondents in each
profession within an age group. Column percentages are presented in italics.
Table 2.14 Profession by Age Group* Professional Area in which Most Time is Spent
25 - 34 35 - 44 45 - 54
Number Row Pct
Col Pct Number
Row Pct
Col Pct Number
Row Pct
Col Pct
Social Work 323 15.0 54.4 433 20.1 52.1 631 29.3 50.9
Mental Health Counseling 228 13.5 38.4 308 18.2 37.1 452 26.7 36.5
Marriage and Family Therapy 29 7.6 4.9 55 14.5 6.6 84 22.1 6.8
Other Profession 14 6.1 2.4 35 15.2 4.2 72 31.3 5.8 Total 594 13.3 100.0 831 18.7 100.0 1239 27.8 100.0 Missing * These numbers represent survey respondents only.
Table 2.14 Profession by Age Group (Cont’d.)* Professional Area in which Most Time is Spent
55 - 64 65 and older Total
Number Row Pct
Col Pct Number
Row Pct
Col Pct Number
Row Pct
Col Pct
Social Work 632 29.3 43.7 135 6.3 39.1 2,154 100.0 48.4
Mental Health Counseling 564 33.4 39.0 139 8.2 40.3 1,691 100.0 38.0
Marriage and Family Therapy 159 41.8 11.0 53 13.9 15.4 380 100.0 8.5
Other Profession 91 39.6 6.3 18 7.8 5.2 230 100.0 5.2 Total 1,446 32.5 100.0 345 7.7 100.0 4,455 100.0 100.0 Missing 495 * These numbers represent survey respondents only.
10
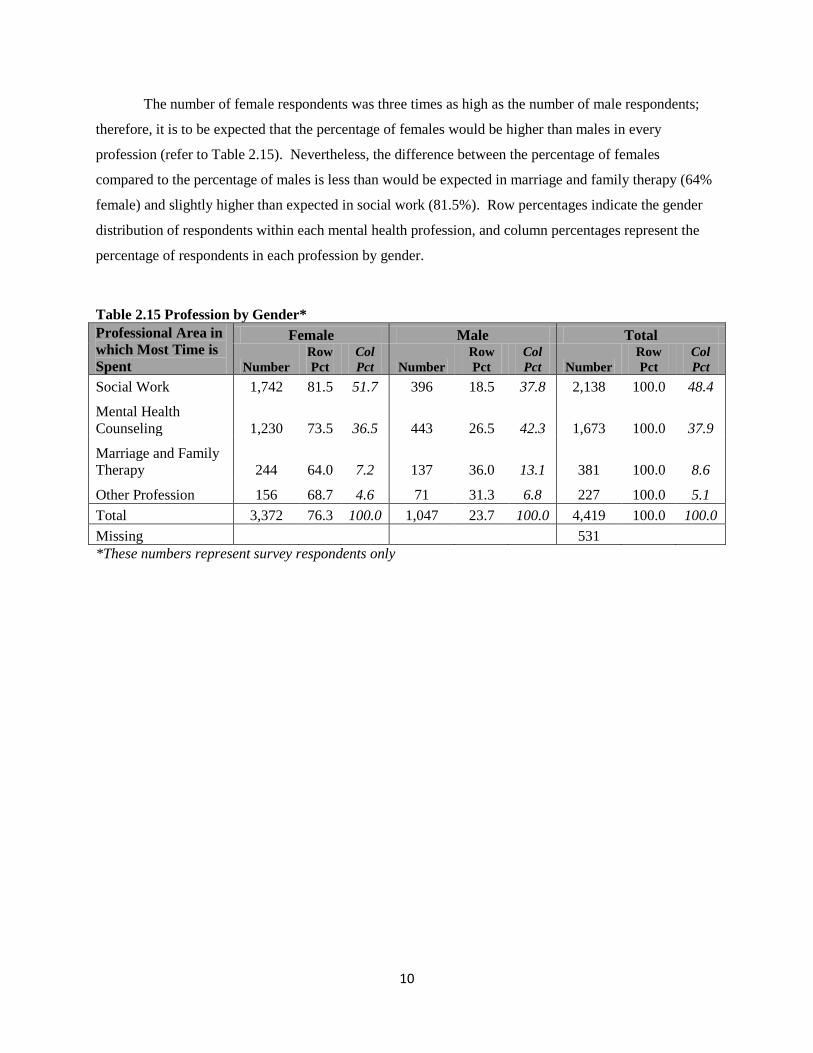
The number of female respondents was three times as high as the number of male respondents;
therefore, it is to be expected that the percentage of females would be higher than males in every
profession (refer to Table 2.15). Nevertheless, the difference between the percentage of females
compared to the percentage of males is less than would be expected in marriage and family therapy (64%
female) and slightly higher than expected in social work (81.5%). Row percentages indicate the gender
distribution of respondents within each mental health profession, and column percentages represent the
percentage of respondents in each profession by gender.
Table 2.15 Profession by Gender* Professional Area in which Most Time is Spent
Female Male Total
Number Row Pct
Col Pct Number
Row Pct
Col Pct Number
Row Pct
Col Pct
Social Work 1,742 81.5 51.7 396 18.5 37.8 2,138 100.0 48.4
Mental Health Counseling 1,230 73.5 36.5 443 26.5 42.3 1,673 100.0 37.9
Marriage and Family Therapy 244 64.0 7.2 137 36.0 13.1 381 100.0 8.6
Other Profession 156 68.7 4.6 71 31.3 6.8 227 100.0 5.1 Total 3,372 76.3 100.0 1,047 23.7 100.0 4,419 100.0 100.0 Missing 531 *These numbers represent survey respondents only
11
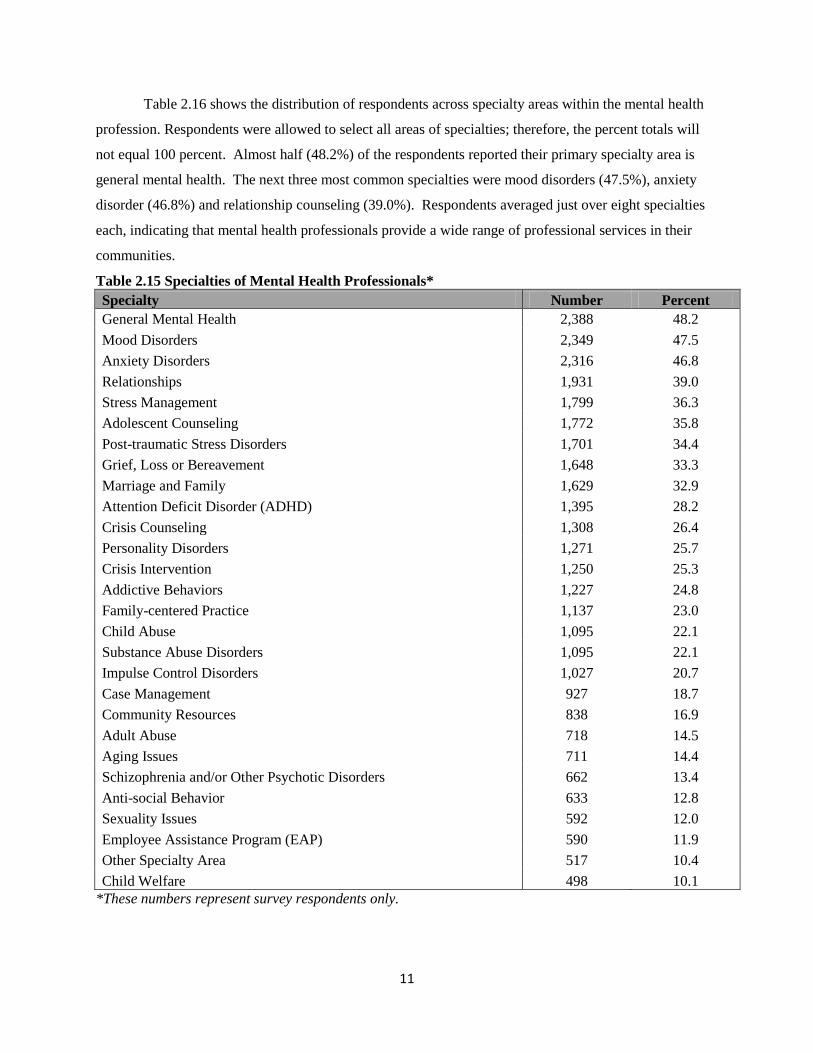
Table 2.16 shows the distribution of respondents across specialty areas within the mental health
profession. Respondents were allowed to select all areas of specialties; therefore, the percent totals will
not equal 100 percent. Almost half (48.2%) of the respondents reported their primary specialty area is
general mental health. The next three most common specialties were mood disorders (47.5%), anxiety
disorder (46.8%) and relationship counseling (39.0%). Respondents averaged just over eight specialties
each, indicating that mental health professionals provide a wide range of professional services in their
communities.
Table 2.15 Specialties of Mental Health Professionals* Specialty Number Percent General Mental Health 2,388 48.2 Mood Disorders 2,349 47.5 Anxiety Disorders 2,316 46.8 Relationships 1,931 39.0 Stress Management 1,799 36.3 Adolescent Counseling 1,772 35.8 Post-traumatic Stress Disorders 1,701 34.4 Grief, Loss or Bereavement 1,648 33.3 Marriage and Family 1,629 32.9 Attention Deficit Disorder (ADHD) 1,395 28.2 Crisis Counseling 1,308 26.4 Personality Disorders 1,271 25.7 Crisis Intervention 1,250 25.3 Addictive Behaviors 1,227 24.8 Family-centered Practice 1,137 23.0 Child Abuse 1,095 22.1 Substance Abuse Disorders 1,095 22.1 Impulse Control Disorders 1,027 20.7 Case Management 927 18.7 Community Resources 838 16.9 Adult Abuse 718 14.5 Aging Issues 711 14.4 Schizophrenia and/or Other Psychotic Disorders 662 13.4 Anti-social Behavior 633 12.8 Sexuality Issues 592 12.0 Employee Assistance Program (EAP) 590 11.9 Other Specialty Area 517 10.4 Child Welfare 498 10.1
*These numbers represent survey respondents only.
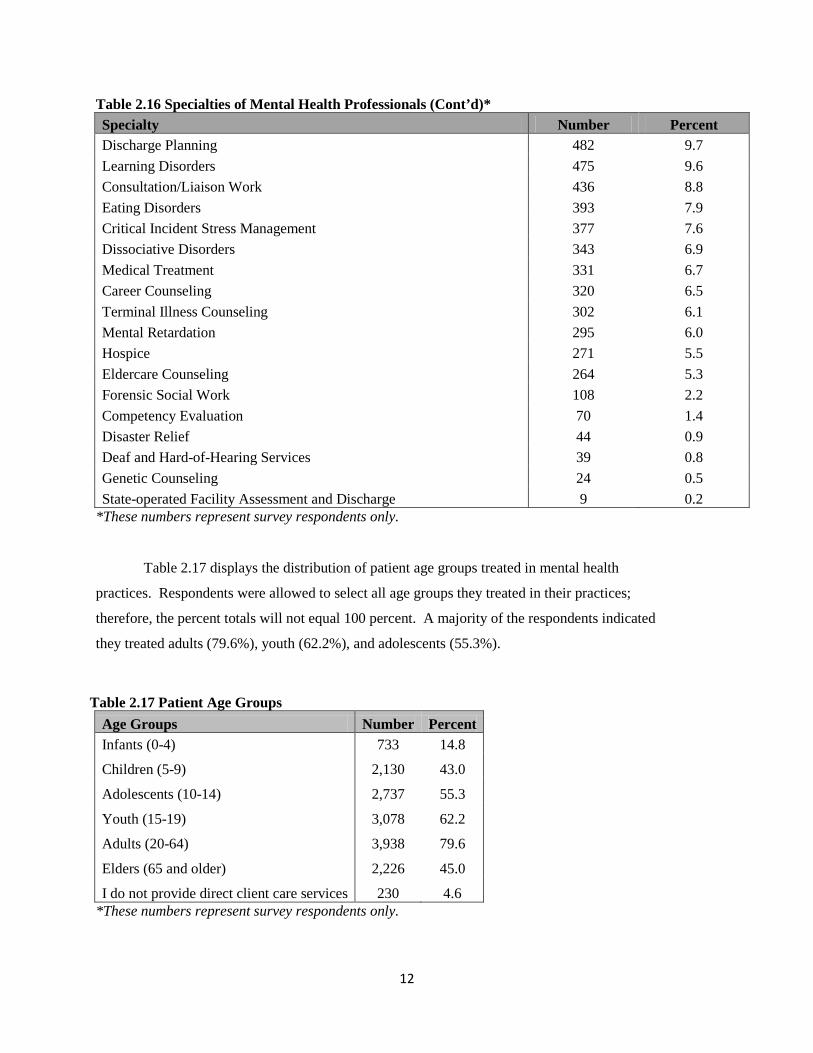
12
Table 2.16 Specialties of Mental Health Professionals (Cont’d)* Specialty Number Percent Discharge Planning 482 9.7 Learning Disorders 475 9.6 Consultation/Liaison Work 436 8.8 Eating Disorders 393 7.9 Critical Incident Stress Management 377 7.6 Dissociative Disorders 343 6.9 Medical Treatment 331 6.7 Career Counseling 320 6.5 Terminal Illness Counseling 302 6.1 Mental Retardation 295 6.0 Hospice 271 5.5 Eldercare Counseling 264 5.3 Forensic Social Work 108 2.2 Competency Evaluation 70 1.4 Disaster Relief 44 0.9 Deaf and Hard-of-Hearing Services 39 0.8 Genetic Counseling 24 0.5 State-operated Facility Assessment and Discharge 9 0.2
*These numbers represent survey respondents only.
Table 2.17 displays the distribution of patient age groups treated in mental health
practices. Respondents were allowed to select all age groups they treated in their practices;
therefore, the percent totals will not equal 100 percent. A majority of the respondents indicated
they treated adults (79.6%), youth (62.2%), and adolescents (55.3%).
Table 2.17 Patient Age Groups
Age Groups Number Percent Infants (0-4) 733 14.8
Children (5-9) 2,130 43.0
Adolescents (10-14) 2,737 55.3
Youth (15-19) 3,078 62.2
Adults (20-64) 3,938 79.6
Elders (65 and older) 2,226 45.0
I do not provide direct client care services 230 4.6 *These numbers represent survey respondents only.
13
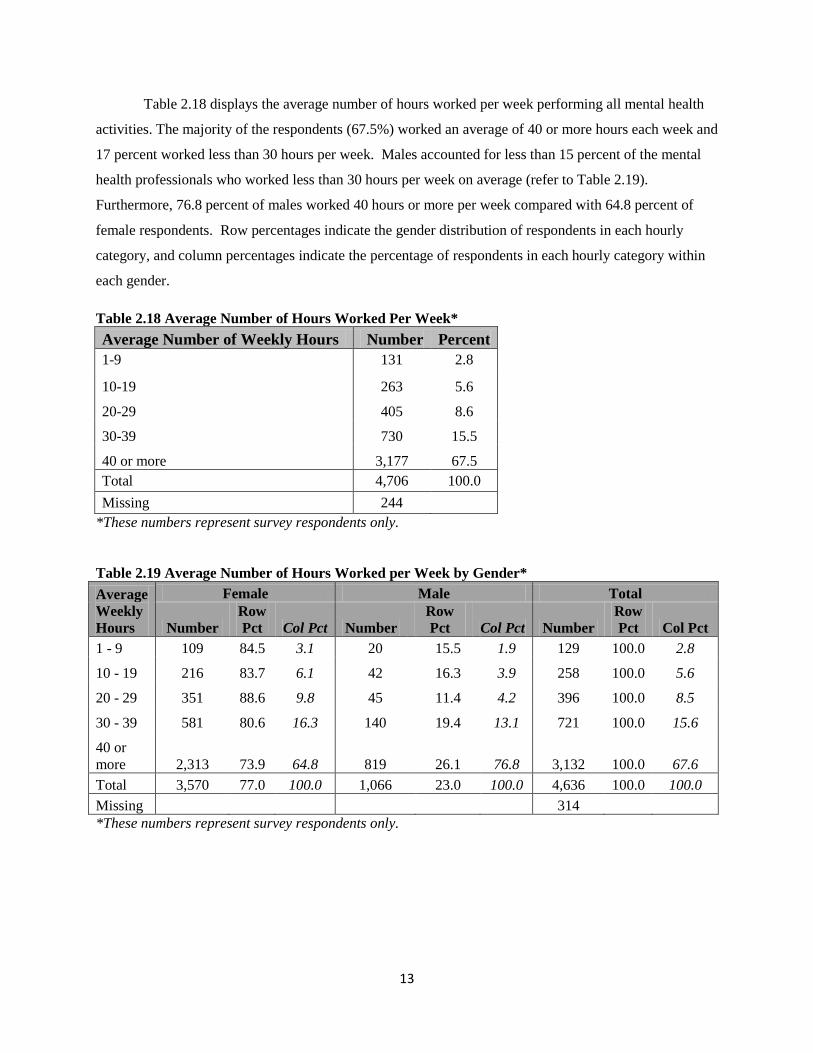
Table 2.18 displays the average number of hours worked per week performing all mental health
activities. The majority of the respondents (67.5%) worked an average of 40 or more hours each week and
17 percent worked less than 30 hours per week. Males accounted for less than 15 percent of the mental
health professionals who worked less than 30 hours per week on average (refer to Table 2.19).
Furthermore, 76.8 percent of males worked 40 hours or more per week compared with 64.8 percent of
female respondents. Row percentages indicate the gender distribution of respondents in each hourly
category, and column percentages indicate the percentage of respondents in each hourly category within
each gender.
Table 2.18 Average Number of Hours Worked Per Week* Average Number of Weekly Hours Number Percent 1-9 131 2.8
10-19 263 5.6
20-29 405 8.6
30-39 730 15.5
40 or more 3,177 67.5 Total 4,706 100.0 Missing 244
*These numbers represent survey respondents only. Table 2.19 Average Number of Hours Worked per Week by Gender* Average Weekly Hours
Female Male Total
Number Row Pct Col Pct Number
Row Pct Col Pct Number
Row Pct Col Pct
1 - 9 109 84.5 3.1 20 15.5 1.9 129 100.0 2.8
10 - 19 216 83.7 6.1 42 16.3 3.9 258 100.0 5.6
20 - 29 351 88.6 9.8 45 11.4 4.2 396 100.0 8.5
30 - 39 581 80.6 16.3 140 19.4 13.1 721 100.0 15.6
40 or more 2,313 73.9 64.8 819 26.1 76.8 3,132 100.0 67.6 Total 3,570 77.0 100.0 1,066 23.0 100.0 4,636 100.0 100.0 Missing 314 *These numbers represent survey respondents only.
14
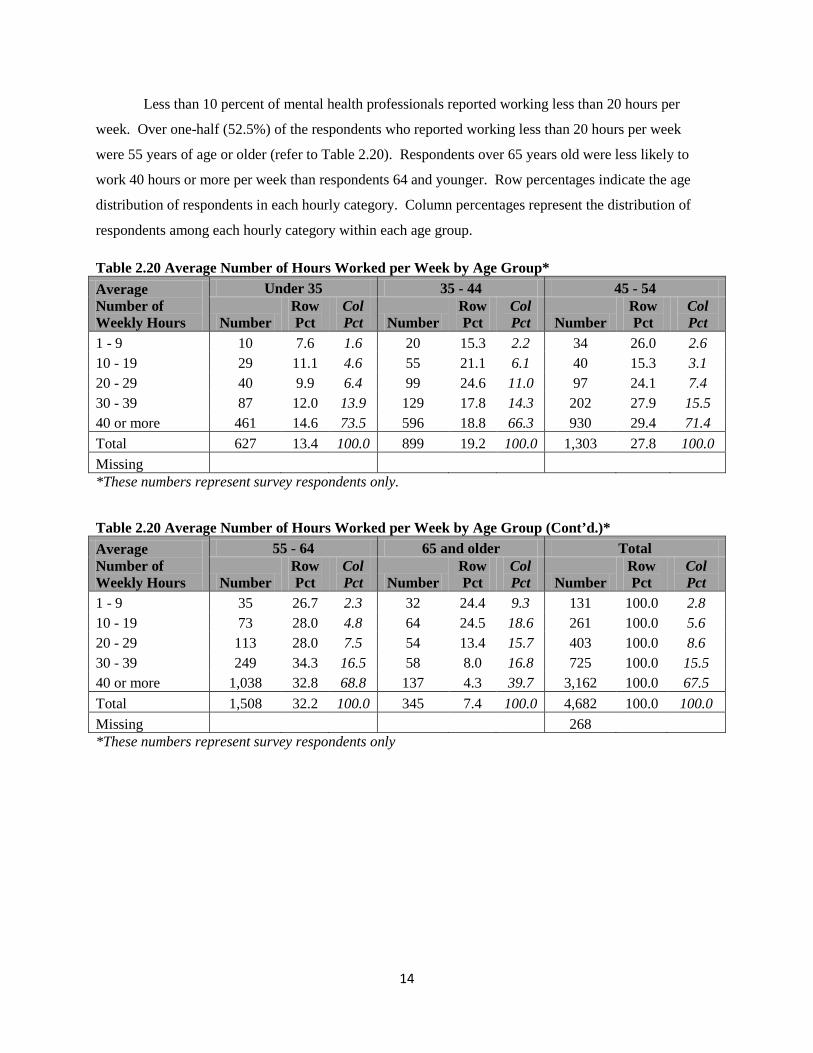
Less than 10 percent of mental health professionals reported working less than 20 hours per
week. Over one-half (52.5%) of the respondents who reported working less than 20 hours per week
were 55 years of age or older (refer to Table 2.20). Respondents over 65 years old were less likely to
work 40 hours or more per week than respondents 64 and younger. Row percentages indicate the age
distribution of respondents in each hourly category. Column percentages represent the distribution of
respondents among each hourly category within each age group. Table 2.20 Average Number of Hours Worked per Week by Age Group* Average Number of Weekly Hours
Under 35 35 - 44 45 - 54
Number Row Pct
Col Pct Number
Row Pct
Col Pct Number
Row Pct
Col Pct
1 - 9 10 7.6 1.6 20 15.3 2.2 34 26.0 2.6 10 - 19 29 11.1 4.6 55 21.1 6.1 40 15.3 3.1 20 - 29 40 9.9 6.4 99 24.6 11.0 97 24.1 7.4 30 - 39 87 12.0 13.9 129 17.8 14.3 202 27.9 15.5 40 or more 461 14.6 73.5 596 18.8 66.3 930 29.4 71.4 Total 627 13.4 100.0 899 19.2 100.0 1,303 27.8 100.0 Missing *These numbers represent survey respondents only. Table 2.20 Average Number of Hours Worked per Week by Age Group (Cont’d.)* Average Number of Weekly Hours
55 - 64 65 and older Total
Number Row Pct
Col Pct Number
Row Pct
Col Pct Number
Row Pct
Col Pct
1 - 9 35 26.7 2.3 32 24.4 9.3 131 100.0 2.8 10 - 19 73 28.0 4.8 64 24.5 18.6 261 100.0 5.6 20 - 29 113 28.0 7.5 54 13.4 15.7 403 100.0 8.6 30 - 39 249 34.3 16.5 58 8.0 16.8 725 100.0 15.5 40 or more 1,038 32.8 68.8 137 4.3 39.7 3,162 100.0 67.5 Total 1,508 32.2 100.0 345 7.4 100.0 4,682 100.0 100.0 Missing 268 *These numbers represent survey respondents only
15
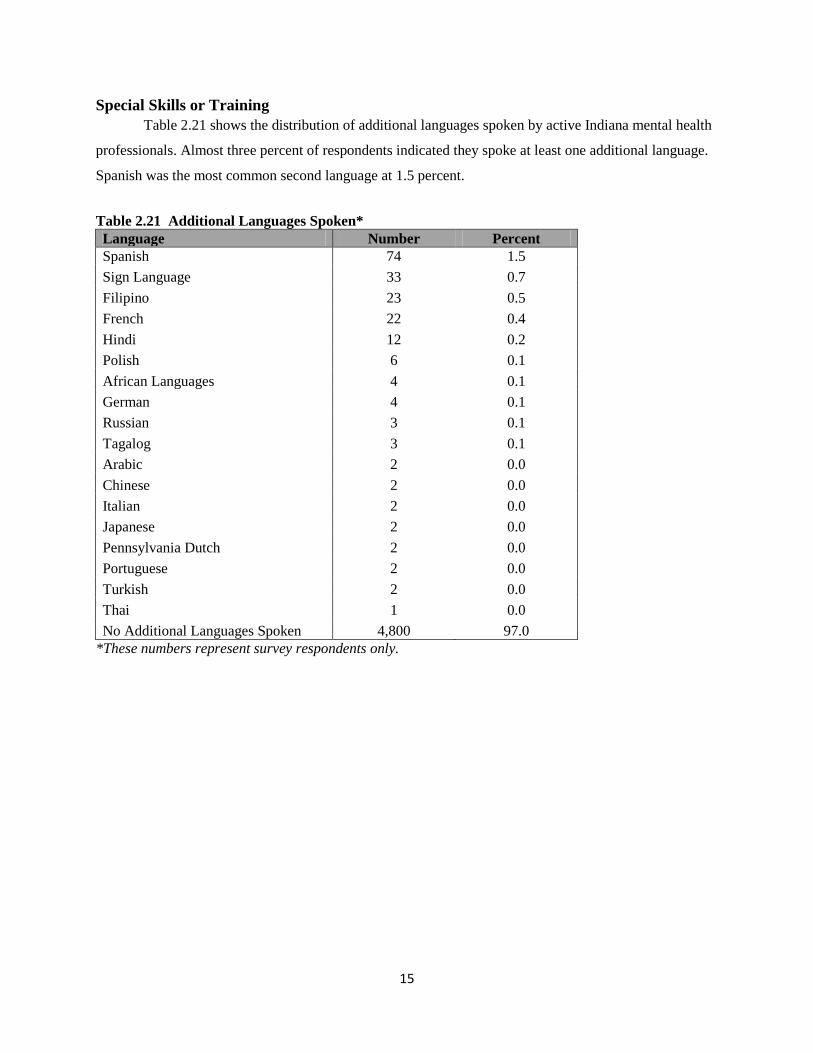
Special Skills or Training Table 2.21 shows the distribution of additional languages spoken by active Indiana mental health
professionals. Almost three percent of respondents indicated they spoke at least one additional language.
Spanish was the most common second language at 1.5 percent.
Table 2.21 Additional Languages Spoken* Language Number Percent Spanish 74 1.5 Sign Language 33 0.7 Filipino 23 0.5 French 22 0.4 Hindi 12 0.2 Polish 6 0.1 African Languages 4 0.1 German 4 0.1 Russian 3 0.1 Tagalog 3 0.1 Arabic 2 0.0 Chinese 2 0.0 Italian 2 0.0 Japanese 2 0.0 Pennsylvania Dutch 2 0.0 Portuguese 2 0.0 Turkish 2 0.0 Thai 1 0.0 No Additional Languages Spoken 4,800 97.0
*These numbers represent survey respondents only.
16
Chapter 3: Responses to the 2010 Clinical Psychologist Re-Licensure Survey
The results in this chapter reflect the personal and professional characteristics of those
psychologists licensed in Indiana who responded to the 2010 Indiana Clinical Psychologist Re-Licensure
Survey. Caution should be taken when making generalizations about all Indiana psychologists since
those who renewed their license by paper, as well as those who did not respond to the electronic survey,
were not included in these results. Consequently, the results shown for the survey respondents may not
be representative of all licensed psychologists in Indiana. Each table shows the number of valid and
missing responses to each survey item and the percentage of valid responses. The text describes the
responses to the survey.
Methods The data used for this report were extracted from the 2010 Indiana Clinical Psychologist Re-
Licensure Survey data files provided by the Indiana State Department of Health and included responses to
questions designed to collect information regarding demographic composition, practice characteristics,
and special skills or training. A copy of the 2010 Indiana Clinical Psychologist Re-Licensure Survey is
included in Appendix 1-B. The data provided by the IPLA included date of birth for all licensed clinical
psychologists who were practicing in Indiana at the time of the survey. The datasets were merged in
order to match the respondent’s approximate age to his or her survey responses. The datasets were
merged by matching the license number of each clinical psychologist using SAS 9.3 and age was
calculated using July 31, 2010 as a reference point since surveys were completed from June 30, 2010
through August 31, 2010. The merged dataset was then used to filter the records to include only the
respondents that met the inclusion criteria. The dataset included only those psychologists who renewed
their license electronically.
17
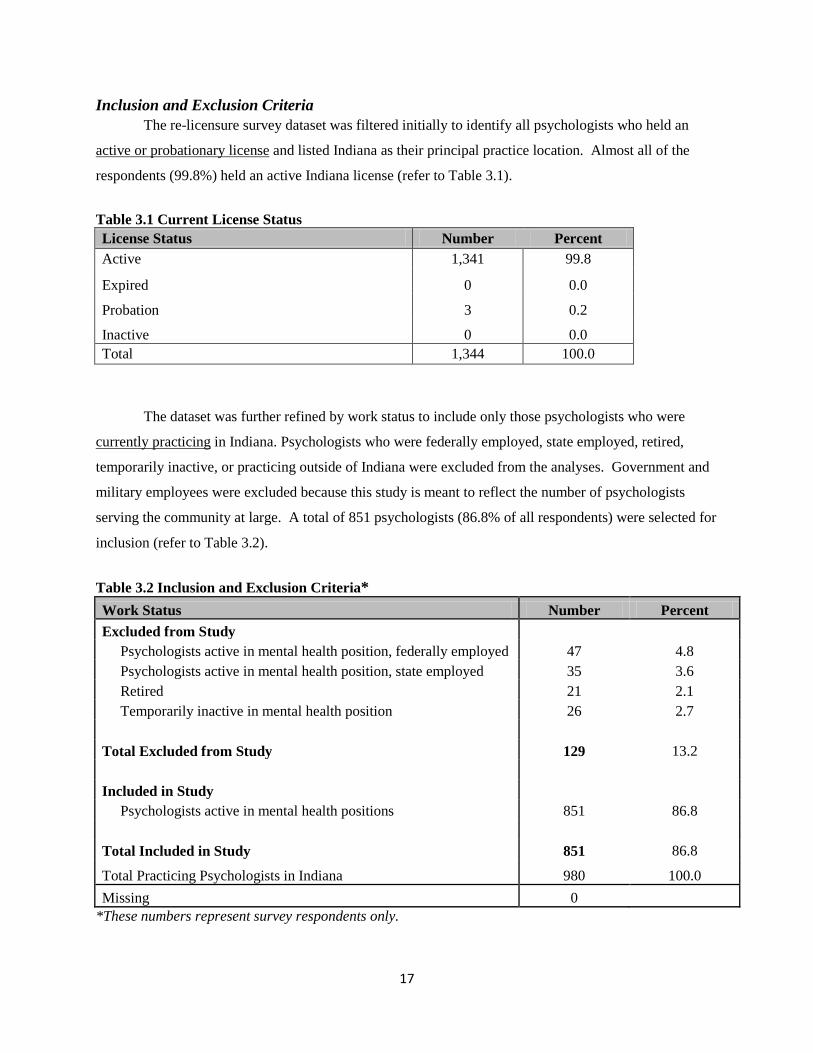
Inclusion and Exclusion Criteria The re-licensure survey dataset was filtered initially to identify all psychologists who held an
active or probationary license and listed Indiana as their principal practice location. Almost all of the
respondents (99.8%) held an active Indiana license (refer to Table 3.1).
Table 3.1 Current License Status License Status Number Percent Active 1,341 99.8
Expired 0 0.0
Probation 3 0.2
Inactive 0 0.0 Total 1,344 100.0
The dataset was further refined by work status to include only those psychologists who were
currently practicing in Indiana. Psychologists who were federally employed, state employed, retired,
temporarily inactive, or practicing outside of Indiana were excluded from the analyses. Government and
military employees were excluded because this study is meant to reflect the number of psychologists
serving the community at large. A total of 851 psychologists (86.8% of all respondents) were selected for
inclusion (refer to Table 3.2).
Table 3.2 Inclusion and Exclusion Criteria* Work Status Number Percent Excluded from Study Psychologists active in mental health position, federally employed 47 4.8 Psychologists active in mental health position, state employed 35 3.6 Retired 21 2.1 Temporarily inactive in mental health position 26 2.7 Total Excluded from Study 129 13.2 Included in Study Psychologists active in mental health positions 851 86.8 Total Included in Study 851 86.8
Total Practicing Psychologists in Indiana 980 100.0 Missing 0
*These numbers represent survey respondents only.
18
Weighting for County Level Data A key component of identifying potential health profession shortage areas is determining the
number of existing professionals in each county. The estimated number of clinical psychologists in each
county was calculated by summing the number of respondents in each county of principal practice
location, then assigning a weight of 88.6 percent to the sum. The weight was determined by calculating
the proportion of clinical psychologists who renewed their license electronically and responded to at least
one question (n = 1,338) to the total number of clinical psychologist license renewals (n = 1,511) (refer to
Table 3.3). Thus, the counts of the psychologists are estimates of the actual number of psychologists in
each county and not the number of respondents in each county. The estimated number of psychologists
per county also does not necessarily reflect the total number of practicing psychologists, but the number
of psychologists available to serve the community at large (excluding government and military
employees).
Table 3.3 Weighting Calculation for Clinical Psychologists Weighting Calculation Number Percent
Renewed electronically and responded to at least one question 1,338 88.6
Total number of psychologist license renewals 1,511 100.0
Survey Response Rate Although only psychologists who met the inclusion criteria were included in the analysis portion
of this report, the denominator used for determining the survey response rate was based on the total
number of psychologists who renewed their licenses electronically (refer to Table 3.4). The numerator
included all psychologists who renewed electronically and responded to at least one question. The
response rate for the survey was 99.6 percent.
Table 3.4 Response Rate to Survey* Psychologists Number Percent Renewed electronically and responded to at least one question 1,338 99.6
Did not respond to any questions on the survey 6 0.4 Total electronic renewals 1,344 100.0
*These numbers represent survey respondents only.
19
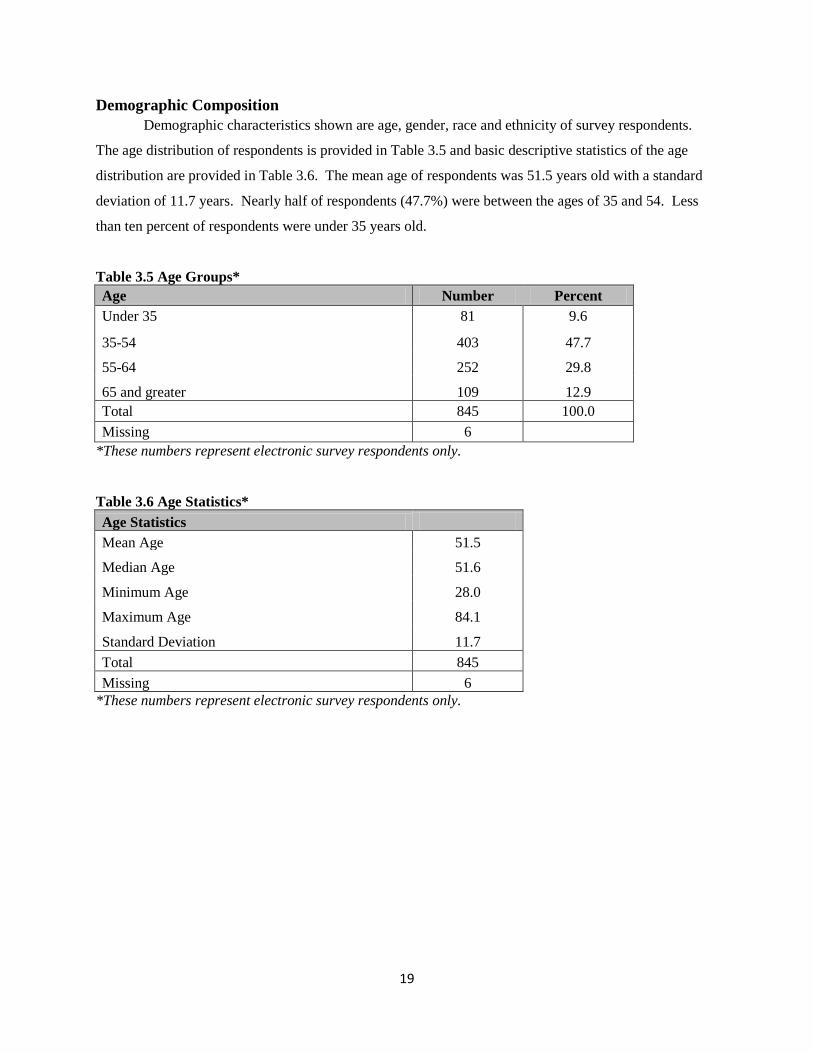
Demographic Composition Demographic characteristics shown are age, gender, race and ethnicity of survey respondents.
The age distribution of respondents is provided in Table 3.5 and basic descriptive statistics of the age
distribution are provided in Table 3.6. The mean age of respondents was 51.5 years old with a standard
deviation of 11.7 years. Nearly half of respondents (47.7%) were between the ages of 35 and 54. Less
than ten percent of respondents were under 35 years old.
Table 3.5 Age Groups* Age Number Percent Under 35 81 9.6
35-54 403 47.7
55-64 252 29.8
65 and greater 109 12.9 Total 845 100.0 Missing 6
*These numbers represent electronic survey respondents only. Table 3.6 Age Statistics* Age Statistics
Mean Age 51.5
Median Age 51.6
Minimum Age 28.0
Maximum Age 84.1
Standard Deviation 11.7 Total 845 Missing 6
*These numbers represent electronic survey respondents only.
20
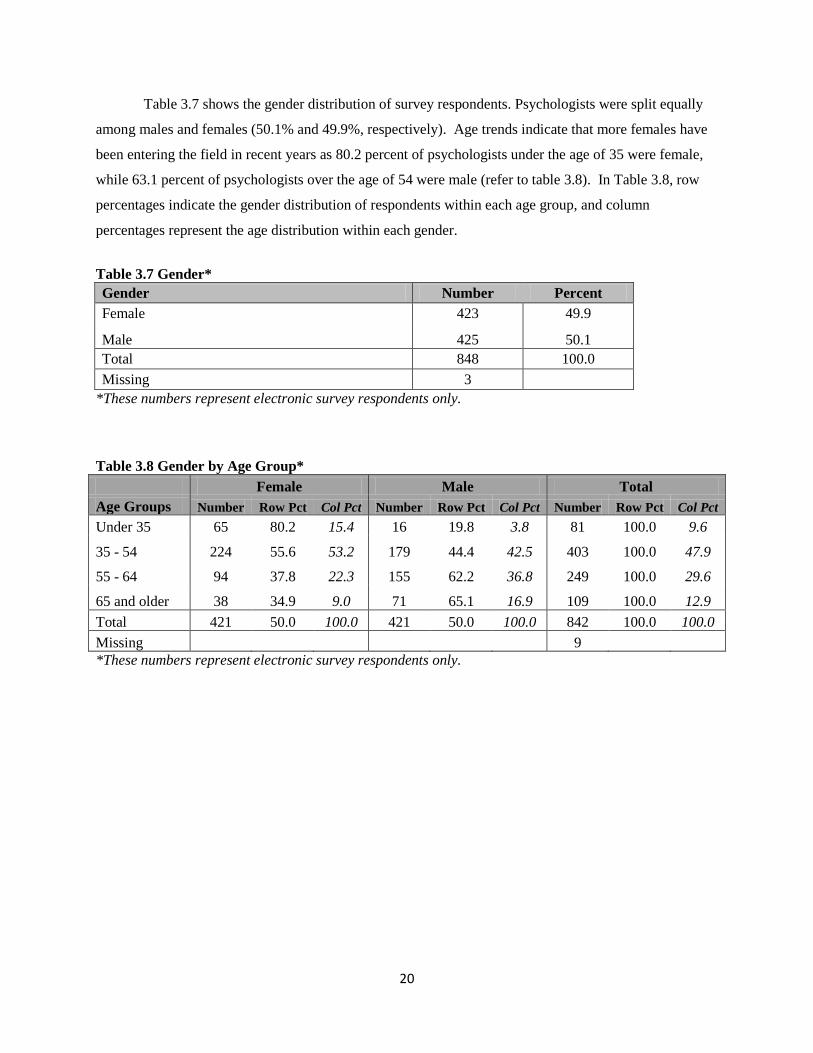
Table 3.7 shows the gender distribution of survey respondents. Psychologists were split equally
among males and females (50.1% and 49.9%, respectively). Age trends indicate that more females have
been entering the field in recent years as 80.2 percent of psychologists under the age of 35 were female,
while 63.1 percent of psychologists over the age of 54 were male (refer to table 3.8). In Table 3.8, row
percentages indicate the gender distribution of respondents within each age group, and column
percentages represent the age distribution within each gender.
Table 3.7 Gender* Gender Number Percent Female 423 49.9
Male 425 50.1 Total 848 100.0 Missing 3
*These numbers represent electronic survey respondents only. Table 3.8 Gender by Age Group* Female Male Total Age Groups Number Row Pct Col Pct Number Row Pct Col Pct Number Row Pct Col Pct Under 35 65 80.2 15.4 16 19.8 3.8 81 100.0 9.6
35 - 54 224 55.6 53.2 179 44.4 42.5 403 100.0 47.9
55 - 64 94 37.8 22.3 155 62.2 36.8 249 100.0 29.6
65 and older 38 34.9 9.0 71 65.1 16.9 109 100.0 12.9 Total 421 50.0 100.0 421 50.0 100.0 842 100.0 100.0 Missing 9 *These numbers represent electronic survey respondents only.
21
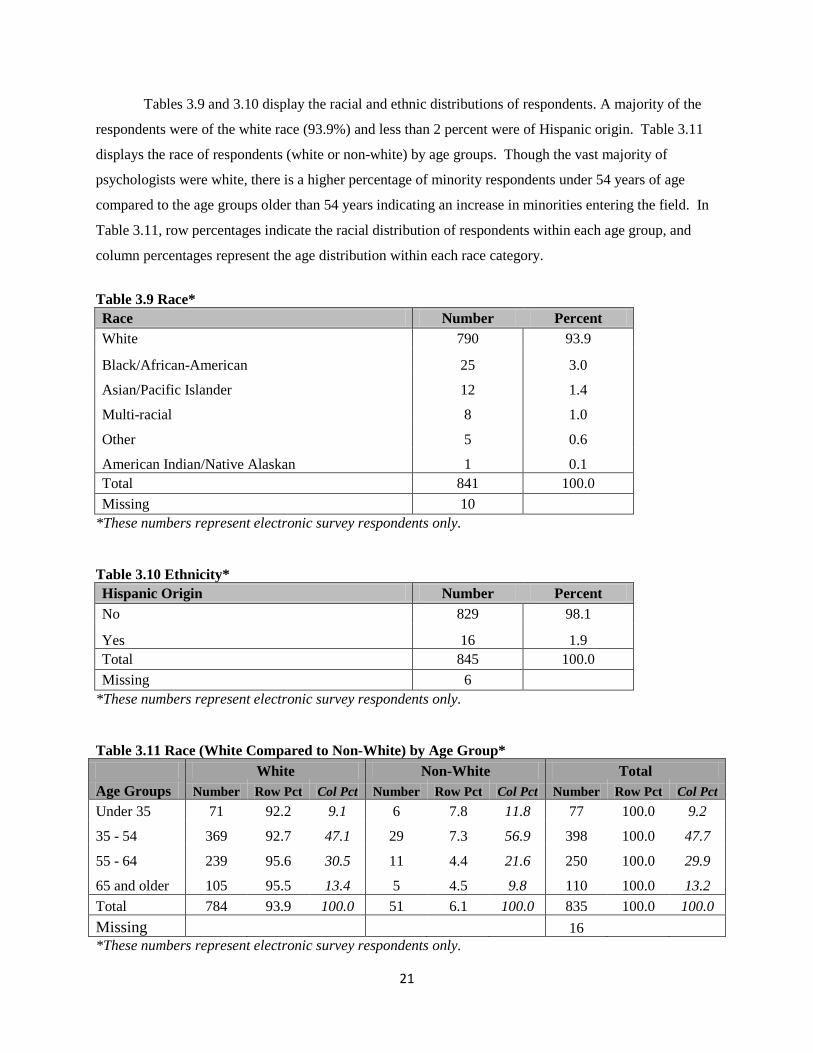
Tables 3.9 and 3.10 display the racial and ethnic distributions of respondents. A majority of the
respondents were of the white race (93.9%) and less than 2 percent were of Hispanic origin. Table 3.11
displays the race of respondents (white or non-white) by age groups. Though the vast majority of
psychologists were white, there is a higher percentage of minority respondents under 54 years of age
compared to the age groups older than 54 years indicating an increase in minorities entering the field. In
Table 3.11, row percentages indicate the racial distribution of respondents within each age group, and
column percentages represent the age distribution within each race category.
Table 3.9 Race* Race Number Percent White 790 93.9
Black/African-American 25 3.0
Asian/Pacific Islander 12 1.4
Multi-racial 8 1.0
Other 5 0.6
American Indian/Native Alaskan 1 0.1 Total 841 100.0 Missing 10
*These numbers represent electronic survey respondents only.
Table 3.10 Ethnicity* Hispanic Origin Number Percent No 829 98.1
Yes 16 1.9 Total 845 100.0 Missing 6
*These numbers represent electronic survey respondents only.
Table 3.11 Race (White Compared to Non-White) by Age Group* White Non-White Total Age Groups Number Row Pct Col Pct Number Row Pct Col Pct Number Row Pct Col Pct Under 35 71 92.2 9.1 6 7.8 11.8 77 100.0 9.2
35 - 54 369 92.7 47.1 29 7.3 56.9 398 100.0 47.7
55 - 64 239 95.6 30.5 11 4.4 21.6 250 100.0 29.9
65 and older 105 95.5 13.4 5 4.5 9.8 110 100.0 13.2 Total 784 93.9 100.0 51 6.1 100.0 835 100.0 100.0 Missing 16 *These numbers represent electronic survey respondents only.
22
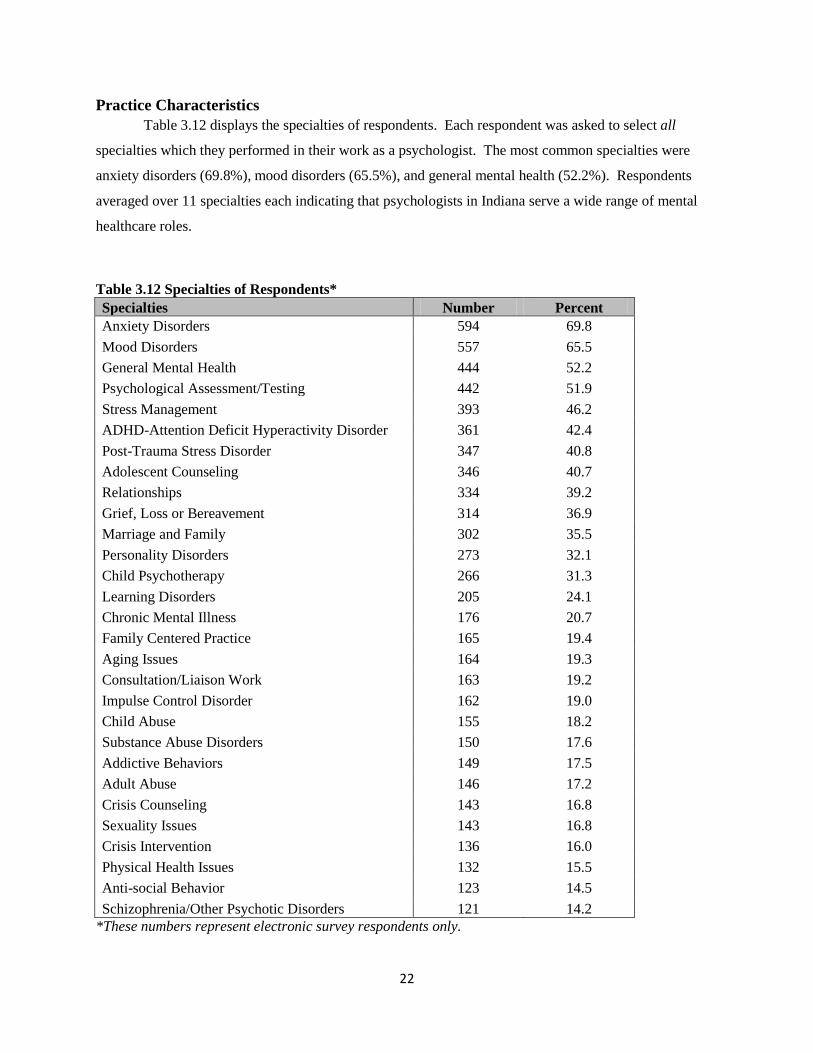
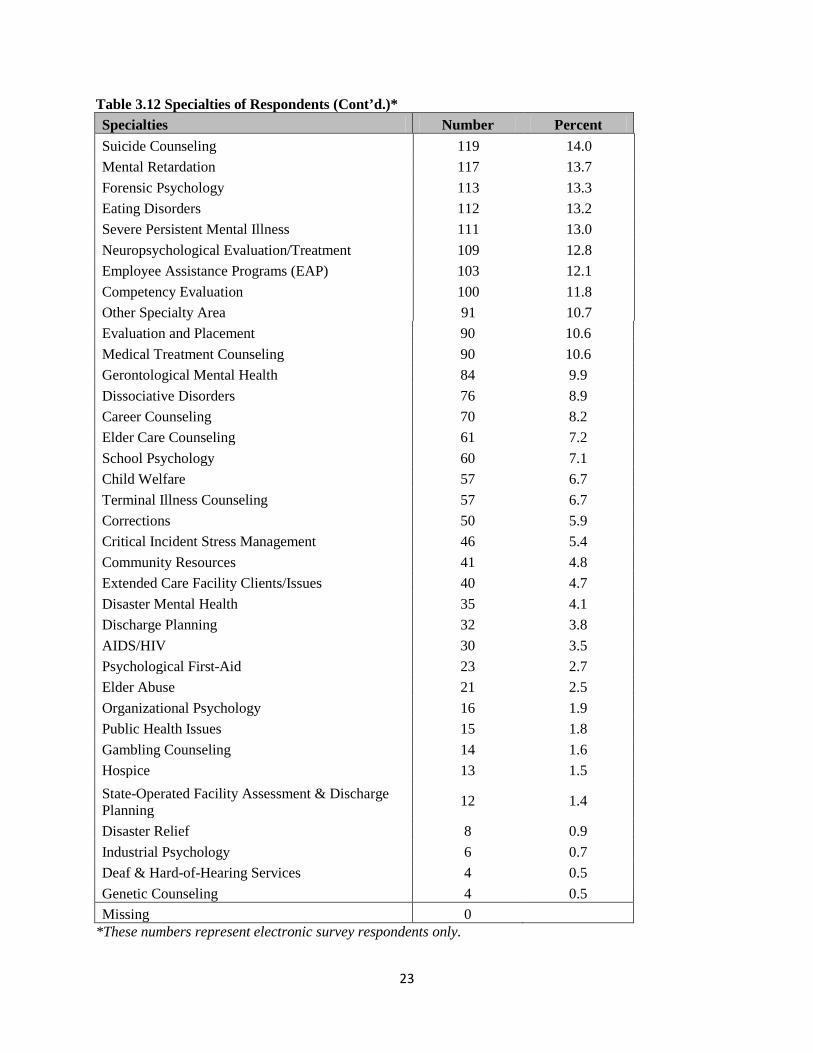
Practice Characteristics Table 3.12 displays the specialties of respondents. Each respondent was asked to select all
specialties which they performed in their work as a psychologist. The most common specialties were
anxiety disorders (69.8%), mood disorders (65.5%), and general mental health (52.2%). Respondents
averaged over 11 specialties each indicating that psychologists in Indiana serve a wide range of mental
healthcare roles.
Table 3.12 Specialties of Respondents* Specialties Number Percent Anxiety Disorders 594 69.8 Mood Disorders 557 65.5 General Mental Health 444 52.2 Psychological Assessment/Testing 442 51.9 Stress Management 393 46.2 ADHD-Attention Deficit Hyperactivity Disorder 361 42.4 Post-Trauma Stress Disorder 347 40.8 Adolescent Counseling 346 40.7 Relationships 334 39.2 Grief, Loss or Bereavement 314 36.9 Marriage and Family 302 35.5 Personality Disorders 273 32.1 Child Psychotherapy 266 31.3 Learning Disorders 205 24.1 Chronic Mental Illness 176 20.7 Family Centered Practice 165 19.4 Aging Issues 164 19.3 Consultation/Liaison Work 163 19.2 Impulse Control Disorder 162 19.0 Child Abuse 155 18.2 Substance Abuse Disorders 150 17.6 Addictive Behaviors 149 17.5 Adult Abuse 146 17.2 Crisis Counseling 143 16.8 Sexuality Issues 143 16.8 Crisis Intervention 136 16.0 Physical Health Issues 132 15.5 Anti-social Behavior 123 14.5 Schizophrenia/Other Psychotic Disorders 121 14.2
*These numbers represent electronic survey respondents only.
23
Table 3.12 Specialties of Respondents (Cont’d.)* Specialties Number Percent Suicide Counseling 119 14.0 Mental Retardation 117 13.7 Forensic Psychology 113 13.3 Eating Disorders 112 13.2 Severe Persistent Mental Illness 111 13.0 Neuropsychological Evaluation/Treatment 109 12.8 Employee Assistance Programs (EAP) 103 12.1 Competency Evaluation 100 11.8 Other Specialty Area 91 10.7 Evaluation and Placement 90 10.6 Medical Treatment Counseling 90 10.6 Gerontological Mental Health 84 9.9 Dissociative Disorders 76 8.9 Career Counseling 70 8.2 Elder Care Counseling 61 7.2 School Psychology 60 7.1 Child Welfare 57 6.7 Terminal Illness Counseling 57 6.7 Corrections 50 5.9 Critical Incident Stress Management 46 5.4 Community Resources 41 4.8 Extended Care Facility Clients/Issues 40 4.7 Disaster Mental Health 35 4.1 Discharge Planning 32 3.8 AIDS/HIV 30 3.5 Psychological First-Aid 23 2.7 Elder Abuse 21 2.5 Organizational Psychology 16 1.9 Public Health Issues 15 1.8 Gambling Counseling 14 1.6 Hospice 13 1.5 State-Operated Facility Assessment & Discharge Planning 12 1.4
Disaster Relief 8 0.9 Industrial Psychology 6 0.7 Deaf & Hard-of-Hearing Services 4 0.5 Genetic Counseling 4 0.5 Missing 0
*These numbers represent electronic survey respondents only.
24
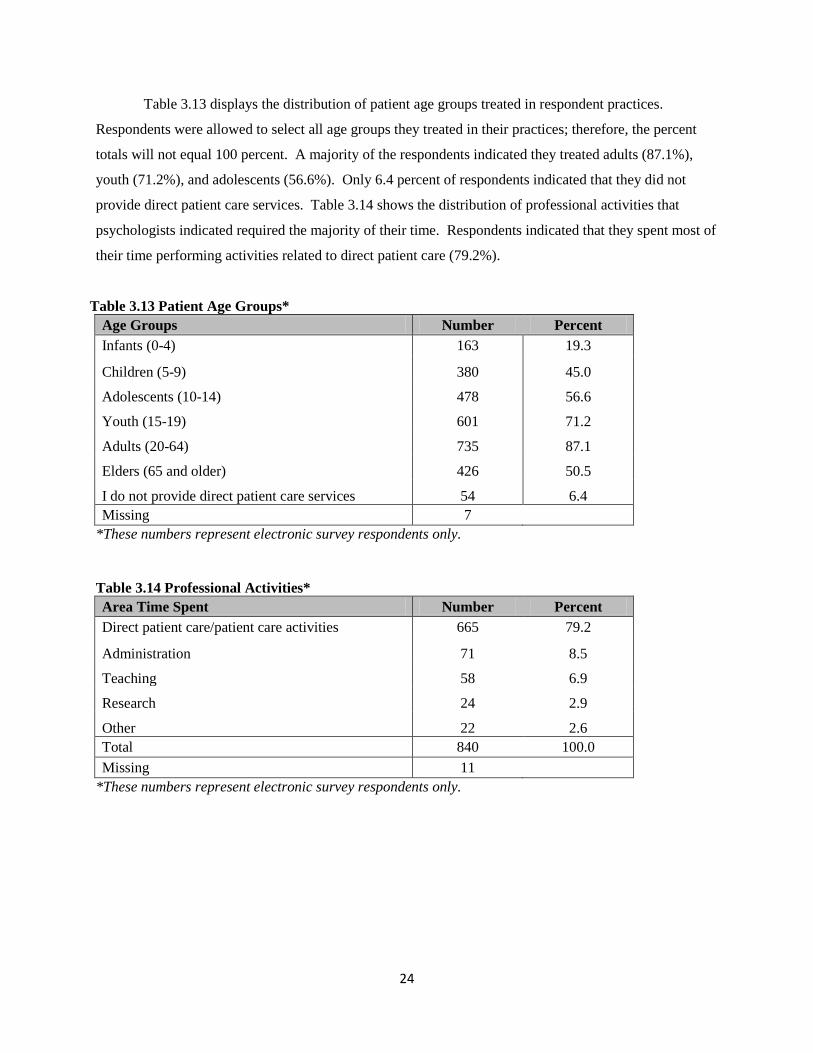
Table 3.13 displays the distribution of patient age groups treated in respondent practices.
Respondents were allowed to select all age groups they treated in their practices; therefore, the percent
totals will not equal 100 percent. A majority of the respondents indicated they treated adults (87.1%),
youth (71.2%), and adolescents (56.6%). Only 6.4 percent of respondents indicated that they did not
provide direct patient care services. Table 3.14 shows the distribution of professional activities that
psychologists indicated required the majority of their time. Respondents indicated that they spent most of
their time performing activities related to direct patient care (79.2%).
Table 3.13 Patient Age Groups* Age Groups Number Percent Infants (0-4) 163 19.3
Children (5-9) 380 45.0
Adolescents (10-14) 478 56.6
Youth (15-19) 601 71.2
Adults (20-64) 735 87.1
Elders (65 and older) 426 50.5
I do not provide direct patient care services 54 6.4 Missing 7
*These numbers represent electronic survey respondents only.
Table 3.14 Professional Activities* Area Time Spent Number Percent Direct patient care/patient care activities 665 79.2
Administration 71 8.5
Teaching 58 6.9
Research 24 2.9
Other 22 2.6 Total 840 100.0 Missing 11
*These numbers represent electronic survey respondents only.
25
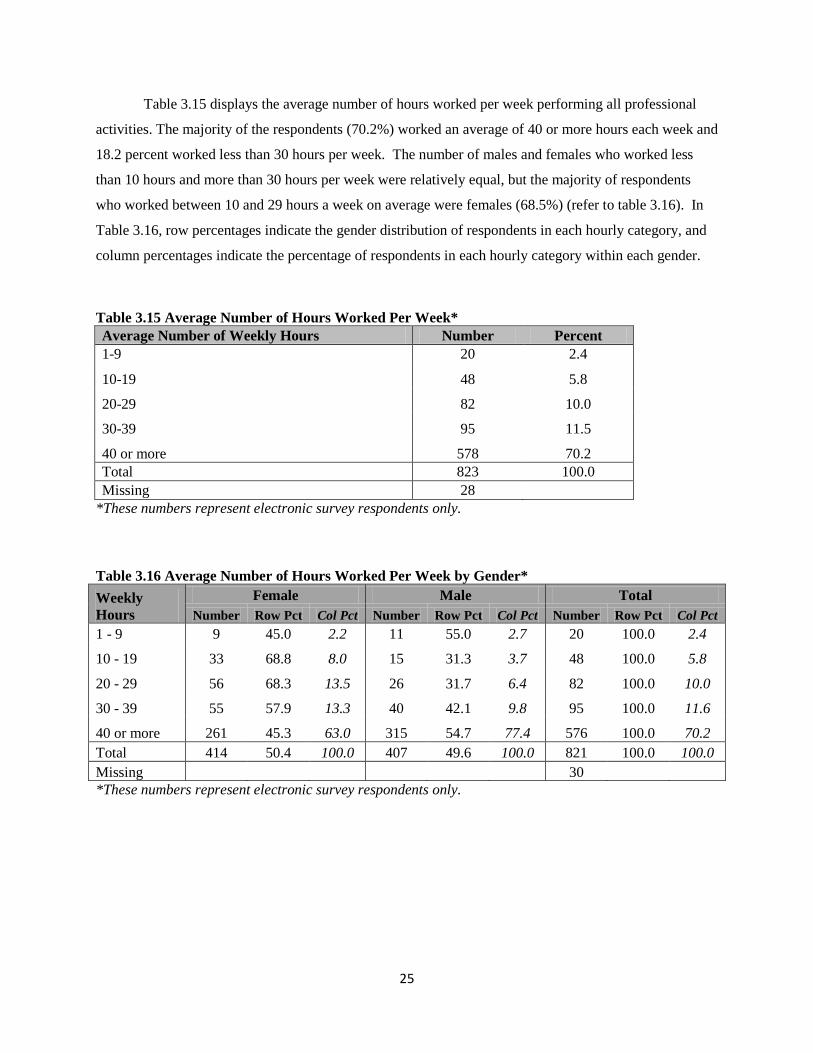
Table 3.15 displays the average number of hours worked per week performing all professional
activities. The majority of the respondents (70.2%) worked an average of 40 or more hours each week and
18.2 percent worked less than 30 hours per week. The number of males and females who worked less
than 10 hours and more than 30 hours per week were relatively equal, but the majority of respondents
who worked between 10 and 29 hours a week on average were females (68.5%) (refer to table 3.16). In
Table 3.16, row percentages indicate the gender distribution of respondents in each hourly category, and
column percentages indicate the percentage of respondents in each hourly category within each gender.
Table 3.15 Average Number of Hours Worked Per Week* Average Number of Weekly Hours Number Percent 1-9 20 2.4
10-19 48 5.8
20-29 82 10.0
30-39 95 11.5
40 or more 578 70.2 Total 823 100.0 Missing 28
*These numbers represent electronic survey respondents only. Table 3.16 Average Number of Hours Worked Per Week by Gender* Weekly Hours
Female Male Total Number Row Pct Col Pct Number Row Pct Col Pct Number Row Pct Col Pct
1 - 9 9 45.0 2.2 11 55.0 2.7 20 100.0 2.4
10 - 19 33 68.8 8.0 15 31.3 3.7 48 100.0 5.8
20 - 29 56 68.3 13.5 26 31.7 6.4 82 100.0 10.0
30 - 39 55 57.9 13.3 40 42.1 9.8 95 100.0 11.6
40 or more 261 45.3 63.0 315 54.7 77.4 576 100.0 70.2 Total 414 50.4 100.0 407 49.6 100.0 821 100.0 100.0 Missing 30 *These numbers represent electronic survey respondents only.
26
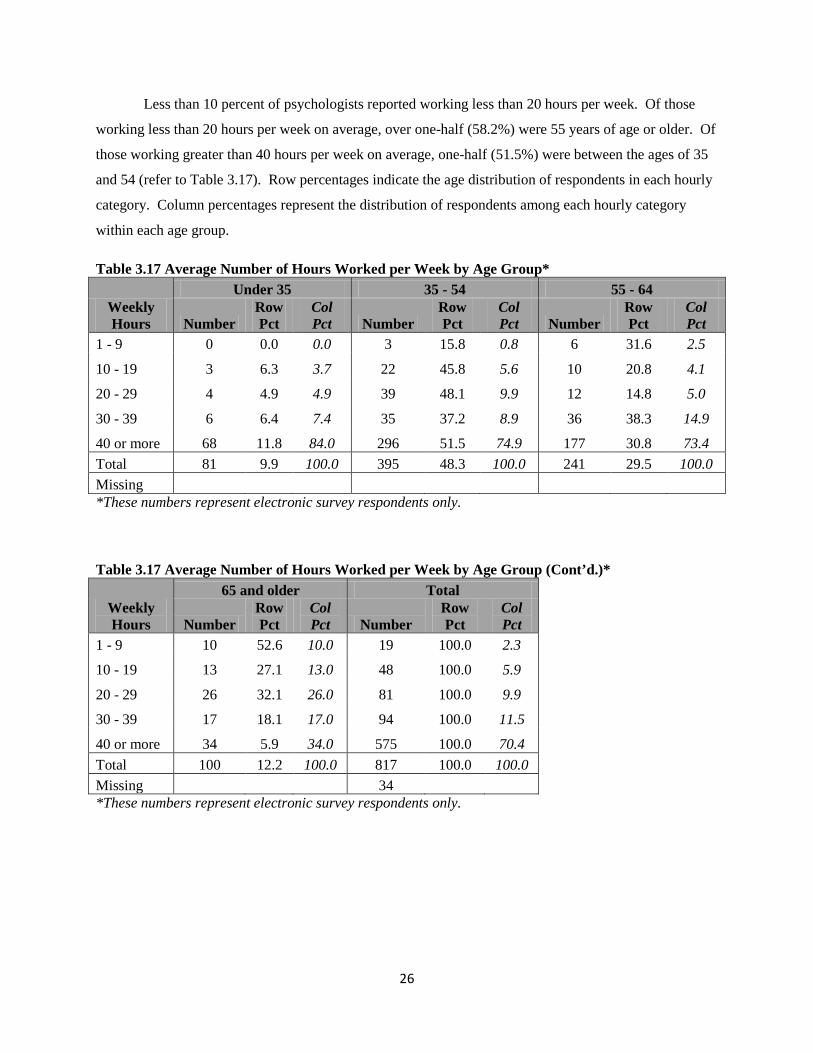
Less than 10 percent of psychologists reported working less than 20 hours per week. Of those
working less than 20 hours per week on average, over one-half (58.2%) were 55 years of age or older. Of
those working greater than 40 hours per week on average, one-half (51.5%) were between the ages of 35
and 54 (refer to Table 3.17). Row percentages indicate the age distribution of respondents in each hourly
category. Column percentages represent the distribution of respondents among each hourly category
within each age group.
Table 3.17 Average Number of Hours Worked per Week by Age Group*
Weekly Hours
Under 35 35 - 54 55 - 64
Number Row Pct
Col Pct Number
Row Pct
Col Pct Number
Row Pct
Col Pct
1 - 9 0 0.0 0.0 3 15.8 0.8 6 31.6 2.5
10 - 19 3 6.3 3.7 22 45.8 5.6 10 20.8 4.1
20 - 29 4 4.9 4.9 39 48.1 9.9 12 14.8 5.0
30 - 39 6 6.4 7.4 35 37.2 8.9 36 38.3 14.9
40 or more 68 11.8 84.0 296 51.5 74.9 177 30.8 73.4 Total 81 9.9 100.0 395 48.3 100.0 241 29.5 100.0 Missing *These numbers represent electronic survey respondents only. Table 3.17 Average Number of Hours Worked per Week by Age Group (Cont’d.)*
Weekly Hours
65 and older Total
Number Row Pct
Col Pct Number
Row Pct
Col Pct
1 - 9 10 52.6 10.0 19 100.0 2.3
10 - 19 13 27.1 13.0 48 100.0 5.9
20 - 29 26 32.1 26.0 81 100.0 9.9
30 - 39 17 18.1 17.0 94 100.0 11.5
40 or more 34 5.9 34.0 575 100.0 70.4 Total 100 12.2 100.0 817 100.0 100.0 Missing 34 *These numbers represent electronic survey respondents only.
27
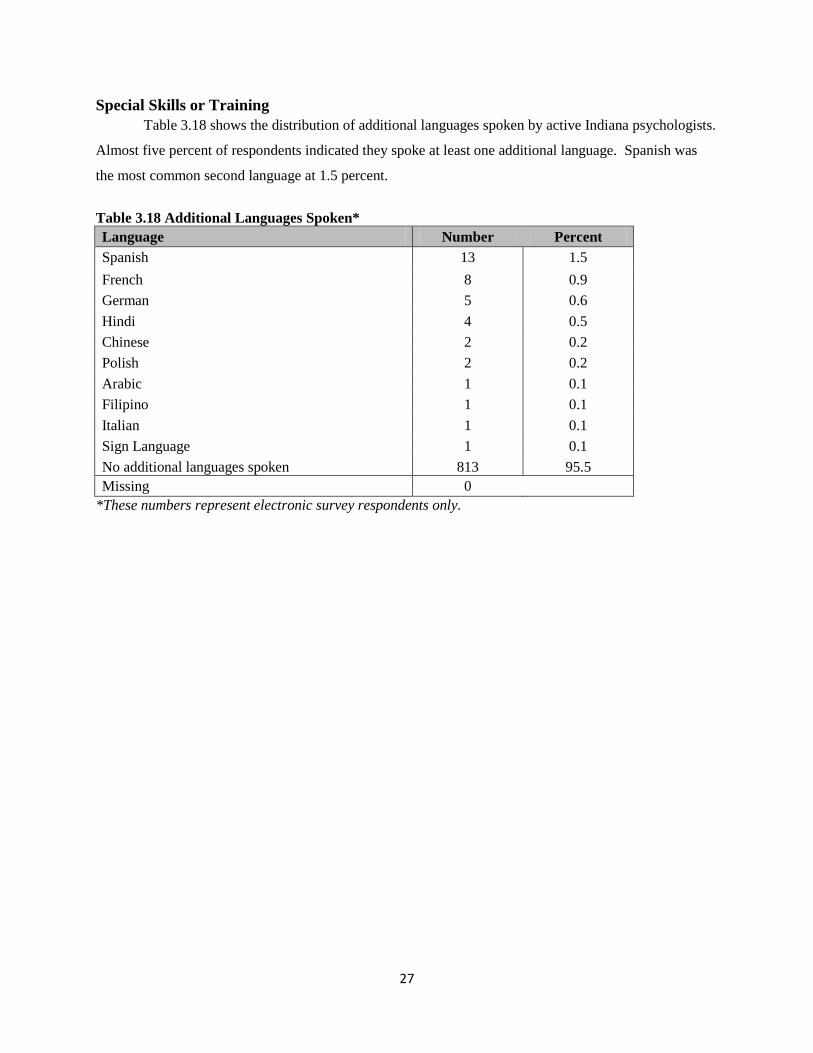
Special Skills or Training Table 3.18 shows the distribution of additional languages spoken by active Indiana psychologists.
Almost five percent of respondents indicated they spoke at least one additional language. Spanish was
the most common second language at 1.5 percent.
Table 3.18 Additional Languages Spoken* Language Number Percent Spanish 13 1.5 French 8 0.9 German 5 0.6 Hindi 4 0.5 Chinese 2 0.2 Polish 2 0.2 Arabic 1 0.1 Filipino 1 0.1 Italian 1 0.1 Sign Language 1 0.1 No additional languages spoken 813 95.5 Missing 0
*These numbers represent electronic survey respondents only.
28
Chapter 4: Responses of 2011 Indiana Physician Survey, Psychiatrists Only
This chapter summarizes the responses made by psychiatrists to the 2011 Indiana Physician Re-
Licensure Survey. Psychiatric physicians were identified when a physician selected one of the following
major psychiatric specialties: addiction medicine, psychiatry, addiction psychiatry, child psychiatry,
forensic psychiatry, geriatric psychiatry, pain medicine psychiatry, psychoanalysis psychiatry, or
psychosomatic medicine psychiatry.
Caution should be taken when making generalizations about all Indiana psychiatrists since those
who renewed their license by paper, as well as those who did not respond to the electronic survey, were
not included in these results. Consequently, the results shown for the survey respondents may not be
representative of all licensed psychiatrists in Indiana. Each table shows the number of valid and missing
responses to each survey item and the percentage of valid responses. The text describes the responses to
the survey.
Methods The data used to generate this report were extracted from the 2011 Indiana Physician Re-
Licensure Survey dataset collected by the ISDH and the physician license dataset maintained by the
IPLA. The survey contained questions on respondents’ principle practice location, residency/training
location, average hours worked per week, and demographic information. A copy of the 2011 Indiana
Physician Re-Licensure Survey is included in Appendix 1-C. The data provided by the IPLA included
date of birth for all licensed physicians who were practicing in Indiana at the time of the survey. The
datasets were merged in order to match the respondents’ approximate age to his or her survey responses.
The data sets were merged by matching the license number of each physician using SAS 9.3 and age was
calculated using May 31, 2011 as a reference point since surveys were completed from April 30, 2011
through June 30, 2011. The merged dataset was then used to filter the records to include only the
respondents that met the inclusion criteria. Only physicians whose specialties were among those listed at
the beginning of the chapter were included in the analysis.
29
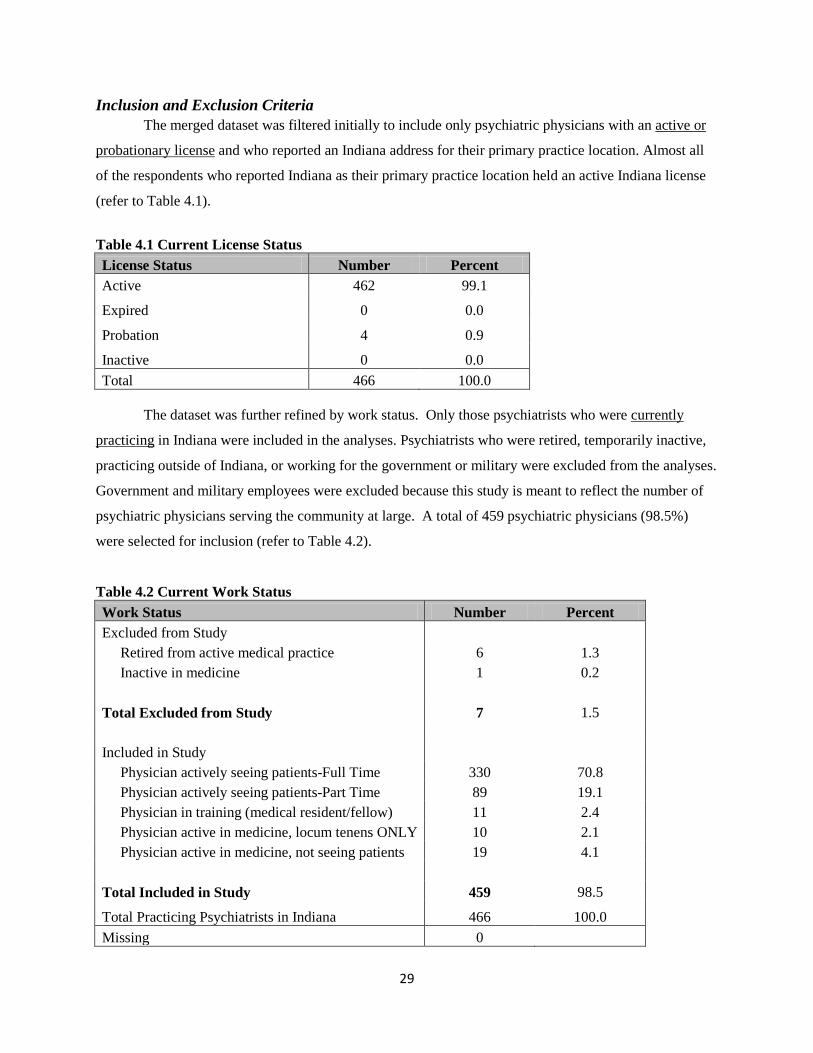
Inclusion and Exclusion Criteria The merged dataset was filtered initially to include only psychiatric physicians with an active or
probationary license and who reported an Indiana address for their primary practice location. Almost all
of the respondents who reported Indiana as their primary practice location held an active Indiana license
(refer to Table 4.1).
Table 4.1 Current License Status License Status Number Percent Active 462 99.1
Expired 0 0.0
Probation 4 0.9
Inactive 0 0.0 Total 466 100.0
The dataset was further refined by work status. Only those psychiatrists who were currently
practicing in Indiana were included in the analyses. Psychiatrists who were retired, temporarily inactive,
practicing outside of Indiana, or working for the government or military were excluded from the analyses.
Government and military employees were excluded because this study is meant to reflect the number of
psychiatric physicians serving the community at large. A total of 459 psychiatric physicians (98.5%)
were selected for inclusion (refer to Table 4.2).
Table 4.2 Current Work Status Work Status Number Percent Excluded from Study Retired from active medical practice 6 1.3 Inactive in medicine 1 0.2 Total Excluded from Study 7 1.5 Included in Study Physician actively seeing patients-Full Time 330 70.8 Physician actively seeing patients-Part Time 89 19.1 Physician in training (medical resident/fellow) 11 2.4 Physician active in medicine, locum tenens ONLY 10 2.1 Physician active in medicine, not seeing patients 19 4.1 Total Included in Study 459 98.5
Total Practicing Psychiatrists in Indiana 466 100.0 Missing 0
30
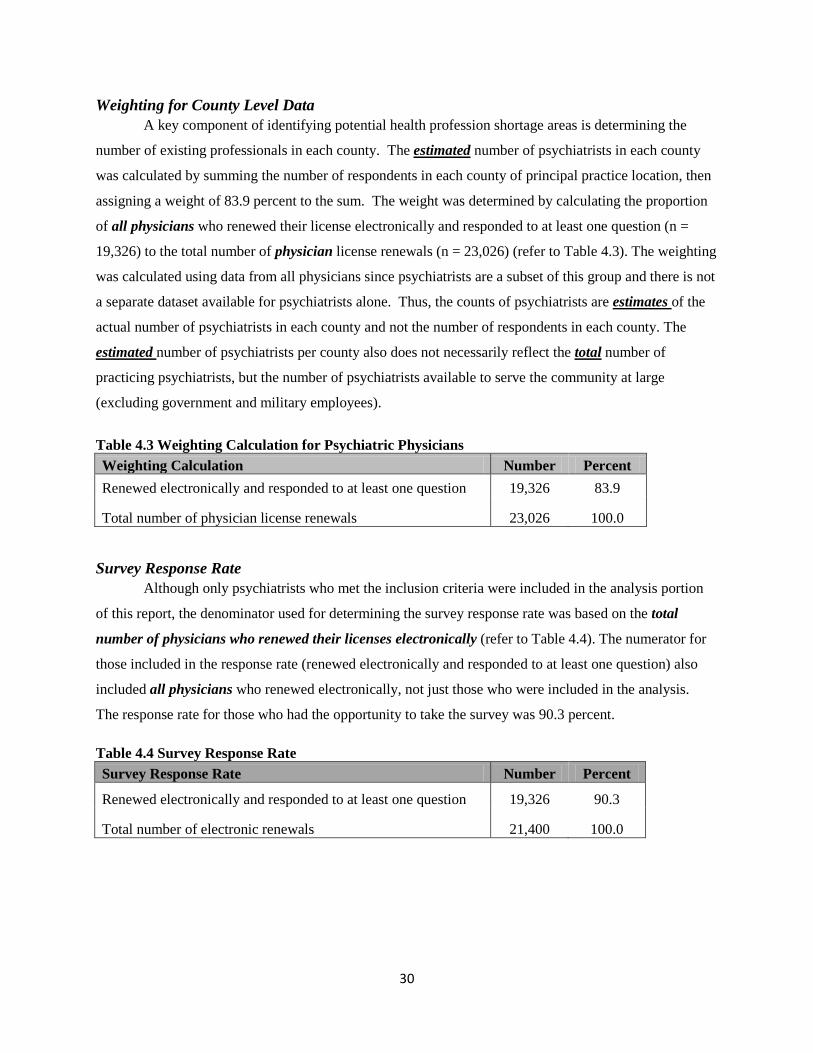
Weighting for County Level Data A key component of identifying potential health profession shortage areas is determining the
number of existing professionals in each county. The estimated number of psychiatrists in each county
was calculated by summing the number of respondents in each county of principal practice location, then
assigning a weight of 83.9 percent to the sum. The weight was determined by calculating the proportion
of all physicians who renewed their license electronically and responded to at least one question (n =
19,326) to the total number of physician license renewals (n = 23,026) (refer to Table 4.3). The weighting
was calculated using data from all physicians since psychiatrists are a subset of this group and there is not
a separate dataset available for psychiatrists alone. Thus, the counts of psychiatrists are estimates of the
actual number of psychiatrists in each county and not the number of respondents in each county. The
estimated number of psychiatrists per county also does not necessarily reflect the total number of
practicing psychiatrists, but the number of psychiatrists available to serve the community at large
(excluding government and military employees).
Table 4.3 Weighting Calculation for Psychiatric Physicians Weighting Calculation Number Percent Renewed electronically and responded to at least one question 19,326 83.9
Total number of physician license renewals 23,026 100.0
Survey Response Rate Although only psychiatrists who met the inclusion criteria were included in the analysis portion
of this report, the denominator used for determining the survey response rate was based on the total
number of physicians who renewed their licenses electronically (refer to Table 4.4). The numerator for
those included in the response rate (renewed electronically and responded to at least one question) also
included all physicians who renewed electronically, not just those who were included in the analysis.
The response rate for those who had the opportunity to take the survey was 90.3 percent.
Table 4.4 Survey Response Rate Survey Response Rate Number Percent
Renewed electronically and responded to at least one question 19,326 90.3
Total number of electronic renewals 21,400 100.0
31
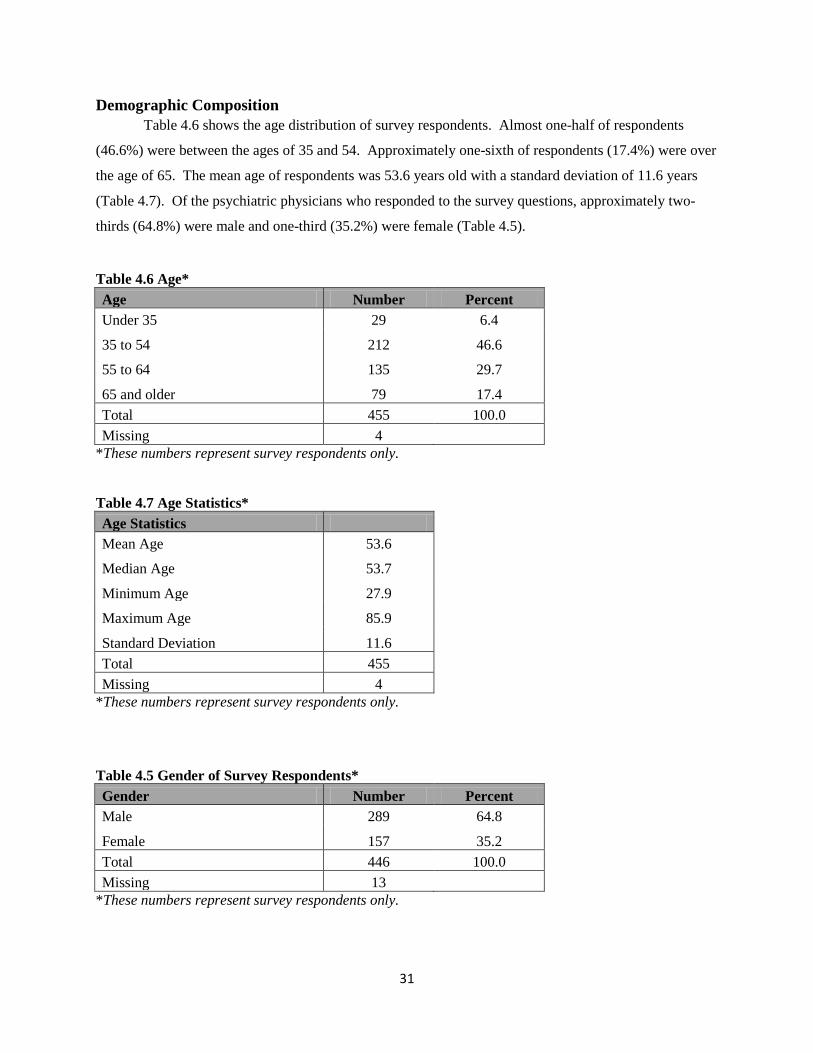
Demographic Composition Table 4.6 shows the age distribution of survey respondents. Almost one-half of respondents
(46.6%) were between the ages of 35 and 54. Approximately one-sixth of respondents (17.4%) were over
the age of 65. The mean age of respondents was 53.6 years old with a standard deviation of 11.6 years
(Table 4.7). Of the psychiatric physicians who responded to the survey questions, approximately two-
thirds (64.8%) were male and one-third (35.2%) were female (Table 4.5).
Table 4.6 Age* Age Number Percent Under 35 29 6.4
35 to 54 212 46.6
55 to 64 135 29.7
65 and older 79 17.4 Total 455 100.0 Missing 4
*These numbers represent survey respondents only.
Table 4.7 Age Statistics* Age Statistics Mean Age 53.6
Median Age 53.7
Minimum Age 27.9
Maximum Age 85.9
Standard Deviation 11.6 Total 455 Missing 4
*These numbers represent survey respondents only.
Table 4.5 Gender of Survey Respondents* Gender Number Percent Male 289 64.8
Female 157 35.2 Total 446 100.0 Missing 13
*These numbers represent survey respondents only.
32
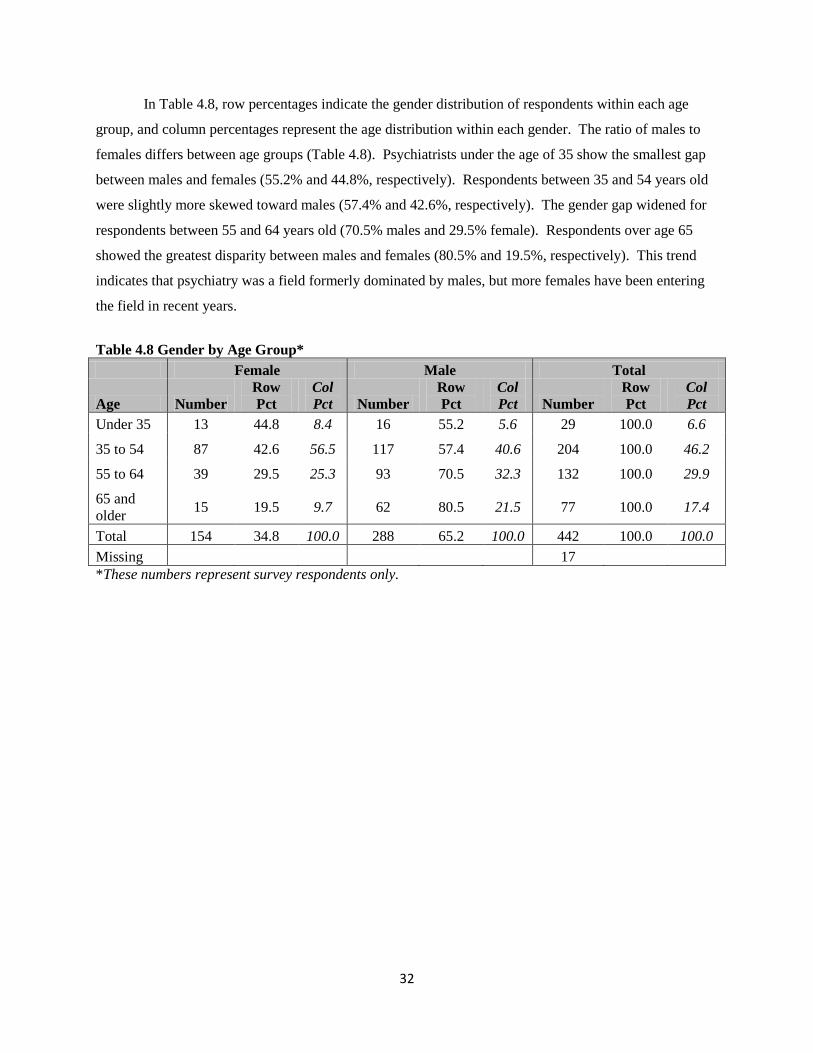
In Table 4.8, row percentages indicate the gender distribution of respondents within each age
group, and column percentages represent the age distribution within each gender. The ratio of males to
females differs between age groups (Table 4.8). Psychiatrists under the age of 35 show the smallest gap
between males and females (55.2% and 44.8%, respectively). Respondents between 35 and 54 years old
were slightly more skewed toward males (57.4% and 42.6%, respectively). The gender gap widened for
respondents between 55 and 64 years old (70.5% males and 29.5% female). Respondents over age 65
showed the greatest disparity between males and females (80.5% and 19.5%, respectively). This trend
indicates that psychiatry was a field formerly dominated by males, but more females have been entering
the field in recent years.
Table 4.8 Gender by Age Group* Female Male Total
Age Number Row Pct
Col Pct Number
Row Pct
Col Pct Number
Row Pct
Col Pct
Under 35 13 44.8 8.4 16 55.2 5.6 29 100.0 6.6
35 to 54 87 42.6 56.5 117 57.4 40.6 204 100.0 46.2
55 to 64 39 29.5 25.3 93 70.5 32.3 132 100.0 29.9
65 and older 15 19.5 9.7 62 80.5 21.5 77 100.0 17.4
Total 154 34.8 100.0 288 65.2 100.0 442 100.0 100.0 Missing 17 *These numbers represent survey respondents only.
33
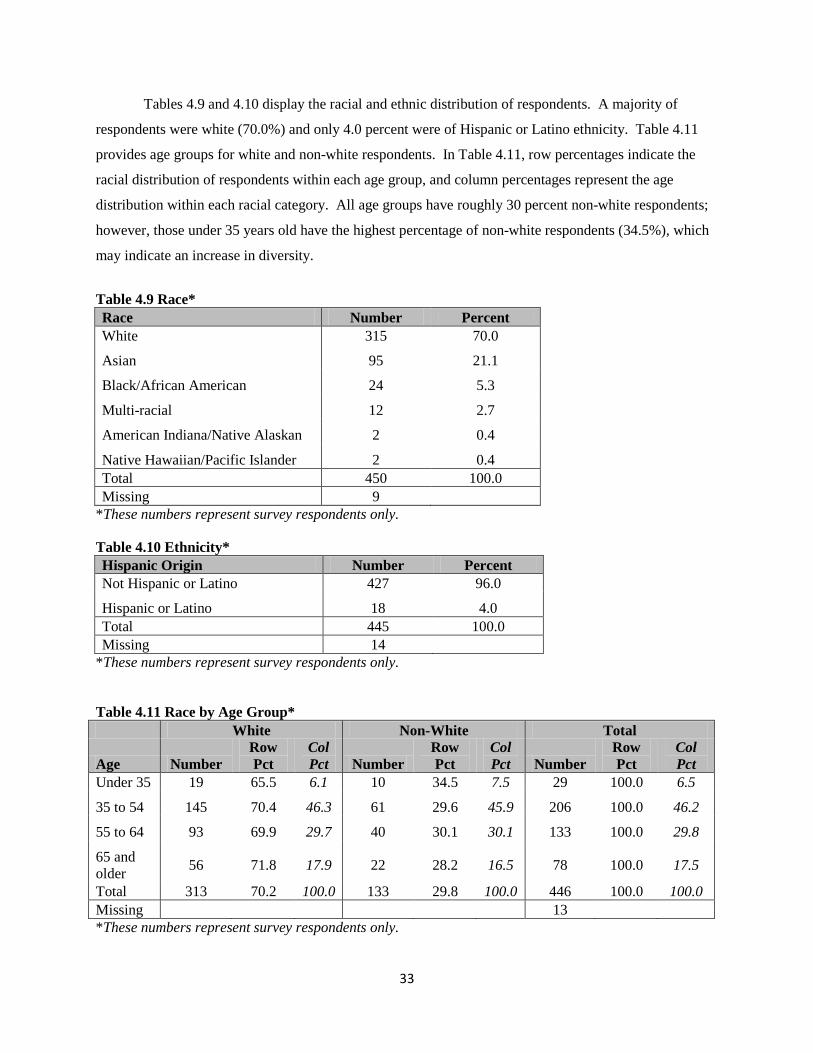
Tables 4.9 and 4.10 display the racial and ethnic distribution of respondents. A majority of
respondents were white (70.0%) and only 4.0 percent were of Hispanic or Latino ethnicity. Table 4.11
provides age groups for white and non-white respondents. In Table 4.11, row percentages indicate the
racial distribution of respondents within each age group, and column percentages represent the age
distribution within each racial category. All age groups have roughly 30 percent non-white respondents;
however, those under 35 years old have the highest percentage of non-white respondents (34.5%), which
may indicate an increase in diversity.
Table 4.9 Race* Race Number Percent White 315 70.0
Asian 95 21.1
Black/African American 24 5.3
Multi-racial 12 2.7
American Indiana/Native Alaskan 2 0.4
Native Hawaiian/Pacific Islander 2 0.4 Total 450 100.0 Missing 9
*These numbers represent survey respondents only.
Table 4.10 Ethnicity* Hispanic Origin Number Percent Not Hispanic or Latino 427 96.0
Hispanic or Latino 18 4.0 Total 445 100.0 Missing 14
*These numbers represent survey respondents only.
Table 4.11 Race by Age Group* White Non-White Total
Age Number Row Pct
Col Pct Number
Row Pct
Col Pct Number
Row Pct
Col Pct
Under 35 19 65.5 6.1 10 34.5 7.5 29 100.0 6.5
35 to 54 145 70.4 46.3 61 29.6 45.9 206 100.0 46.2
55 to 64 93 69.9 29.7 40 30.1 30.1 133 100.0 29.8
65 and older 56 71.8 17.9 22 28.2 16.5 78 100.0 17.5
Total 313 70.2 100.0 133 29.8 100.0 446 100.0 100.0 Missing 13 *These numbers represent survey respondents only.
34
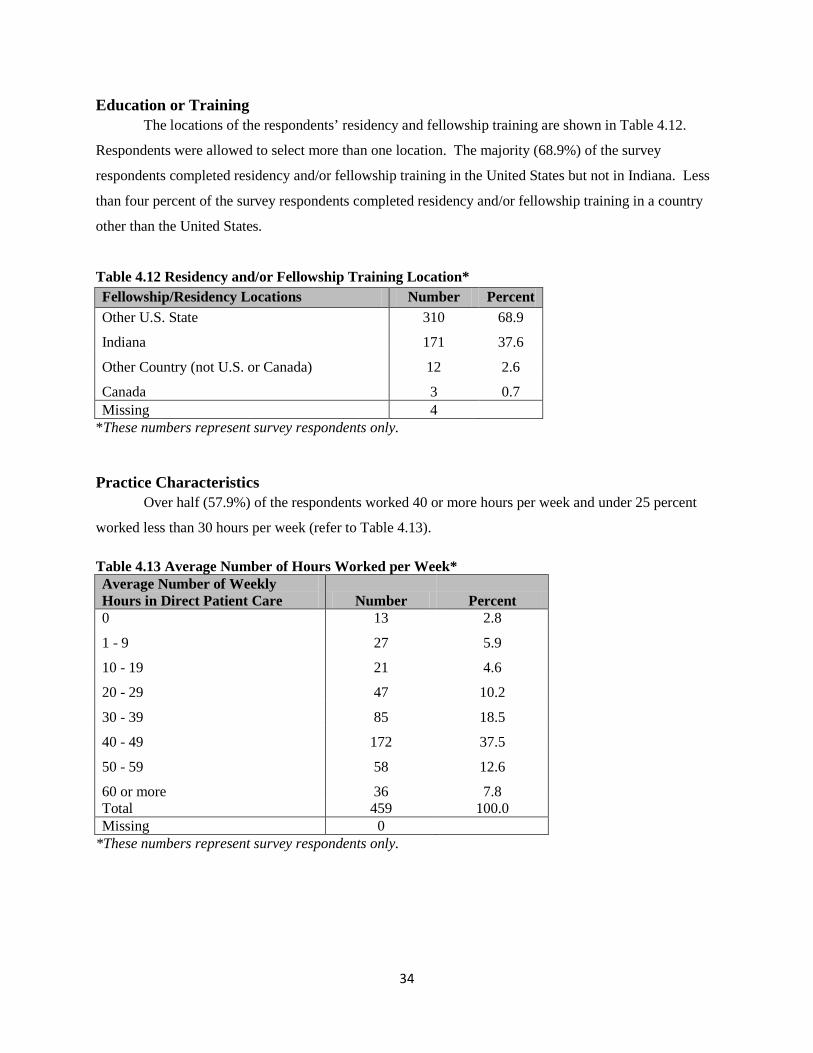
Education or Training The locations of the respondents’ residency and fellowship training are shown in Table 4.12.
Respondents were allowed to select more than one location. The majority (68.9%) of the survey
respondents completed residency and/or fellowship training in the United States but not in Indiana. Less
than four percent of the survey respondents completed residency and/or fellowship training in a country
other than the United States.
Table 4.12 Residency and/or Fellowship Training Location* Fellowship/Residency Locations Number Percent Other U.S. State 310 68.9
Indiana 171 37.6
Other Country (not U.S. or Canada) 12 2.6
Canada 3 0.7 Missing 4
*These numbers represent survey respondents only.
Practice Characteristics
Over half (57.9%) of the respondents worked 40 or more hours per week and under 25 percent
worked less than 30 hours per week (refer to Table 4.13).
Table 4.13 Average Number of Hours Worked per Week* Average Number of Weekly Hours in Direct Patient Care Number Percent 0 13 2.8
1 - 9 27 5.9
10 - 19 21 4.6
20 - 29 47 10.2
30 - 39 85 18.5
40 - 49 172 37.5
50 - 59 58 12.6
60 or more 36 7.8 Total 459 100.0 Missing 0
*These numbers represent survey respondents only.
35
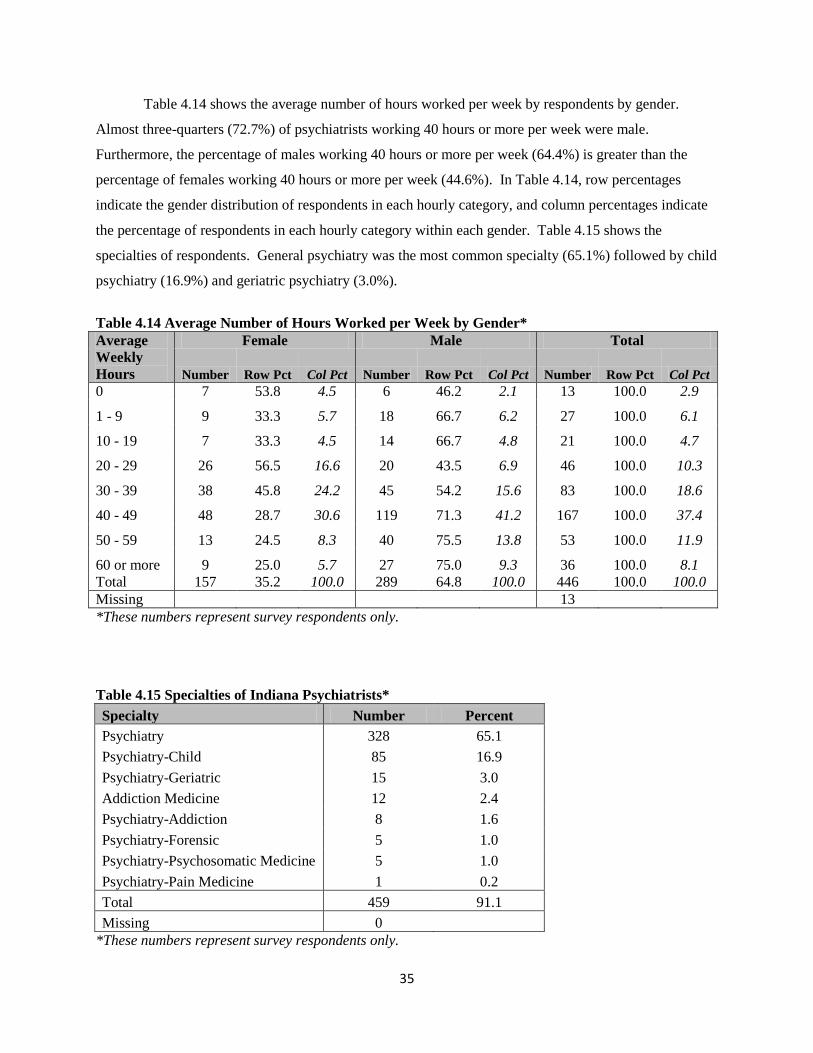
Table 4.14 shows the average number of hours worked per week by respondents by gender.
Almost three-quarters (72.7%) of psychiatrists working 40 hours or more per week were male.
Furthermore, the percentage of males working 40 hours or more per week (64.4%) is greater than the
percentage of females working 40 hours or more per week (44.6%). In Table 4.14, row percentages
indicate the gender distribution of respondents in each hourly category, and column percentages indicate
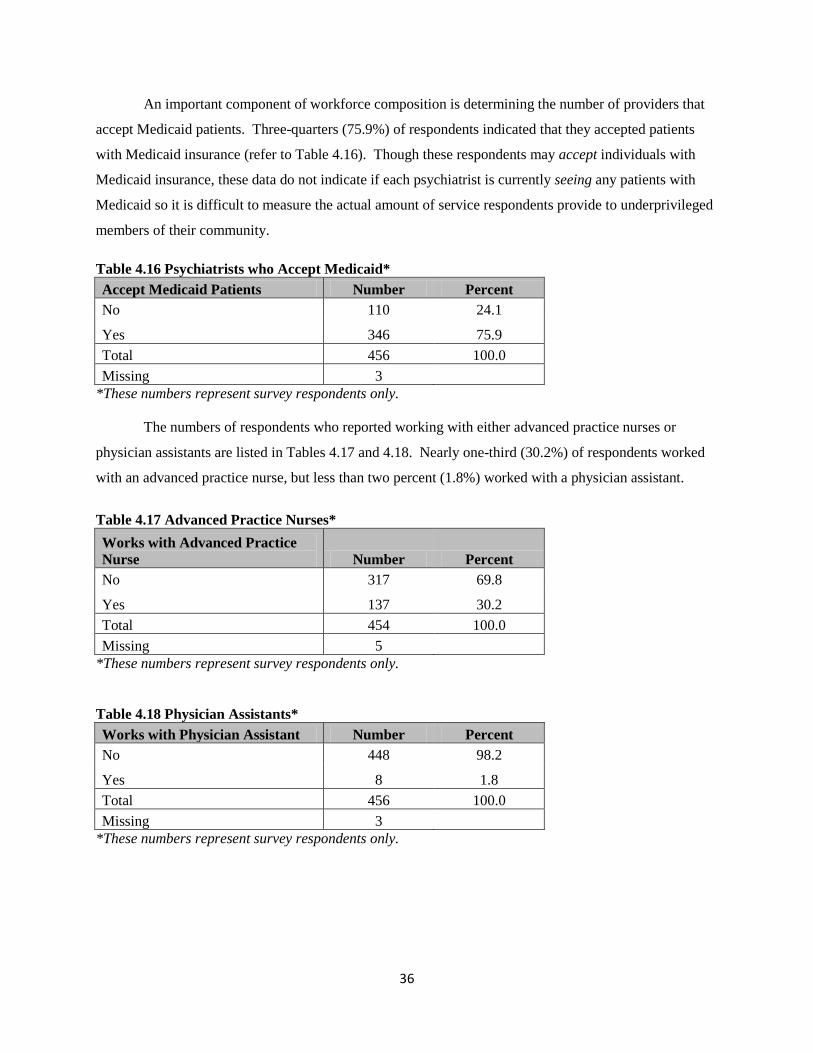
the percentage of respondents in each hourly category within each gender. Table 4.15 shows the
specialties of respondents. General psychiatry was the most common specialty (65.1%) followed by child
psychiatry (16.9%) and geriatric psychiatry (3.0%). Table 4.14 Average Number of Hours Worked per Week by Gender* Average Weekly Hours
Female Male Total
Number Row Pct Col Pct Number Row Pct Col Pct Number Row Pct Col Pct 0 7 53.8 4.5 6 46.2 2.1 13 100.0 2.9
1 - 9 9 33.3 5.7 18 66.7 6.2 27 100.0 6.1
10 - 19 7 33.3 4.5 14 66.7 4.8 21 100.0 4.7
20 - 29 26 56.5 16.6 20 43.5 6.9 46 100.0 10.3
30 - 39 38 45.8 24.2 45 54.2 15.6 83 100.0 18.6
40 - 49 48 28.7 30.6 119 71.3 41.2 167 100.0 37.4
50 - 59 13 24.5 8.3 40 75.5 13.8 53 100.0 11.9
60 or more 9 25.0 5.7 27 75.0 9.3 36 100.0 8.1 Total 157 35.2 100.0 289 64.8 100.0 446 100.0 100.0 Missing 13 *These numbers represent survey respondents only.
Table 4.15 Specialties of Indiana Psychiatrists* Specialty Number Percent Psychiatry 328 65.1 Psychiatry-Child 85 16.9 Psychiatry-Geriatric 15 3.0 Addiction Medicine 12 2.4 Psychiatry-Addiction 8 1.6 Psychiatry-Forensic 5 1.0 Psychiatry-Psychosomatic Medicine 5 1.0 Psychiatry-Pain Medicine 1 0.2 Total 459 91.1 Missing 0
*These numbers represent survey respondents only.
36
An important component of workforce composition is determining the number of providers that
accept Medicaid patients. Three-quarters (75.9%) of respondents indicated that they accepted patients
with Medicaid insurance (refer to Table 4.16). Though these respondents may accept individuals with
Medicaid insurance, these data do not indicate if each psychiatrist is currently seeing any patients with
Medicaid so it is difficult to measure the actual amount of service respondents provide to underprivileged
members of their community.
Table 4.16 Psychiatrists who Accept Medicaid* Accept Medicaid Patients Number Percent No 110 24.1
Yes 346 75.9 Total 456 100.0 Missing 3
*These numbers represent survey respondents only. The numbers of respondents who reported working with either advanced practice nurses or
physician assistants are listed in Tables 4.17 and 4.18. Nearly one-third (30.2%) of respondents worked
with an advanced practice nurse, but less than two percent (1.8%) worked with a physician assistant.
Table 4.17 Advanced Practice Nurses* Works with Advanced Practice Nurse Number Percent No 317 69.8
Yes 137 30.2 Total 454 100.0 Missing 5
*These numbers represent survey respondents only. Table 4.18 Physician Assistants* Works with Physician Assistant Number Percent No 448 98.2
Yes 8 1.8 Total 456 100.0 Missing 3
*These numbers represent survey respondents only.
37
Chapter 5: Responses to the 2011 Indiana Psychiatric Advanced Practice Nurse Electronic Survey
This chapter summarizes the responses to the items included on the 2011 psychiatric/mental
health nurse survey. This survey was introduced for the first time in 2010. The tables below display the
number of valid and missing responses and the percentage of valid responses. The text describes the
tables.
Methods This survey was not conducted as part of the re-licensing process. Advanced practice nurses were
invited to participate in the survey by using a “snowball” strategy to disseminate the survey to clinical
nurse specialists and nurse practitioners that practice in the field of mental health. The survey includes
questions about respondents’ practice setting, principle practice location, specialties, expected time until
retirement, education, and demographic information. A copy of the 2011 Indiana Psychiatric Advanced
Practice Nurse Electronic Survey is included in Appendix 1-D. It is difficult to estimate the total number
of these professionals in Indiana since they are not licensed separately from other nurses who do not
specialize in psychiatric treatment. The data was compiled using Microsoft Excel 2007 and the data was
analyzed using IBM SPSS Statistics 19. The dataset was then used to filter the records to include only the
respondents that met the inclusion criteria.
Inclusion and Exclusion Criteria Because psychiatric advanced practice nurses (clinical nurse specialists and nurse practitioners
specializing in psychiatric/mental health) are not licensed separately from other nurses and survey
respondents were not linked to IPLA datasets containing licensing information, it is not possible to
determine respondents’ current license status. However, the dataset was refined by current work status.
Only those psychiatric advanced practice nurses who were currently working in the mental health field in
Indiana were included in the study. Psychiatric advanced practice nurses who were retired, temporarily
inactive, practicing outside of Indiana, or working for the government or military were excluded from the
analyses. Government and military employees were excluded because this study is meant to reflect the
number of psychiatric advanced practice nurses serving the community at large. A total of 61 psychiatric
advanced practice nurses (87.1%) were selected for inclusion (refer to Table 5.1).
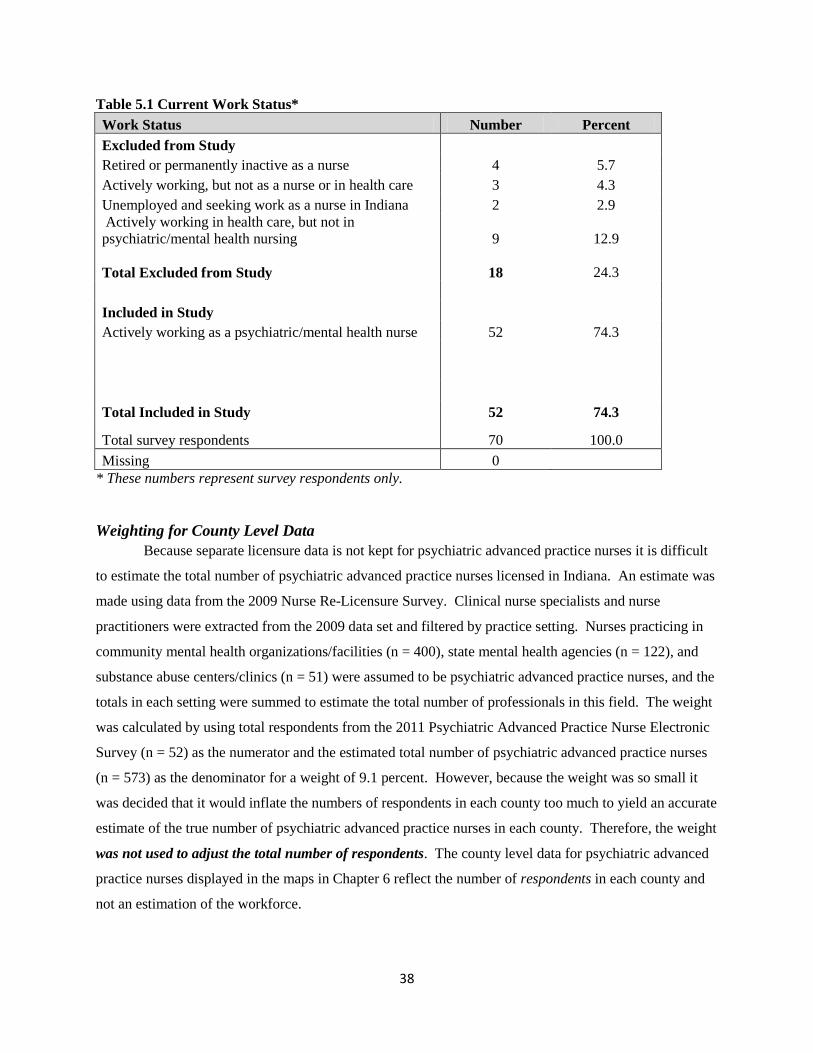
38
Table 5.1 Current Work Status* Work Status Number Percent Excluded from Study Retired or permanently inactive as a nurse 4 5.7 Actively working, but not as a nurse or in health care 3 4.3 Unemployed and seeking work as a nurse in Indiana 2 2.9 Actively working in health care, but not in psychiatric/mental health nursing 9 12.9 Total Excluded from Study 18 24.3 Included in Study Actively working as a psychiatric/mental health nurse 52 74.3
Total Included in Study 52 74.3
Total survey respondents 70 100.0 Missing 0
* These numbers represent survey respondents only.
Weighting for County Level Data Because separate licensure data is not kept for psychiatric advanced practice nurses it is difficult
to estimate the total number of psychiatric advanced practice nurses licensed in Indiana. An estimate was
made using data from the 2009 Nurse Re-Licensure Survey. Clinical nurse specialists and nurse
practitioners were extracted from the 2009 data set and filtered by practice setting. Nurses practicing in
community mental health organizations/facilities (n = 400), state mental health agencies (n = 122), and
substance abuse centers/clinics (n = 51) were assumed to be psychiatric advanced practice nurses, and the
totals in each setting were summed to estimate the total number of professionals in this field. The weight
was calculated by using total respondents from the 2011 Psychiatric Advanced Practice Nurse Electronic
Survey (n = 52) as the numerator and the estimated total number of psychiatric advanced practice nurses
(n = 573) as the denominator for a weight of 9.1 percent. However, because the weight was so small it
was decided that it would inflate the numbers of respondents in each county too much to yield an accurate
estimate of the true number of psychiatric advanced practice nurses in each county. Therefore, the weight
was not used to adjust the total number of respondents. The county level data for psychiatric advanced
practice nurses displayed in the maps in Chapter 6 reflect the number of respondents in each county and
not an estimation of the workforce.
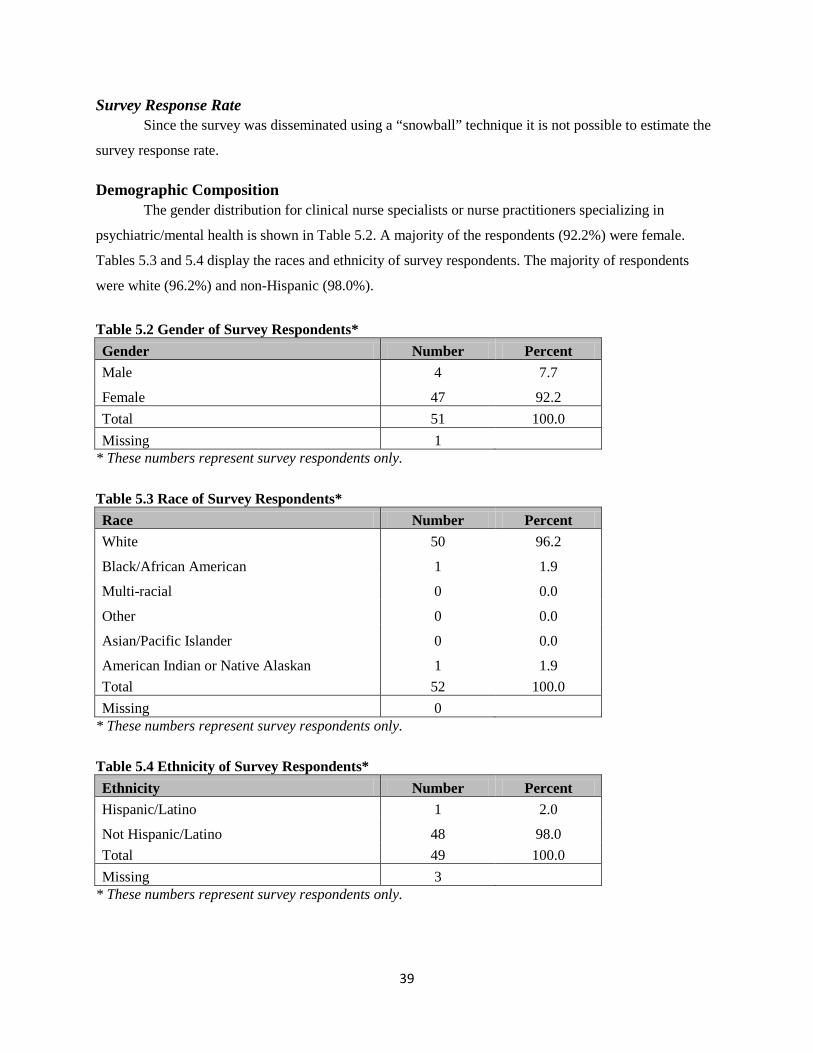
39
Survey Response Rate Since the survey was disseminated using a “snowball” technique it is not possible to estimate the
survey response rate.
Demographic Composition The gender distribution for clinical nurse specialists or nurse practitioners specializing in
psychiatric/mental health is shown in Table 5.2. A majority of the respondents (92.2%) were female.
Tables 5.3 and 5.4 display the races and ethnicity of survey respondents. The majority of respondents
were white (96.2%) and non-Hispanic (98.0%).
Table 5.2 Gender of Survey Respondents* Gender Number Percent Male 4 7.7
Female 47 92.2 Total 51 100.0 Missing 1
* These numbers represent survey respondents only. Table 5.3 Race of Survey Respondents* Race Number Percent White 50 96.2
Black/African American 1 1.9
Multi-racial 0 0.0
Other 0 0.0
Asian/Pacific Islander 0 0.0
American Indian or Native Alaskan 1 1.9 Total 52 100.0 Missing 0
* These numbers represent survey respondents only. Table 5.4 Ethnicity of Survey Respondents* Ethnicity Number Percent Hispanic/Latino 1 2.0
Not Hispanic/Latino 48 98.0 Total 49 100.0 Missing 3
* These numbers represent survey respondents only.
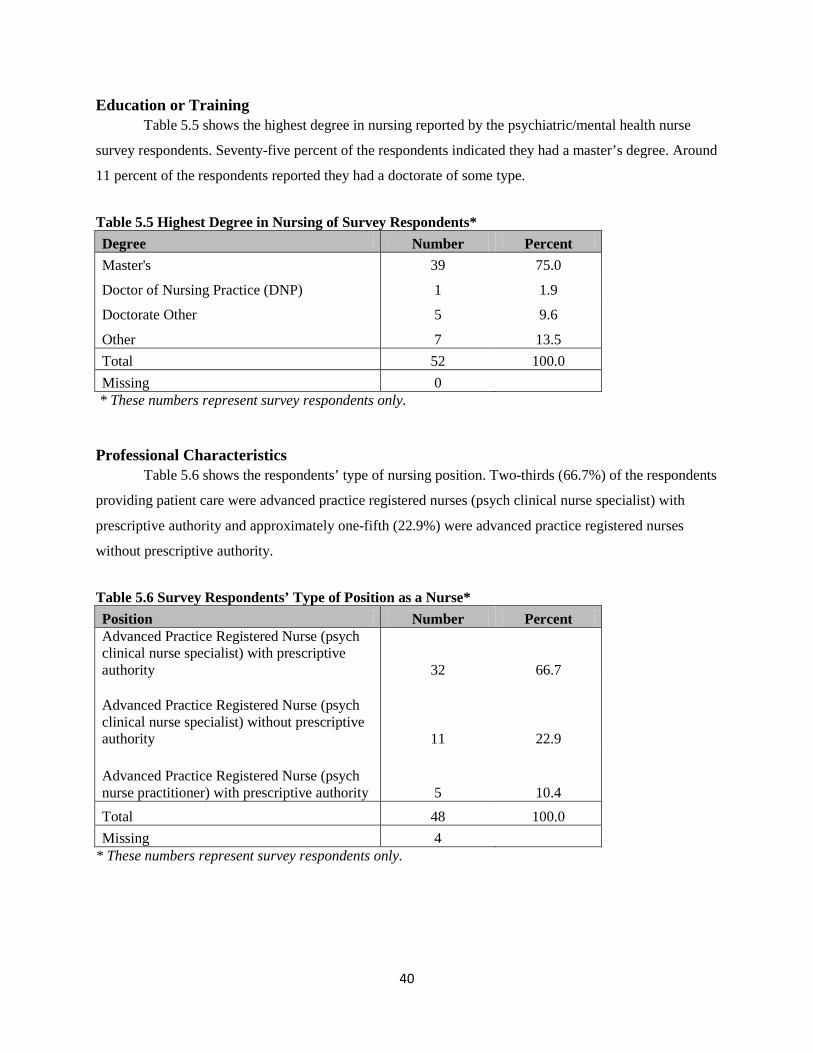
40
Education or Training Table 5.5 shows the highest degree in nursing reported by the psychiatric/mental health nurse
survey respondents. Seventy-five percent of the respondents indicated they had a master’s degree. Around
11 percent of the respondents reported they had a doctorate of some type.
Table 5.5 Highest Degree in Nursing of Survey Respondents* Degree Number Percent Master's 39 75.0
Doctor of Nursing Practice (DNP) 1 1.9
Doctorate Other 5 9.6
Other 7 13.5 Total 52 100.0 Missing 0
* These numbers represent survey respondents only.
Professional Characteristics Table 5.6 shows the respondents’ type of nursing position. Two-thirds (66.7%) of the respondents
providing patient care were advanced practice registered nurses (psych clinical nurse specialist) with
prescriptive authority and approximately one-fifth (22.9%) were advanced practice registered nurses
without prescriptive authority.
Table 5.6 Survey Respondents’ Type of Position as a Nurse* Position Number Percent Advanced Practice Registered Nurse (psych clinical nurse specialist) with prescriptive authority 32 66.7
Advanced Practice Registered Nurse (psych clinical nurse specialist) without prescriptive authority 11 22.9
Advanced Practice Registered Nurse (psych nurse practitioner) with prescriptive authority 5 10.4 Total 48 100.0 Missing 4
* These numbers represent survey respondents only.
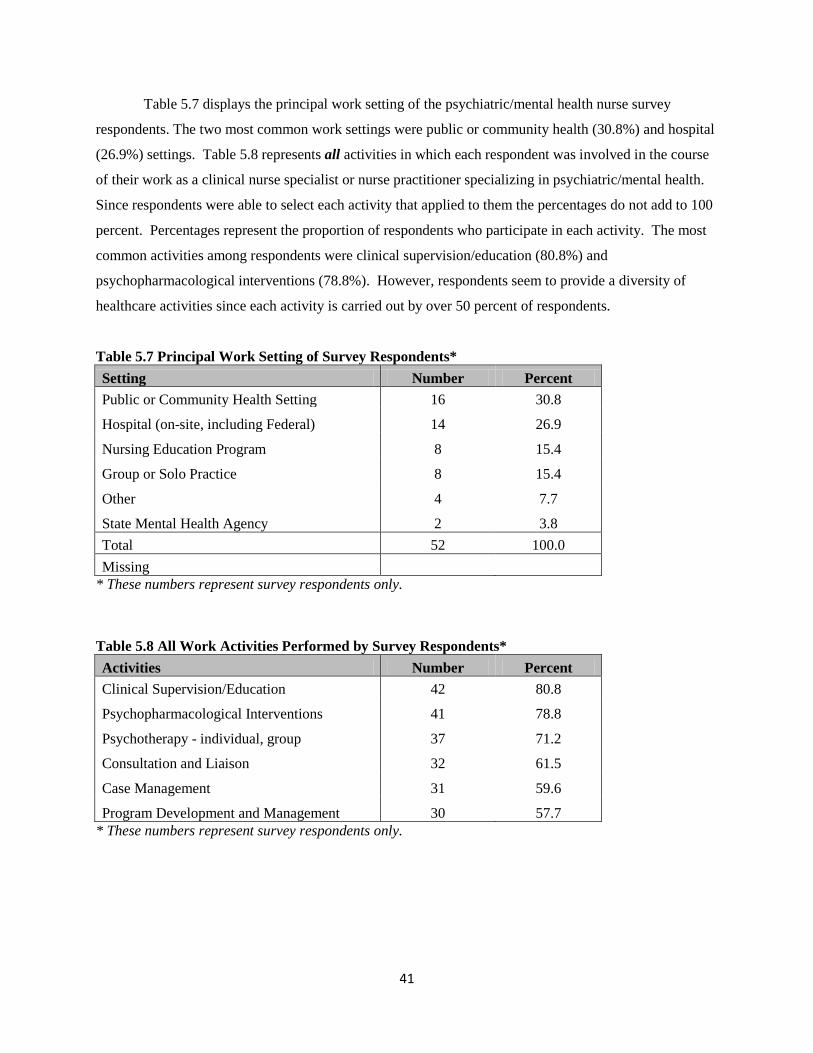
41
Table 5.7 displays the principal work setting of the psychiatric/mental health nurse survey
respondents. The two most common work settings were public or community health (30.8%) and hospital
(26.9%) settings. Table 5.8 represents all activities in which each respondent was involved in the course
of their work as a clinical nurse specialist or nurse practitioner specializing in psychiatric/mental health.
Since respondents were able to select each activity that applied to them the percentages do not add to 100
percent. Percentages represent the proportion of respondents who participate in each activity. The most
common activities among respondents were clinical supervision/education (80.8%) and
psychopharmacological interventions (78.8%). However, respondents seem to provide a diversity of
healthcare activities since each activity is carried out by over 50 percent of respondents.
Table 5.7 Principal Work Setting of Survey Respondents* Setting Number Percent Public or Community Health Setting 16 30.8
Hospital (on-site, including Federal) 14 26.9
Nursing Education Program 8 15.4
Group or Solo Practice 8 15.4
Other 4 7.7
State Mental Health Agency 2 3.8 Total 52 100.0 Missing
* These numbers represent survey respondents only. Table 5.8 All Work Activities Performed by Survey Respondents* Activities Number Percent Clinical Supervision/Education 42 80.8
Psychopharmacological Interventions 41 78.8
Psychotherapy - individual, group 37 71.2
Consultation and Liaison 32 61.5
Case Management 31 59.6
Program Development and Management 30 57.7 * These numbers represent survey respondents only.
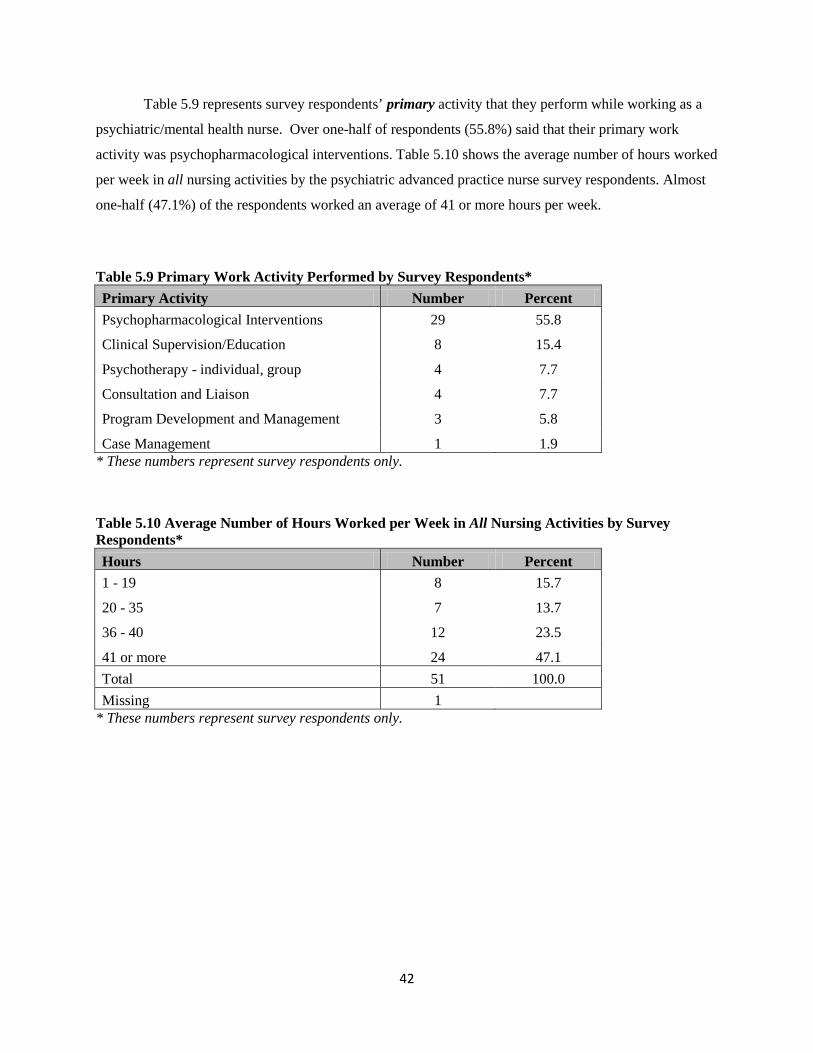
42
Table 5.9 represents survey respondents’ primary activity that they perform while working as a
psychiatric/mental health nurse. Over one-half of respondents (55.8%) said that their primary work
activity was psychopharmacological interventions. Table 5.10 shows the average number of hours worked
per week in all nursing activities by the psychiatric advanced practice nurse survey respondents. Almost
one-half (47.1%) of the respondents worked an average of 41 or more hours per week.
Table 5.9 Primary Work Activity Performed by Survey Respondents* Primary Activity Number Percent Psychopharmacological Interventions 29 55.8
Clinical Supervision/Education 8 15.4
Psychotherapy - individual, group 4 7.7
Consultation and Liaison 4 7.7
Program Development and Management 3 5.8
Case Management 1 1.9 * These numbers represent survey respondents only. Table 5.10 Average Number of Hours Worked per Week in All Nursing Activities by Survey Respondents* Hours Number Percent 1 - 19 8 15.7
20 - 35 7 13.7
36 - 40 12 23.5
41 or more 24 47.1 Total 51 100.0 Missing 1
* These numbers represent survey respondents only.
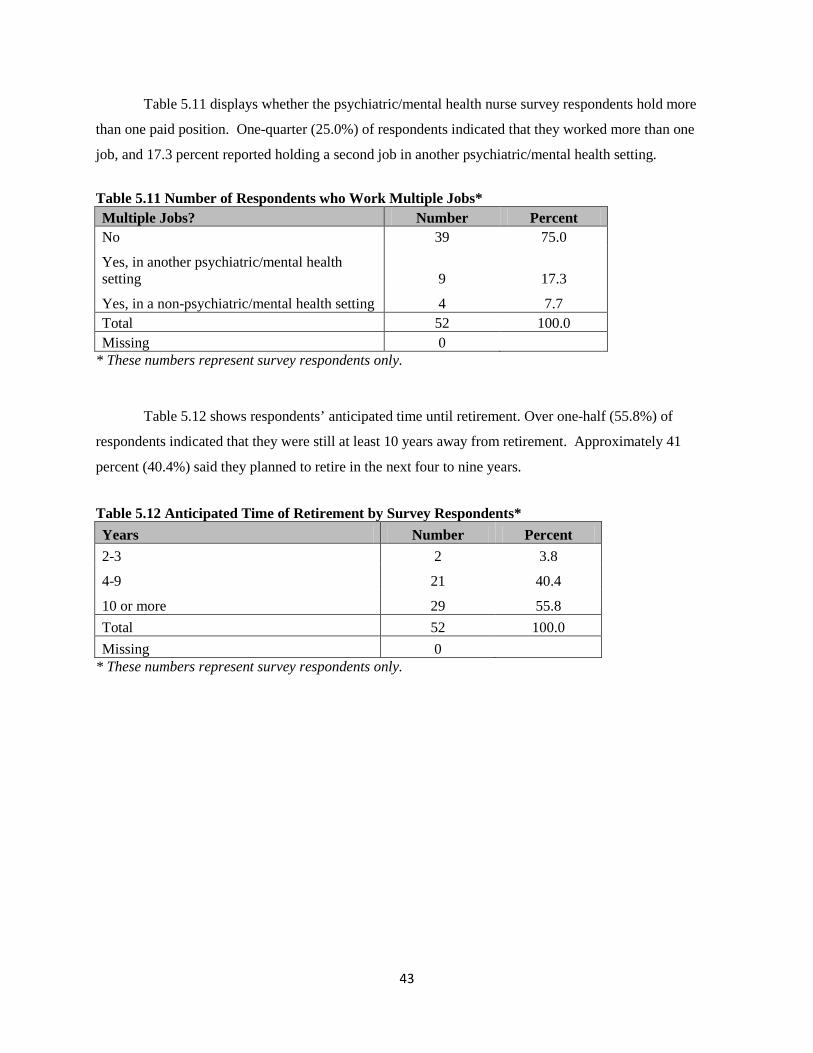
43
Table 5.11 displays whether the psychiatric/mental health nurse survey respondents hold more
than one paid position. One-quarter (25.0%) of respondents indicated that they worked more than one
job, and 17.3 percent reported holding a second job in another psychiatric/mental health setting.
Table 5.11 Number of Respondents who Work Multiple Jobs* Multiple Jobs? Number Percent No 39 75.0
Yes, in another psychiatric/mental health setting 9 17.3
Yes, in a non-psychiatric/mental health setting 4 7.7 Total 52 100.0 Missing 0
* These numbers represent survey respondents only.
Table 5.12 shows respondents’ anticipated time until retirement. Over one-half (55.8%) of
respondents indicated that they were still at least 10 years away from retirement. Approximately 41
percent (40.4%) said they planned to retire in the next four to nine years.
Table 5.12 Anticipated Time of Retirement by Survey Respondents* Years Number Percent 2-3 2 3.8
4-9 21 40.4
10 or more 29 55.8 Total 52 100.0 Missing 0
* These numbers represent survey respondents only.
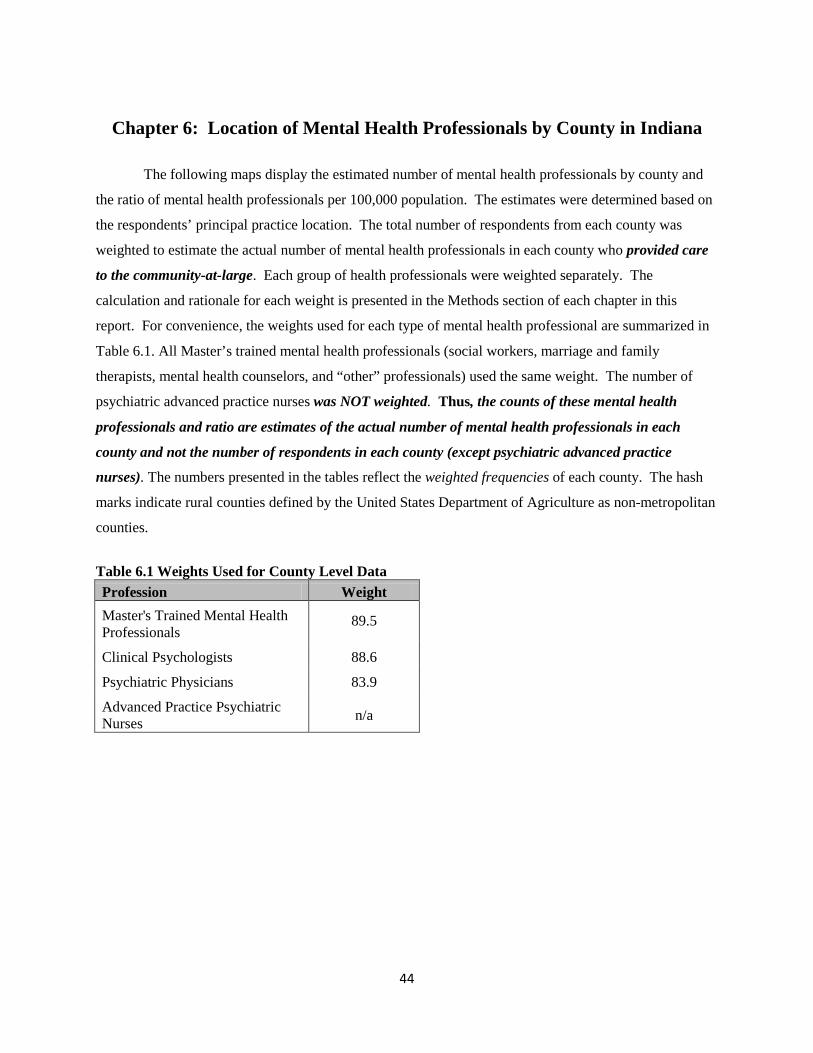
44
Chapter 6: Location of Mental Health Professionals by County in Indiana
The following maps display the estimated number of mental health professionals by county and
the ratio of mental health professionals per 100,000 population. The estimates were determined based on
the respondents’ principal practice location. The total number of respondents from each county was
weighted to estimate the actual number of mental health professionals in each county who provided care
to the community-at-large. Each group of health professionals were weighted separately. The
calculation and rationale for each weight is presented in the Methods section of each chapter in this
report. For convenience, the weights used for each type of mental health professional are summarized in
Table 6.1. All Master’s trained mental health professionals (social workers, marriage and family
therapists, mental health counselors, and “other” professionals) used the same weight. The number of
psychiatric advanced practice nurses was NOT weighted. Thus, the counts of these mental health
professionals and ratio are estimates of the actual number of mental health professionals in each
county and not the number of respondents in each county (except psychiatric advanced practice
nurses). The numbers presented in the tables reflect the weighted frequencies of each county. The hash
marks indicate rural counties defined by the United States Department of Agriculture as non-metropolitan
counties.
Table 6.1 Weights Used for County Level Data Profession Weight Master's Trained Mental Health Professionals
89.5
Clinical Psychologists 88.6
Psychiatric Physicians 83.9
Advanced Practice Psychiatric Nurses n/a
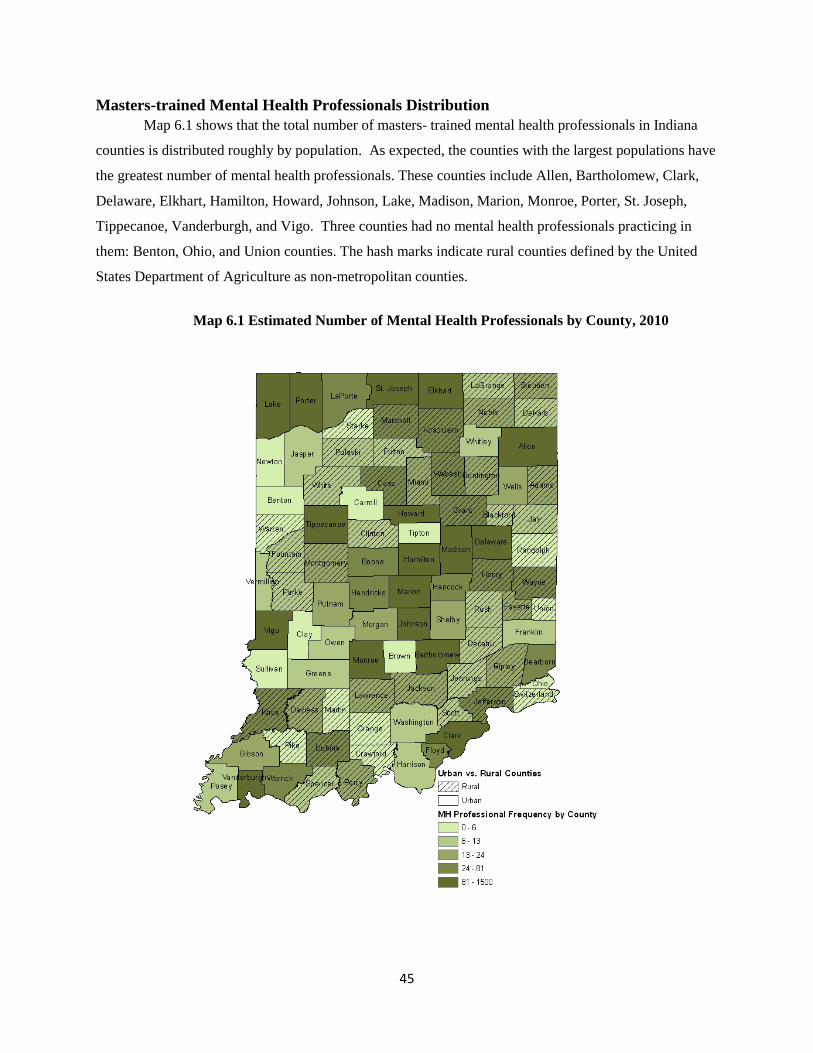
45
Masters-trained Mental Health Professionals Distribution Map 6.1 shows that the total number of masters- trained mental health professionals in Indiana
counties is distributed roughly by population. As expected, the counties with the largest populations have
the greatest number of mental health professionals. These counties include Allen, Bartholomew, Clark,
Delaware, Elkhart, Hamilton, Howard, Johnson, Lake, Madison, Marion, Monroe, Porter, St. Joseph,
Tippecanoe, Vanderburgh, and Vigo. Three counties had no mental health professionals practicing in
them: Benton, Ohio, and Union counties. The hash marks indicate rural counties defined by the United
States Department of Agriculture as non-metropolitan counties.
Map 6.1 Estimated Number of Mental Health Professionals by County, 2010
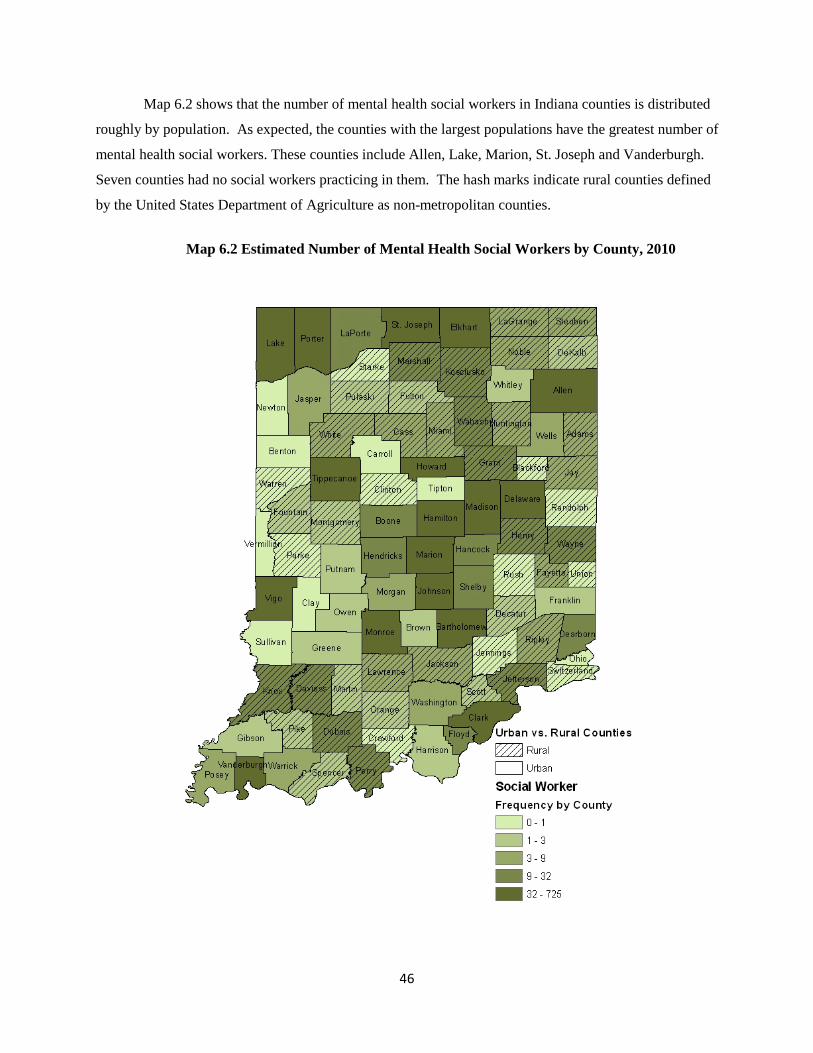
46
Map 6.2 shows that the number of mental health social workers in Indiana counties is distributed
roughly by population. As expected, the counties with the largest populations have the greatest number of
mental health social workers. These counties include Allen, Lake, Marion, St. Joseph and Vanderburgh.
Seven counties had no social workers practicing in them. The hash marks indicate rural counties defined
by the United States Department of Agriculture as non-metropolitan counties.
Map 6.2 Estimated Number of Mental Health Social Workers by County, 2010
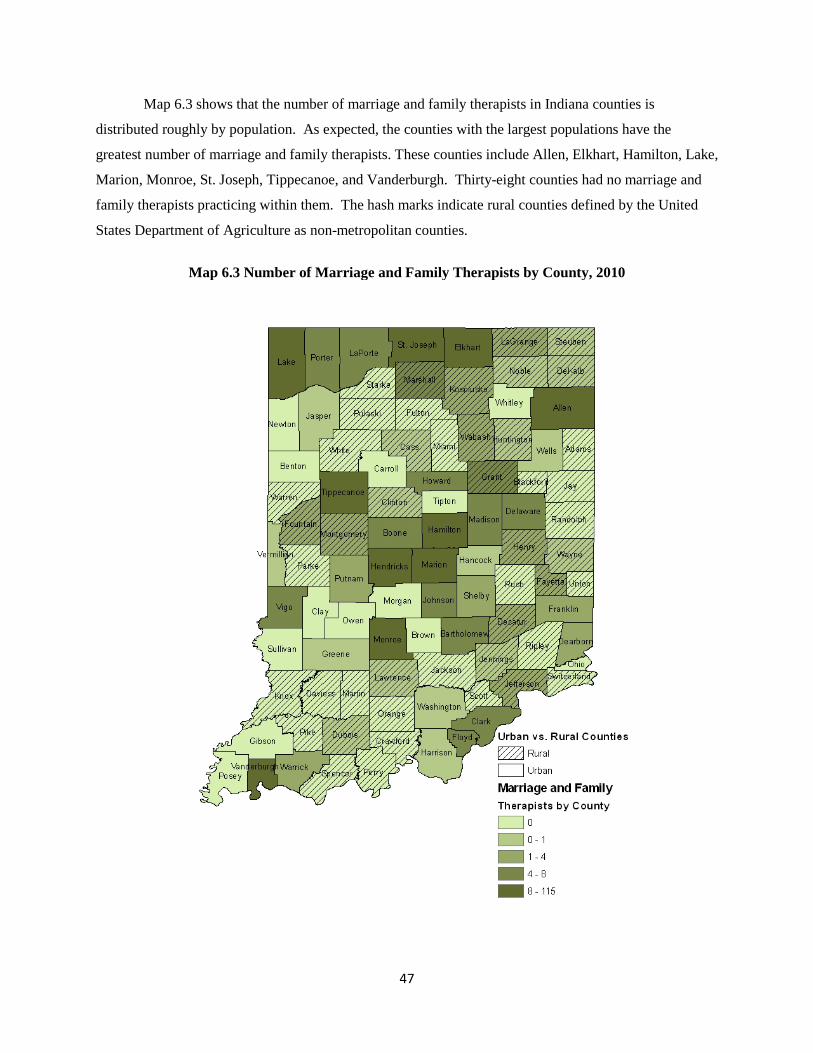
47
Map 6.3 shows that the number of marriage and family therapists in Indiana counties is
distributed roughly by population. As expected, the counties with the largest populations have the
greatest number of marriage and family therapists. These counties include Allen, Elkhart, Hamilton, Lake,
Marion, Monroe, St. Joseph, Tippecanoe, and Vanderburgh. Thirty-eight counties had no marriage and
family therapists practicing within them. The hash marks indicate rural counties defined by the United
States Department of Agriculture as non-metropolitan counties.
Map 6.3 Number of Marriage and Family Therapists by County, 2010
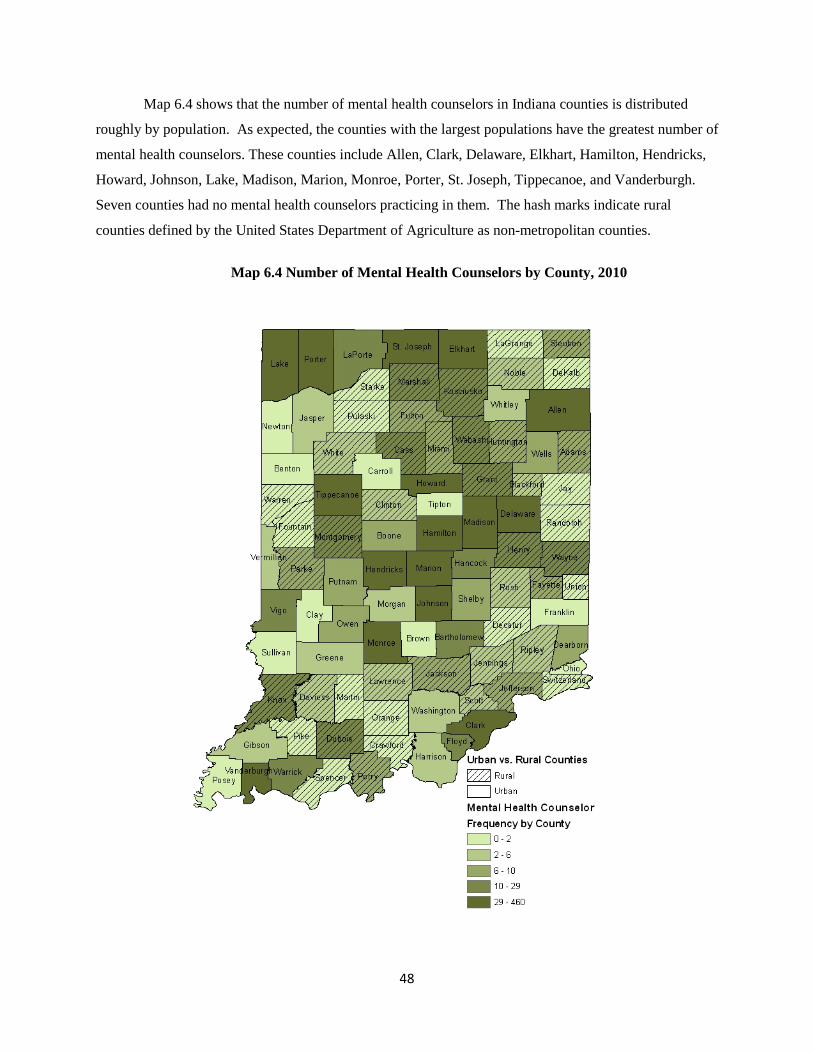
48
Map 6.4 shows that the number of mental health counselors in Indiana counties is distributed
roughly by population. As expected, the counties with the largest populations have the greatest number of
mental health counselors. These counties include Allen, Clark, Delaware, Elkhart, Hamilton, Hendricks,
Howard, Johnson, Lake, Madison, Marion, Monroe, Porter, St. Joseph, Tippecanoe, and Vanderburgh.
Seven counties had no mental health counselors practicing in them. The hash marks indicate rural
counties defined by the United States Department of Agriculture as non-metropolitan counties.
Map 6.4 Number of Mental Health Counselors by County, 2010
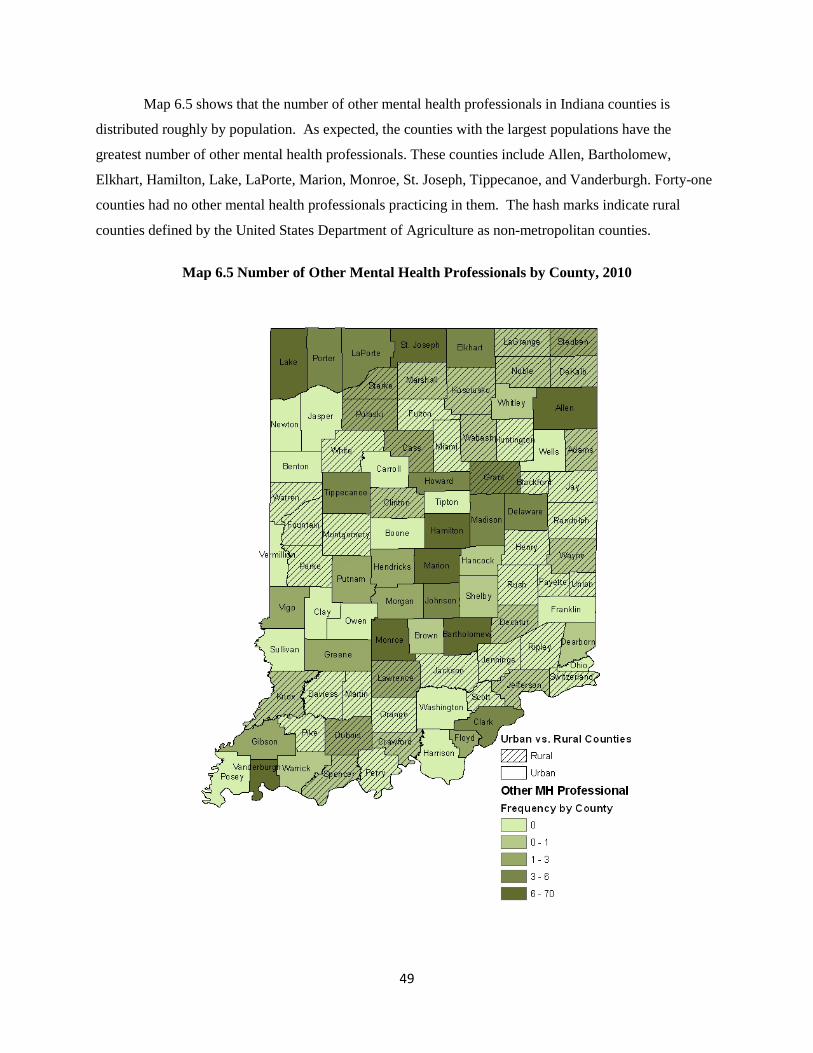
49
Map 6.5 shows that the number of other mental health professionals in Indiana counties is
distributed roughly by population. As expected, the counties with the largest populations have the
greatest number of other mental health professionals. These counties include Allen, Bartholomew,
Elkhart, Hamilton, Lake, LaPorte, Marion, Monroe, St. Joseph, Tippecanoe, and Vanderburgh. Forty-one
counties had no other mental health professionals practicing in them. The hash marks indicate rural
counties defined by the United States Department of Agriculture as non-metropolitan counties.
Map 6.5 Number of Other Mental Health Professionals by County, 2010
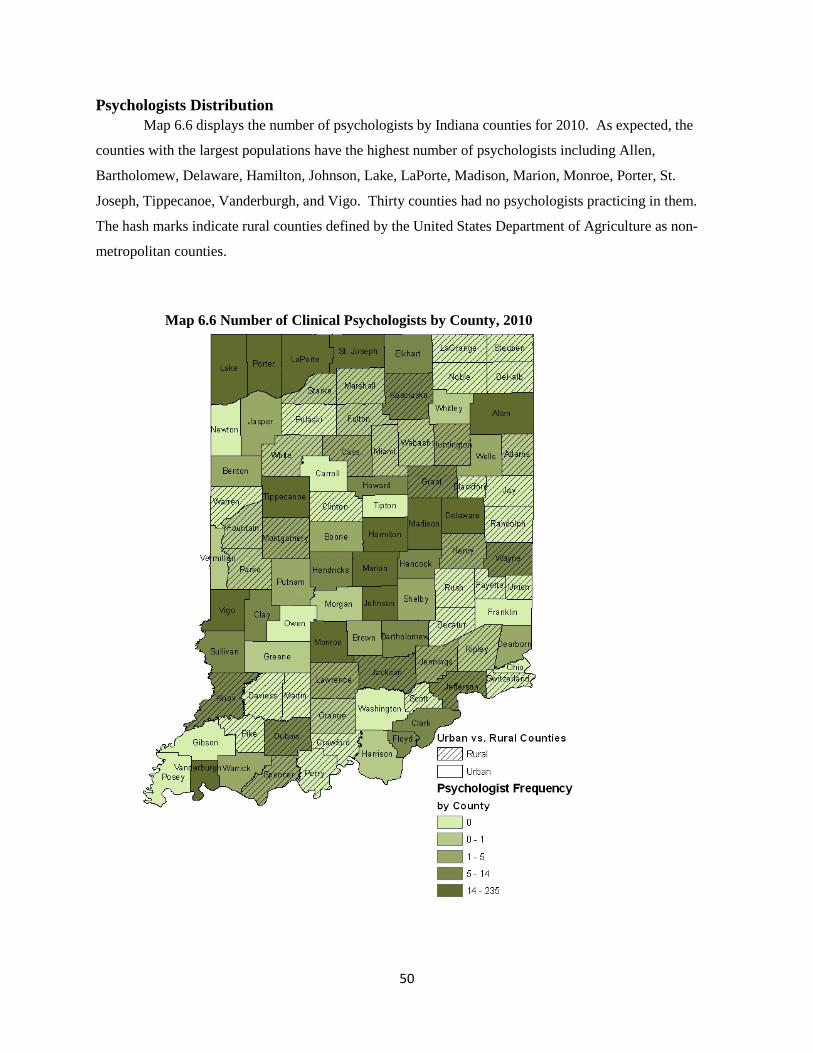
50
Psychologists Distribution Map 6.6 displays the number of psychologists by Indiana counties for 2010. As expected, the
counties with the largest populations have the highest number of psychologists including Allen,
Bartholomew, Delaware, Hamilton, Johnson, Lake, LaPorte, Madison, Marion, Monroe, Porter, St.
Joseph, Tippecanoe, Vanderburgh, and Vigo. Thirty counties had no psychologists practicing in them.
The hash marks indicate rural counties defined by the United States Department of Agriculture as non-
metropolitan counties.
Map 6.6 Number of Clinical Psychologists by County, 2010
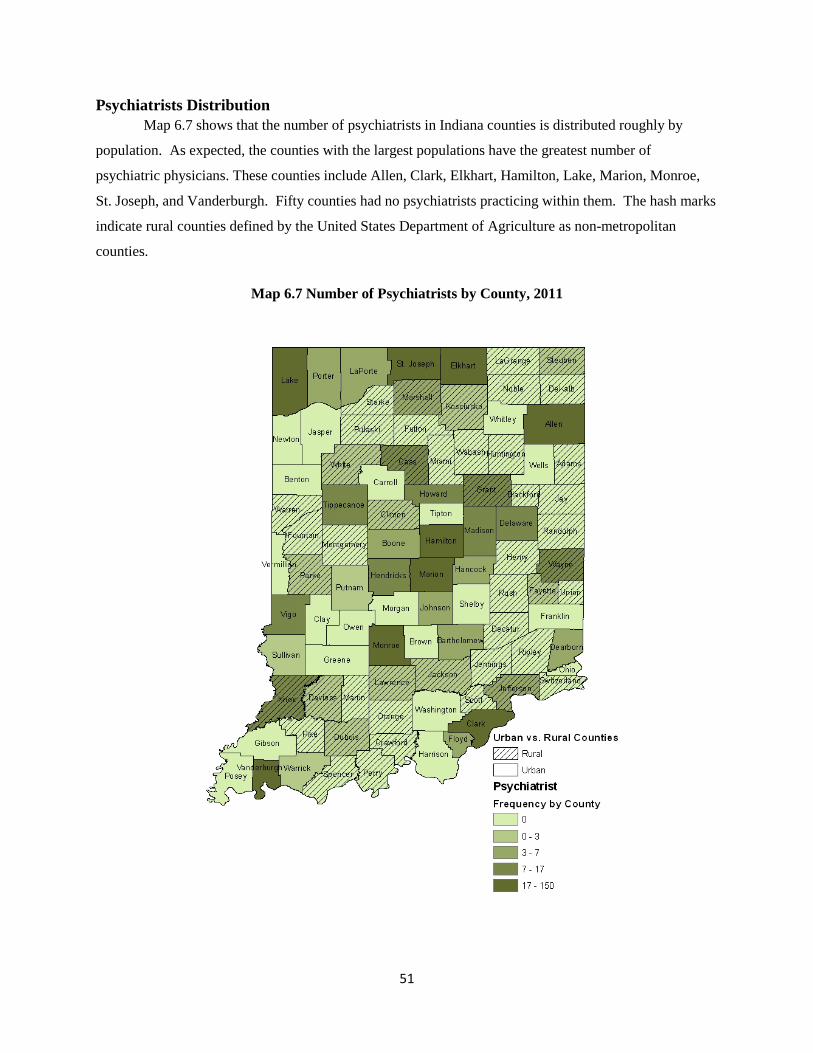
51
Psychiatrists Distribution Map 6.7 shows that the number of psychiatrists in Indiana counties is distributed roughly by
population. As expected, the counties with the largest populations have the greatest number of
psychiatric physicians. These counties include Allen, Clark, Elkhart, Hamilton, Lake, Marion, Monroe,
St. Joseph, and Vanderburgh. Fifty counties had no psychiatrists practicing within them. The hash marks
indicate rural counties defined by the United States Department of Agriculture as non-metropolitan
counties.
Map 6.7 Number of Psychiatrists by County, 2011
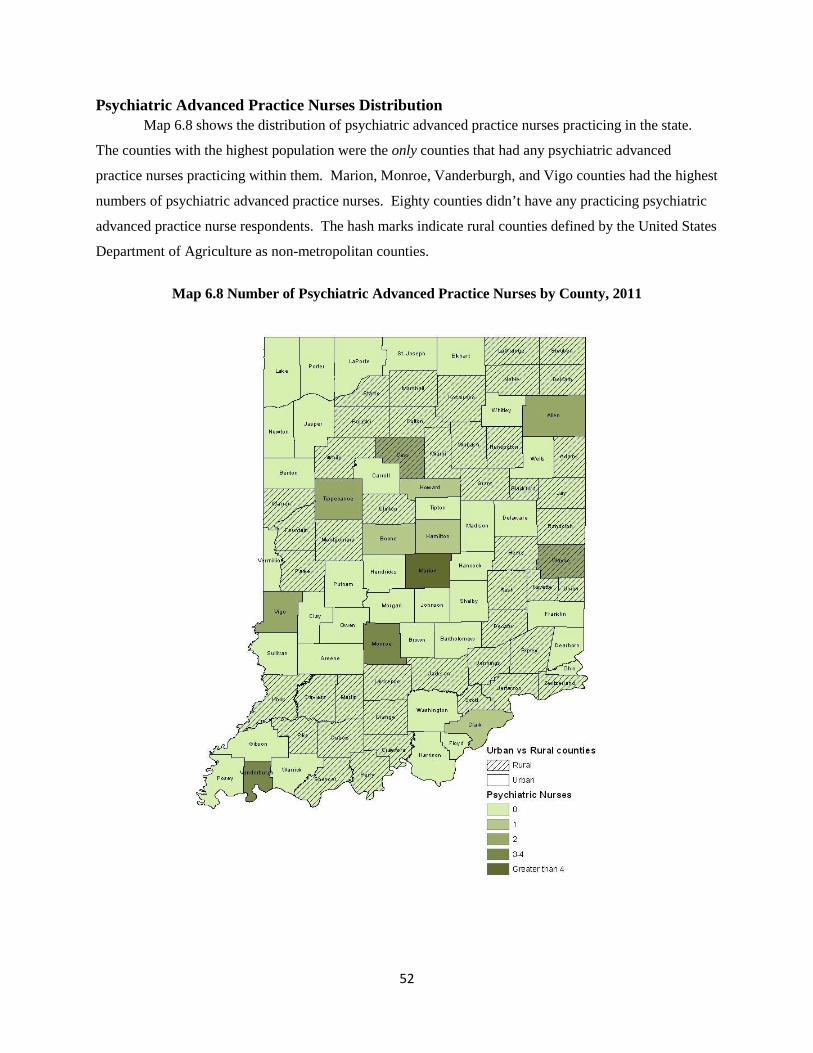
52
Psychiatric Advanced Practice Nurses Distribution Map 6.8 shows the distribution of psychiatric advanced practice nurses practicing in the state.
The counties with the highest population were the only counties that had any psychiatric advanced
practice nurses practicing within them. Marion, Monroe, Vanderburgh, and Vigo counties had the highest
numbers of psychiatric advanced practice nurses. Eighty counties didn’t have any practicing psychiatric
advanced practice nurse respondents. The hash marks indicate rural counties defined by the United States
Department of Agriculture as non-metropolitan counties.
Map 6.8 Number of Psychiatric Advanced Practice Nurses by County, 2011

53
Table 6.2 Estimated Number of Mental Health Professionals by County, 2010
County Population All MH
Professionals Social
Workers
Marriage and Family
Therapists
Mental Health
Counselors Other
Professions Adams 34,387 17 6 0 9 1 Allen 355,329 368 135 54 126 17 Bartholomew 76,794 91 45 7 19 8 Benton 8,854 0 0 0 0 0 Blackford 12,766 8 1 0 3 0 Boone 56,640 29 11 4 9 0 Brown 15,242 4 2 0 1 1 Carroll 20,155 2 1 0 1 0 Cass 38,966 26 8 1 11 2 Clark 110,232 91 40 7 31 4 Clay 26,890 2 1 0 1 0 Clinton 33,224 7 1 1 3 1 Crawford 10,713 3 1 0 1 1 Daviess 31,648 15 10 0 4 0 Dearborn 25,740 27 11 3 9 1 Decatur 42,223 8 3 2 1 1 DeKalb 50,047 11 2 1 2 1 Delaware 117,671 108 37 6 48 4 Dubois 41,889 34 16 1 11 3 Elkhart 197,559 161 72 17 49 6 Fayette 24,277 15 6 2 7 0 Floyd 74,578 64 28 6 25 2 Fountain 17,240 7 2 2 2 0 Franklin 23,087 7 2 2 1 0 Fulton 20,836 12 3 0 8 0 Gibson 33,503 15 3 0 4 3 Grant 70,061 54 13 8 23 4 Greene 33,165 12 3 1 6 2 Hamilton 274,569 209 86 29 67 7 Hancock 70,002 39 18 1 12 1 Harrison 39,364 8 2 1 4 0 Hendricks 145,448 80 29 9 36 3 Henry 49,462 34 13 2 13 0 Howard 82,752 85 32 4 34 4 Huntington 37,124 21 9 1 10 0 Jackson 42,376 19 9 0 7 0 Jasper 33,478 10 4 1 3 0 Jay 21,253 10 7 0 2 0
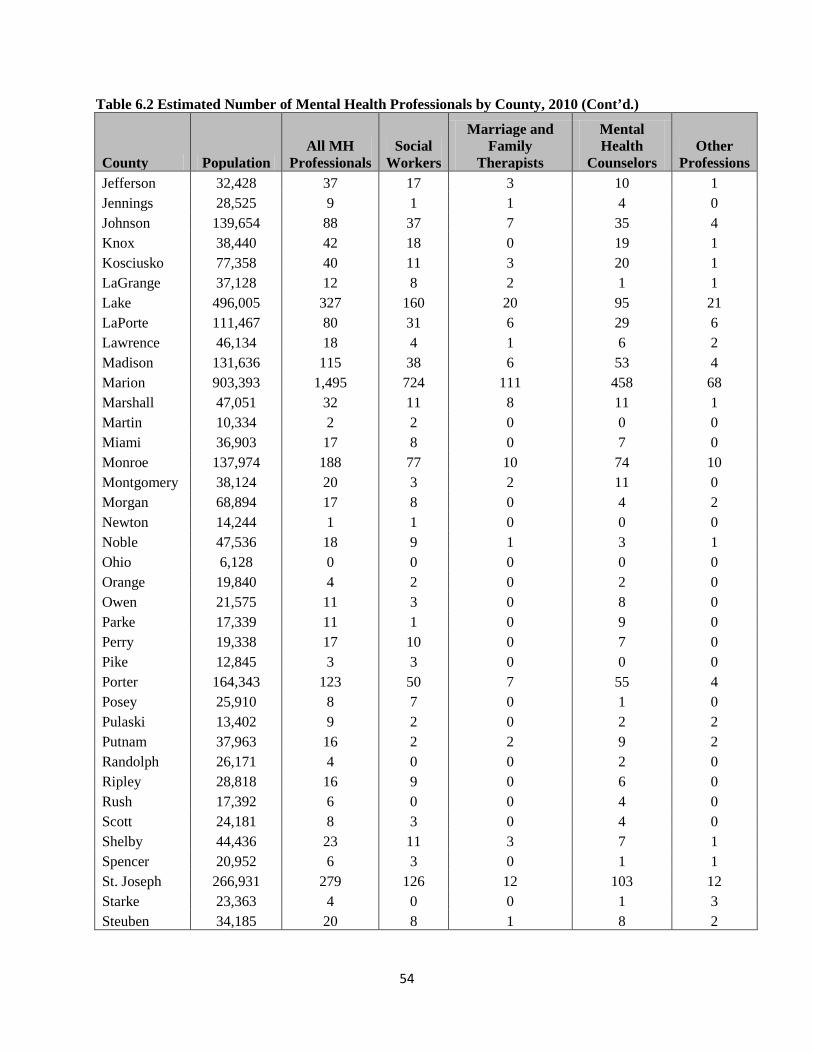
54
Table 6.2 Estimated Number of Mental Health Professionals by County, 2010 (Cont’d.)
County Population All MH
Professionals Social
Workers
Marriage and Family
Therapists
Mental Health
Counselors Other
Professions Jefferson 32,428 37 17 3 10 1 Jennings 28,525 9 1 1 4 0 Johnson 139,654 88 37 7 35 4 Knox 38,440 42 18 0 19 1 Kosciusko 77,358 40 11 3 20 1 LaGrange 37,128 12 8 2 1 1 Lake 496,005 327 160 20 95 21 LaPorte 111,467 80 31 6 29 6 Lawrence 46,134 18 4 1 6 2 Madison 131,636 115 38 6 53 4 Marion 903,393 1,495 724 111 458 68 Marshall 47,051 32 11 8 11 1 Martin 10,334 2 2 0 0 0 Miami 36,903 17 8 0 7 0 Monroe 137,974 188 77 10 74 10 Montgomery 38,124 20 3 2 11 0 Morgan 68,894 17 8 0 4 2 Newton 14,244 1 1 0 0 0 Noble 47,536 18 9 1 3 1 Ohio 6,128 0 0 0 0 0 Orange 19,840 4 2 0 2 0 Owen 21,575 11 3 0 8 0 Parke 17,339 11 1 0 9 0 Perry 19,338 17 10 0 7 0 Pike 12,845 3 3 0 0 0 Porter 164,343 123 50 7 55 4 Posey 25,910 8 7 0 1 0 Pulaski 13,402 9 2 0 2 2 Putnam 37,963 16 2 2 9 2 Randolph 26,171 4 0 0 2 0 Ripley 28,818 16 9 0 6 0 Rush 17,392 6 0 0 4 0 Scott 24,181 8 3 0 4 0 Shelby 44,436 23 11 3 7 1 Spencer 20,952 6 3 0 1 1 St. Joseph 266,931 279 126 12 103 12 Starke 23,363 4 0 0 1 3 Steuben 34,185 20 8 1 8 2
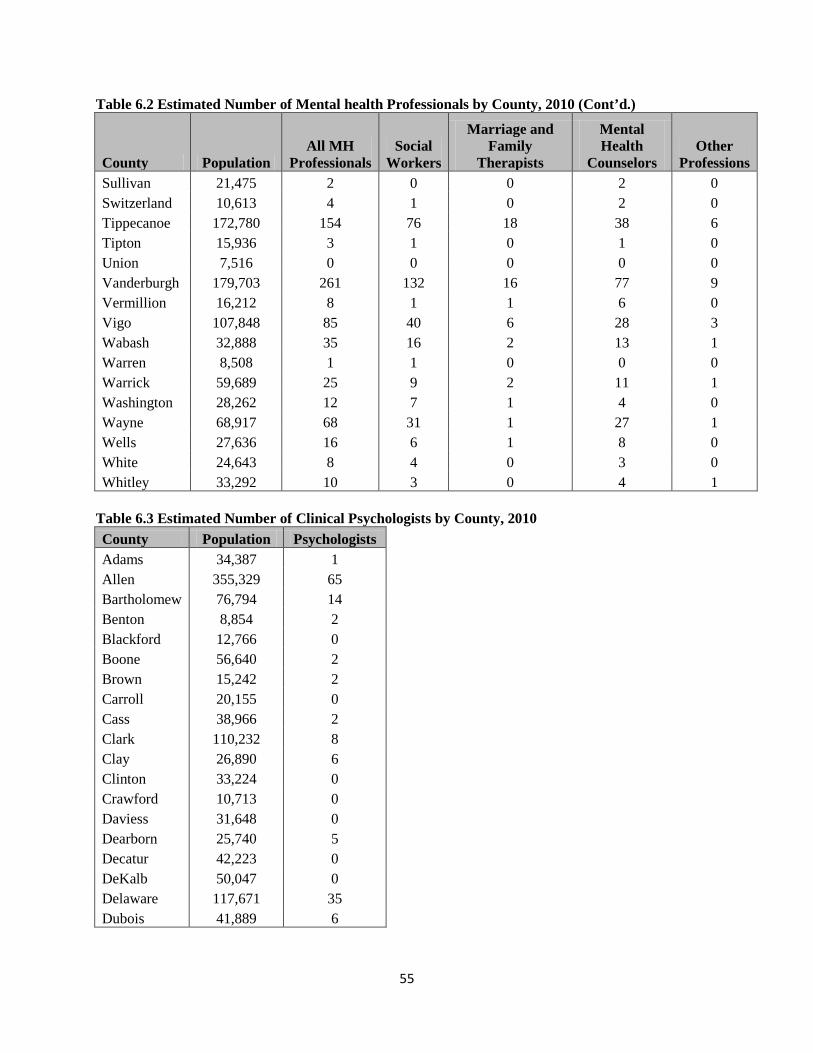
55
Table 6.2 Estimated Number of Mental health Professionals by County, 2010 (Cont’d.)
County Population All MH
Professionals Social
Workers
Marriage and Family
Therapists
Mental Health
Counselors Other
Professions Sullivan 21,475 2 0 0 2 0 Switzerland 10,613 4 1 0 2 0 Tippecanoe 172,780 154 76 18 38 6 Tipton 15,936 3 1 0 1 0 Union 7,516 0 0 0 0 0 Vanderburgh 179,703 261 132 16 77 9 Vermillion 16,212 8 1 1 6 0 Vigo 107,848 85 40 6 28 3 Wabash 32,888 35 16 2 13 1 Warren 8,508 1 1 0 0 0 Warrick 59,689 25 9 2 11 1 Washington 28,262 12 7 1 4 0 Wayne 68,917 68 31 1 27 1 Wells 27,636 16 6 1 8 0 White 24,643 8 4 0 3 0 Whitley 33,292 10 3 0 4 1
Table 6.3 Estimated Number of Clinical Psychologists by County, 2010 County Population Psychologists Adams 34,387 1 Allen 355,329 65 Bartholomew 76,794 14 Benton 8,854 2 Blackford 12,766 0 Boone 56,640 2 Brown 15,242 2 Carroll 20,155 0 Cass 38,966 2 Clark 110,232 8 Clay 26,890 6 Clinton 33,224 0 Crawford 10,713 0 Daviess 31,648 0 Dearborn 25,740 5 Decatur 42,223 0 DeKalb 50,047 0 Delaware 117,671 35 Dubois 41,889 6
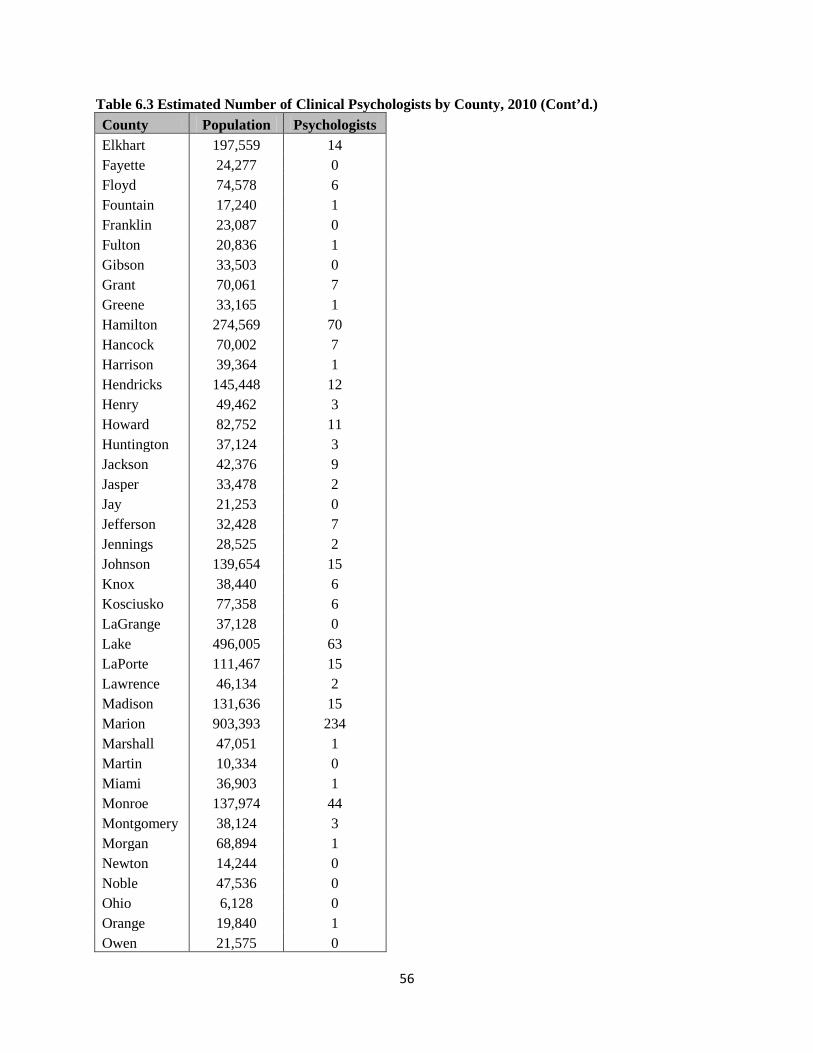
56
Table 6.3 Estimated Number of Clinical Psychologists by County, 2010 (Cont’d.) County Population Psychologists Elkhart 197,559 14 Fayette 24,277 0 Floyd 74,578 6 Fountain 17,240 1 Franklin 23,087 0 Fulton 20,836 1 Gibson 33,503 0 Grant 70,061 7 Greene 33,165 1 Hamilton 274,569 70 Hancock 70,002 7 Harrison 39,364 1 Hendricks 145,448 12 Henry 49,462 3 Howard 82,752 11 Huntington 37,124 3 Jackson 42,376 9 Jasper 33,478 2 Jay 21,253 0 Jefferson 32,428 7 Jennings 28,525 2 Johnson 139,654 15 Knox 38,440 6 Kosciusko 77,358 6 LaGrange 37,128 0 Lake 496,005 63 LaPorte 111,467 15 Lawrence 46,134 2 Madison 131,636 15 Marion 903,393 234 Marshall 47,051 1 Martin 10,334 0 Miami 36,903 1 Monroe 137,974 44 Montgomery 38,124 3 Morgan 68,894 1 Newton 14,244 0 Noble 47,536 0 Ohio 6,128 0 Orange 19,840 1 Owen 21,575 0
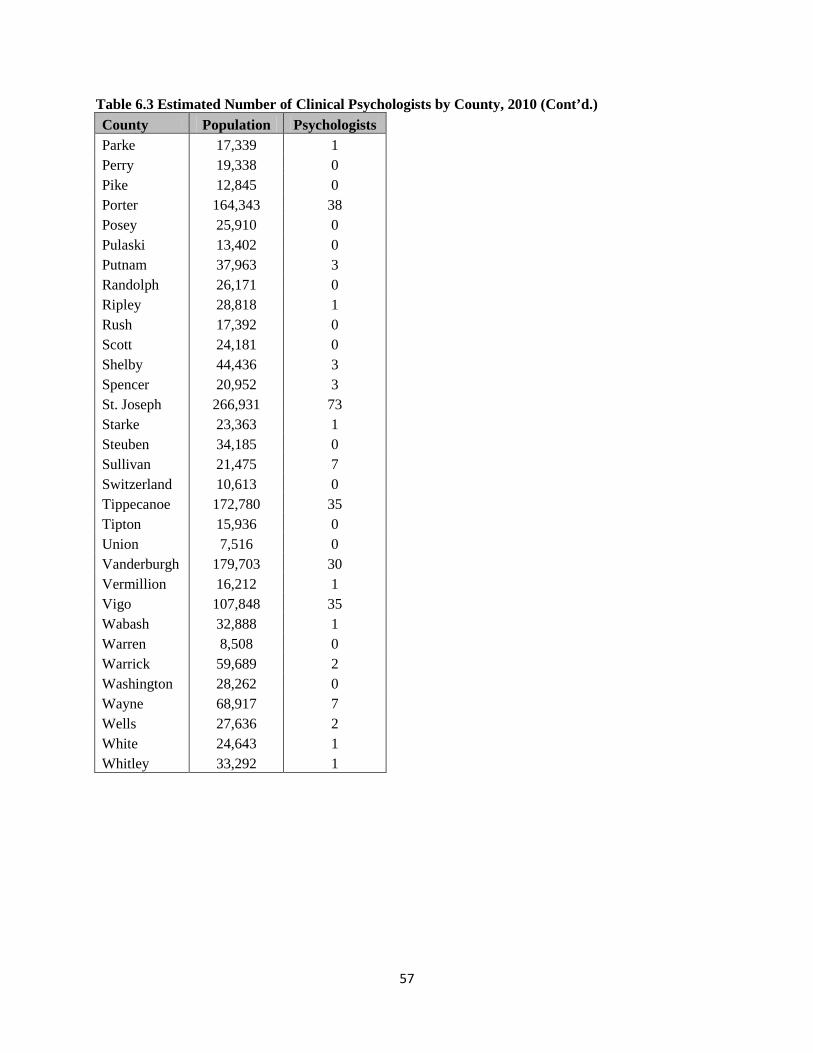
57
Table 6.3 Estimated Number of Clinical Psychologists by County, 2010 (Cont’d.) County Population Psychologists Parke 17,339 1 Perry 19,338 0 Pike 12,845 0 Porter 164,343 38 Posey 25,910 0 Pulaski 13,402 0 Putnam 37,963 3 Randolph 26,171 0 Ripley 28,818 1 Rush 17,392 0 Scott 24,181 0 Shelby 44,436 3 Spencer 20,952 3 St. Joseph 266,931 73 Starke 23,363 1 Steuben 34,185 0 Sullivan 21,475 7 Switzerland 10,613 0 Tippecanoe 172,780 35 Tipton 15,936 0 Union 7,516 0 Vanderburgh 179,703 30 Vermillion 16,212 1 Vigo 107,848 35 Wabash 32,888 1 Warren 8,508 0 Warrick 59,689 2 Washington 28,262 0 Wayne 68,917 7 Wells 27,636 2 White 24,643 1 Whitley 33,292 1
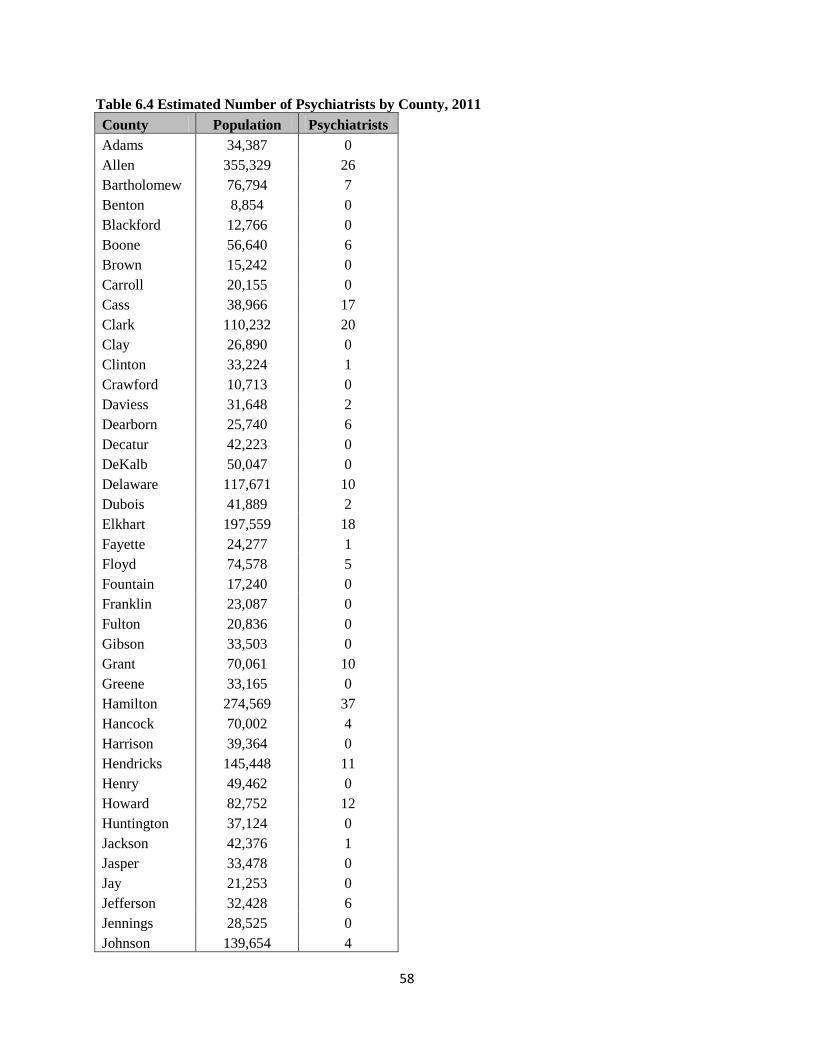
58
Table 6.4 Estimated Number of Psychiatrists by County, 2011 County Population Psychiatrists Adams 34,387 0 Allen 355,329 26 Bartholomew 76,794 7 Benton 8,854 0 Blackford 12,766 0 Boone 56,640 6 Brown 15,242 0 Carroll 20,155 0 Cass 38,966 17 Clark 110,232 20 Clay 26,890 0 Clinton 33,224 1 Crawford 10,713 0 Daviess 31,648 2 Dearborn 25,740 6 Decatur 42,223 0 DeKalb 50,047 0 Delaware 117,671 10 Dubois 41,889 2 Elkhart 197,559 18 Fayette 24,277 1 Floyd 74,578 5 Fountain 17,240 0 Franklin 23,087 0 Fulton 20,836 0 Gibson 33,503 0 Grant 70,061 10 Greene 33,165 0 Hamilton 274,569 37 Hancock 70,002 4 Harrison 39,364 0 Hendricks 145,448 11 Henry 49,462 0 Howard 82,752 12 Huntington 37,124 0 Jackson 42,376 1 Jasper 33,478 0 Jay 21,253 0 Jefferson 32,428 6 Jennings 28,525 0 Johnson 139,654 4
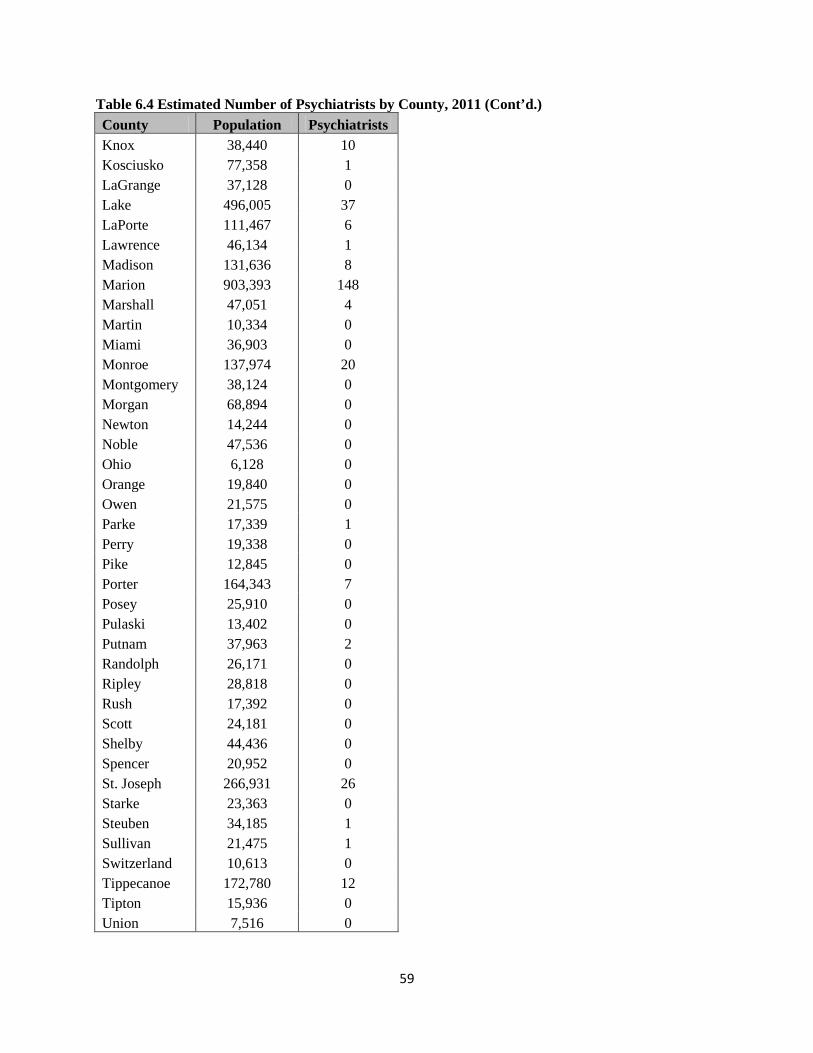
59
Table 6.4 Estimated Number of Psychiatrists by County, 2011 (Cont’d.) County Population Psychiatrists Knox 38,440 10 Kosciusko 77,358 1 LaGrange 37,128 0 Lake 496,005 37 LaPorte 111,467 6 Lawrence 46,134 1 Madison 131,636 8 Marion 903,393 148 Marshall 47,051 4 Martin 10,334 0 Miami 36,903 0 Monroe 137,974 20 Montgomery 38,124 0 Morgan 68,894 0 Newton 14,244 0 Noble 47,536 0 Ohio 6,128 0 Orange 19,840 0 Owen 21,575 0 Parke 17,339 1 Perry 19,338 0 Pike 12,845 0 Porter 164,343 7 Posey 25,910 0 Pulaski 13,402 0 Putnam 37,963 2 Randolph 26,171 0 Ripley 28,818 0 Rush 17,392 0 Scott 24,181 0 Shelby 44,436 0 Spencer 20,952 0 St. Joseph 266,931 26 Starke 23,363 0 Steuben 34,185 1 Sullivan 21,475 1 Switzerland 10,613 0 Tippecanoe 172,780 12 Tipton 15,936 0 Union 7,516 0
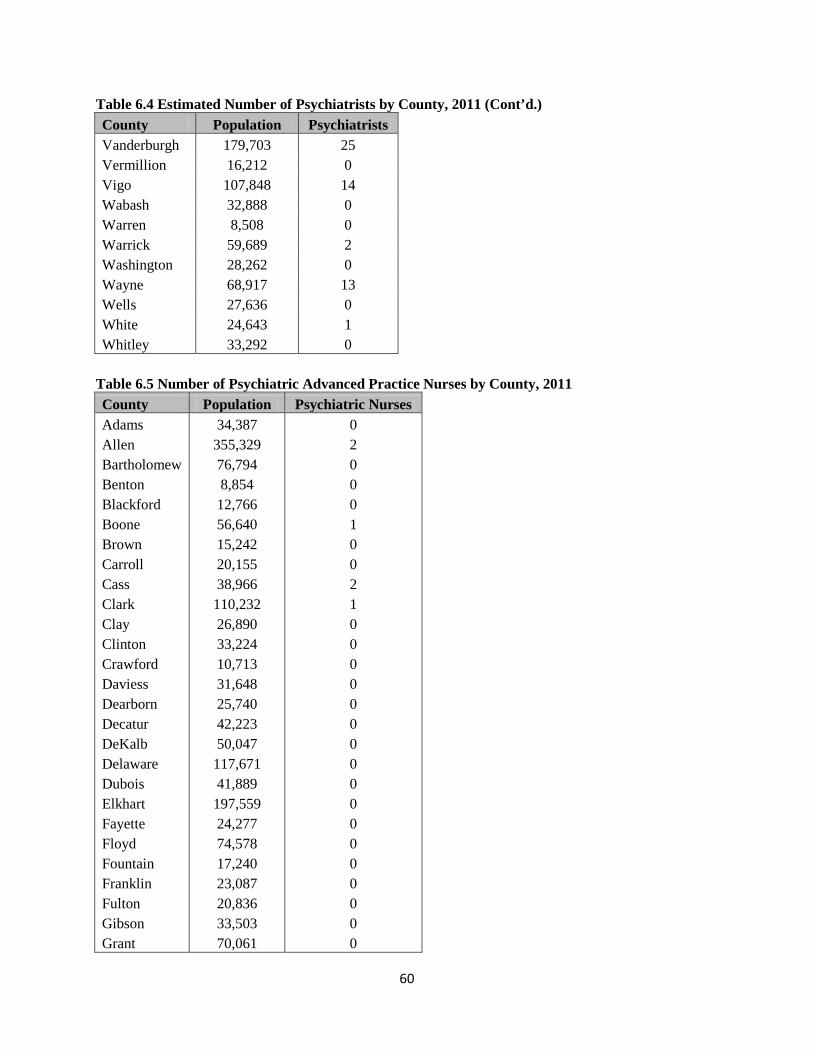
60
Table 6.4 Estimated Number of Psychiatrists by County, 2011 (Cont’d.) County Population Psychiatrists Vanderburgh 179,703 25 Vermillion 16,212 0 Vigo 107,848 14 Wabash 32,888 0 Warren 8,508 0 Warrick 59,689 2 Washington 28,262 0 Wayne 68,917 13 Wells 27,636 0 White 24,643 1 Whitley 33,292 0
Table 6.5 Number of Psychiatric Advanced Practice Nurses by County, 2011 County Population Psychiatric Nurses Adams 34,387 0 Allen 355,329 2 Bartholomew 76,794 0 Benton 8,854 0 Blackford 12,766 0 Boone 56,640 1 Brown 15,242 0 Carroll 20,155 0 Cass 38,966 2 Clark 110,232 1 Clay 26,890 0 Clinton 33,224 0 Crawford 10,713 0 Daviess 31,648 0 Dearborn 25,740 0 Decatur 42,223 0 DeKalb 50,047 0 Delaware 117,671 0 Dubois 41,889 0 Elkhart 197,559 0 Fayette 24,277 0 Floyd 74,578 0 Fountain 17,240 0 Franklin 23,087 0 Fulton 20,836 0 Gibson 33,503 0 Grant 70,061 0
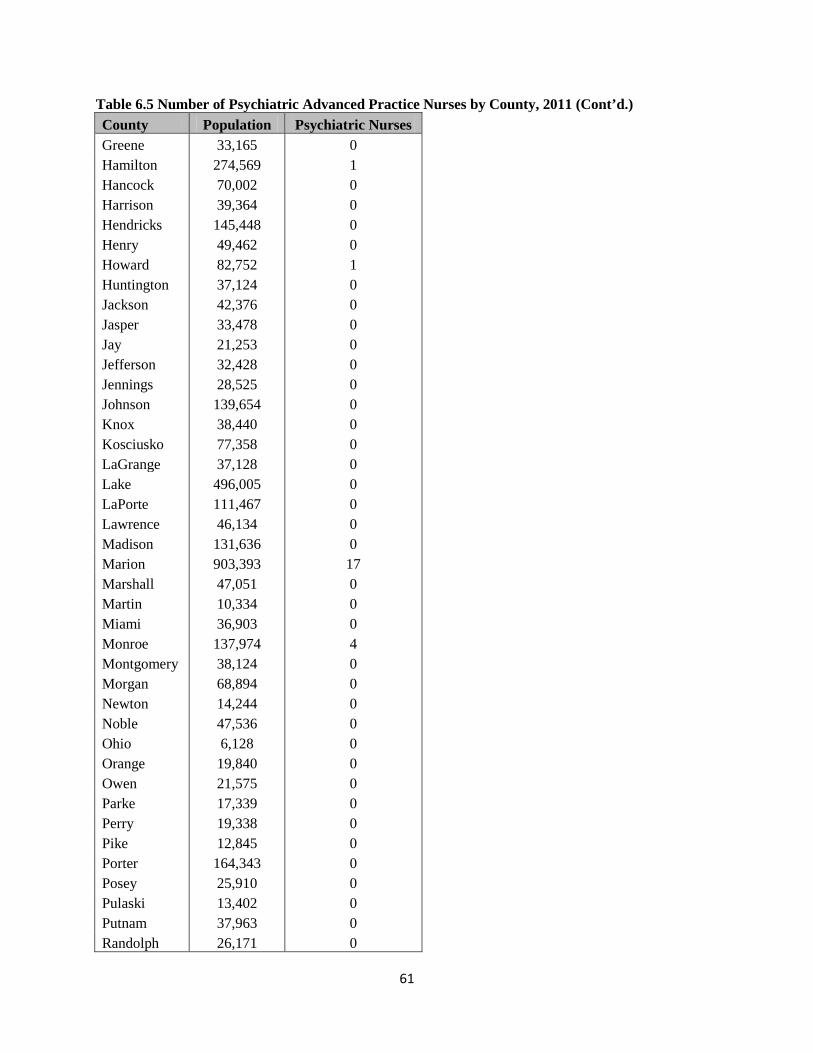
61
Table 6.5 Number of Psychiatric Advanced Practice Nurses by County, 2011 (Cont’d.) County Population Psychiatric Nurses Greene 33,165 0 Hamilton 274,569 1 Hancock 70,002 0 Harrison 39,364 0 Hendricks 145,448 0 Henry 49,462 0 Howard 82,752 1 Huntington 37,124 0 Jackson 42,376 0 Jasper 33,478 0 Jay 21,253 0 Jefferson 32,428 0 Jennings 28,525 0 Johnson 139,654 0 Knox 38,440 0 Kosciusko 77,358 0 LaGrange 37,128 0 Lake 496,005 0 LaPorte 111,467 0 Lawrence 46,134 0 Madison 131,636 0 Marion 903,393 17 Marshall 47,051 0 Martin 10,334 0 Miami 36,903 0 Monroe 137,974 4 Montgomery 38,124 0 Morgan 68,894 0 Newton 14,244 0 Noble 47,536 0 Ohio 6,128 0 Orange 19,840 0 Owen 21,575 0 Parke 17,339 0 Perry 19,338 0 Pike 12,845 0 Porter 164,343 0 Posey 25,910 0 Pulaski 13,402 0 Putnam 37,963 0 Randolph 26,171 0
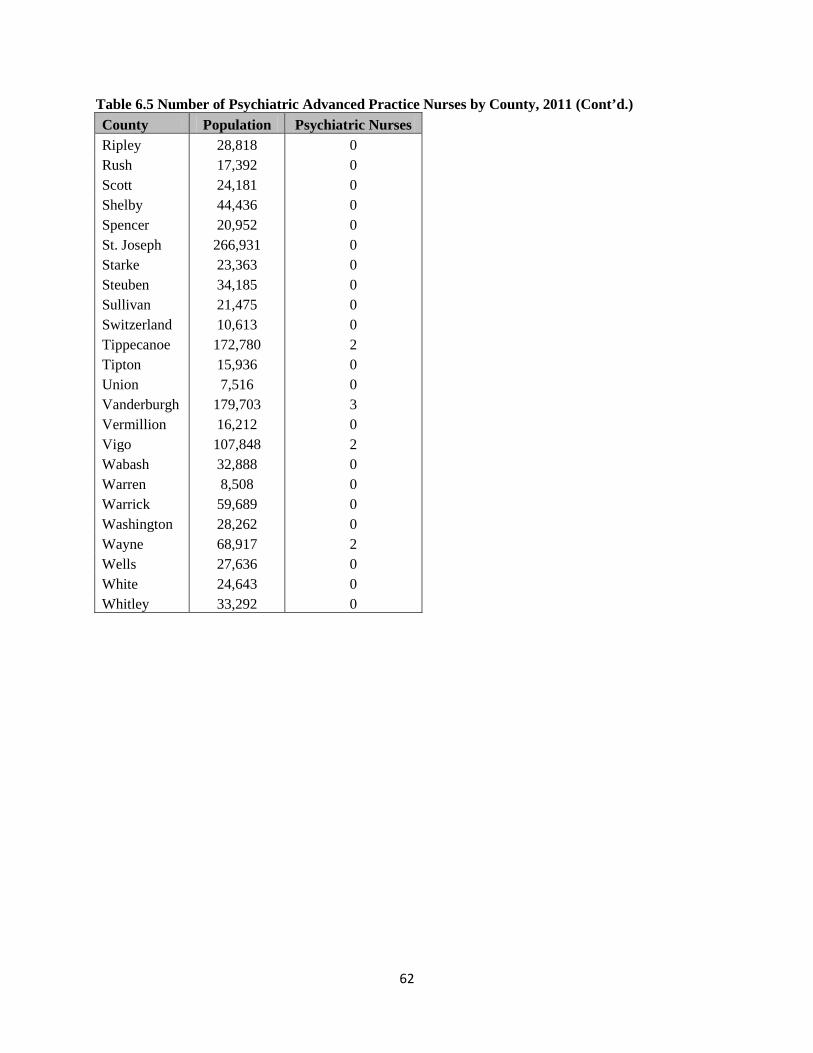
62
Table 6.5 Number of Psychiatric Advanced Practice Nurses by County, 2011 (Cont’d.) County Population Psychiatric Nurses Ripley 28,818 0 Rush 17,392 0 Scott 24,181 0 Shelby 44,436 0 Spencer 20,952 0 St. Joseph 266,931 0 Starke 23,363 0 Steuben 34,185 0 Sullivan 21,475 0 Switzerland 10,613 0 Tippecanoe 172,780 2 Tipton 15,936 0 Union 7,516 0 Vanderburgh 179,703 3 Vermillion 16,212 0 Vigo 107,848 2 Wabash 32,888 0 Warren 8,508 0 Warrick 59,689 0 Washington 28,262 0 Wayne 68,917 2 Wells 27,636 0 White 24,643 0 Whitley 33,292 0
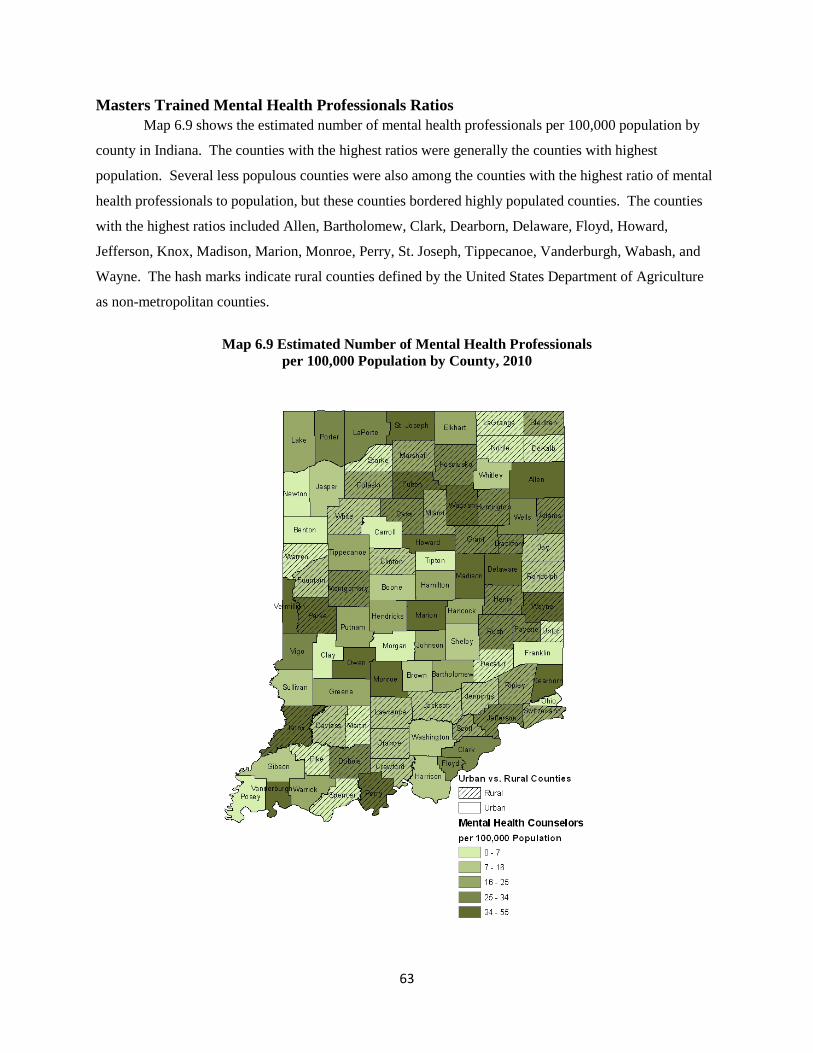
63
Masters Trained Mental Health Professionals Ratios Map 6.9 shows the estimated number of mental health professionals per 100,000 population by
county in Indiana. The counties with the highest ratios were generally the counties with highest
population. Several less populous counties were also among the counties with the highest ratio of mental
health professionals to population, but these counties bordered highly populated counties. The counties
with the highest ratios included Allen, Bartholomew, Clark, Dearborn, Delaware, Floyd, Howard,
Jefferson, Knox, Madison, Marion, Monroe, Perry, St. Joseph, Tippecanoe, Vanderburgh, Wabash, and
Wayne. The hash marks indicate rural counties defined by the United States Department of Agriculture
as non-metropolitan counties.
Map 6.9 Estimated Number of Mental Health Professionals
per 100,000 Population by County, 2010
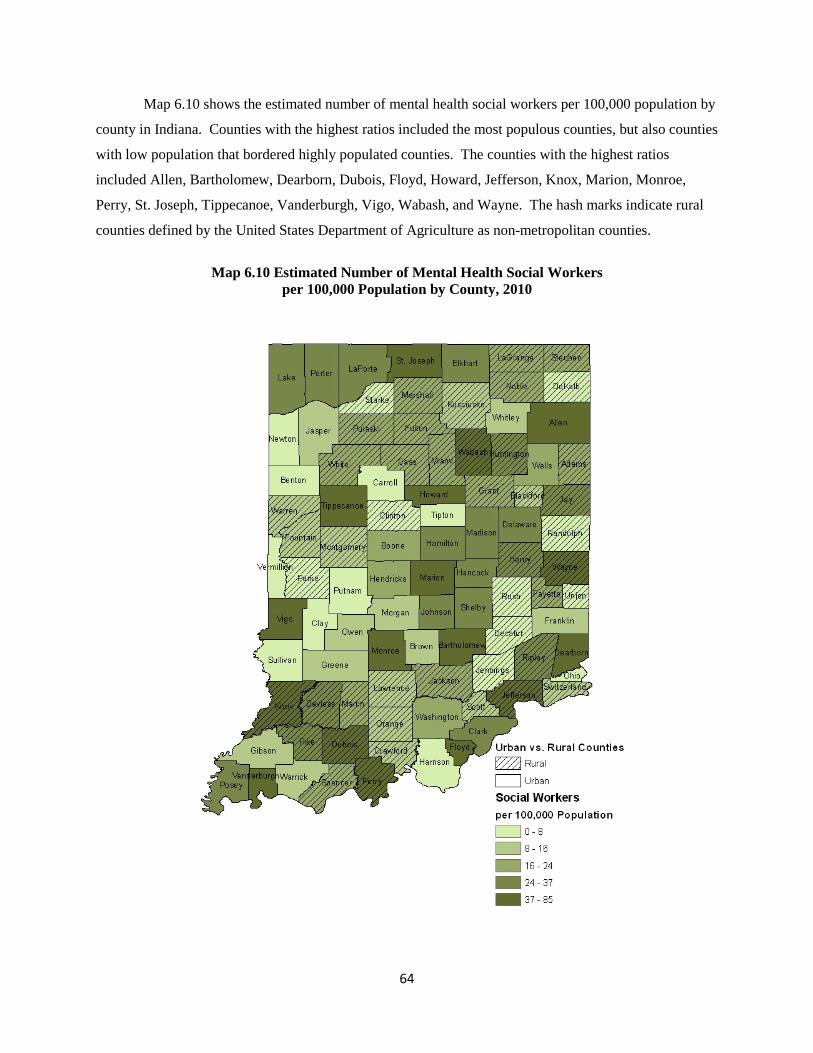
64
Map 6.10 shows the estimated number of mental health social workers per 100,000 population by
county in Indiana. Counties with the highest ratios included the most populous counties, but also counties
with low population that bordered highly populated counties. The counties with the highest ratios
included Allen, Bartholomew, Dearborn, Dubois, Floyd, Howard, Jefferson, Knox, Marion, Monroe,
Perry, St. Joseph, Tippecanoe, Vanderburgh, Vigo, Wabash, and Wayne. The hash marks indicate rural
counties defined by the United States Department of Agriculture as non-metropolitan counties.
Map 6.10 Estimated Number of Mental Health Social Workers
per 100,000 Population by County, 2010
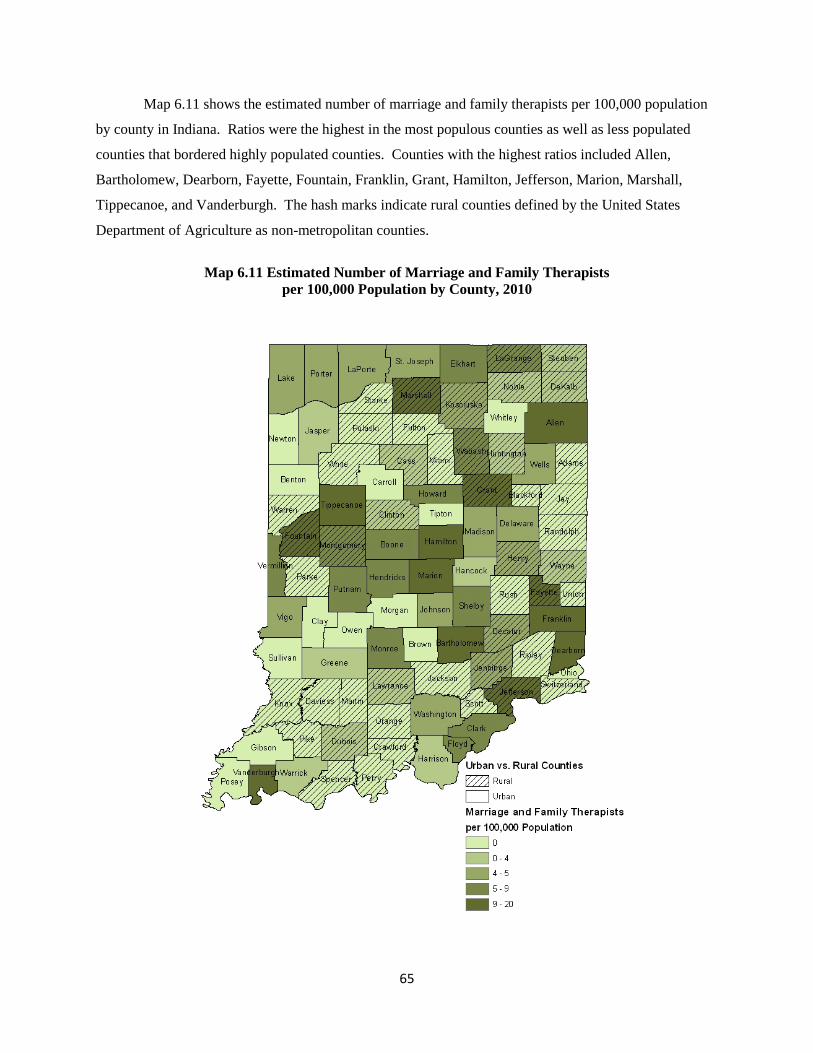
65
Map 6.11 shows the estimated number of marriage and family therapists per 100,000 population
by county in Indiana. Ratios were the highest in the most populous counties as well as less populated
counties that bordered highly populated counties. Counties with the highest ratios included Allen,
Bartholomew, Dearborn, Fayette, Fountain, Franklin, Grant, Hamilton, Jefferson, Marion, Marshall,
Tippecanoe, and Vanderburgh. The hash marks indicate rural counties defined by the United States
Department of Agriculture as non-metropolitan counties.
Map 6.11 Estimated Number of Marriage and Family Therapists
per 100,000 Population by County, 2010
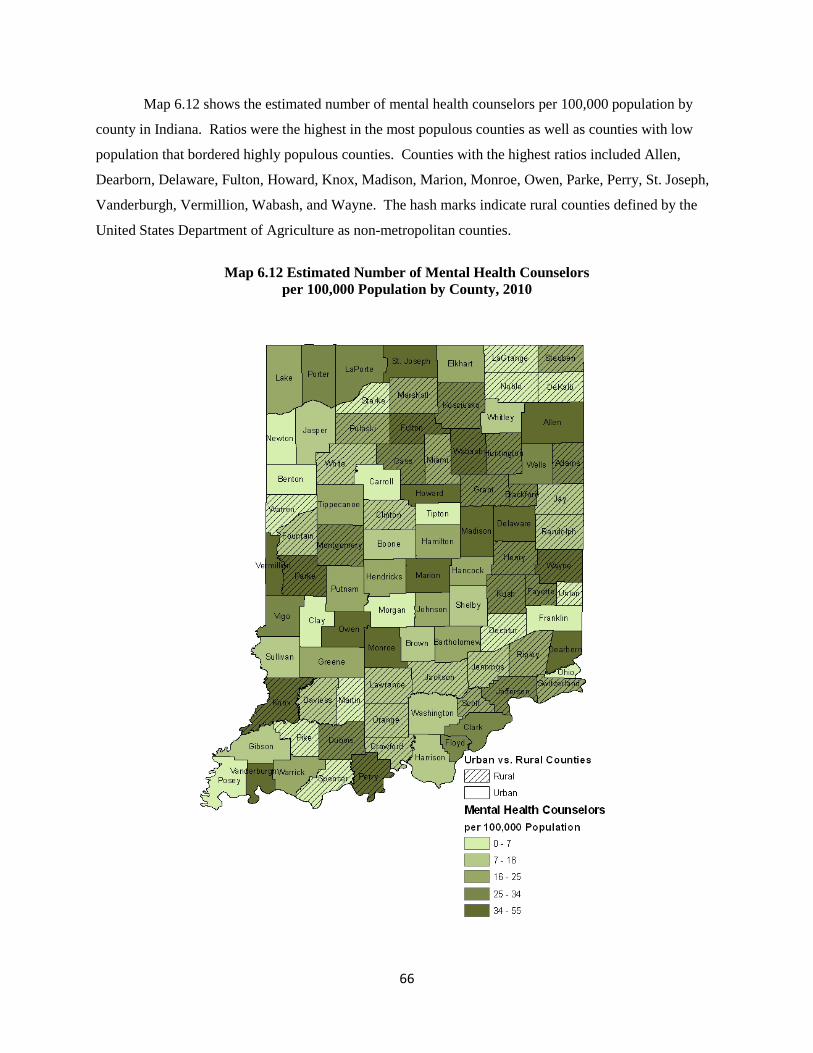
66
Map 6.12 shows the estimated number of mental health counselors per 100,000 population by
county in Indiana. Ratios were the highest in the most populous counties as well as counties with low
population that bordered highly populous counties. Counties with the highest ratios included Allen,
Dearborn, Delaware, Fulton, Howard, Knox, Madison, Marion, Monroe, Owen, Parke, Perry, St. Joseph,
Vanderburgh, Vermillion, Wabash, and Wayne. The hash marks indicate rural counties defined by the
United States Department of Agriculture as non-metropolitan counties.
Map 6.12 Estimated Number of Mental Health Counselors
per 100,000 Population by County, 2010
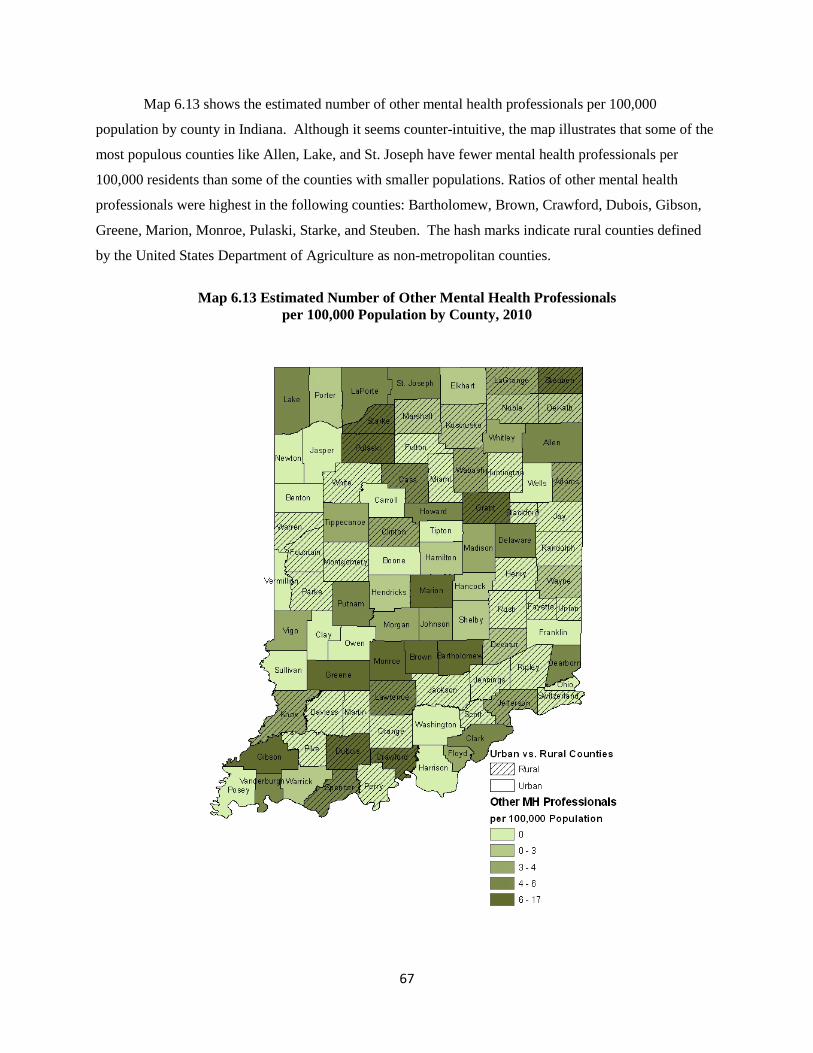
67
Map 6.13 shows the estimated number of other mental health professionals per 100,000
population by county in Indiana. Although it seems counter-intuitive, the map illustrates that some of the
most populous counties like Allen, Lake, and St. Joseph have fewer mental health professionals per
100,000 residents than some of the counties with smaller populations. Ratios of other mental health
professionals were highest in the following counties: Bartholomew, Brown, Crawford, Dubois, Gibson,
Greene, Marion, Monroe, Pulaski, Starke, and Steuben. The hash marks indicate rural counties defined
by the United States Department of Agriculture as non-metropolitan counties.
Map 6.13 Estimated Number of Other Mental Health Professionals
per 100,000 Population by County, 2010
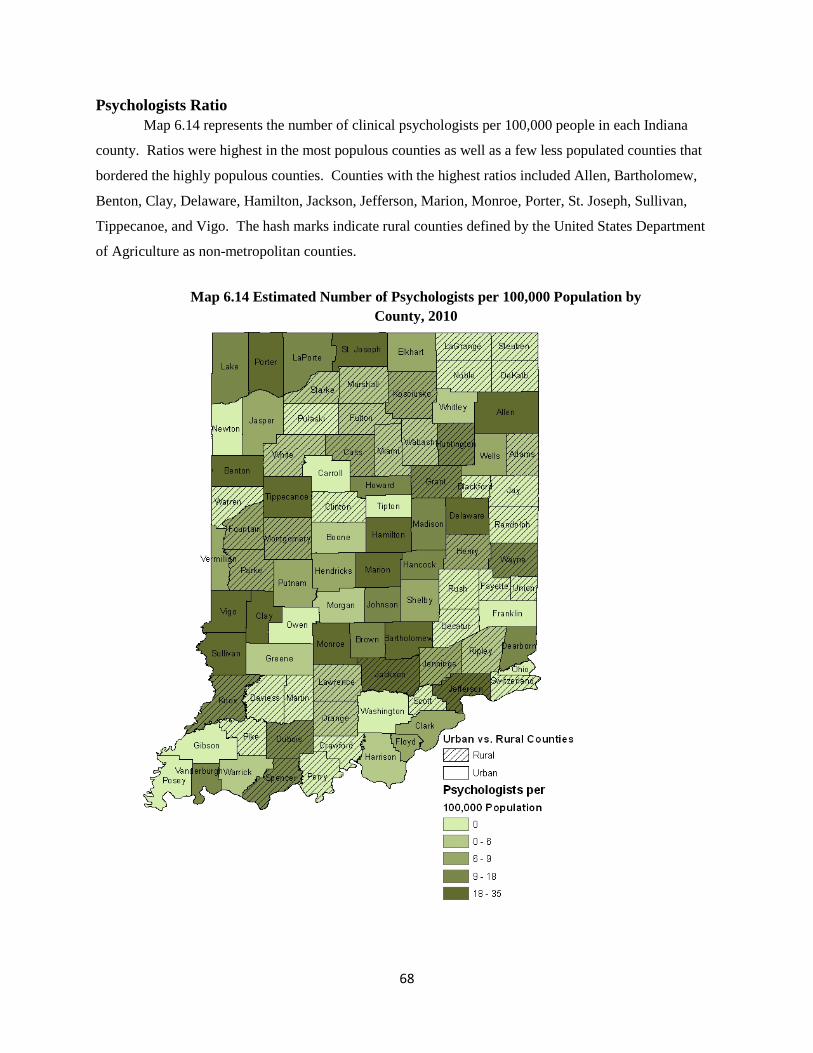
68
Psychologists Ratio Map 6.14 represents the number of clinical psychologists per 100,000 people in each Indiana
county. Ratios were highest in the most populous counties as well as a few less populated counties that
bordered the highly populous counties. Counties with the highest ratios included Allen, Bartholomew,
Benton, Clay, Delaware, Hamilton, Jackson, Jefferson, Marion, Monroe, Porter, St. Joseph, Sullivan,
Tippecanoe, and Vigo. The hash marks indicate rural counties defined by the United States Department
of Agriculture as non-metropolitan counties.
Map 6.14 Estimated Number of Psychologists per 100,000 Population by County, 2010
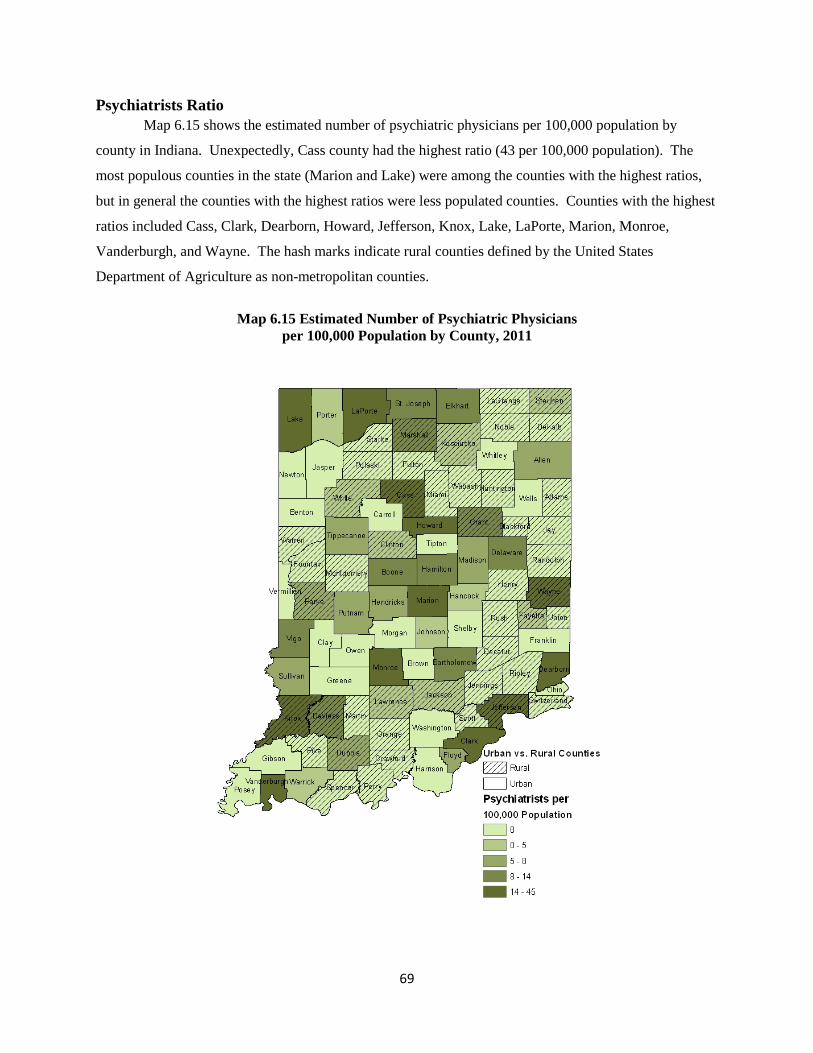
69
Psychiatrists Ratio Map 6.15 shows the estimated number of psychiatric physicians per 100,000 population by
county in Indiana. Unexpectedly, Cass county had the highest ratio (43 per 100,000 population). The
most populous counties in the state (Marion and Lake) were among the counties with the highest ratios,
but in general the counties with the highest ratios were less populated counties. Counties with the highest
ratios included Cass, Clark, Dearborn, Howard, Jefferson, Knox, Lake, LaPorte, Marion, Monroe,
Vanderburgh, and Wayne. The hash marks indicate rural counties defined by the United States
Department of Agriculture as non-metropolitan counties.
Map 6.15 Estimated Number of Psychiatric Physicians
per 100,000 Population by County, 2011
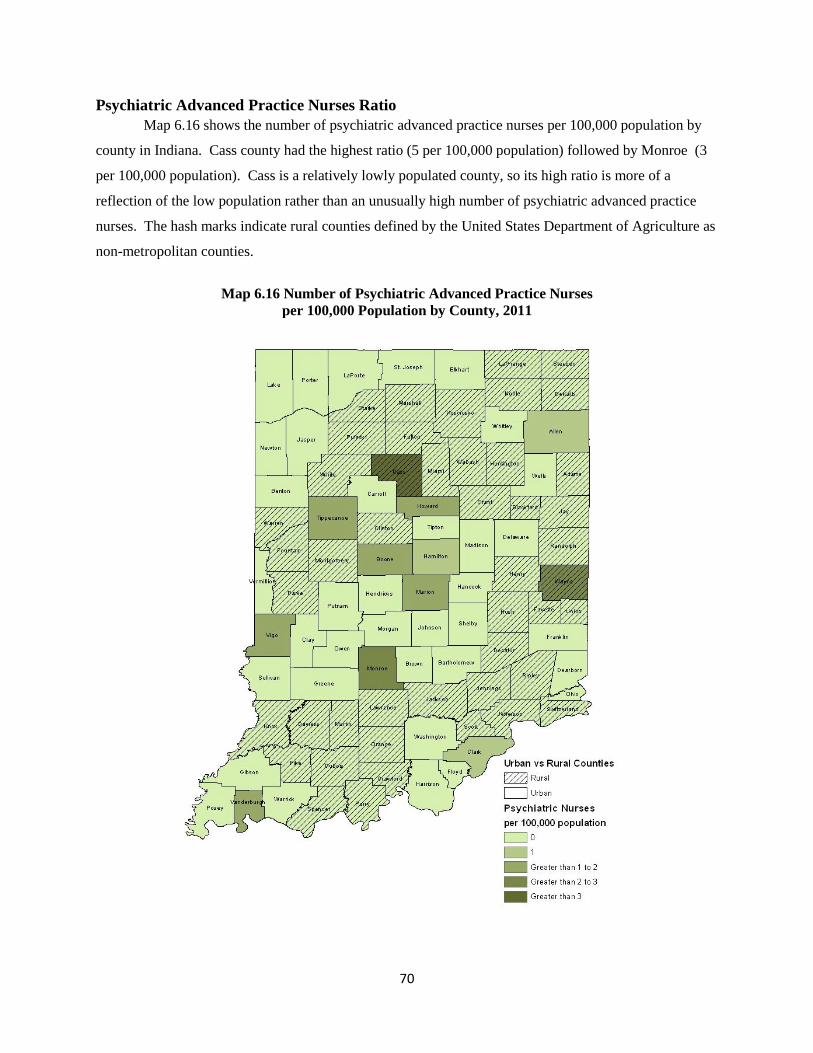
70
Psychiatric Advanced Practice Nurses Ratio Map 6.16 shows the number of psychiatric advanced practice nurses per 100,000 population by
county in Indiana. Cass county had the highest ratio (5 per 100,000 population) followed by Monroe (3
per 100,000 population). Cass is a relatively lowly populated county, so its high ratio is more of a
reflection of the low population rather than an unusually high number of psychiatric advanced practice
nurses. The hash marks indicate rural counties defined by the United States Department of Agriculture as
non-metropolitan counties.
Map 6.16 Number of Psychiatric Advanced Practice Nurses
per 100,000 Population by County, 2011
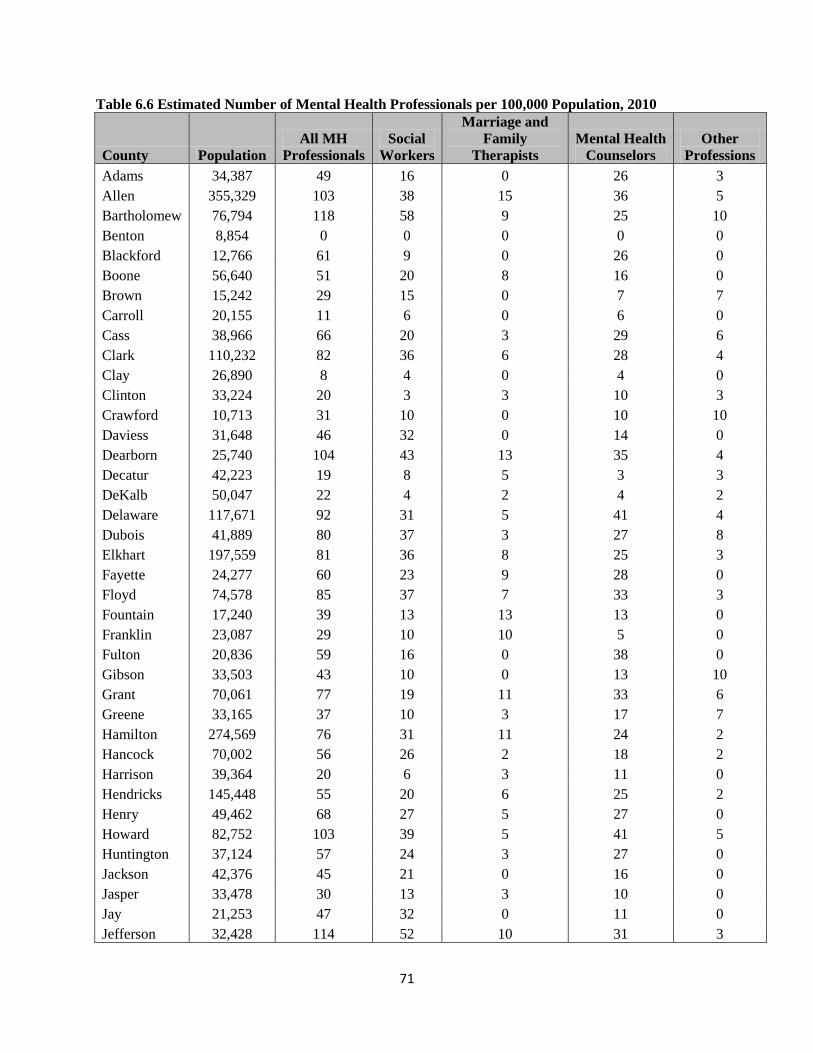
71
Table 6.6 Estimated Number of Mental Health Professionals per 100,000 Population, 2010
County Population All MH
Professionals Social
Workers
Marriage and Family
Therapists Mental Health
Counselors Other
Professions Adams 34,387 49 16 0 26 3 Allen 355,329 103 38 15 36 5 Bartholomew 76,794 118 58 9 25 10 Benton 8,854 0 0 0 0 0 Blackford 12,766 61 9 0 26 0 Boone 56,640 51 20 8 16 0 Brown 15,242 29 15 0 7 7 Carroll 20,155 11 6 0 6 0 Cass 38,966 66 20 3 29 6 Clark 110,232 82 36 6 28 4 Clay 26,890 8 4 0 4 0 Clinton 33,224 20 3 3 10 3 Crawford 10,713 31 10 0 10 10 Daviess 31,648 46 32 0 14 0 Dearborn 25,740 104 43 13 35 4 Decatur 42,223 19 8 5 3 3 DeKalb 50,047 22 4 2 4 2 Delaware 117,671 92 31 5 41 4 Dubois 41,889 80 37 3 27 8 Elkhart 197,559 81 36 8 25 3 Fayette 24,277 60 23 9 28 0 Floyd 74,578 85 37 7 33 3 Fountain 17,240 39 13 13 13 0 Franklin 23,087 29 10 10 5 0 Fulton 20,836 59 16 0 38 0 Gibson 33,503 43 10 0 13 10 Grant 70,061 77 19 11 33 6 Greene 33,165 37 10 3 17 7 Hamilton 274,569 76 31 11 24 2 Hancock 70,002 56 26 2 18 2 Harrison 39,364 20 6 3 11 0 Hendricks 145,448 55 20 6 25 2 Henry 49,462 68 27 5 27 0 Howard 82,752 103 39 5 41 5 Huntington 37,124 57 24 3 27 0 Jackson 42,376 45 21 0 16 0 Jasper 33,478 30 13 3 10 0 Jay 21,253 47 32 0 11 0 Jefferson 32,428 114 52 10 31 3
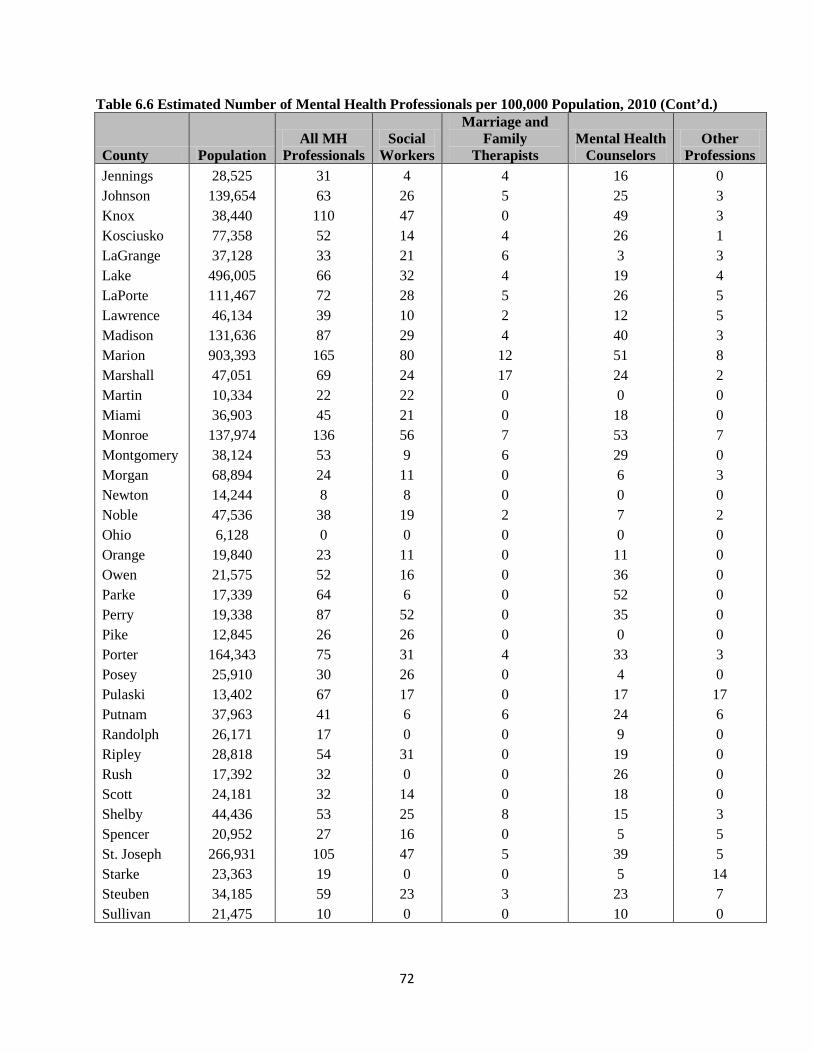
72
Table 6.6 Estimated Number of Mental Health Professionals per 100,000 Population, 2010 (Cont’d.)
County Population All MH
Professionals Social
Workers
Marriage and Family
Therapists Mental Health
Counselors Other
Professions Jennings 28,525 31 4 4 16 0 Johnson 139,654 63 26 5 25 3 Knox 38,440 110 47 0 49 3 Kosciusko 77,358 52 14 4 26 1 LaGrange 37,128 33 21 6 3 3 Lake 496,005 66 32 4 19 4 LaPorte 111,467 72 28 5 26 5 Lawrence 46,134 39 10 2 12 5 Madison 131,636 87 29 4 40 3 Marion 903,393 165 80 12 51 8 Marshall 47,051 69 24 17 24 2 Martin 10,334 22 22 0 0 0 Miami 36,903 45 21 0 18 0 Monroe 137,974 136 56 7 53 7 Montgomery 38,124 53 9 6 29 0 Morgan 68,894 24 11 0 6 3 Newton 14,244 8 8 0 0 0 Noble 47,536 38 19 2 7 2 Ohio 6,128 0 0 0 0 0 Orange 19,840 23 11 0 11 0 Owen 21,575 52 16 0 36 0 Parke 17,339 64 6 0 52 0 Perry 19,338 87 52 0 35 0 Pike 12,845 26 26 0 0 0 Porter 164,343 75 31 4 33 3 Posey 25,910 30 26 0 4 0 Pulaski 13,402 67 17 0 17 17 Putnam 37,963 41 6 6 24 6 Randolph 26,171 17 0 0 9 0 Ripley 28,818 54 31 0 19 0 Rush 17,392 32 0 0 26 0 Scott 24,181 32 14 0 18 0 Shelby 44,436 53 25 8 15 3 Spencer 20,952 27 16 0 5 5 St. Joseph 266,931 105 47 5 39 5 Starke 23,363 19 0 0 5 14 Steuben 34,185 59 23 3 23 7 Sullivan 21,475 10 0 0 10 0
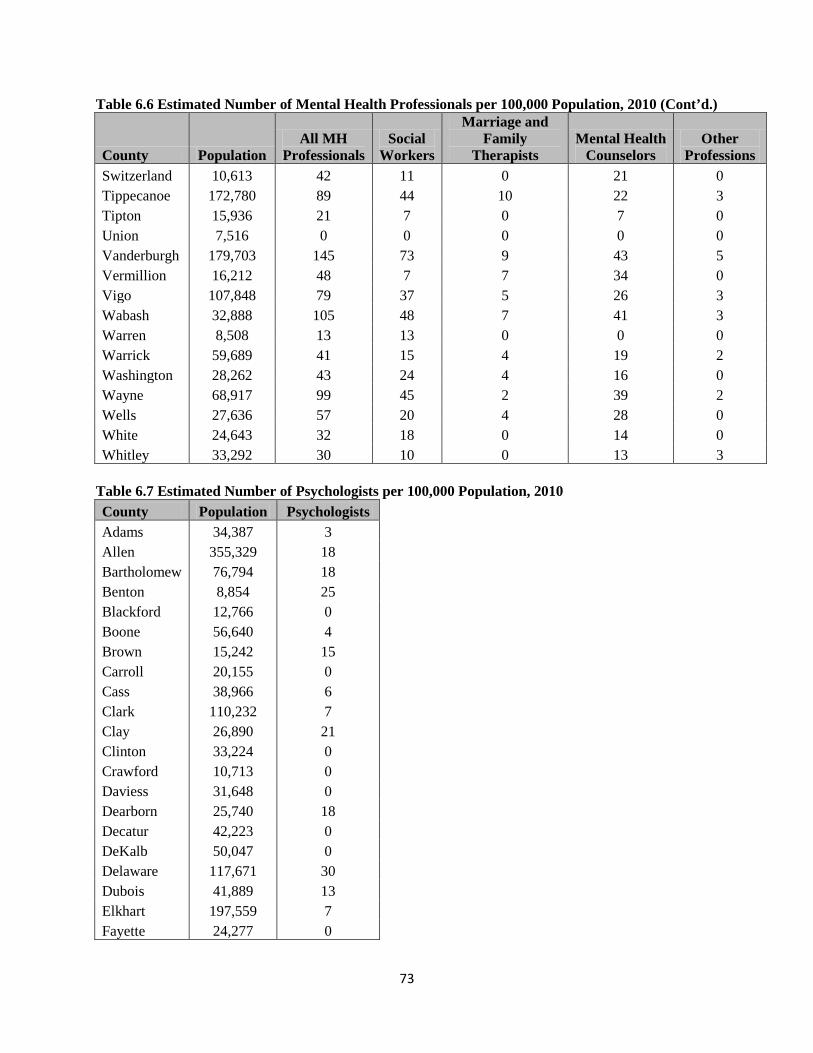
73
Table 6.6 Estimated Number of Mental Health Professionals per 100,000 Population, 2010 (Cont’d.)
County Population All MH
Professionals Social
Workers
Marriage and Family
Therapists Mental Health
Counselors Other
Professions Switzerland 10,613 42 11 0 21 0 Tippecanoe 172,780 89 44 10 22 3 Tipton 15,936 21 7 0 7 0 Union 7,516 0 0 0 0 0 Vanderburgh 179,703 145 73 9 43 5 Vermillion 16,212 48 7 7 34 0 Vigo 107,848 79 37 5 26 3 Wabash 32,888 105 48 7 41 3 Warren 8,508 13 13 0 0 0 Warrick 59,689 41 15 4 19 2 Washington 28,262 43 24 4 16 0 Wayne 68,917 99 45 2 39 2 Wells 27,636 57 20 4 28 0 White 24,643 32 18 0 14 0 Whitley 33,292 30 10 0 13 3
Table 6.7 Estimated Number of Psychologists per 100,000 Population, 2010 County Population Psychologists Adams 34,387 3 Allen 355,329 18 Bartholomew 76,794 18 Benton 8,854 25 Blackford 12,766 0 Boone 56,640 4 Brown 15,242 15 Carroll 20,155 0 Cass 38,966 6 Clark 110,232 7 Clay 26,890 21 Clinton 33,224 0 Crawford 10,713 0 Daviess 31,648 0 Dearborn 25,740 18 Decatur 42,223 0 DeKalb 50,047 0 Delaware 117,671 30 Dubois 41,889 13 Elkhart 197,559 7 Fayette 24,277 0
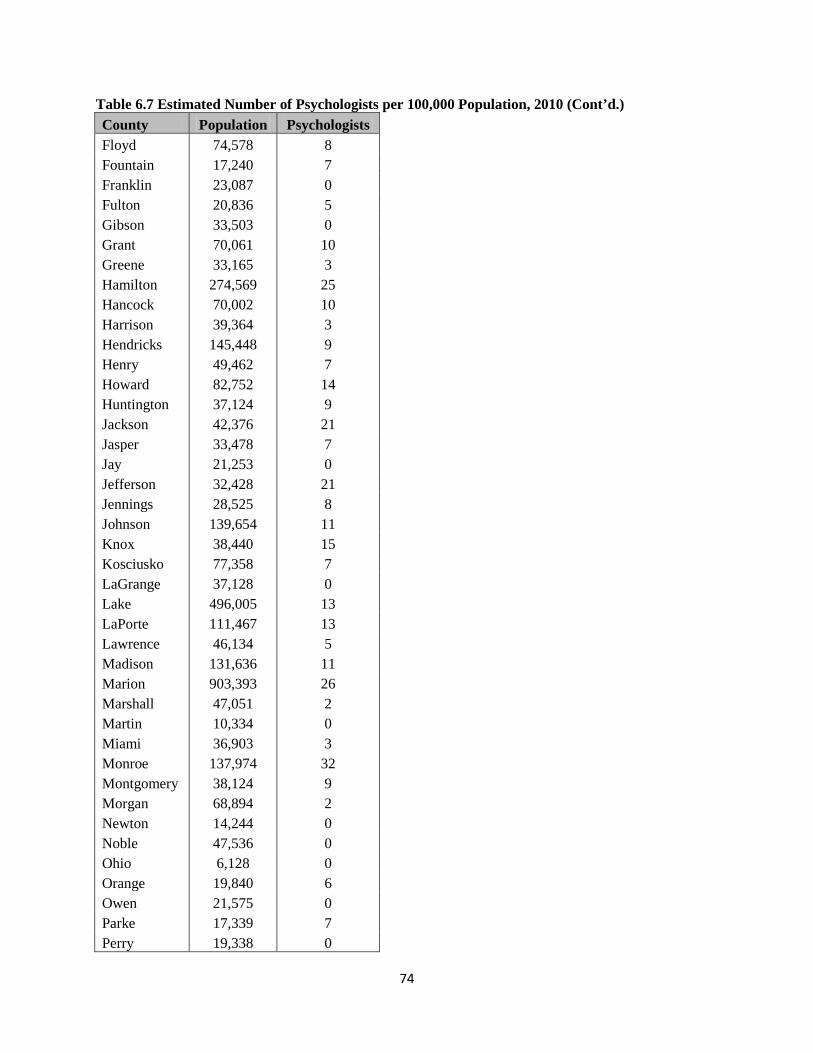
74
Table 6.7 Estimated Number of Psychologists per 100,000 Population, 2010 (Cont’d.) County Population Psychologists Floyd 74,578 8 Fountain 17,240 7 Franklin 23,087 0 Fulton 20,836 5 Gibson 33,503 0 Grant 70,061 10 Greene 33,165 3 Hamilton 274,569 25 Hancock 70,002 10 Harrison 39,364 3 Hendricks 145,448 9 Henry 49,462 7 Howard 82,752 14 Huntington 37,124 9 Jackson 42,376 21 Jasper 33,478 7 Jay 21,253 0 Jefferson 32,428 21 Jennings 28,525 8 Johnson 139,654 11 Knox 38,440 15 Kosciusko 77,358 7 LaGrange 37,128 0 Lake 496,005 13 LaPorte 111,467 13 Lawrence 46,134 5 Madison 131,636 11 Marion 903,393 26 Marshall 47,051 2 Martin 10,334 0 Miami 36,903 3 Monroe 137,974 32 Montgomery 38,124 9 Morgan 68,894 2 Newton 14,244 0 Noble 47,536 0 Ohio 6,128 0 Orange 19,840 6 Owen 21,575 0 Parke 17,339 7 Perry 19,338 0
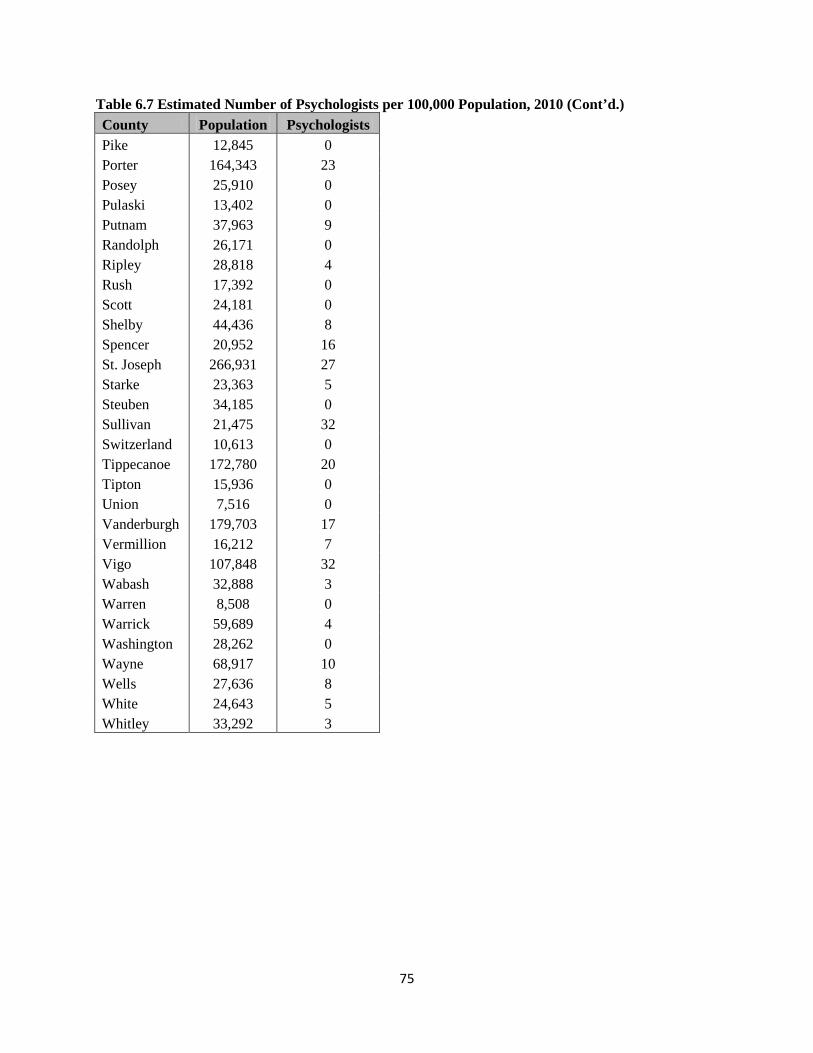
75
Table 6.7 Estimated Number of Psychologists per 100,000 Population, 2010 (Cont’d.) County Population Psychologists Pike 12,845 0 Porter 164,343 23 Posey 25,910 0 Pulaski 13,402 0 Putnam 37,963 9 Randolph 26,171 0 Ripley 28,818 4 Rush 17,392 0 Scott 24,181 0 Shelby 44,436 8 Spencer 20,952 16 St. Joseph 266,931 27 Starke 23,363 5 Steuben 34,185 0 Sullivan 21,475 32 Switzerland 10,613 0 Tippecanoe 172,780 20 Tipton 15,936 0 Union 7,516 0 Vanderburgh 179,703 17 Vermillion 16,212 7 Vigo 107,848 32 Wabash 32,888 3 Warren 8,508 0 Warrick 59,689 4 Washington 28,262 0 Wayne 68,917 10 Wells 27,636 8 White 24,643 5 Whitley 33,292 3
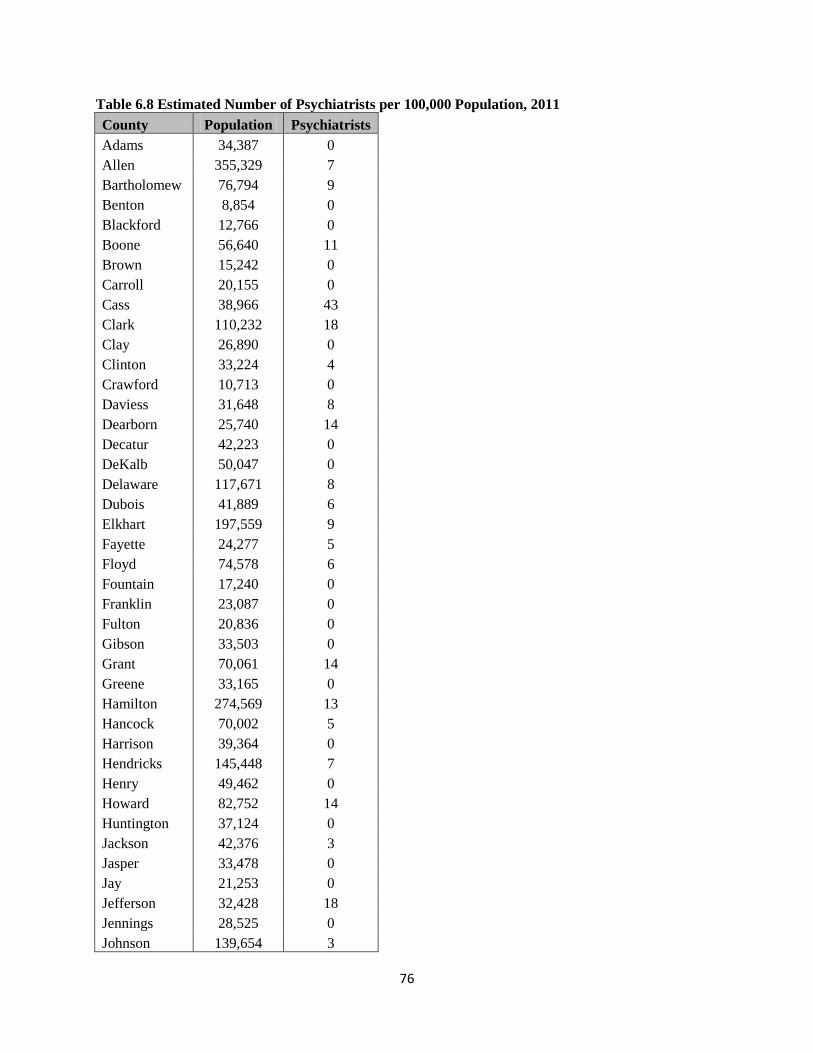
76
Table 6.8 Estimated Number of Psychiatrists per 100,000 Population, 2011 County Population Psychiatrists Adams 34,387 0 Allen 355,329 7 Bartholomew 76,794 9 Benton 8,854 0 Blackford 12,766 0 Boone 56,640 11 Brown 15,242 0 Carroll 20,155 0 Cass 38,966 43 Clark 110,232 18 Clay 26,890 0 Clinton 33,224 4 Crawford 10,713 0 Daviess 31,648 8 Dearborn 25,740 14 Decatur 42,223 0 DeKalb 50,047 0 Delaware 117,671 8 Dubois 41,889 6 Elkhart 197,559 9 Fayette 24,277 5 Floyd 74,578 6 Fountain 17,240 0 Franklin 23,087 0 Fulton 20,836 0 Gibson 33,503 0 Grant 70,061 14 Greene 33,165 0 Hamilton 274,569 13 Hancock 70,002 5 Harrison 39,364 0 Hendricks 145,448 7 Henry 49,462 0 Howard 82,752 14 Huntington 37,124 0 Jackson 42,376 3 Jasper 33,478 0 Jay 21,253 0 Jefferson 32,428 18 Jennings 28,525 0 Johnson 139,654 3
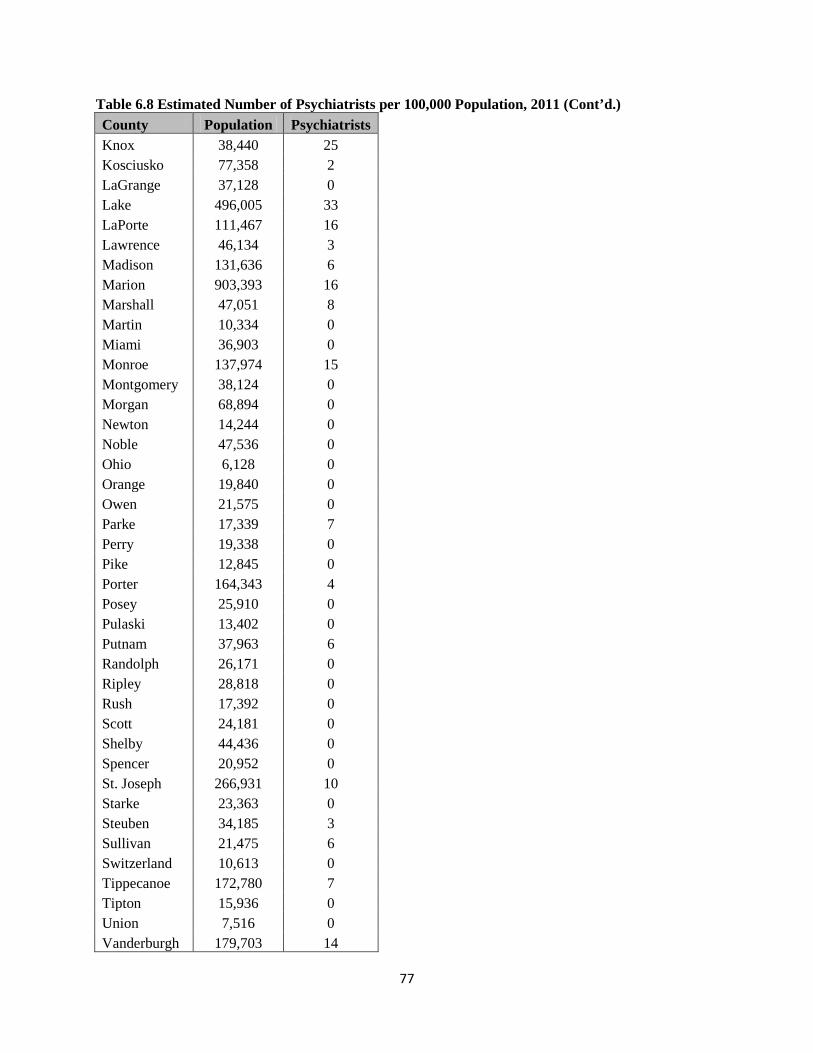
77
Table 6.8 Estimated Number of Psychiatrists per 100,000 Population, 2011 (Cont’d.) County Population Psychiatrists Knox 38,440 25 Kosciusko 77,358 2 LaGrange 37,128 0 Lake 496,005 33 LaPorte 111,467 16 Lawrence 46,134 3 Madison 131,636 6 Marion 903,393 16 Marshall 47,051 8 Martin 10,334 0 Miami 36,903 0 Monroe 137,974 15 Montgomery 38,124 0 Morgan 68,894 0 Newton 14,244 0 Noble 47,536 0 Ohio 6,128 0 Orange 19,840 0 Owen 21,575 0 Parke 17,339 7 Perry 19,338 0 Pike 12,845 0 Porter 164,343 4 Posey 25,910 0 Pulaski 13,402 0 Putnam 37,963 6 Randolph 26,171 0 Ripley 28,818 0 Rush 17,392 0 Scott 24,181 0 Shelby 44,436 0 Spencer 20,952 0 St. Joseph 266,931 10 Starke 23,363 0 Steuben 34,185 3 Sullivan 21,475 6 Switzerland 10,613 0 Tippecanoe 172,780 7 Tipton 15,936 0 Union 7,516 0 Vanderburgh 179,703 14
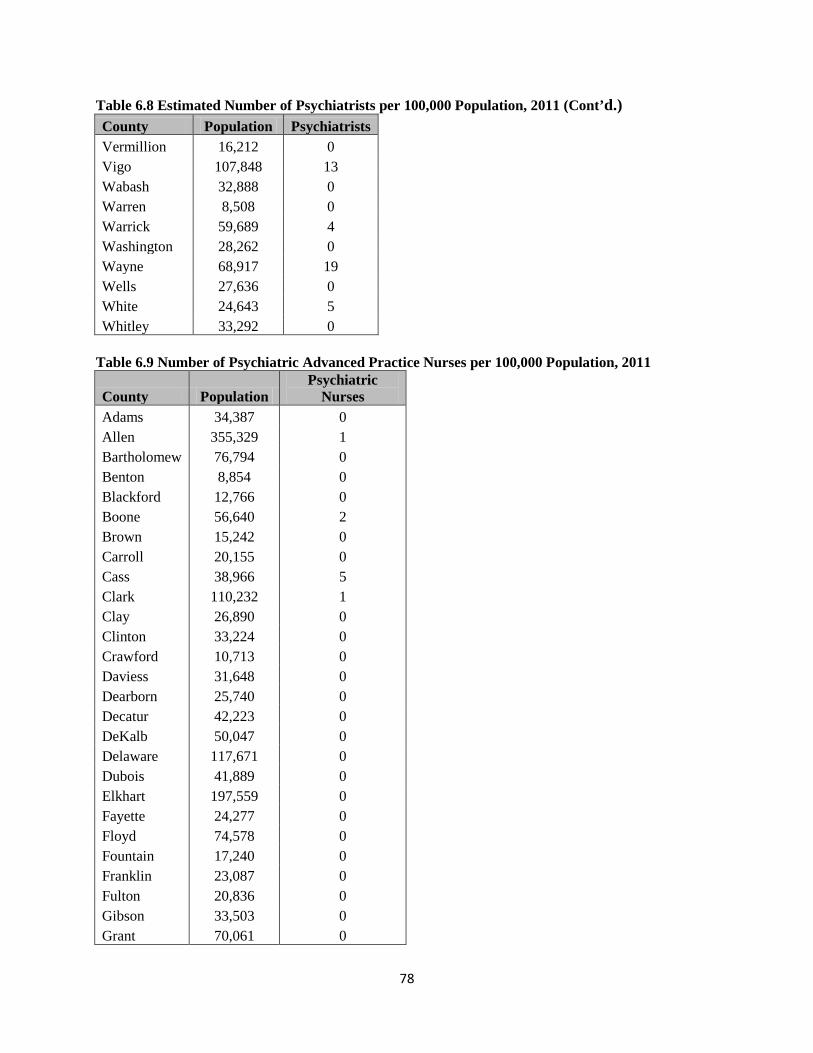
78
Table 6.8 Estimated Number of Psychiatrists per 100,000 Population, 2011 (Cont’d.) County Population Psychiatrists Vermillion 16,212 0 Vigo 107,848 13 Wabash 32,888 0 Warren 8,508 0 Warrick 59,689 4 Washington 28,262 0 Wayne 68,917 19 Wells 27,636 0 White 24,643 5 Whitley 33,292 0
Table 6.9 Number of Psychiatric Advanced Practice Nurses per 100,000 Population, 2011
County Population Psychiatric
Nurses Adams 34,387 0 Allen 355,329 1 Bartholomew 76,794 0 Benton 8,854 0 Blackford 12,766 0 Boone 56,640 2 Brown 15,242 0 Carroll 20,155 0 Cass 38,966 5 Clark 110,232 1 Clay 26,890 0 Clinton 33,224 0 Crawford 10,713 0 Daviess 31,648 0 Dearborn 25,740 0 Decatur 42,223 0 DeKalb 50,047 0 Delaware 117,671 0 Dubois 41,889 0 Elkhart 197,559 0 Fayette 24,277 0 Floyd 74,578 0 Fountain 17,240 0 Franklin 23,087 0 Fulton 20,836 0 Gibson 33,503 0 Grant 70,061 0
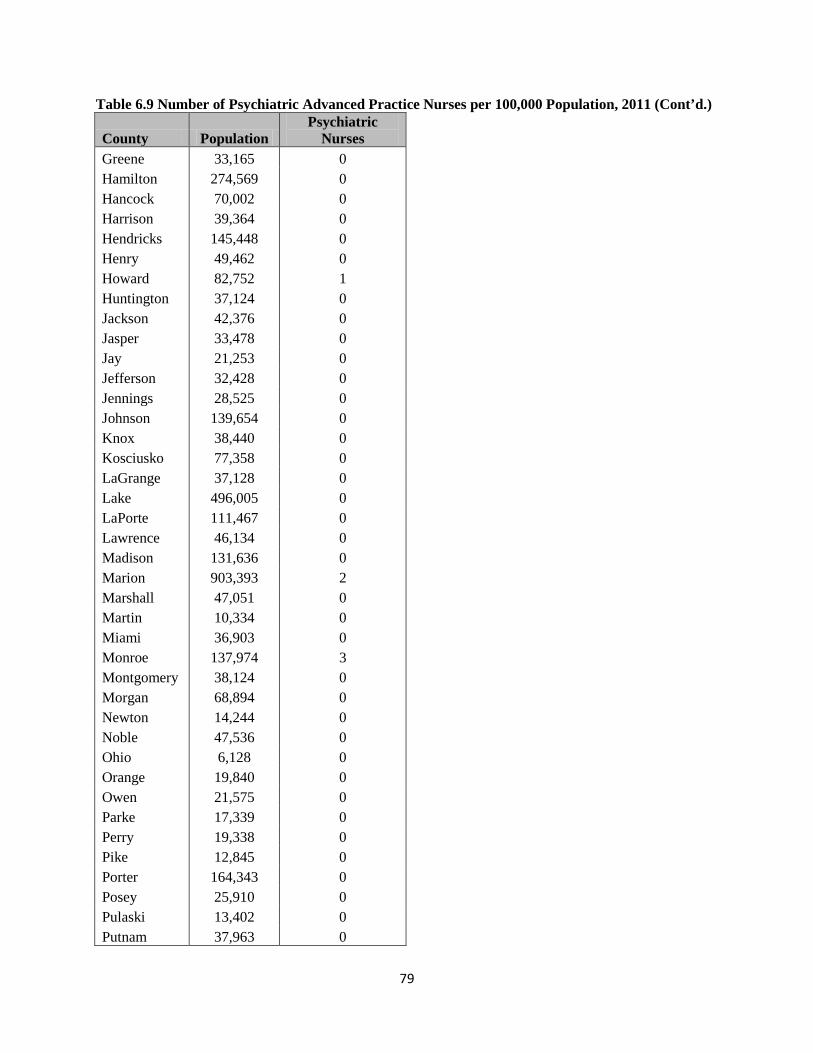
79
Table 6.9 Number of Psychiatric Advanced Practice Nurses per 100,000 Population, 2011 (Cont’d.)
County Population Psychiatric
Nurses Greene 33,165 0 Hamilton 274,569 0 Hancock 70,002 0 Harrison 39,364 0 Hendricks 145,448 0 Henry 49,462 0 Howard 82,752 1 Huntington 37,124 0 Jackson 42,376 0 Jasper 33,478 0 Jay 21,253 0 Jefferson 32,428 0 Jennings 28,525 0 Johnson 139,654 0 Knox 38,440 0 Kosciusko 77,358 0 LaGrange 37,128 0 Lake 496,005 0 LaPorte 111,467 0 Lawrence 46,134 0 Madison 131,636 0 Marion 903,393 2 Marshall 47,051 0 Martin 10,334 0 Miami 36,903 0 Monroe 137,974 3 Montgomery 38,124 0 Morgan 68,894 0 Newton 14,244 0 Noble 47,536 0 Ohio 6,128 0 Orange 19,840 0 Owen 21,575 0 Parke 17,339 0 Perry 19,338 0 Pike 12,845 0 Porter 164,343 0 Posey 25,910 0 Pulaski 13,402 0 Putnam 37,963 0
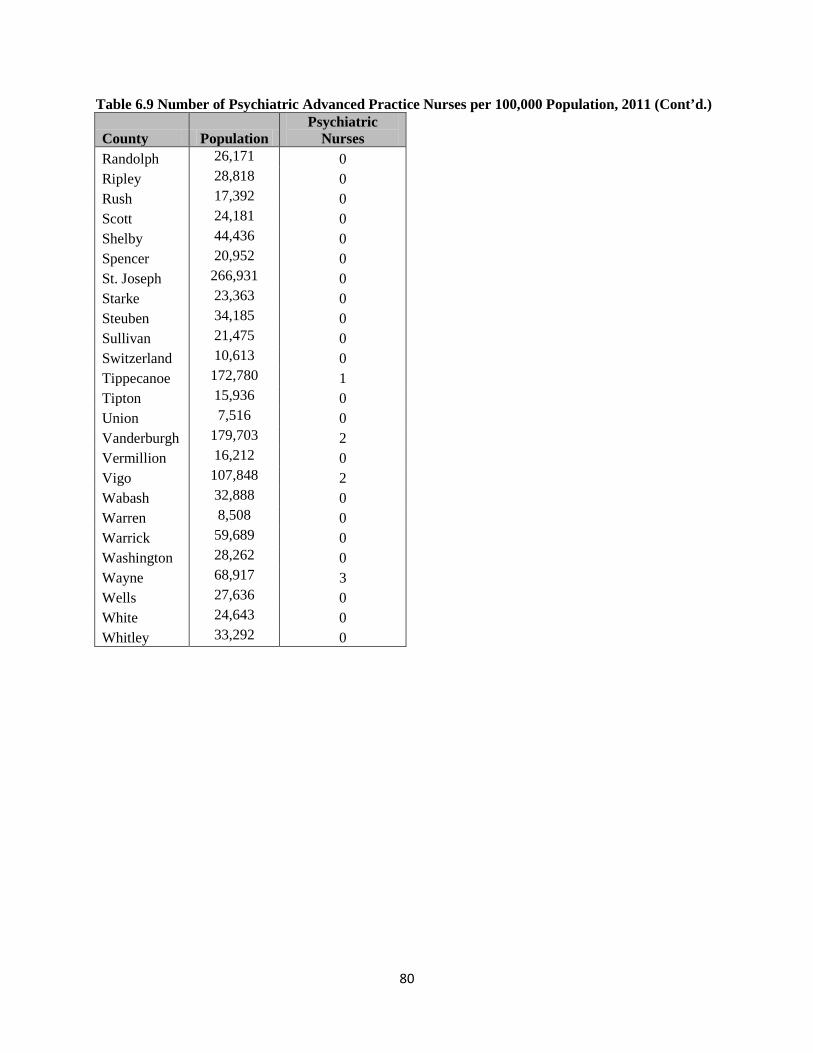
80
Table 6.9 Number of Psychiatric Advanced Practice Nurses per 100,000 Population, 2011 (Cont’d.)
County Population Psychiatric
Nurses Randolph 26,171 0 Ripley 28,818 0 Rush 17,392 0 Scott 24,181 0 Shelby 44,436 0 Spencer 20,952 0 St. Joseph 266,931 0 Starke 23,363 0 Steuben 34,185 0 Sullivan 21,475 0 Switzerland 10,613 0 Tippecanoe 172,780 1 Tipton 15,936 0 Union 7,516 0 Vanderburgh 179,703 2 Vermillion 16,212 0 Vigo 107,848 2 Wabash 32,888 0 Warren 8,508 0 Warrick 59,689 0 Washington 28,262 0 Wayne 68,917 3 Wells 27,636 0 White 24,643 0 Whitley 33,292 0
81
Chapter 7: Conclusions
Master’s trained mental health professionals were predominantly white, non-Hispanic females.
The mean age of mental health professionals in Indiana was 49.9 years old, and nearly two-thirds of
practicing mental health professionals were between the ages of 45 and 64. Within the field, nearly one-
half of mental health professionals were social workers and almost 40 percent were mental health
counselors. Less than one-tenth of the respondents were marriage and family therapists. Over four-fifths
spent the majority of their time at work engaged in direct patient care. The distribution of mental health
professionals by county roughly corresponds to population. Counties with higher population generally
have larger numbers of mental health professionals. Only three counties lacked any mental health
professionals; however, 38 counties were lacking marriage and family therapists.
Unlike master’s trained mental health professionals, clinical psychologists were split evenly by
gender. However, a large majority were white and non-Hispanic. The mean age of respondents was 51.5
years old, but age distributions varied widely by gender. Over four-fifths of psychologists under the age
of 35 were female, while over three-fifths of psychologists over age 54 were male. This could indicate
that the profession had been dominated by males, but is transitioning to a primarily female workforce.
Counties with higher population generally had higher numbers of psychologists. However, one-third of
Indiana counties were without practicing psychologists. This indicates a need to encourage psychologists
to practice outside of the most populous counties.
The majority of psychiatrists practicing in Indiana were white, non-Hispanic males. The mean
age of respondents was 52.6 years old with nearly half of all respondents between 35 and 54 years of age.
Less than 10 percent of psychiatrists were under the age of 35. The lack of young doctors entering the
field is a concern as older practitioners begin to retire. Increasing interest in psychiatry and mental health
among current and future medical students, and administrators of medical training programs, will be
crucial for maintaining a robust workforce of psychiatric physicians in the future. The highest
distributions of psychiatrists were focused around Indianapolis, Fort Wayne, Terre Haute, and Evansville.
Some counties adjacent to these large cities have relatively high numbers of psychiatrists as well, but 50
Indiana counties did not have any practicing psychiatrists.. Rural counties in particular seemed to be
lacking psychiatrists.
The majority of psychiatric advanced practice nurses were white, non-Hispanic females. Most
psychiatric nurses worked in either public/community health settings or hospitals and reported that their
primary work activity was psychopharmacological interventions. Caution should be taken when
extrapolating the results of the psychiatric nurse survey due to the low sample size (52). The distribution
of psychiatric advanced practice nurses around the state showed a concentration of nurses in several
82
counties, but showed that 80 of the 92 counties did not have any practicing psychiatric advanced practice
nurses. Since the survey was given using a “snowball” method to reach more respondents, it is likely that
the reported distribution of psychiatric advanced practice nurses around the state is an artifact of the
survey method rather than an indicator of real trends in the workforce.
A need for greater racial and ethnic diversity among mental healthcare providers was noted in
each field. Additionally, more bilingual mental health professionals are needed to meet the growing
demand for mental healthcare among immigrant populations. Future policy may consider encouraging
the diversification of the mental health professional workforce and stimulate interest in mental health
among young people seeking a career in healthcare.
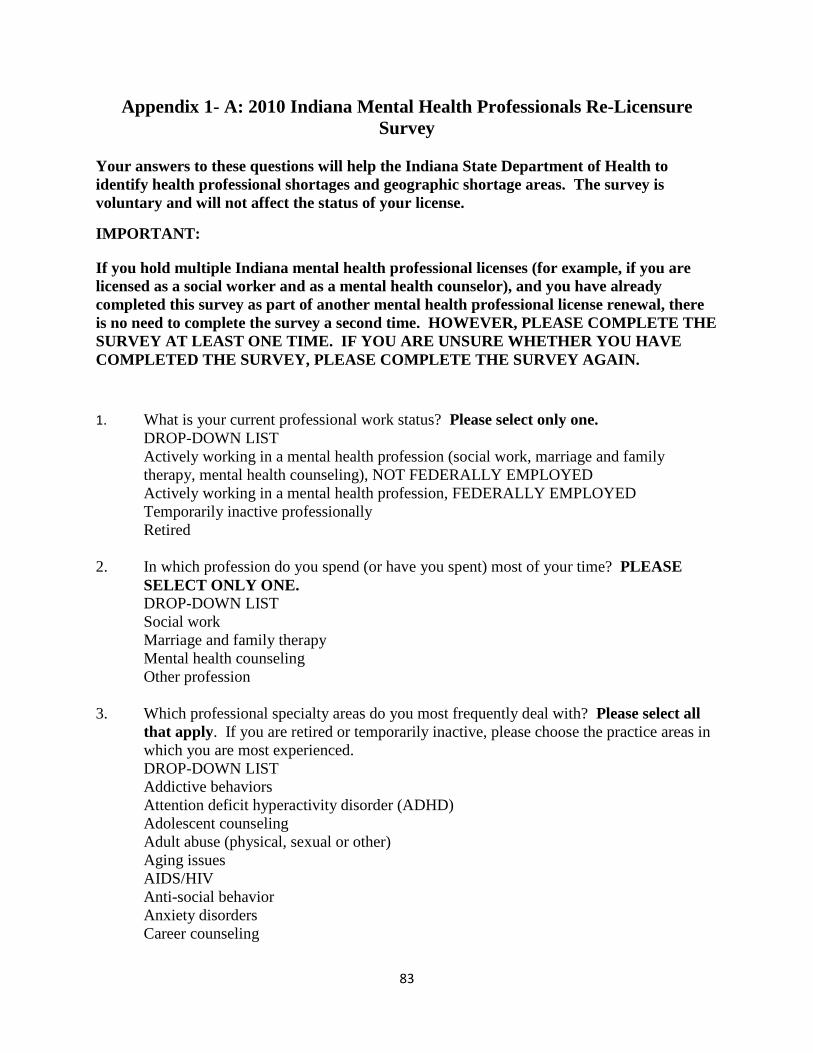
83
Appendix 1- A: 2010 Indiana Mental Health Professionals Re-Licensure Survey
Your answers to these questions will help the Indiana State Department of Health to identify health professional shortages and geographic shortage areas. The survey is voluntary and will not affect the status of your license. IMPORTANT:
If you hold multiple Indiana mental health professional licenses (for example, if you are licensed as a social worker and as a mental health counselor), and you have already completed this survey as part of another mental health professional license renewal, there is no need to complete the survey a second time. HOWEVER, PLEASE COMPLETE THE SURVEY AT LEAST ONE TIME. IF YOU ARE UNSURE WHETHER YOU HAVE COMPLETED THE SURVEY, PLEASE COMPLETE THE SURVEY AGAIN.
1. What is your current professional work status? Please select only one. DROP-DOWN LIST Actively working in a mental health profession (social work, marriage and family therapy, mental health counseling), NOT FEDERALLY EMPLOYED
Actively working in a mental health profession, FEDERALLY EMPLOYED Temporarily inactive professionally Retired 2. In which profession do you spend (or have you spent) most of your time? PLEASE
SELECT ONLY ONE. DROP-DOWN LIST Social work Marriage and family therapy Mental health counseling Other profession 3. Which professional specialty areas do you most frequently deal with? Please select all
that apply. If you are retired or temporarily inactive, please choose the practice areas in which you are most experienced.
DROP-DOWN LIST Addictive behaviors Attention deficit hyperactivity disorder (ADHD) Adolescent counseling Adult abuse (physical, sexual or other) Aging issues AIDS/HIV Anti-social behavior Anxiety disorders Career counseling
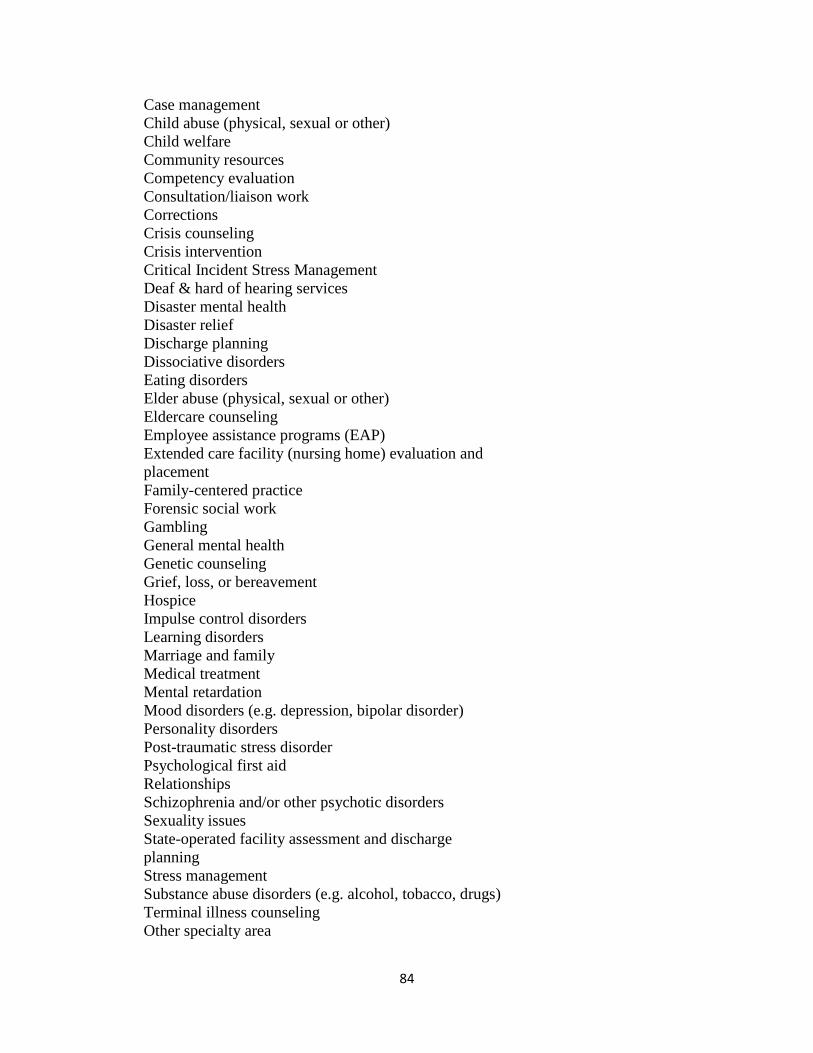
84
Case management Child abuse (physical, sexual or other) Child welfare Community resources Competency evaluation Consultation/liaison work Corrections Crisis counseling Crisis intervention Critical Incident Stress Management Deaf & hard of hearing services Disaster mental health Disaster relief Discharge planning Dissociative disorders Eating disorders Elder abuse (physical, sexual or other) Eldercare counseling Employee assistance programs (EAP) Extended care facility (nursing home) evaluation and placement Family-centered practice Forensic social work Gambling General mental health Genetic counseling Grief, loss, or bereavement Hospice Impulse control disorders Learning disorders Marriage and family Medical treatment Mental retardation Mood disorders (e.g. depression, bipolar disorder) Personality disorders Post-traumatic stress disorder Psychological first aid Relationships Schizophrenia and/or other psychotic disorders Sexuality issues State-operated facility assessment and discharge planning Stress management Substance abuse disorders (e.g. alcohol, tobacco, drugs) Terminal illness counseling Other specialty area

85
4. Would you be willing to provide services in case of a bio-terrorism
event or other public health emergency? If you answer “Yes,” we may contact you using your IPLA contact information. DROP-DOWN LIST Yes No
5. Are you fluent in any of the following languages? PLEASE SELECT ALL THAT APPLY. DROP-DOWN LIST
African languages Arabic Burmese
Cambodian Chinese Filipino French German Greek Hindi Italian Japanese Korean Pennsylvania Dutch Polish Portuguese Russian Sign language Spanish Tagalog Thai Turkish Vietnamese
6. In which activity do you spend most of your professional time? Please select only one.
If you are retired or temporarily inactive, please skip to Questions 9-12. DROP-DOWN LIST
Direct client care or client care related activities Administration Teaching Research Other
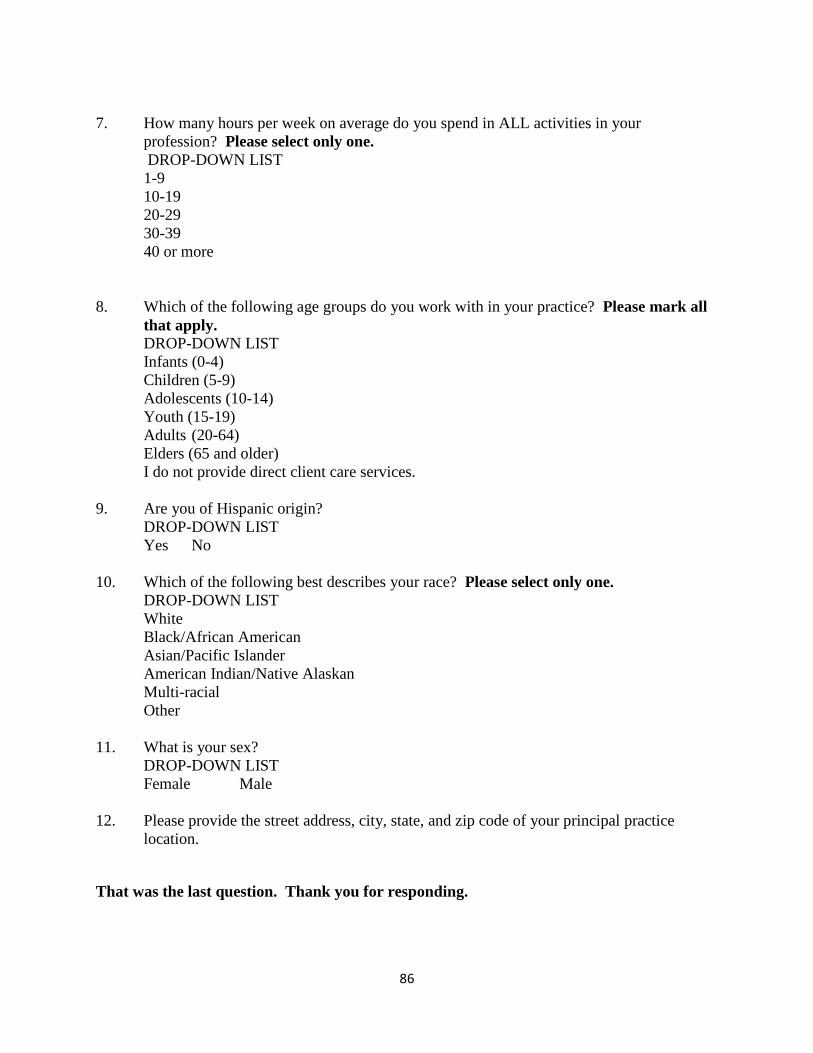
86
7. How many hours per week on average do you spend in ALL activities in your
profession? Please select only one. DROP-DOWN LIST
1-9 10-19 20-29 30-39 40 or more
8. Which of the following age groups do you work with in your practice? Please mark all
that apply. DROP-DOWN LIST Infants (0-4) Children (5-9) Adolescents (10-14) Youth (15-19) Adults (20-64) Elders (65 and older)
I do not provide direct client care services.
9. Are you of Hispanic origin? DROP-DOWN LIST Yes No
10. Which of the following best describes your race? Please select only one. DROP-DOWN LIST
White Black/African American Asian/Pacific Islander American Indian/Native Alaskan Multi-racial Other
11. What is your sex? DROP-DOWN LIST Female Male 12. Please provide the street address, city, state, and zip code of your principal practice
location.
That was the last question. Thank you for responding.
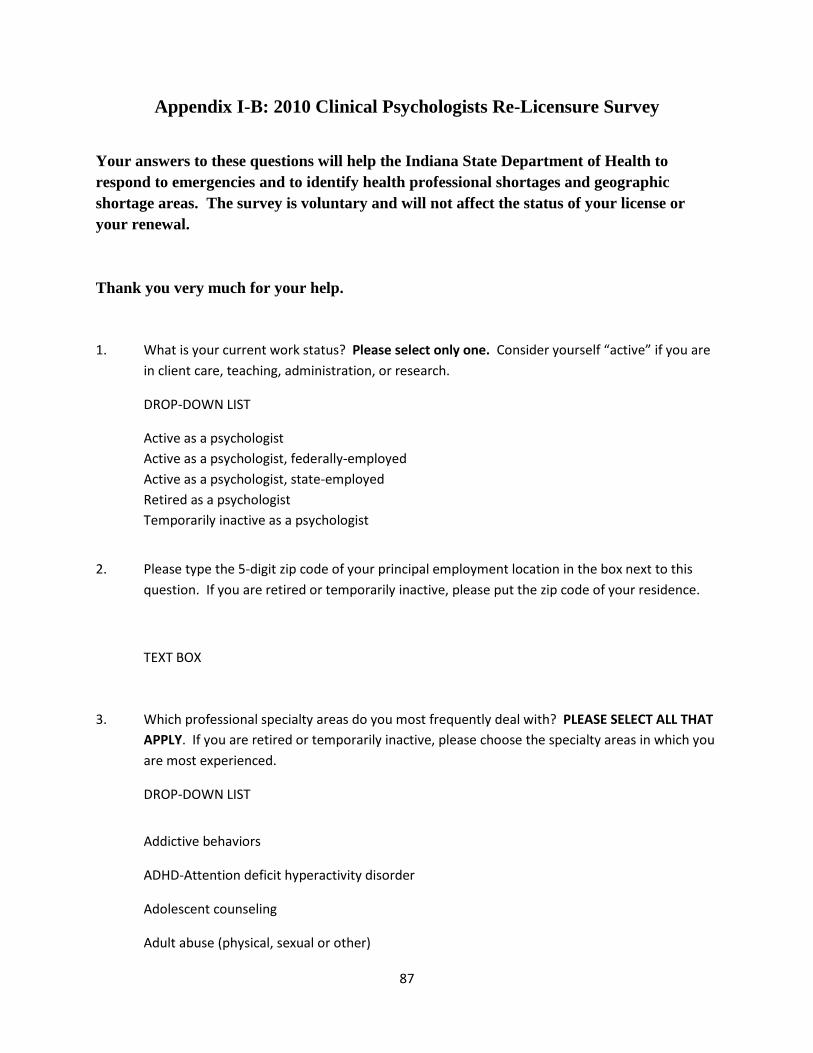
87
Appendix I-B: 2010 Clinical Psychologists Re-Licensure Survey
Your answers to these questions will help the Indiana State Department of Health to respond to emergencies and to identify health professional shortages and geographic shortage areas. The survey is voluntary and will not affect the status of your license or your renewal.
Thank you very much for your help.
1. What is your current work status? Please select only one. Consider yourself “active” if you are in client care, teaching, administration, or research.
DROP-DOWN LIST
Active as a psychologist Active as a psychologist, federally-employed Active as a psychologist, state-employed Retired as a psychologist Temporarily inactive as a psychologist
2. Please type the 5-digit zip code of your principal employment location in the box next to this question. If you are retired or temporarily inactive, please put the zip code of your residence.
TEXT BOX
3. Which professional specialty areas do you most frequently deal with? PLEASE SELECT ALL THAT APPLY. If you are retired or temporarily inactive, please choose the specialty areas in which you are most experienced.
DROP-DOWN LIST
Addictive behaviors
ADHD-Attention deficit hyperactivity disorder
Adolescent counseling
Adult abuse (physical, sexual or other)
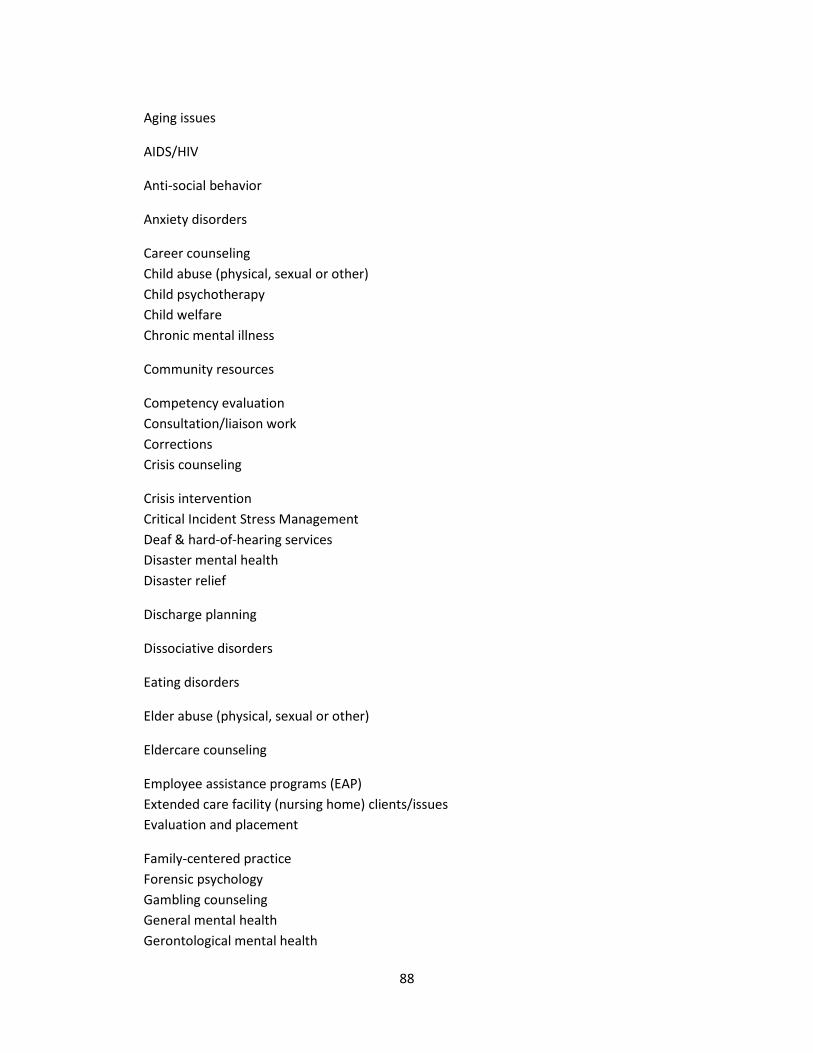
88
Aging issues
AIDS/HIV
Anti-social behavior
Anxiety disorders
Career counseling
Child abuse (physical, sexual or other) Child psychotherapy
Child welfare Chronic mental illness
Community resources
Competency evaluation
Consultation/liaison work Corrections Crisis counseling
Crisis intervention
Critical Incident Stress Management Deaf & hard-of-hearing services
Disaster mental health Disaster relief
Discharge planning
Dissociative disorders
Eating disorders
Elder abuse (physical, sexual or other)
Eldercare counseling
Employee assistance programs (EAP)
Extended care facility (nursing home) clients/issues Evaluation and placement
Family-centered practice
Forensic psychology Gambling counseling
General mental health Gerontological mental health
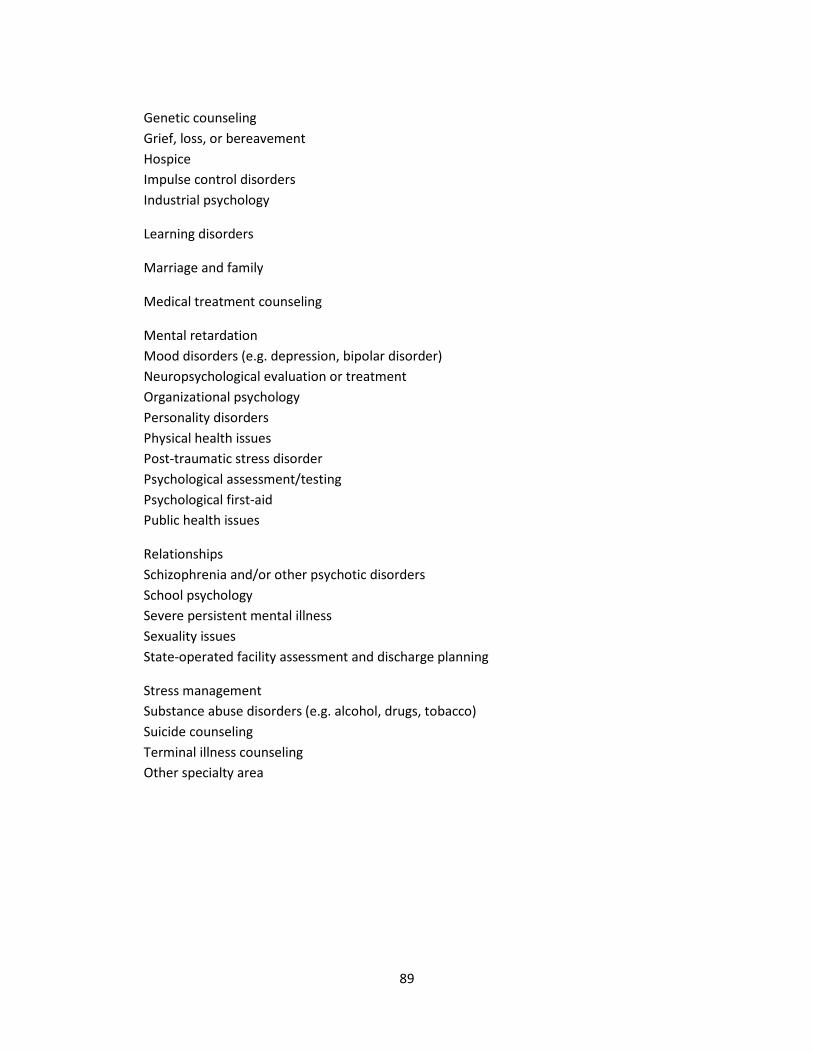
89
Genetic counseling
Grief, loss, or bereavement Hospice
Impulse control disorders Industrial psychology
Learning disorders
Marriage and family
Medical treatment counseling
Mental retardation
Mood disorders (e.g. depression, bipolar disorder) Neuropsychological evaluation or treatment Organizational psychology
Personality disorders Physical health issues
Post-traumatic stress disorder Psychological assessment/testing Psychological first-aid Public health issues
Relationships
Schizophrenia and/or other psychotic disorders School psychology Severe persistent mental illness
Sexuality issues State-operated facility assessment and discharge planning
Stress management
Substance abuse disorders (e.g. alcohol, drugs, tobacco) Suicide counseling
Terminal illness counseling Other specialty area
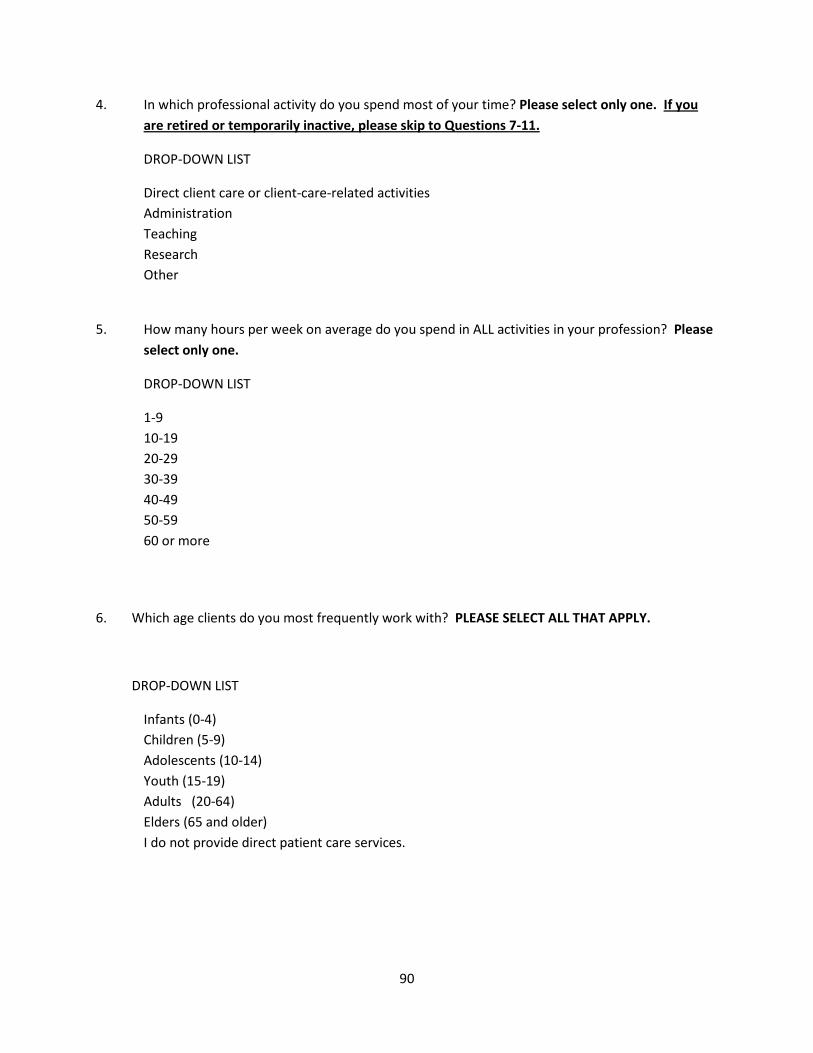
90
4. In which professional activity do you spend most of your time? Please select only one. If you are retired or temporarily inactive, please skip to Questions 7-11.
DROP-DOWN LIST
Direct client care or client-care-related activities Administration Teaching Research Other
5. How many hours per week on average do you spend in ALL activities in your profession? Please select only one.
DROP-DOWN LIST
1-9 10-19 20-29 30-39 40-49 50-59 60 or more
6. Which age clients do you most frequently work with? PLEASE SELECT ALL THAT APPLY.
DROP-DOWN LIST
Infants (0-4) Children (5-9) Adolescents (10-14) Youth (15-19) Adults (20-64) Elders (65 and older)
I do not provide direct patient care services.

91
7. Would you be willing to provide services in case of a bio-terrorism event or other public health emergency? If you answer “Yes,” we may contact you using your PLA contact information.
DROP-DOWN LIST
Yes No
8. Are you fluent in any of the following languages? PLEASE SELECT ALL THAT APPLY.
DROP-DOWN LIST
African languages Arabic Burmese
Cambodian Chinese Filipino French German Greek Hindi Italian Japanese Korean Pennsylvania Dutch Polish Portuguese Russian Sign language Spanish Tagalog Thai Turkish Vietnamese
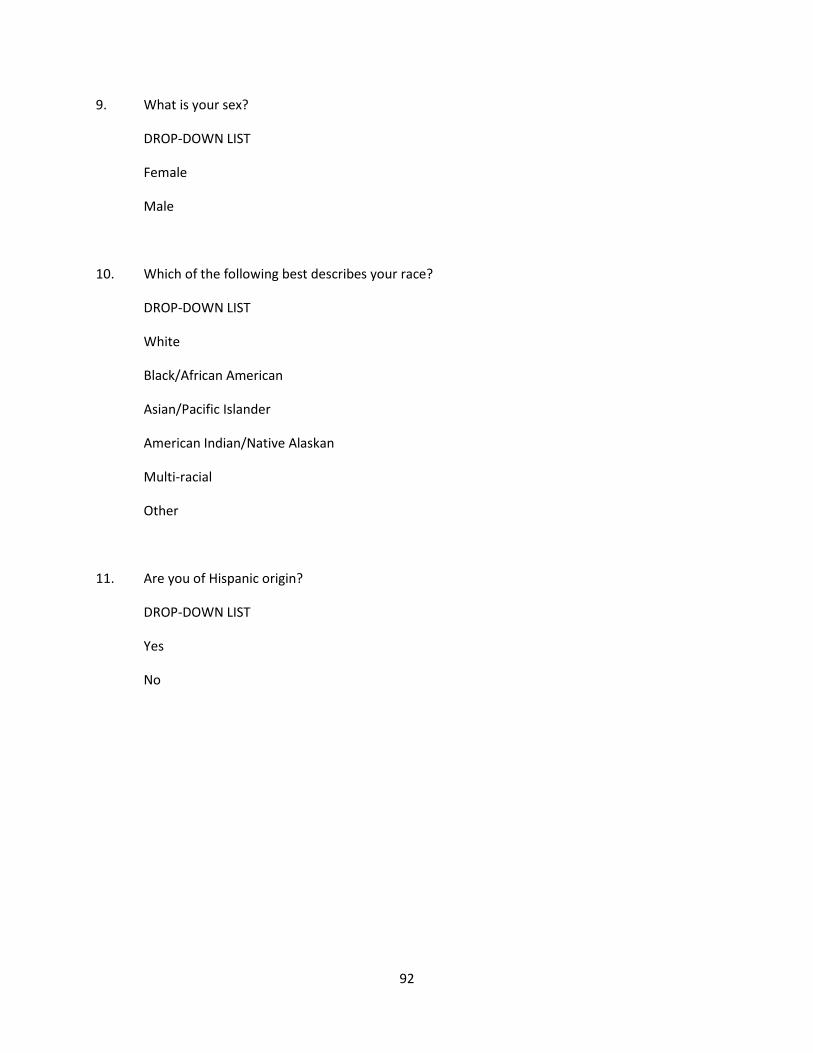
92
9. What is your sex?
DROP-DOWN LIST
Female
Male
10. Which of the following best describes your race?
DROP-DOWN LIST
White
Black/African American
Asian/Pacific Islander
American Indian/Native Alaskan
Multi-racial
Other
11. Are you of Hispanic origin?
DROP-DOWN LIST
Yes
No
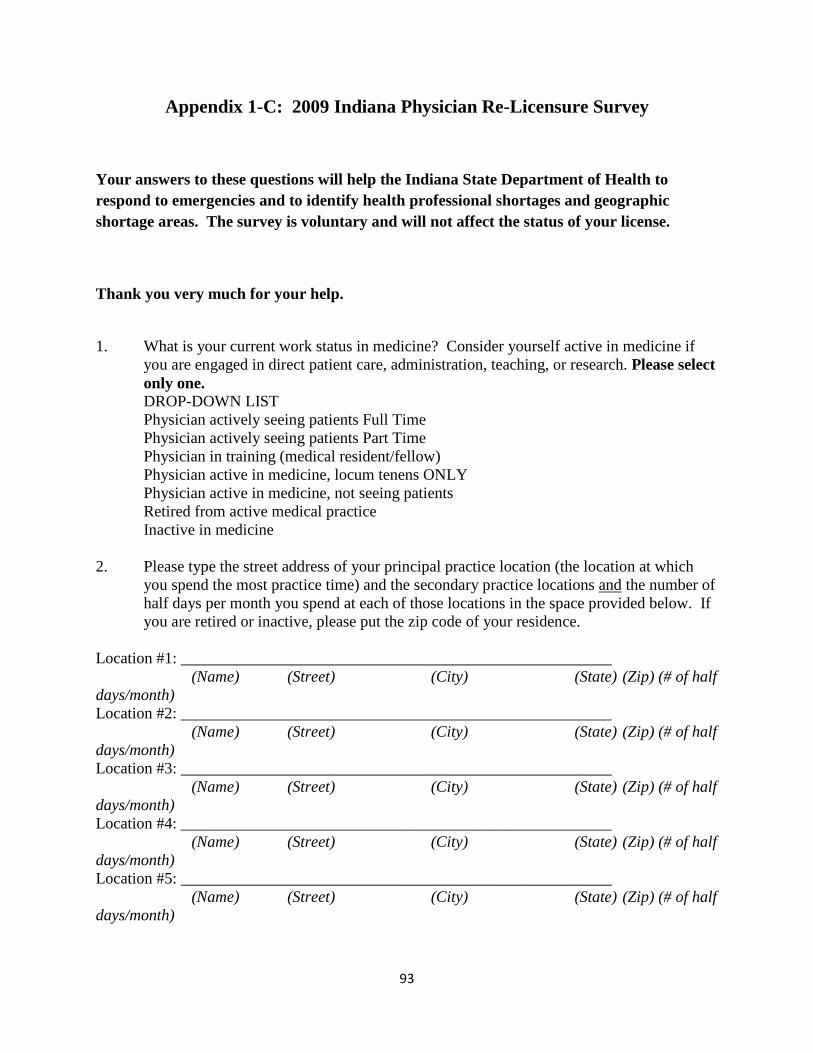
93
Appendix 1-C: 2009 Indiana Physician Re-Licensure Survey
Your answers to these questions will help the Indiana State Department of Health to respond to emergencies and to identify health professional shortages and geographic shortage areas. The survey is voluntary and will not affect the status of your license.
Thank you very much for your help.
1. What is your current work status in medicine? Consider yourself active in medicine if
you are engaged in direct patient care, administration, teaching, or research. Please select only one.
DROP-DOWN LIST Physician actively seeing patients Full Time Physician actively seeing patients Part Time
Physician in training (medical resident/fellow) Physician active in medicine, locum tenens ONLY
Physician active in medicine, not seeing patients Retired from active medical practice Inactive in medicine 2. Please type the street address of your principal practice location (the location at which
you spend the most practice time) and the secondary practice locations and the number of half days per month you spend at each of those locations in the space provided below. If you are retired or inactive, please put the zip code of your residence.
Location #1: ______________________________________________________ (Name) (Street) (City) (State) (Zip) (# of half days/month) Location #2: ______________________________________________________ (Name) (Street) (City) (State) (Zip) (# of half days/month) Location #3: ______________________________________________________ (Name) (Street) (City) (State) (Zip) (# of half days/month) Location #4: ______________________________________________________ (Name) (Street) (City) (State) (Zip) (# of half days/month) Location #5: ______________________________________________________ (Name) (Street) (City) (State) (Zip) (# of half days/month)
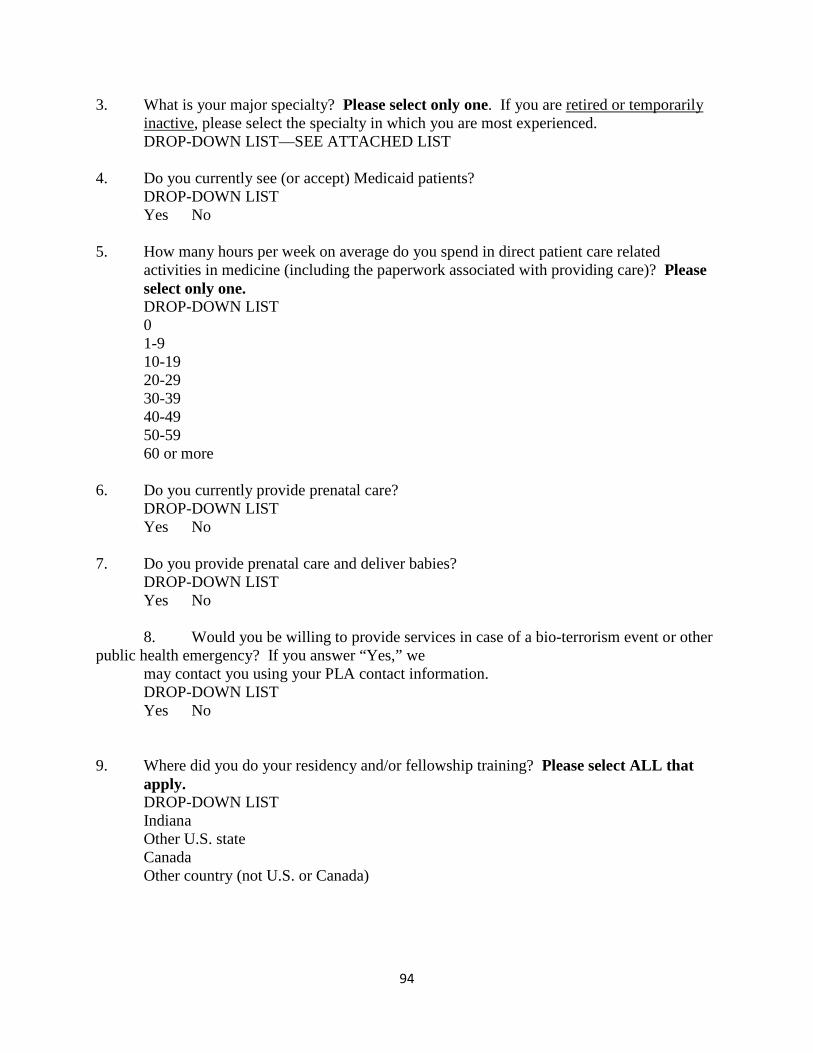
94
3. What is your major specialty? Please select only one. If you are retired or temporarily inactive, please select the specialty in which you are most experienced.
DROP-DOWN LIST—SEE ATTACHED LIST 4. Do you currently see (or accept) Medicaid patients?
DROP-DOWN LIST Yes No
5. How many hours per week on average do you spend in direct patient care related
activities in medicine (including the paperwork associated with providing care)? Please select only one.
DROP-DOWN LIST 0
1-9 10-19 20-29 30-39
40-49 50-59 60 or more 6. Do you currently provide prenatal care?
DROP-DOWN LIST Yes No
7. Do you provide prenatal care and deliver babies?
DROP-DOWN LIST Yes No 8. Would you be willing to provide services in case of a bio-terrorism event or other
public health emergency? If you answer “Yes,” we may contact you using your PLA contact information. DROP-DOWN LIST Yes No
9. Where did you do your residency and/or fellowship training? Please select ALL that apply.
DROP-DOWN LIST Indiana Other U.S. state Canada Other country (not U.S. or Canada)
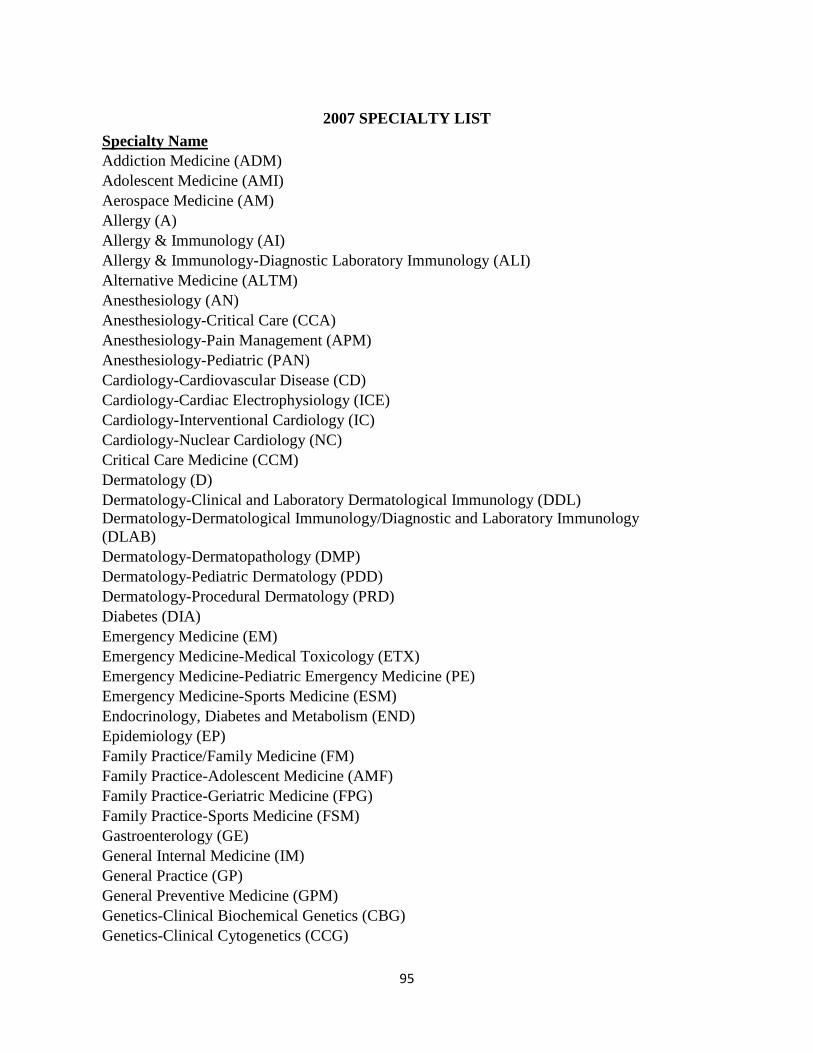
95
2007 SPECIALTY LIST Specialty Name Addiction Medicine (ADM) Adolescent Medicine (AMI) Aerospace Medicine (AM) Allergy (A) Allergy & Immunology (AI) Allergy & Immunology-Diagnostic Laboratory Immunology (ALI) Alternative Medicine (ALTM) Anesthesiology (AN) Anesthesiology-Critical Care (CCA) Anesthesiology-Pain Management (APM) Anesthesiology-Pediatric (PAN) Cardiology-Cardiovascular Disease (CD) Cardiology-Cardiac Electrophysiology (ICE) Cardiology-Interventional Cardiology (IC) Cardiology-Nuclear Cardiology (NC) Critical Care Medicine (CCM) Dermatology (D) Dermatology-Clinical and Laboratory Dermatological Immunology (DDL) Dermatology-Dermatological Immunology/Diagnostic and Laboratory Immunology (DLAB) Dermatology-Dermatopathology (DMP) Dermatology-Pediatric Dermatology (PDD) Dermatology-Procedural Dermatology (PRD) Diabetes (DIA) Emergency Medicine (EM) Emergency Medicine-Medical Toxicology (ETX) Emergency Medicine-Pediatric Emergency Medicine (PE) Emergency Medicine-Sports Medicine (ESM) Endocrinology, Diabetes and Metabolism (END) Epidemiology (EP) Family Practice/Family Medicine (FM) Family Practice-Adolescent Medicine (AMF) Family Practice-Geriatric Medicine (FPG) Family Practice-Sports Medicine (FSM) Gastroenterology (GE) General Internal Medicine (IM) General Practice (GP) General Preventive Medicine (GPM) Genetics-Clinical Biochemical Genetics (CBG) Genetics-Clinical Cytogenetics (CCG)
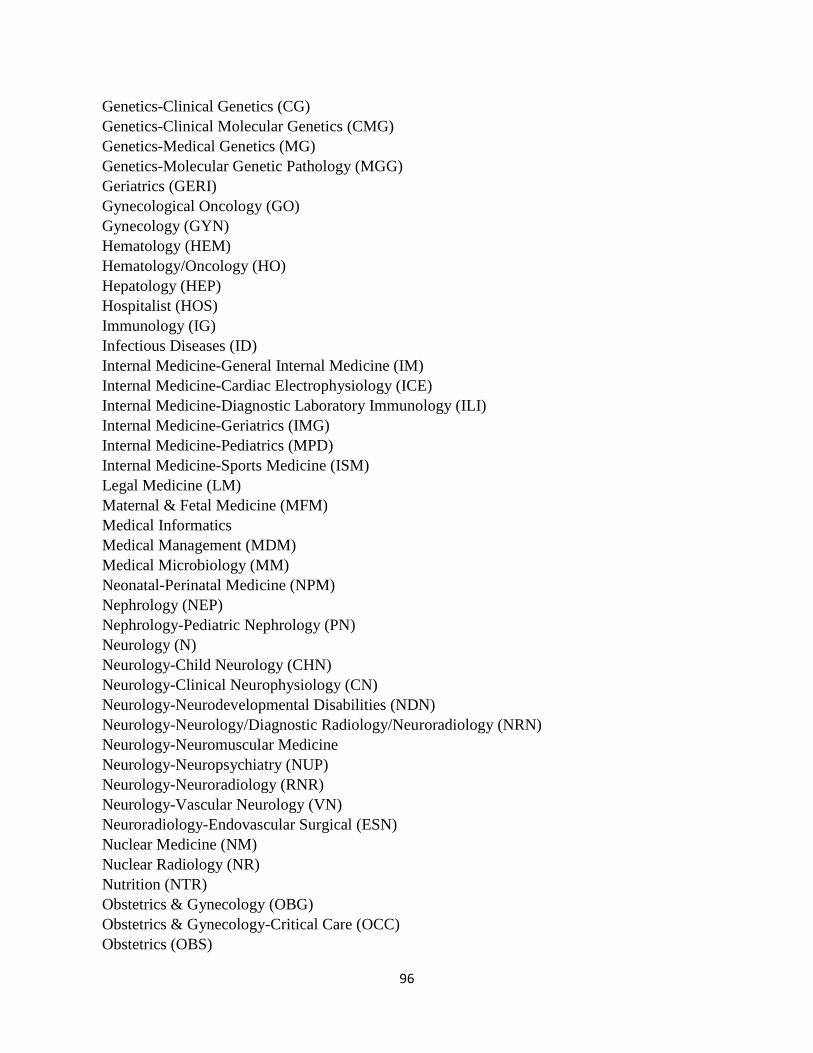
96
Genetics-Clinical Genetics (CG) Genetics-Clinical Molecular Genetics (CMG) Genetics-Medical Genetics (MG) Genetics-Molecular Genetic Pathology (MGG) Geriatrics (GERI) Gynecological Oncology (GO) Gynecology (GYN) Hematology (HEM) Hematology/Oncology (HO) Hepatology (HEP) Hospitalist (HOS) Immunology (IG) Infectious Diseases (ID) Internal Medicine-General Internal Medicine (IM) Internal Medicine-Cardiac Electrophysiology (ICE) Internal Medicine-Diagnostic Laboratory Immunology (ILI) Internal Medicine-Geriatrics (IMG) Internal Medicine-Pediatrics (MPD) Internal Medicine-Sports Medicine (ISM) Legal Medicine (LM) Maternal & Fetal Medicine (MFM) Medical Informatics Medical Management (MDM) Medical Microbiology (MM) Neonatal-Perinatal Medicine (NPM) Nephrology (NEP) Nephrology-Pediatric Nephrology (PN) Neurology (N) Neurology-Child Neurology (CHN) Neurology-Clinical Neurophysiology (CN) Neurology-Neurodevelopmental Disabilities (NDN) Neurology-Neurology/Diagnostic Radiology/Neuroradiology (NRN) Neurology-Neuromuscular Medicine Neurology-Neuropsychiatry (NUP) Neurology-Neuroradiology (RNR) Neurology-Vascular Neurology (VN) Neuroradiology-Endovascular Surgical (ESN) Nuclear Medicine (NM) Nuclear Radiology (NR) Nutrition (NTR) Obstetrics & Gynecology (OBG) Obstetrics & Gynecology-Critical Care (OCC) Obstetrics (OBS)
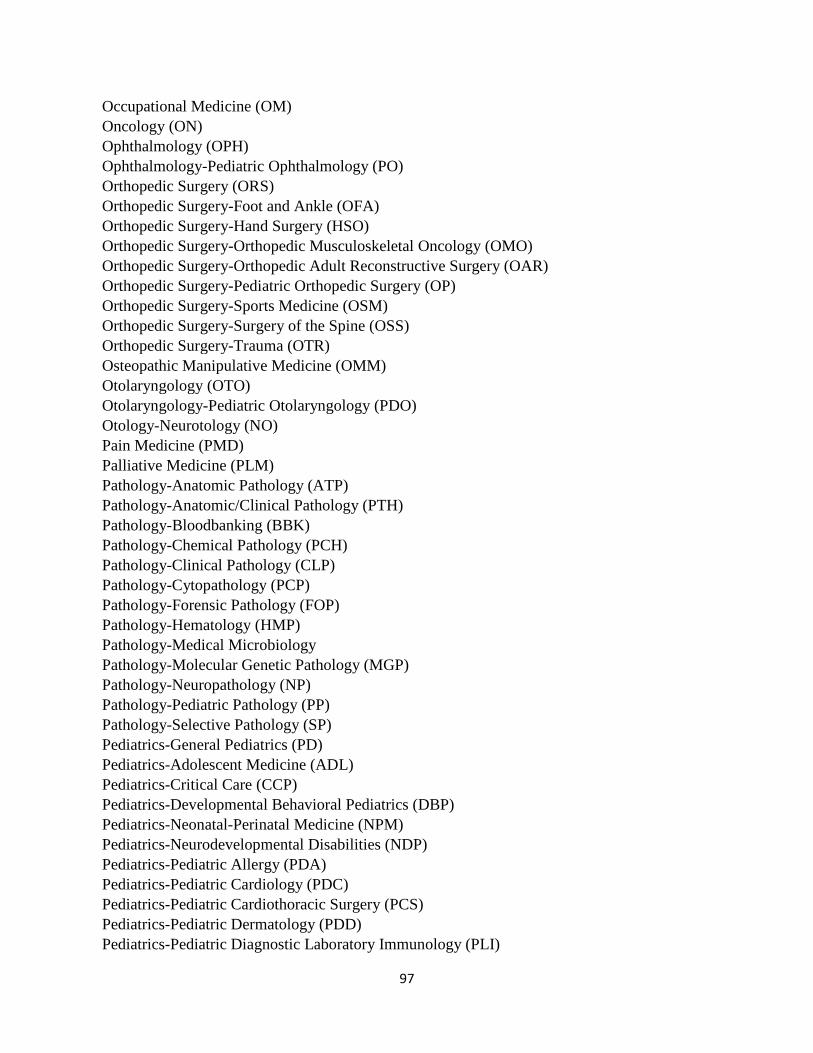
97
Occupational Medicine (OM) Oncology (ON) Ophthalmology (OPH) Ophthalmology-Pediatric Ophthalmology (PO) Orthopedic Surgery (ORS) Orthopedic Surgery-Foot and Ankle (OFA) Orthopedic Surgery-Hand Surgery (HSO) Orthopedic Surgery-Orthopedic Musculoskeletal Oncology (OMO) Orthopedic Surgery-Orthopedic Adult Reconstructive Surgery (OAR) Orthopedic Surgery-Pediatric Orthopedic Surgery (OP) Orthopedic Surgery-Sports Medicine (OSM) Orthopedic Surgery-Surgery of the Spine (OSS) Orthopedic Surgery-Trauma (OTR) Osteopathic Manipulative Medicine (OMM) Otolaryngology (OTO) Otolaryngology-Pediatric Otolaryngology (PDO) Otology-Neurotology (NO) Pain Medicine (PMD) Palliative Medicine (PLM) Pathology-Anatomic Pathology (ATP) Pathology-Anatomic/Clinical Pathology (PTH) Pathology-Bloodbanking (BBK) Pathology-Chemical Pathology (PCH) Pathology-Clinical Pathology (CLP) Pathology-Cytopathology (PCP) Pathology-Forensic Pathology (FOP) Pathology-Hematology (HMP) Pathology-Medical Microbiology Pathology-Molecular Genetic Pathology (MGP) Pathology-Neuropathology (NP) Pathology-Pediatric Pathology (PP) Pathology-Selective Pathology (SP) Pediatrics-General Pediatrics (PD) Pediatrics-Adolescent Medicine (ADL) Pediatrics-Critical Care (CCP) Pediatrics-Developmental Behavioral Pediatrics (DBP) Pediatrics-Neonatal-Perinatal Medicine (NPM) Pediatrics-Neurodevelopmental Disabilities (NDP) Pediatrics-Pediatric Allergy (PDA) Pediatrics-Pediatric Cardiology (PDC) Pediatrics-Pediatric Cardiothoracic Surgery (PCS) Pediatrics-Pediatric Dermatology (PDD) Pediatrics-Pediatric Diagnostic Laboratory Immunology (PLI)
98
Pediatrics-Pediatric Emergency Medicine (PEM) Pediatrics-Pediatric Endocrinology (PDE) Pediatrics-Pediatric Gastroenterology (PG) Pediatrics-Pediatric Hematology/Oncology (PHO) Pediatrics-Pediatric Infectious Diseases (PDI) Pediatrics-Pediatric Medical Toxicology (PDT) Pediatrics-Pediatric Otolaryngology (PDO) Pediatrics-Pediatric Pathology (PP) Pediatrics-Pediatric Pulmonology (PDP) Pediatrics-Pediatric Radiology (PDR) Pediatrics-Pediatric Rehabilitation Medicine (RPM) Pediatrics-Pediatric Rheumatology (PPR) Pediatrics-Pediatric Sports Medicine (PSM) Pediatrics-Pediatric Surgery (PDS) Pharmaceutical Medicine (PHM) Pharmacology-Clinical Pharmacology (PA) Phlebology (PHL) Physical Medicine & Rehabilitation (PM) Physical Medicine and Rehabilitation-Spinal Cord Injury (SCI) Physical Medicine and Rehabilitation-Sports Medicine (PMM) Plastic Surgery (PS) Plastic Surgery-Facial Plastic Surgery (FPS) Plastic Surgery-Head & Neck (PSH) Preventive Medical Toxicology (PTX) Proctology (PRO) Psychiatry (P) Psychiatry-Addiction (ADP) Psychiatry-Child Psychiatry (CHP) Psychiatry-Forensic Psychiatry (PFP) Psychiatry-Geriatric Psychiatry (PYG) Psychiatry-Pain Medicine (PPN) Psychiatry-Psychoanalysis (PYA) Psychiatry-Psychosomatic Medicine (PYM) Public Health/General Preventive Medicine (PHP) Pulmonary Critical Care Medicine (PCC) Pulmonary Disease (PUD) Radiation Oncology (RO) Radiology (R) Radiology-Abdominal Radiology (AR) Radiology-Cardiothoracic Radiology (CTR) Radiology-Diagnostic Radiology (DR) Radiology-Musculoskeletal Radiology(MSR) Radiology-Neuroradiology (RNR)
99
Radiology-Neuroradiology-Endovascular Surgical (ESN) Radiology-Nuclear Radiology (NR) Radiology-Pediatric Radiology (PDR) Radiology-Radiological Physics (RP) Radiology-Vascular & Interventional Radiology (VIR) Reproductive Endocrinology (REN) Rheumatology (RHU) Sclerotherapeutic Pain Management (SPMO) Sleep Medicine (SME) Spinal Cord Injury Medicine (SCI) Surgery-Abdominal (AS) Surgery-Colon & Rectal (CRS) Surgery-Cosmetic (CS) Surgery-Craniofacial Surgery (CFS) Surgery-Critical Care (CCS) Surgery-Dermatologic Surgery (DS) Surgery-General Surgery (GS) Surgery-Hand Surgery (HS) Surgery-Head & Neck Surgery (HNS) Surgery-Neurological Surgery (NS) Surgery-Neuroradiology-Endovascular Surgical (ESN) Surgery-Oral And Maxillofacial Surgery (OMF) Surgery-Pediatric Cardiothoracic Surgery (PCS) Surgery-Pediatric Neurological Surgery (NSP) Surgery-Pediatric Orthopedic Surgery (OP) Surgery-Pediatric Surgery (PDS) Surgery-Plastic Surgery (PS) Surgery-Surgical Oncology (SO) Surgery-Thoracic Surgery (TS) Surgery-Transplant Surgery (TTS) Surgery-Traumatic Surgery (TRS) Surgery-Urological Surgery (U) Surgery-Vascular Surgery (VS) Undersea Medicine and Hyperbaric Medicine (UM) Undersea and Hyperbaric Medicine-Emergency Medicine (UME) Urgent Care Medicine (UCM) Urology (U) Urology-Pediatric Urology (UP) Vascular Medicine (VM) Vascular Neurology (VN) Other Specialty (OS)
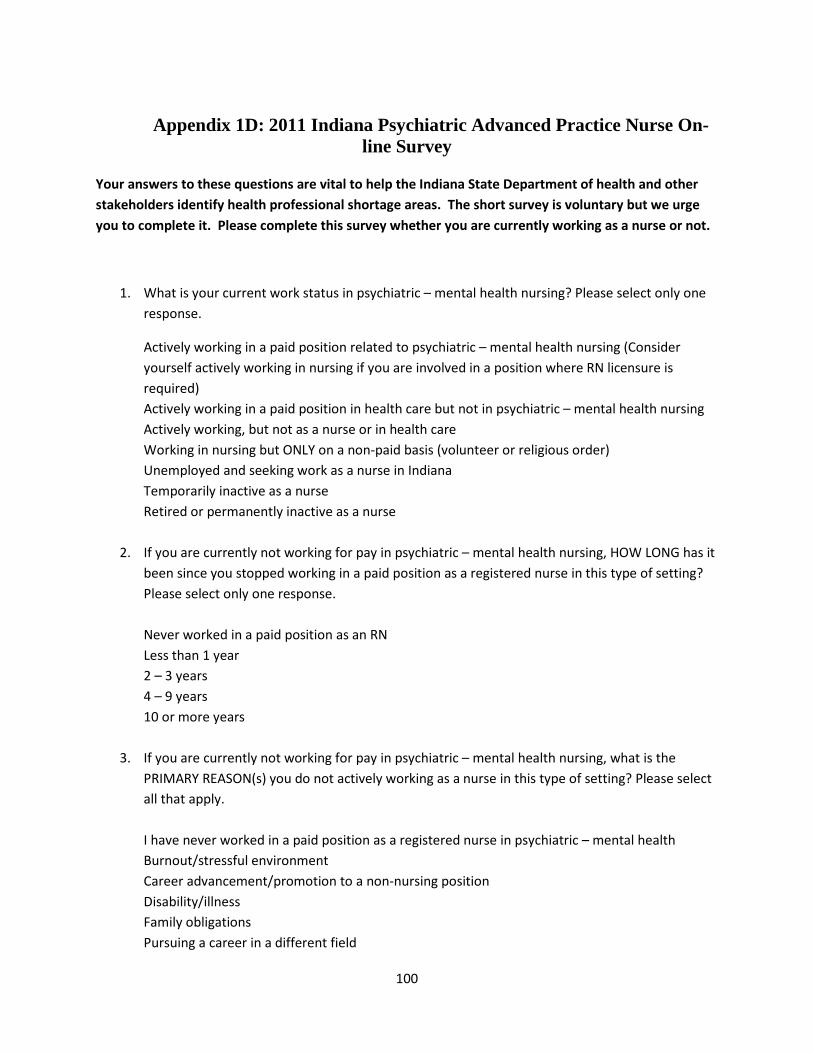
100
Appendix 1D: 2011 Indiana Psychiatric Advanced Practice Nurse On-
line Survey
Your answers to these questions are vital to help the Indiana State Department of health and other stakeholders identify health professional shortage areas. The short survey is voluntary but we urge you to complete it. Please complete this survey whether you are currently working as a nurse or not.
1. What is your current work status in psychiatric – mental health nursing? Please select only one response.
Actively working in a paid position related to psychiatric – mental health nursing (Consider yourself actively working in nursing if you are involved in a position where RN licensure is required) Actively working in a paid position in health care but not in psychiatric – mental health nursing Actively working, but not as a nurse or in health care Working in nursing but ONLY on a non-paid basis (volunteer or religious order) Unemployed and seeking work as a nurse in Indiana Temporarily inactive as a nurse Retired or permanently inactive as a nurse
2. If you are currently not working for pay in psychiatric – mental health nursing, HOW LONG has it been since you stopped working in a paid position as a registered nurse in this type of setting? Please select only one response. Never worked in a paid position as an RN Less than 1 year 2 – 3 years 4 – 9 years 10 or more years
3. If you are currently not working for pay in psychiatric – mental health nursing, what is the PRIMARY REASON(s) you do not actively working as a nurse in this type of setting? Please select all that apply. I have never worked in a paid position as a registered nurse in psychiatric – mental health Burnout/stressful environment Career advancement/promotion to a non-nursing position Disability/illness Family obligations Pursuing a career in a different field
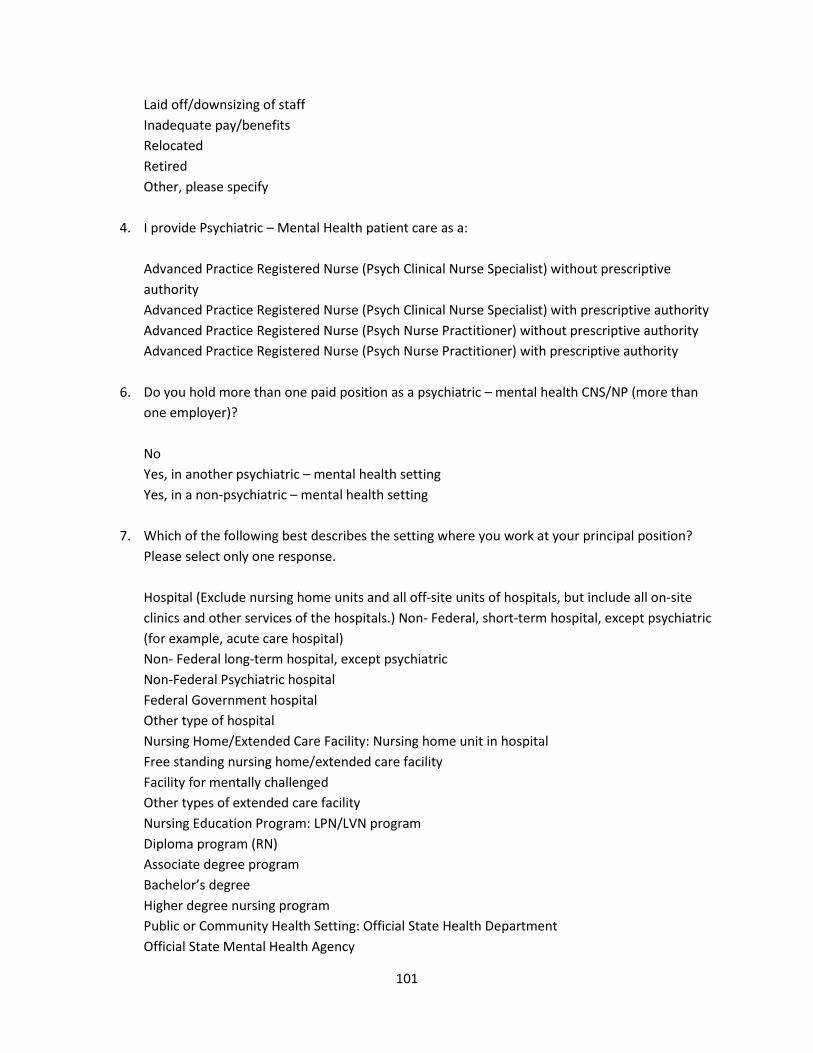
101
Laid off/downsizing of staff Inadequate pay/benefits Relocated Retired Other, please specify
4. I provide Psychiatric – Mental Health patient care as a: Advanced Practice Registered Nurse (Psych Clinical Nurse Specialist) without prescriptive authority Advanced Practice Registered Nurse (Psych Clinical Nurse Specialist) with prescriptive authority Advanced Practice Registered Nurse (Psych Nurse Practitioner) without prescriptive authority Advanced Practice Registered Nurse (Psych Nurse Practitioner) with prescriptive authority
6. Do you hold more than one paid position as a psychiatric – mental health CNS/NP (more than one employer)? No Yes, in another psychiatric – mental health setting Yes, in a non-psychiatric – mental health setting
7. Which of the following best describes the setting where you work at your principal position? Please select only one response. Hospital (Exclude nursing home units and all off-site units of hospitals, but include all on-site clinics and other services of the hospitals.) Non- Federal, short-term hospital, except psychiatric (for example, acute care hospital) Non- Federal long-term hospital, except psychiatric Non-Federal Psychiatric hospital Federal Government hospital Other type of hospital Nursing Home/Extended Care Facility: Nursing home unit in hospital Free standing nursing home/extended care facility Facility for mentally challenged Other types of extended care facility Nursing Education Program: LPN/LVN program Diploma program (RN) Associate degree program Bachelor’s degree Higher degree nursing program Public or Community Health Setting: Official State Health Department Official State Mental Health Agency
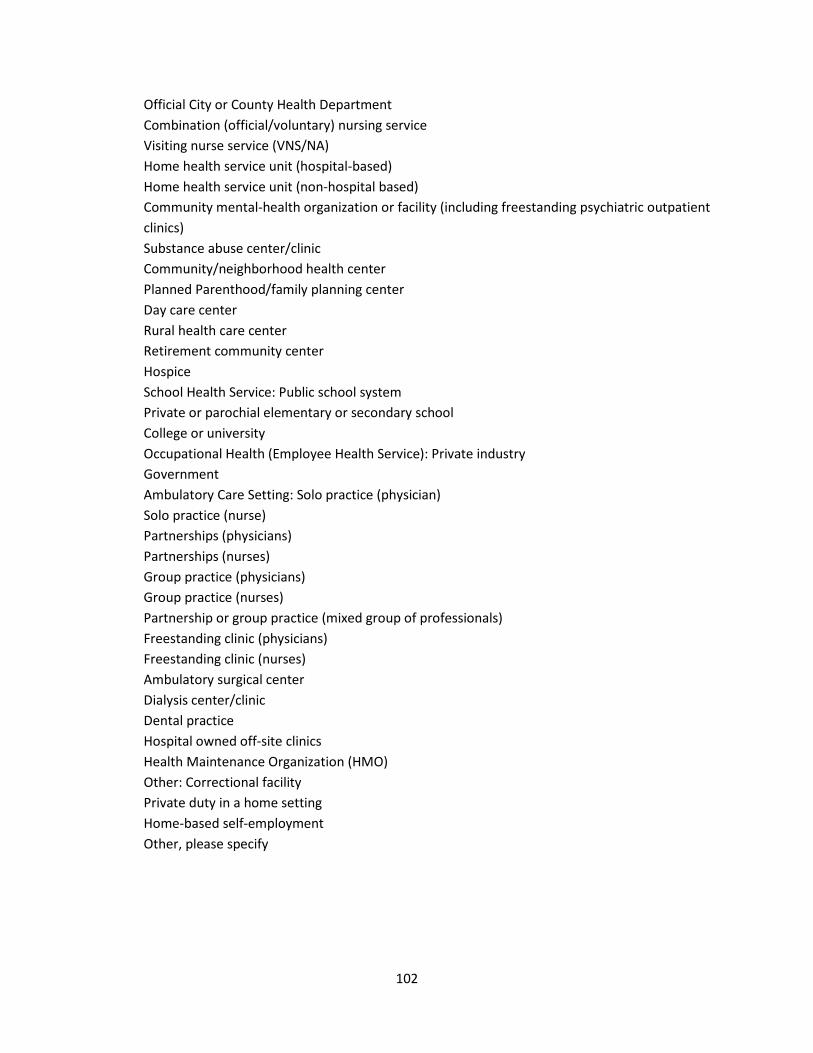
102
Official City or County Health Department Combination (official/voluntary) nursing service Visiting nurse service (VNS/NA) Home health service unit (hospital-based) Home health service unit (non-hospital based) Community mental-health organization or facility (including freestanding psychiatric outpatient clinics) Substance abuse center/clinic Community/neighborhood health center Planned Parenthood/family planning center Day care center Rural health care center Retirement community center Hospice School Health Service: Public school system Private or parochial elementary or secondary school College or university Occupational Health (Employee Health Service): Private industry Government Ambulatory Care Setting: Solo practice (physician) Solo practice (nurse) Partnerships (physicians) Partnerships (nurses) Group practice (physicians) Group practice (nurses) Partnership or group practice (mixed group of professionals) Freestanding clinic (physicians) Freestanding clinic (nurses) Ambulatory surgical center Dialysis center/clinic Dental practice Hospital owned off-site clinics Health Maintenance Organization (HMO) Other: Correctional facility Private duty in a home setting Home-based self-employment Other, please specify
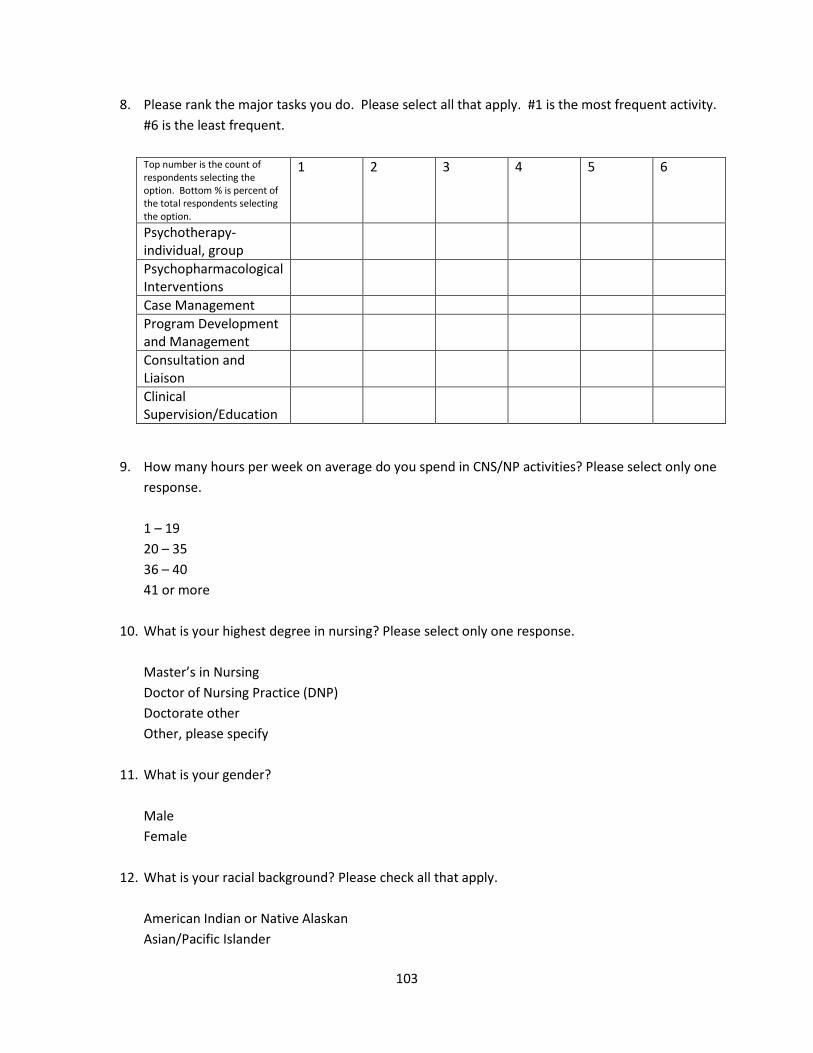
103
8. Please rank the major tasks you do. Please select all that apply. #1 is the most frequent activity. #6 is the least frequent. Top number is the count of respondents selecting the option. Bottom % is percent of the total respondents selecting the option.
1 2 3 4 5 6
Psychotherapy- individual, group
Psychopharmacological Interventions
Case Management Program Development and Management
Consultation and Liaison
Clinical Supervision/Education
9. How many hours per week on average do you spend in CNS/NP activities? Please select only one response. 1 – 19 20 – 35 36 – 40 41 or more
10. What is your highest degree in nursing? Please select only one response. Master’s in Nursing Doctor of Nursing Practice (DNP) Doctorate other Other, please specify
11. What is your gender? Male Female
12. What is your racial background? Please check all that apply. American Indian or Native Alaskan Asian/Pacific Islander
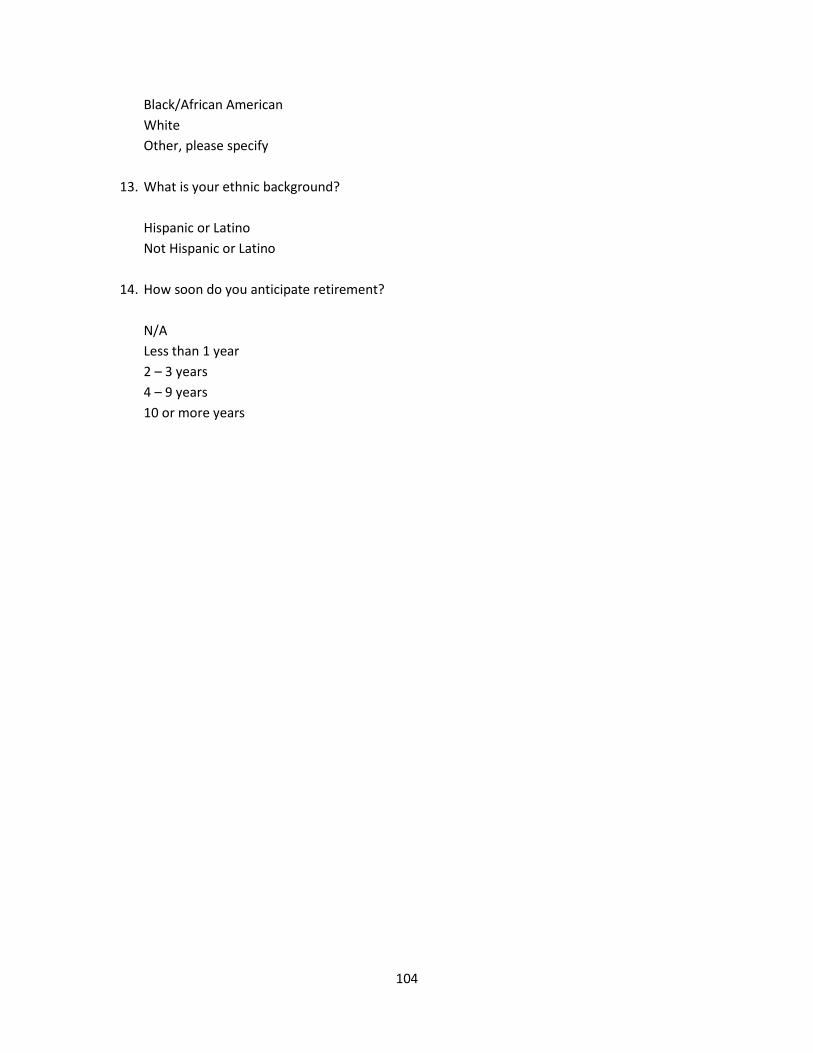
104
Black/African American White Other, please specify
13. What is your ethnic background? Hispanic or Latino Not Hispanic or Latino
14. How soon do you anticipate retirement? N/A Less than 1 year 2 – 3 years 4 – 9 years 10 or more years
Recommended