1
Working paper Series
WPS No 812/August 2018 Impact of entrepreneurship on objective and subjective economic markets:
A longitudinal study from India
Saravana Jaikumar *
Indian Institute of Management Calcutta
(* corresponding author)
Shantanu Dutta
Dave and Jeanne Tappan Chair in Marketing
Marshall School of Business
University of Southern California
Arun Sreekumar
University of Illinois at Urbana Champaign
Madhu Viswanathan
Diane and Steven N. Miller Centennial Chair in Business
University of Illinois at Urbana Champaign
Indian Institute of Management Calcutta
Joka, D H Road
Kolkata 700104, INDIA
URL: http://facultylive.iimcal.ac.in/workingpapers

2
Impact of entrepreneurship on objective and subjective economic wellbeing in emerging
markets: A longitudinal study from India
Saravana Jaikumar *
Indian Institute of Management Calcutta
(* corresponding author)
Shantanu Dutta
Dave and Jeanne Tappan Chair in Marketing
Marshall School of Business
University of Southern California
Arun Sreekumar
University of Illinois at Urbana Champaign
Madhu Viswanathan
Diane and Steven N. Miller Centennial Chair in Business
University of Illinois at Urbana Champaign

3
Impact of entrepreneurship on objective and subjective economic wellbeing in emerging
markets: A longitudinal study from India
Abstract
Although research in entrepreneurship has examined its pecuniary and non-pecuniary benefits in
advanced economies, the rewards of entrepreneurship are under-researched in emerging
economies, as is a focus on the household as the unit of analysis. We study the relationship
between entrepreneurship and objective (household income and consumption) and subjective
economic wellbeing in emerging markets, where a majority of entrepreneurs belong to
households that have low to middle income. Using unique panel data of Indian households, we
find that starting an enterprise in these markets can lead to multiple benefits for a household,
such as positive effects on household income, household consumption, and subjective
assessment of economic wellbeing.
Keywords: emerging market, entrepreneurship, economic wellbeing, subjective economic
wellbeing, entrepreneurship and development, India human development survey
JEL Codes: D12 (Consumer Economics: Empirical Analysis), I31 (General Welfare, Well-
Being), J24 (Human Capital • Skills • Occupational Choice • Labor Productivity), L26
(Entrepreneurship)
4
1. Introduction
In recent years, research on entrepreneurship has shifted from a focus on the personality
of entrepreneurs to a focus on the entrepreneurial process as an interaction of situational, social,
cultural and economic factors. In this light, studies have given importance to both the pecuniary
gains (e.g. Hamilton, 2000) and non-pecuniary rewards (e.g. Hurst and Pugsley, 2011) from
entrepreneurship. However, research in this domain has focused on entrepreneurs in advanced
economies with less focus on emerging markets (e.g. Viswanathan et al., 2010). Emerging
markets are becoming major economic forces globally, and entrepreneurship has a crucial role in
their economic development (Bruton et al., 2008). A unique feature of emerging markets is that
the majority of entrepreneurs belong to low to middle income categories (Gindling and
Newhouse, 2014; Prahalad, 2005), and the objective and subjective economic wellbeing of the
households are closely tied to entrepreneurship. However, there is paucity of research that
examines this multifaceted nature of economic gains from entrepreneurship, particularly in
emerging markets, and with households as the unit of analysis.
Prior work on financial rewards to entrepreneurship has predominantly used measures
such as self-employment income (e.g. Blanchflower and Shadforth, 2007). However,
entrepreneurial rewards are multidimensional and self-employment income estimates may not
accurately capture the benefits (Carter, 2010). There is also a rich literature in the context of
developed economies that has explored non-pecuniary benefits of entrepreneurship such as job
satisfaction, autonomy, flexibility and upward mobility of the individual entrepreneurs (Astebro
et al., 2014; Blanchflower, 2004; Blanchflower and Oswald, 2004; Shane, 2008; Wasserman,
2017; Quadrini 2000) and positive effect of entrepreneurship on household savings (Gentry and

5
Hubbard, 2004). In this light, it is argued that the economic gains from starting an enterprise
should encompass the subjective economic outcomes (e.g. higher living standards, sense of
economic well-being) in addition to the immediate and objective economic gains from
entrepreneurship (Carter, 2010). As discussed above, in the context of emerging economies,
entrepreneurship is a means for improving household wellbeing, both objective economic
wellbeing (i.e., income and consumption) and subjective economic wellbeing. To our knowledge
there is virtually no empirical research in the context of emerging markets that has explored how
starting an enterprise impacts the objective and subjective wellbeing of the household.
However, research on non-pecuniary benefits of entrepreneurship is limited to the various
spheres of job satisfaction and autonomy, and not extended to examine overall household
subjective wellbeing.
From the household’s perspective in emerging markets, entrepreneurship is a means for
not just better income, but also to meet the imminent consumption needs of the households.
Using a household panel data from India, and examining the relationship between starting
an enterprise and household income, consumption, and subjective economic wellbeing, we
contribute to the literature on entrepreneurship in emerging markets and also to the
entrepreneurship literature in general. We argue that starting an enterprise in these markets can
lead to objective and subjective economic benefits for a household. We find that starting an
enterprise has a positive effect on household income and consumption. We also demonstrate that
starting an enterprise can enhance the subjective perception that the household is economically
faring better, even after accounting for the economic gains associated with entrepreneurship.
Further, we examine the economic rewards of entrepreneurship to low income households, where

6
the primary motivation of entrepreneurship is the ‘necessity’ of meeting household consumption
needs (Viswanathan et al., 2010; Reynolds et al., 2001). We find that the positive effects of
entrepreneurship on objective and subjective economic wellbeing are relatively higher for low
income households.
The rest of the paper is organized as follows. We first provide a brief overview of the key
features of entrepreneurship in emerging markets and develop hypotheses on the effect of
starting an enterprise on objective (income and consumption) and subjective indicators of
economic wellbeing in these markets. Next, we present the empirical methodology and results.
Finally, we discuss the theoretical and practical implications of our findings.
2. Conceptual Background and Hypotheses Development
Emerging markets are low income countries that are growing rapidly through economic
liberalization (Hoskisson et al., 2000). Due to the transitionary nature of their economic system,
emerging markets have high institutional uncertainties and a relatively higher proportion of low
to middle income households compared to developed countries (Tracey and Phillips, 2011).
Under such conditions, entrepreneurship is one of the preferred types of employment in
emerging markets (Peng, 2001). This has been highlighted in the literature on the ‘bottom of the
pyramid’ (e.g. Prahalad, 2005), and subsistence marketplaces and informal markets (e.g.
Viswanathan et al., 2010). Further, a study on self-employment revealed that nearly half the
workers are self-employed, and three quarters of these self-employed workers are from low
income households (Gindling and Newhouse, 2014).

7
In low income settings, the primary motivation of starting a business is to address the
socio-economic challenges of the entrepreneur’s household (Tobias et al., 2013) – hence called
‘necessity entrepreneurship’ by Reynolds et al. (2001). In this vein, scholars argue that the
economic gains from starting an enterprise should encompass the overall effect on the household
and living standards, and not just the immediate economic gains from entrepreneurship (Carter,
2010). As for economic gains, entrepreneurship has been shown to positively influence
household savings (Gentry and Hubbard, 2004), upward mobility (Quadrini, 2000) and
consumption (Ruben, 2001). However, economic rewards from entrepreneurship are
multifaceted, involving both objective and subjective benefits to the entrepreneur’s household.
Hence, to better understand the economic rewards from entrepreneurship, examining the effects
at the household level has become crucial (Granovetter and Swedberg, 1992).
A majority of businesses in emerging markets are small businesses, owned by an
individual or a family. In such family owned small businesses, the traditional firm-level goal of
profit-maximizing is coupled with social goals (Wheelock and Baines, 1998). Hence, the
behaviors of such firms typically lie at the intersection of the household and the market
(Wheelock and Mariussen, 1997). This view has long held support in family business literature,
that have consistently stated that it is more prudent to focus on the household than the individual
entrepreneur as a unit of economic behavior (Ram et al, 2000; Sieger et al., 2011). Further,
scholars have argued for a family-embeddedness perspective for entrepreneurship research in
general, to denote the involvement and interaction of household members in the business
(Aldrich and Cliff, 2003; Pearson et al., 2008). The household of an entrepreneur is considered a
setting where tradition, values and economic rationality are combined – thereby blurring the
boundaries between the business and personal lives of entrepreneurs (Brannon et al., 2013). As a

8
consequence of blurred boundaries, decision making and formulating business strategy often
require the involvement of household members (Alsos et al., 2014). Appreciating the
multifaceted nature of economic wellbeing in emerging markets and the significance of the
business-household relationship, we develop hypotheses on the effects of starting an enterprise
on income, consumption and subjective economic wellbeing at the household level.
2.1 Starting an Enterprise and Household Income
Empirical research in advanced economies suggests that income from self-employment is
lower than for salaried individuals (e.g., Hamilton, 2000; Moskowitz and Vissing-Jorgensen,
2002). However, individuals are reported to prefer self-employment employment due to the non-
pecuniary benefits of being an entrepreneur (Benz and Frey, 2006; Schjoedt, 2009). In emerging
markets, however, the main motivation for starting a business is self-employment, as there is a
lack of opportunities for earning an income (Acs, 2006). A large segment of these business
owners are from low and middle income groups. In these groups, the decision to start an
enterprise emerges from the necessity to meet income needs of the household rather than to seize
business opportunities in the market, resulting in a reduction of unemployment rate (Audretsch
and Thurik, 2000). At the macro-economic level, small business ownership leads to wealth
creation and consequent economic growth in transition economies (Peng, 2001). Hence, in
emerging markets, we hypothesize that even at the micro-economic level of the household,
starting an enterprise will lead to an increase in household income.
H1a: Household income increase will be greater for households starting an enterprise in
comparison with households that do not.

9
Among low income households, engaging in entrepreneurship is often the result of
resource constraints and the lack of other income generating opportunities such as salaried
positions (Prahalad, 2005; Venugopal et al., 2015). As noted earlier, this has been termed as
‘necessity entrepreneurship’, born out of the necessity to maintain the income and consumption
needs of the household. A special issue of World Development on ‘Rural Nonfarm Employment
and Incomes in Latin America’ showed a consistent, positive relationship between non-farm self-
employment, and household income in low income groups (Berdegué et al., 2001; Deininger and
Olinto, 2001; Lanjouw, 2001; Reardon et al., 2001). The authors in this special issue note several
reasons for the positive relationship between entrepreneurship and household income. One of the
primary reasons is the opportunity that entrepreneurship provides for household income
diversification (Reardon, 1997). Many households in the lower and middle income categories in
emerging markets are ‘pluriactive’ in terms of occupation (De Silva and Kodithuwakku, 2011),
and entrepreneurship allows for a greater diversification of the occupational portfolio and income
of a household (Alsos et al., 2011). Therefore, we hypothesize that the relationship between
entrepreneurship and household income to be stronger for relatively lower income levels.
H1b: Relatively lower income households who start an enterprise will have greater
increase in household income when compared to relatively higher income households
who start an enterprise.
2.2 Starting an Enterprise and Household Consumption
The broad relationship between entrepreneurship and consumption was made by
Bradbury (1996), who observed that entrepreneurial households have greater consumption
capability by subsidizing household expenditure due to consumption of business-related goods.

10
Bradbury (1996) also presents one of the few studies that link business ownership to a better
quality of life due to increased consumption capability among households. The author uses the
household as the unit of analysis of the outcome of business ownership, attributing increased
consumption capability to the personal consumption of business-related goods. As noted earlier,
household consumption and entrepreneurship in emerging markets are intertwined. In
marketplaces with resource constraints, a key motivation of starting a business is to overcome
the economic challenges of the entrepreneur’s household, such as meeting household
consumption needs. Alsos et al. (2014) also make the point that, due to permeable boundaries
between the business and the household, there is active resource sharing between the two – with
regard to earnings, wealth, expenditure and consumption. Therefore, we predict a positive
relationship between starting an enterprise and household consumption.
H2a: Household consumption increase will be greater for households starting an
enterprise when compared to households that do not.
We suggest this effect will be accentuated for households with relatively lower income
when compared to higher income households. Research has shown that chronic and periodic
consumption constraints influence entrepreneurial intentions. Specifically, lower income
households have higher entrepreneurial intention in order to overcome consumption constraints
(Venugopal et al., 2015). Income diversification with non-farm entrepreneurship has also been
found to result in greater generation of cash income and resultant increase in food consumption,
when compared with households depending on farm-based livelihoods among low income
households (Barrett et al., 2001). The strong relation between the propensity to consume and life
satisfaction in low income households was explained by Duesenberry (1949). The concept of

11
‘utility’ derived from consumption reflecting overall wellbeing was observed by Deaton and
Muellbauer (1980), who also state that the utility function of consumption may be higher for
households with income constraints.
H2b: Relatively lower income households who start an enterprise will have greater
increase in household consumption when compared to relatively higher income
households who start an enterprise.
2.3 Starting an Enterprise and Household Subjective Economic Wellbeing
Subjective economic wellbeing, or an individual’s perception of his or her economic
situation and satisfaction (Kahneman et al., 1999), goes beyond measurement of income
(Devicienti and Gualtieri, 2007; Fusco, 2016). In the case of entrepreneurship, subjective
satisfaction of the entrepreneur has been explored from a human-resources perspective, in
addition to the realm of monetary benefits. Researchers argue that even when the monetary
benefits of small business ownership may be low, other benefits such as individual autonomy
and job satisfaction may make up for the low earnings (Blanchflower, 2004; Blanchflower and
Oswald, 2004; Shane, 2008). Several studies show that a better sense of wellbeing among
business owners may be attributed to the flexibility and autonomy permitted by being ‘one’s own
boss’ (Astebro et al., 2014; Benz and Frey, 2008; Hamilton, 2000; Hurst and Pugsley, 2011;
Shane and Venkataraman, 2000; Wasserman, 2017). This is in line with studies that show
entrepreneurs reporting higher levels of job satisfaction, irrespective of income differences
between entrepreneurs and other occupational groups (Blanchflower and Oswald, 2004; Shane
and Venkataraman, 2000).

12
Subjective economic benefits of entrepreneurship in low and middle income households
may extend beyond parameters such as flexibility in work hours and autonomy. Dolan et al.
(2008) note that whereas there is a positive relationship between income and wellbeing, there
may be a range of other variables that influence this relationship. We suggest that households in
emerging economies will have both objective and subjective economic gains from starting an
enterprise. Households that start an enterprise are more likely to report that their household is
better economically both for material reasons such as higher levels of income and consumption;
and for psychological reasons such as greater autonomy and control. In these markets, one of the
primary motivations of starting an enterprise is to enhance household income and to meet
consumption needs. Both increased income and higher consumption have been shown to have a
positive impact on the subjective evaluation of one’s satisfaction (Deaton and Muellbauer, 1980;
Douthitt et al., 1992). We hypothesize that, compared to households that do not start an
enterprise, households that start an enterprise will derive a higher subjective sense of economic
wellbeing even after controlling for increase in income and consumption. Thus, independent of
material benefits, there are psychological benefits to households in emerging markets.
H3a: Households that start an enterprise will have improved subjective economic
wellbeing in comparison to households that do not start an enterprise, after controlling for
income and consumption.
We further suggest that the subjective wellbeing effect will be higher for lower income
households. At a macro level, the role of entrepreneurship in leading to growth and reduced
inequality have been studied (Kimhi, 2010). In emerging markets, entrepreneurship also serves
as a livelihood strategy that enables the entrepreneur to diversify income and meet the

13
consumption needs of the household (De Silva and Kodithuwakku, 2011; Reardon, 1997).
Additional economic activities, such as starting an enterprise, may help alleviate poverty and
bring in several social transformations – a phenomenon termed as ‘transformative
entrepreneurship’ in prior research (Sridharan et al., 2014; Tobias et al., 2013). In their research,
Tobias et al. (2013) show how economic wellbeing may depend on factors such as social trust,
going beyond income and consumption. Clark et al. (2008) compared the regression of slopes of
happiness on income in developed economies and developing countries and found a positive
estimated coefficient on income. Interestingly, they find that the slope is steeper for developing
countries than for developed countries, suggesting a stronger relationship. Households with
income constraints have been shown to obtain greater utility from consumption, and hence a
higher sense of wellbeing (Deaton and Muellbauer, 1980). Hence, we hypothesize the positive
effects of starting an enterprise on subjective economic wellbeing to be relatively higher for low
income households.
H3b: Relatively lower income households who start an enterprise will have more
improved subjective economic wellbeing when compared to relatively higher income
households who start an enterprise, after controlling for income and consumption.
3. Method
3.1 Datasets
To test our hypotheses, we analyse a comprehensive, longitudinal household database. In
2004, University of Maryland and the National Council of Applied Economic Research
organized and conducted a nationally representative survey of Indian households. Entitled the

14
India Human Development Survey (IHDS), it covers 42,554 households across all the 33 states
and union territories (Desai et. al, 2005). In 2011, IHDS II was conducted and majority of the
households interviewed in 2004 (83%) were re-interviewed (Desai and Vanneman, 2011). We
merged the two surveys, and excluded the households that had split in 2011, to create a panel of
34,621 households. Further, we also used the deflators1 specified in IHDS II to convert all
amounts (income and expenses) in 2011 to 2004 values.
The waves of the survey captured a number of variables - whether the household
members owned an enterprise (of any scale) and if so, the details, including revenues, expenses,
net income and the list of household members participating in the business. Using data from both
survey waves, we retained a subset of households that match the following criteria – i)
households that did not report an enterprise in 2004 and 2011 (henceforth referred to as ‘non-
entrepreneur households’ – the control group) and ii) households that did not report an enterprise
in 2004, but reported at least one enterprise in 2011 (henceforth, ‘entrepreneur households’ – the
treatment group). In other words, households in both control and treatment groups did not run an
enterprise in 2004. However, by 2011, the households in the treatment group had started an
enterprise2. There were 3,496 households in the treatment group that contribute 6,992
observations and 23,965 households in the control group that contribute 47,930 observations.
1 Income and consumption expenses in 2011 survey data were converted to 2004 values using deflators. The
deflators are based on CPI (Consumer Price Index) and are month adjusted. 2 Due to the limitations of the data, it is not possible to ascertain the exact year when an enterprise was started by a
household. We use the term, “starting an enterprise”, to refer to initiation of a business or an entrepreneurship
initiative by a household between 2004 and 2011.

15
3.2 Operationalization of Key Variables
3.2.1 Household income. Total annual household income was computed based on
responses to approximately 50 items in each of the survey waves3. We used the log of the total
annual household income as an outcome variable.
3.2.2 Monthly consumption. IHDS covers detailed consumption information (47
categories in 2004 and 52 in 2011) at the household level. The total monthly consumption is
estimated and included in the IHDS dataset based on responses to these consumption related
items in the questionnaires4. We used the log of the total monthly consumption as another
outcome variable.
3.2.3 Subjective economic wellbeing. Whereas conventional measures of subjective
wellbeing (Dolan et al., 2008; Helliwel et al., 2015) are operationalized as satisfaction with life,
or happiness, subjective economic wellbeing requires a more direct approach to assess changes
in evaluation of respondent’s economic conditions. Subjective economic wellbeing has been
operationalized through a variety of methods such as evaluating one’s own income or difficulty
in making ends meet (Cracolici et al., 2013). Subjective economic wellbeing has also been
measured by asking respondents to self-report the rung of income they belong to: wherein the
poor are the first rung and the rich are the ninth rung (Ravallion and Lokshin, 2002). For the
India household survey database that we analyze, individuals were asked if they are better, the
same, or worse off compared to some years ago. Prior research has used similar
3 Total annual income was calculated from several sources including, agricultural wages, nonagricultural wages,
business income, agricultural income, remittances, income from property and so on. 4 Monthly consumption expenses are computed based on the household’s expenses on items such as food (rice,
wheat, sugar, etc), medical expenses, education expenses, entertainment expenses, expenses on personal goods,
expenses on durables, etc.

16
operationalization (e.g. Jaikumar et al., 2017) and a number of barometers also use a similar
approach (Dugan, 2014; Eurobarometer, 2017). In 2011, the head of all households surveyed
were asked: ‘Compared to 7 years ago, would you say your household is economically doing the
same, better, or worse today’. The same question was also asked in 2004, but respondents were
asked to evaluate themselves compared to 1994. The responses were coded as 1 - worse, 2 -
same and 3 – better, increasing order of Subjective Economic Wellbeing (SEWB).
3.2.4 Control variables. IHDS has detailed information on household composition and
demographics in 2004 and 2011 enabling us to account for several household level
characteristics in our analysis. Specifically, we control for composition of the household (number
of adults and children in the household) and the literacy level (based on the number of years of
education of the most literate adult in the household). The number of adults in the household and
the literacy level may act as proxy for the earning potential of the household. Further, we also
account for number of children in the household, by adding them as a separate control variable.
We also control for the location of the household (urban / rural), as the increased opportunities in
the urban areas may have an effect on the decision to start an enterprise. Finally, we also include
social group to which the household belongs5, to account for any potential differences in
opportunities among the social groups.
3.3 Descriptive Measures
The descriptive measures of the key variables in the control and treatment groups are
presented in Table 1. We also present some stylized facts from our data to illustrate how starting
5 The sample is divided into seven social groups (exclusive) – Brahmins, forward castes, other backward classes,
Dalits, Adivasis, Muslims and Christians, Sikhs and Jains.

17
an enterprise has an impact on income, consumption and SEWB in 2011 (Table 2). Consistent
with our hypotheses, percentage increases in income, consumption and SEWB are higher for the
treatment group. For instance, income increases by 86.8% for the treatment group (entrepreneur
households) in 2011 whereas the increase is 42.6% for the control group (non-entrepreneur
households).
[Insert Tables 1 and 2 here]
We also note that, in 2004, though the control and treatment groups did not have an
enterprise, there were differences between the two groups. The average income (annual) of the
treatment group in 2004 was Rs. 52,518 whereas that of the control group was Rs. 45,561.
Similarly, consumption (monthly) in 2004 was also higher for the treatment group (Rs. 4,542)
compared to the control group (Rs. 3,812). The descriptive measures suggest that households
with relatively higher income are more likely to start an enterprise. We address the issues of
comparability of the two groups in our empirical analysis using propensity score matching.
We also classify the households in our sample into either relatively lower income or
higher income group in 2004. Specifically, we use a state level6 median split using the household
income information in 2004. Within a state, if income for a specific household in 2004 was lower
than the median, we classify it as a relatively lower income household and vice versa. This
classification enables us to estimate whether starting an enterprise had a differential impact on
relatively lower versus higher income households (in terms of income, consumption and SEWB).
The state level median incomes in 2004 range from a minimum of Rs. 16,877 (Orissa) to a
6 India was comprised of 28 states and 7 union territories at the time of the surveys (currently India has 29 states and
7 union territories). Data was captured from 28 states and 5 union territories (2 union territories – Andaman and
Nicobar, and Lakshadweep - are islands and were not covered in the surveys). We refer to these states and union
territories as ‘states’, and hence, the survey has data from 33 states.

18
maximum of Rs. 105,450 (Mizoram), with the median of the state level median incomes being at
Rs. 33,520 (Rajasthan).
3.4 Income and Consumption - Panel Fixed-Effects Regression
We begin our analysis with panel fixed-effects regression to estimate the average effect
of starting an enterprise on household income and consumption. There are several reasons for
using a panel fixed-effects model in our estimation. First, using a fixed-effects model enables us
to account for household specific time-invariant factors in the estimation. Second, having
household-level time-varying variables allow us to control for a number of confounding factors,
such as composition of the household (number of adults and children in the household) and
literacy level (based on the number of years of education of the most literate adult in the
household). These household level variables control for unobservable factors that could affect
the likelihood of starting an enterprise or household earning potential, among others. Finally, we
also include several fixed effects such as social group-year fixed effects, location-year fixed
effects (urban/rural) and state-year fixed effects to account for extrinsic confounding factors
whose effect may vary with time7. We begin by estimating the average effect of starting an
enterprise on household income and consumption, using the control and treatment groups
identified earlier. We estimate the following fixed-effects panel regression:
Eqn. (1) Y𝑖𝑡 = 𝛽0 + 𝛽1𝑌𝑒𝑎𝑟𝑡 + 𝛽2𝑇𝑟𝑒𝑎𝑡𝑖 + 𝛽3(𝑌𝑒𝑎𝑟 ∗ 𝑇𝑟𝑒𝑎𝑡)𝑖𝑡 + 𝛽3𝐻𝐻𝑖𝑡 + 𝛼𝑖 + 휀𝑖𝑡
where i = 1,..27,461 households, t= 1,2 (panel time period: 1 – 2004 and 2 - 2011), Yit refers to
the outcome variable – log(income) or log(consumption), Yeart takes the value of 0 in 2004 and
7 State-year fixed effects account for policy changes at the state level that may have an impact on the decision to
start an enterprise. Similarly, location-year and social group-year fixed effects account for the effect of opportunities
and/or discrimination against specific groups of households.

19
1 in 2011, Treati takes the value of 1 if household i belongs to the treatment group or 0
otherwise, HHit refers to a vector of covariates which represent the household characteristics
(number of adults, number of children, highest education) and αi refers to the time-invariant
household specific fixed-effects that are accounted for in a panel fixed-effects regression. The
coefficient of interest is β3 (coefficient of Year * Treat) which captures the average difference in
the outcome variable between the control and treatment groups in 2011 (when Year=1 and
Treat=1). We include several additional fixed effects to Eqn.(1): state-year fixed effects, urban-
year fixed effects and social group-year fixed effects (to account for time-varying state specific,
location specific and social group specific effects on the decision to start an enterprise).
Finally, to identify whether starting an enterprise had a differential effect on income and
consumption for the lower income group (compared to the higher income group), we add an
interaction term (Year * Treat * LowIncomeGroup)it to Eqn. 1 and test the coefficient for
direction and significance (LowIncomeGroup takes the value of 1 when the income of household
i is below the state level median in 2004).
3.5 Subjective Economic Wellbeing – Ordered Probit Regression
SEWB in 2011 captures household perceptions of economic wellbeing compared to 2004.
Hence, to examine the effect of starting an enterprise on SEWB (i.e., to test H3a), we model the
relationship between SEWB and the treatment condition as a random-effects ordered probit
model. The three levels of SEWB have a clear hierarchy (worse, same, better). Ordered probit
models utilize this additional order information effectively in computing the likelihood of a
household to report each of these responses. Using a linear model (or a non-linear probit model)

20
would not effectively utilize the additional embedded order information in the response to
SEWB. Hence, we model the relationship as:
Eqn. (2) Pr(𝑦𝑖 > 𝑘|𝜅, 𝛿𝑥𝑖 , 𝑋𝑖,𝜗𝑖) = Ф(𝑇𝑟𝑒𝑎𝑡𝑖𝛽1 + 𝛿𝑥𝛽𝑖 + 𝑋𝑖𝛾𝑖 + 𝜗𝑖 − 𝜅𝑘 )
where i = 1,..27,461 households, yi is the SEWB of household i in 2011, and Treati takes the
value of 1 if household i belongs to the treatment group or 0 otherwise. δxi refers to the vector of
covariates that indicate the changes in xi in 2011 compared to 2004. Xi refers to the vector of
covariates that are used as additional control variables, ϑi are independent and identically
distributed with N(0, σ2ϑ), κ is a set of cutpoints κ1,… κK-1, where K is the number of possible
outcomes (in this case K=3 and hence there are only two cut-points – κ1 and κ2), and Ф(.) is the
standard normal cumulative normal distribution function. The response variable y, in this case,
may take one of three values (1, 2 or 3). We control for changes in income, consumption and
education levels (δxi), number of adult members and children, location of the household (urban /
rural), and SEWB reported in 2005 (Xi). We also account for state level effects and changes in
state mean incomes (as a proxy for statewide economic growth).
Finally, we add an interaction term (Treat * LowIncomeGroup)i to Eqn. 2 and test for
direction of effect and significance. The coefficient of this interaction term helps identify
whether starting an enterprise had a differential effect on SEWB for the lower income group
(compared to the higher income group).
3.6 Results
3.6.1 Effect of starting an enterprise on income – H1a and H1b. Results of the panel
fixed-effects regression (Eqn. 1), with log(income) as the outcome variable, are presented in
21
Table 3. The fourth column corresponds to the full model with all control variables. As
predicted, the coefficient of interest β3 (Year * Treat) is found to be consistently positive and
statistically significant (p < .001), supporting hypothesis H1a. Specifically, households in the
treatment group (households that started an enterprise) reported 17.4% higher income (based on
results in column 4) than those in the control group (households that did not start an enterprise).
The fifth column displays an added interaction term (Year * Treat * LowIncomeGroup)it. The
coefficient of the interaction term is found to be positive and significant (p < .05), supporting
hypothesis H1b. Results indicate that relatively lower income households that started an
enterprise had 7.1% higher income than relatively higher income households that started an
enterprise.
[Insert Table 3 here]
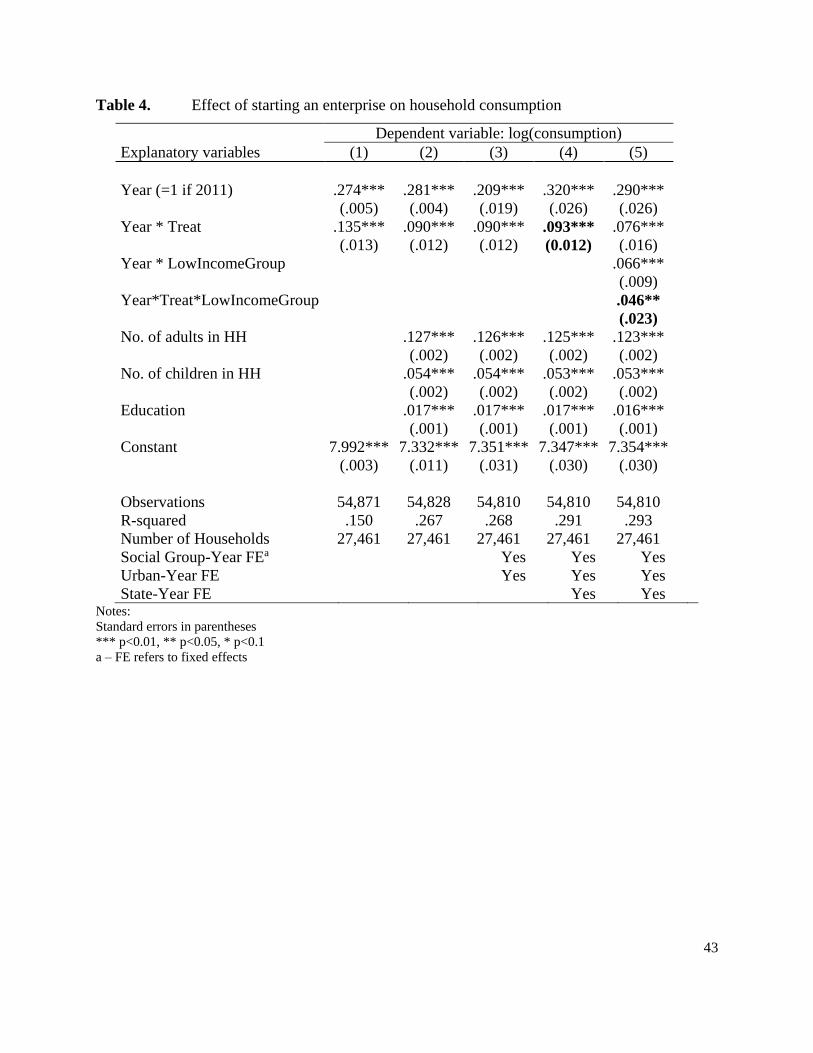
3.6.2 Effect of starting an enterprise on consumption – H2a and H2b. Results of the
panel fixed-effects regression (Eqn. 1), with log(consumption) as the outcome variable, are
presented in Table 4. As predicted, the coefficient of interest, β3 (Year * Treat) is found to be
consistently positive and statistically significant (p < .001), thus supporting hypothesis H2a.
Specifically, households in the treatment group (households that started an enterprise) spent
9.3% more on consumption than those in the control group (households that did not start an
enterprise). The coefficient of the interaction term (Year * Treat * LowIncomeGroup)it in column
5 (Table 4) is found to be positive and significant (p < .05), thus supporting hypothesis H2b.
Results indicate that relatively lower income households that started an enterprise had 4.6%
higher consumption expenses than relatively higher income households that started an enterprise.
[Insert Table 4 here]

22
3.6.3 Effect of starting an enterprise on SEWB – H3a and H3b. Results of the ordered
probit regression (Eqn. 2), with SEWB as the outcome variable, are presented in Table 5. The
fourth column presents the full model with all control variables. As expected the coefficient of
interest, β1 (Treat)i is found to be consistently positive and statistically significant (p < .001),
supporting hypothesis H3a. An examination of the marginal effects of starting an enterprise on
SEWB reveals that households that started an enterprise were 2.3% less likely to report ‘worse’
SEWB, 3.5% less likely to report ‘same’ SEWB, but 5.8% more likely to report ‘better’ SEWB,
compared to households that did not start an enterprise (all marginal effects are significant at
p<.05, and covariates are at mean levels). The fifth column presents results with an added
interaction term (Treat * LowIncomeGroup)i. The coefficient of the interaction term is found to
be positive and significant (p < .05), supporting hypothesis H3b. An analysis of marginal effects
reveals that, among the households that started an enterprise, relatively lower income households
were 3.1% less likely to report ‘worse’ SEWB, 3% less likely to report ‘same’ SEWB, but 6.1%
more likely to report ‘better’ SEWB (all marginal effects are significant at p<.05, and covariates
are at mean levels).
[Insert Table 5 here]
3.7 Robustness Checks: Comparability of Control and Treatment Groups – Propensity
Score Matching
Our dataset provides information regarding starting an enterprise, a decision which is
likely to be influenced by a number of observable and unobservable factors at the household
level. For instance, descriptive measures in Table 1 show that the control and treatment groups
differ in terms of income and consumption in 2004. This difference between the two groups

23
could potentially introduce a bias, i.e., on an average, households with relatively higher income
and consumption in 2004 were more likely to start an enterprise in the period between 2004 and
2011. In other words, household starting an enterprise between 2004 and 2011, start from
different baselines in 2004 than the households that did not start an enterprise during this time
period. Thus to address this issue and ensure that households that started an enterprise
(treatment) against those that did not (control) are comparable, we employ propensity score
matching (PSM).
In particular, we use a set of covariates to compute the propensity scores for each
household in the two groups (propensity score, here, refers to the likelihood of the household to
start an enterprise). The households in the control and treatment groups are then matched using
the propensity scores (Smith and Todd, 2008). After matching, the reduced sample (referred to as
the ‘matched sample’), the control and treatment groups will have similar distributions of the
covariates used to compute propensity scores. We then re-estimate Eqn. 1 and Eqn. 2 with the
matched sample to obtain unbiased effects of starting an entrepreneurship on income,
consumption and SEWB.
We use the following covariates to compute the propensity score of starting an enterprise
(treatment variable) for a household: income in 2004, total consumption in 2004, number of
adults in 2004, number of children in 2004, education in 2004, and location of the household
(urban vs. rural). We use probit function for computing propensity scores, applying a caliper of
.01 and ‘nearest neighbor’ matching (Dehejia and Wahba, 2002) for selecting households.
Further, we maintain the ratio of control to treatment as 2 (i.e., we identify two matching control
households for every treatment household, to fully utilize the large sample in the control group).

24
After matching, the average values of the covariates in the treatment and control groups are
presented in Table 6. In the matched sample, the two groups are comparable in terms of income,
consumption, household composition and education levels in 2004. The distribution of
propensity scores and the balance of covariates in the treatment and control groups are presented
in Figures 1a and 1b. Further, the average of the covariates in the matched control and treatment
groups are presented in Table 6. Overall, we find that the distribution of covariates are similar
and balanced in the two groups. In the matched sample, we have 20,752 observations (NTreatment=
3,469 and NControl= 6,907, over two periods). We argue that, given the similar distribution of
2004 values (in terms of income, consumption, household characteristics and not owning an
enterprise) in the control and treatment groups, the only observed difference after 2004 is that the
treatment group has started an enterprise (sometime between 2004 and 2011). This enables us to
account for the bias introduced by differences between the two groups in 2004 and estimate the
impact of starting an enterprise.
[Insert Figure 1 here]
[Insert Table 6 here]
3.7.1 Effect of starting an enterprise on income and consumption. We re-estimate
Eqn. 1 using the matched sample, and with log(income) and log(consumption) as outcome
variables. Results of the panel fixed-effects regression using the matched sample are presented in
Table 7. In the matched sample, starting an enterprise is associated with an increase in household
income of 15.6% (coefficient of Year*Treat is significant at p<.05, in column 1 of Table 7),
supporting H1a. Further, among the households that started an enterprise, relatively lower
income households had 8.5% higher income (coefficient of Year*Treat*LowIncomeGroup is

25
significant at p<.05, in column 2 of Table 7), supporting H1b. Similarly, we find support for H2a
when we use the matched sample – starting an enterprise is associated with an increase in
household consumption by 11.2% (p<.05). However, H2b is not supported in the matched
sample (coefficient of Year*Treat*LowIncomeGroup is insignificant, in column 4 of Table 7).
[Insert Table 7 here]
3.7.2 Effect of starting an enterprise on SEWB. As we describe earlier, SEWB in 2011
captures household perceptions of economic wellbeing compared to 2004. To ensure consistency
with hypotheses 3a and 3b, our estimations have to demonstrate that starting an enterprise has a
positive effect on the perception of household economic wellbeing even after controlling for
income and consumption. In the probit results reported earlier in Table 5, we demonstrate that
effect by controlling for changes in household income, consumption and education levels (δxi),
number of adult members and children, location of the household (urban / rural), and SEWB
reported in 2005 (Xi), in equation 2.
We now undertake two additional robustness checks to further demonstrate that starting
an enterprise has a positive effect on the perception of household economic wellbeing even after
controlling for income and consumption. Specifically, we use two matching strategies to
examine the effect of starting an enterprise on SEWB. In the first robustness test, we use the
same set of covariates used earlier (household income in 2004, total consumption in 2004,
number of children in 2004, education in 2004 and location of the household) to match the
control and treatment households. Using this matched sample (20,752 observations; NTreatment=
3,469 and NControl= 6,907, over two periods), we then examine the effect of starting an enterprise
on SEWB. We find that starting an enterprise is associated with higher probability of reporting

26
‘better’ SEWB (coefficient of Treat in column 1 of Table 8) and that this effect is higher for
relatively lower income households (coefficient of Treat*LowIncomeGroup in column 2 of
Table 8). Thus, the results using this matched sample support H3a and H3b.
In the second robustness check, we use further stringent matching covariates to eliminate
other potential confounds. For instance, it is possible, that an improvement in SEWB in 2011
may be due to increase in income, increase in consumption or starting an enterprise between
2004 and 2011. In other words, SEWB in 2011 may be dependent on income and consumption in
2011. Though we control for these observable increases (changes in income, consumption and
education levels) in our empirical framework (refer Eqn. 2), there may be unobservable factors
that depend on these differences in income and consumption in 2011, that could also impact
SEWB in 2011. To address this potential issue, we employ additional covariates to the matching
procedure. In addition to the covariates used above (income in 2004, total consumption in 2004,
number of children in 2004, education in 2004 and location of the household) for matching, we
also use income in 2011 and consumption in 2011. The rationale for adding these two covariates
in computing propensity scores is that income in 2011 may act as a proxy for the ‘earning
potential’ of a household in 2004, whereas consumption in 2011 may act as a proxy for the
‘motivation to change lifestyle’ for a household in 2004. It is possible that these two factors may
also predict the propensity score of a household to start an enterprise. Thus, by matching on
income and consumption in 2011, we also eliminate any potential confounding of these factors
on SEWB in 2011. Hence any difference in SEWB between the two household groups in 2011
can be directly attributed to starting an enterprise (and not to income and consumption).

27
After this more stringent matching, the distribution of propensity scores and the balance
of the covariates in the treatment and control groups (after adding income in 2011 and
consumption in 2011) are presented in Appendix 1b. With the matched sample (20,480
observations; NTreatment= 3,439 and NControl= 6,801, over two periods), we re-estimate the
coefficients of Eqn. (2), with SEWB as the dependent variable. Results of the ordered probit
regression with this matched sample are presented in columns 3 and 4 of Table 8. As expected,
starting an enterprise is associated with higher probability of reporting ‘better’ SEWB
(coefficient of Treat in column 3 of Table 8) and this effect is higher for relatively lower income
households (coefficient of Treat*LowIncomeGroup in column 4 of Table 8). Results from this
second robustness check provide further support for hypotheses H3a and H3b, suggesting that
starting an enterprise has a direct effect on SEWB after controlling for any increase in household
income and consumption. Further, this effect is stronger for relatively lower income households.
[Insert Table 8 here]
4. General Discussion
Using a large longitudinal dataset of Indian households that were surveyed in 2004 and
2011, we empirically examine the effect of starting an enterprise on household income,
consumption and subjective economic wellbeing (SEWB). We find that starting an enterprise is
positively related to income and consumption of households. We also find that when income and
consumption are controlled for, the subjective economic wellbeing of households also increases
for the group that starts an enterprise. Furthermore, each of these positive effects of starting an
enterprise is accentuated for households that have low income.

28
Research on entrepreneurship and wellbeing in advanced economies predominantly
supports the ‘poor but happy’ theorizing of entrepreneurship, which suggests that while
entrepreneurs may earn less than salaried employees, they are happier due to the non-pecuniary
benefits of job-satisfaction, autonomy and job-flexibility (Moskowitz and Vissing-Jorgensen,
2002; Hamilton, 2000). Our findings show that, in emerging markets, starting an enterprise
results in objective economic gains, such as higher income and consumption. While past research
has found that entrepreneurship contributes to the economic development of emerging markets
(Bruton et al., 2008), we provide empirical evidence to show similar economic gains at the
micro-economic level of the household as well.
These findings have several implications for entrepreneurship research. First, our results
call for renewed inquiry into entrepreneurship in emerging markets in view of their unique social
and economic setting. A large section of entrepreneurs in emerging markets function in the
informal economy, having a social and economic environment very different from the formal
sector (Kaynak and Dana, 2013). Our findings show that these unique socio-economic
characteristics may influence the economic gains from starting an enterprise. Second, we
examine the economic gains from starting an enterprise not from the firm-level standpoint of
profit-optimization, but from the broader social goal of the entrepreneur to meet the income and
consumption needs of the household. This is in line with the current thought of examining
entrepreneurship as a process embedded in economic, social, cultural and situational factors
(Shaw and Carter, 2007). For instance, in the context of emerging economies, we hypothesised
that the economic gains of starting an enterprise would extend to meeting the imminent needs of
the household, which is one of the primary drivers of entrepreneurship among the larger set of
entrepreneurs in these markets. Third, our findings provide empirical evidence that self-
29
employment through starting an enterprise can serve as potent tool for economic development in
emerging markets – a thought that is now gaining currency globally (Seelos and Mair, 2005).
In our study, we broaden our analysis of the gains of starting an enterprise to include both
objective and subjective economic wellbeing. Our motivation to adopt this framework is drawn
from authors who suggest that both pecuniary and non-pecuniary benefits of entrepreneurship
must be examined comprehensively (Carter, 2010). We observe that, even when the objective
economic gains are controlled for, there is an increase in subjective economic wellbeing among
households that start an enterprise. The reasons for this finding could be the psychological
outcomes of sense of autonomy, higher job-satisfaction and job-flexibility, as suggested in
previous research cited earlier in this paper. However, our investigation of subjective economic
wellbeing is at the level of the household, and not at the level of the individual entrepreneur. This
suggests that there could be other factors also that lead to a higher sense of wellbeing (Martin
and Hill, 2012). Our findings suggest that the causal factors for an enhanced sense of economic
wellbeing in households that have an entrepreneur is a potential area for future research.
As mentioned before, majority of the entrepreneurs in emerging markets belong to the
low and middle income categories. We find that the objective and subjective economic gains
from entrepreneurship are accentuated for low income households. This supports the premise of
strands of literature on transformative entrepreneurship (Tobias et al., 2013) and necessity
entrepreneurship (Venugopal et al., 2015; Reynolds, 2001), which state that in low income
settings, entrepreneurship serves as a means of livelihood, and a strategy to overcome income
and consumption constraints of households. Our findings on the effects of starting an enterprise
on relatively lower income households have important theoretical and practical implications for

30
entrepreneurship in emerging markets and the entrepreneurship literature in general. In emerging
markets, entrepreneurship is a means for households to acquire resources to meet their
consumption requirements. In such cases, entrepreneurship involves using limited means in
resourceful ways to achieve the basic needs of entrepreneurs and their households, which has
been called 'means entrepreneurship' (Viswanathan and Venugopal, 2015). Hence,
entrepreneurial strategy can be viewed as a creative process driven by the economic and social
environment of entrepreneurs, as suggested by Sarasvathy (2001).
Whereas entrepreneurship has been found to contribute to the economic development of
emerging markets, our findings show similar economic gains at the micro-economic level of the
household as well (Bruton et al., 2008). These findings also have implications for the role of
entrepreneurship in leading to growth and reduced inequality in low and middle income
segments of emerging markets (Kimhi, 2010). Our results show, that lower income households
can move up to higher income levels over time. An interesting future research direction is to
understand why some low income entrepreneurial households succeed in improving their income
and consumption significantly. This research could build on prior work (Sridharan et al., 2014)
that have suggested that there are a range of subsistence entrepreneurs. Thus, a nuanced
understanding of subsistence entrepreneurship can provide a basis to design pathways to
transformative entrepreneurship that moves people into lower-middle and middle income.
Finally, we contribute to the entrepreneurship literature by using the household as the unit
for analysing economic rewards. In emerging markets, prior work has shown that
entrepreneurship is strongly embedded in the social setting, and the motivations of entrepreneurs
for starting a business are household-specific. This makes the household a logical choice for

31
analysing the benefits accrued from entrepreneurship. Furthermore, research suggests that in
small businesses, the business-household relationship is highly permeable, the strengths and risk
of one complementing the other. Our rich household level data and empirical estimation
approach, suggest that our choice of household as a unit for studying the economic and
psychological benefits of entrepreneurship is appropriate. In doing so, we provide evidence from
the household panel data, which suggests that both objective and subjective wellbeing accrue to
households from starting an enterprise in emerging markets. Our findings follow through on
suggestions by a number of scholars that this relationship is important to explore.
Acknowledgements
We acknowledge support from Category I Research funding from Indian Institute of
Management Calcutta. We also acknowledge support from the Greif Center for Entrepreneurial
Studies at USC-Marshall School of Business. The manuscript has benefitted from comments
received from Joseph Mahoney, Violina Rindova, Sonali Shah, Noam Wasserman. The
manuscript has also benefited from participants at the Greif research colloquium, participants at
the Marketing Science Conference, and seminar participants at the University of Melbourne.

32
References
Acs, Z. (2006). How is entrepreneurship good for economic growth? Innovations, 1(1), 97-107.
Aldrich, H. E., and Cliff, J. E. (2003). The pervasive effects of family on entrepreneurship:
Toward a family embeddedness perspective. Journal of Business Venturing, 18(5), 573–
596.
Alsos, G. A., Carter, S., and Ljunggren, E. (2011). The Handbook of Research on
Entrepreneurship in Agriculture and Rural Development. Edward Elgar Publishing.
Alsos, G. A., Ljunggren, E., and Carter, S. (2014). Entrepreneurial families and households. In
Baker, T. and Welter, F. (2015). The Routledge Companion to Entrepreneurship,
London: Routledge.
Astebro, T., Herz, H., Nanda, R., and Weber, R. A. (2014). Seeking the roots of
entrepreneurship: Insights from behavioral economics. Journal of Economic
Perspectives, 28(3), 49-70.
Audretsch, D. B., and Thurik, A. R. (2000). Capitalism and democracy in the 21st century: from
the managed to the entrepreneurial economy. Journal of Evolutionary Economics, 10(1-
2), 17-34.
Barrett, C. B., Reardon, T., and Webb, P. (2001). Nonfarm income diversification and household
livelihood strategies in rural Africa: Concepts, dynamics, and policy implications. Food
Policy, 26(4), 315-331.
Benz, M., and Frey, B. S. (2008). Being independent is a great thing: Subjective evaluations of
self‐employment and hierarchy. Economica, 75(298), 362-383.
Berdegué, J. A., Ramı́rez, E., Reardon, T., and Escobar, G. (2001). Rural nonfarm employment
and incomes in Chile. World Development, 29(3), 411-425.

33
Blanchflower, D. G. (2004). Self-employment: More may not be better. Swedish Economic
Policy Review, 11(2), 15-73.
Blanchflower, D. G., and Oswald, A. J. (2004). Well-being over time in Britain and the USA.
Journal of Public Economics, 88(7-8), 1359-1386.
Blanchflower, D. G., and Shadforth, C. (2007). Entrepreneurship in the UK. Foundations and
Trends in Entrepreneurship, 3(4), 257-364.
Boulder: Westview Press.
Bradbury, B. (1996). Are the Low Income Self-Employed Poor? Sydney: University of New
South Wales.
Brannon, D., Wiklund, J., and Haynie, J. (2013). The varying effects of family relationships in
entrepreneurial teams. Entrepreneurship Theory and Practice, 37(1), 107-132.
Bruton, G. D., Ahlstrom, D., and Obloj, K. (2008). Entrepreneurship in emerging economies:
Where are we today and where should the research go in the future. Entrepreneurship
Theory and Practice, 32(1), 1-14.
Carter, S. (2010). The rewards of entrepreneurship: Exploring the incomes, wealth, and
economic well-being of entrepreneurial households. Entrepreneurship Theory and
Practice, 35(1), 39-55.
Clark, A. E., Frijters, P., and Shields, M. A. (2008). Relative income, happiness, and utility: An
explanation for the Easterlin paradox and other puzzles. Journal of Economic
Literature, 46(1), 95-144.
Cracolici, M. F., Giambona, F., and Cuffaro, M. (2014). Family structure and subjective
economic well-being: Some new evidence. Social Indicators Research, 118(1), 433-456.

34
De Silva, L. R., and Kodithuwakku, S. S. (2011). Pluriactivity, entrepreneurship and socio-
economic success of farming households. In Alsos, G., Carter, S., Ljunggren, E. and
Welter, F. (2011). The Handbook of Research on Entrepreneurship in Agriculture and
Rural Development. Cheltenham: Edward Elgar.
Deaton, A., and Muellbauer, J. (1980). Economics and Consumer Behavior. Cambridge:
Cambridge University Press.
Dehejia, R. H., and Wahba, S. (2002). Propensity score-matching methods for nonexperimental
causal studies. Review of Economics and Statistics, 84(1), 151-161.
Deininger, K., and Olinto, P. (2001). Rural nonfarm employment and income diversification in
Colombia. World Development, 29(3), 455-465.
Desai, S., and Vanneman, R. (2011). India Human Development Survey-II (IHDS-II), 2011-12.
ICPSR36151-v4. Ann Arbor, MI: Inter-university Consortium for Political and Social
Research [distributor].
Desai, S., Vanneman, R., and National Council of Applied Economic Research, New Delhi
(2005). India Human Development Survey (IHDS), 2005. ICPSR22626-v11. Ann Arbor,
MI: Inter-university Consortium for Political and Social Research [distributor].
Devicienti, F., and Gualtieri, V. (2007). The Dynamics and Persistence of Poverty in
Italy. Rome: Laboratorio Riccardo Revelli.
Dolan, P., Peasgood, T., and White, M. (2008). Do we really know what makes us happy? A
review of the economic literature on the factors associated with subjective well-
being. Journal of Economic Psychology, 29(1), 94-122.

35
Douthitt, R. A., MacDonald, M., and Mullis, R. (1992). The relationship between measures of
subjective and economic well-being: A new look. Social Indicators Research, 26(4), 407-
422.
Duesenberry, J. S. (1949). Income, Saving, and the Theory of Consumer Behavior. Cambridge:
Harvard University Press.
Dugan, A. (2014). More Americans worse off financially than a year ago. Gallup.com. Accessed
on 30 August 2017. Retrieved from: http://www.gallup.com/poll/166850/americans-
worse-off-financially-year-ago.aspx
entrepreneurial coffee sector. Journal of Business Venturing, 28(3), 728–742
Eurobarometer. (2017). The economic and financial situation compared to last year. Gesis.org.
Accessed on 30 August 2017. Retrieved from: https://www.gesis.org/eurobarometer-data-
service/search-data-access/eb-trends-trend-files/list-of-trends/changes-last/
Fusco, A. (2016). The dynamics of perceived financial difficulties. Journal of Happiness
Gentry, W. M., and Hubbard, R. G. (2004). Entrepreneurship and household saving. Advances in
Economic Analysis & Policy, 4(1), 1-55.
Gindling T. H., and Newhouse, D. L. (2014). Self-employment in the developing world. World
Development, 56(3), 313–331.
Granovetter, M., and Swedberg, R. (1992). The Sociology of Economic Life.
Hamilton, B. H. (2000). Does entrepreneurship pay? An empirical analysis of the returns to self-
employment. Journal of Political Economy, 108(3), 604-631.
Helliwel, J. F., Layard, R., and Sachs, J. (2015). World Happiness Report 2015. New York:
Sustainable Development Solutions Network.

36
Hoskisson, R. E., Eden, L., Lau, C.M., and Wright, M. (2000). Strategy in emerging
economies. Academy of Management Journal, 43(3), 249-267.
Hurst, E., and Pugsley, B. W. (2011). What do small businesses do? Brookings
Jaikumar, S., Singh, R., and Sarin, A. (2017). ‘I show off, so I am well off’: Subjective economic
well-being and conspicuous consumption in an emerging economy. Journal of Business
Research, http://dx.doi.org/10.1016/j.jbusres.2017.05.027.
Kahneman, D., Diener, E., and Schwarz, N. (1999). Well-Being - The Foundations of Hedonic
Psychology. NewYork: Russell Sage Foundation.
Kaynak, E. and Dana, L.P., (2013). When Economies Change Hands: A Survey of
Entrepreneurship in the Emerging Markets of Europe from the Balkans to the Baltic
States. London: Routledge.
Kimhi, A. (2010). Entrepreneurship and income inequality in southern Ethiopia. Small Business
Economics, 34(3), 81–91.
Lanjouw, P. (2001). Nonfarm employment and poverty in rural El Salvador. World
Development, 29(3), 529-547.
Martin, K. D., and Hill, R. P. (2012). Life satisfaction, self-determination, and consumption
adequacy at the bottom of the pyramid. Journal of Consumer Research, 38(6), 1155-
1168.
Moskowitz, T. J., and Vissing-Jorgensen, A. (2002). The returns to entrepreneurial investment: a
private equity premium puzzle? American Economic Review, 92(4), 745-778.
Papers on Economic Activity, 2011(2), 73-142.
Pearson, A. W., Carr, J. C., and Shaw, J. C. (2008). Toward a theory of familiness: A social
capital perspective. Entrepreneurship Theory and Practice, 32(6), 949–969.
37
Peng, M. W. (2001). How entrepreneurs create wealth in transition economies. The Academy of
Management Executive, 15(1), 95-108.
Prahalad, C.K. (2005). The Fortune at the Bottom of the Pyramid: Eradicating Poverty Through
Profits. Upper Saddle River, New Jersey: Wharton School Publishing.
Quadrini, V. (2000). Entrepreneurship, saving, and social mobility. Review of Economic
Dynamics, 3(1), 1-40.
Ram, M., Jones, T. A, Sanghera, B., Barlow, G. and Jones, T. (2000). Making the link:
households and small business activity in a multi-ethnic context. Community, Work &
Family. 4(3), 327–348.
Ravallion, M., and Lokshin, M. (2002). Self-rated economic welfare in Russia. European
Economic Review, 46(8), 1453-1473.
Reardon, T. (1997). Using evidence of household income diversification to inform study of the
rural nonfarm labor market in Africa. World Development, 25(5), 735-747.
Reardon, T., Berdegué, J., and Escobar, G. (2001). Rural nonfarm employment and incomes in
Latin America: Overview and policy implications. World Development, 29(3), 395-409.
Reynolds, P. D., Camp, S. M., Bygrave, W. D., Autio, E. and Hay, E. (2001). Global
Entrepreneurship Monitor (GEM) 2001 Executive Report. London: Global
Entrepreneurship Research Association.
Ruben, R. (2001). Nonfarm employment and poverty alleviation of rural farm households in
Honduras. World Development, 29(3), 549-560.
Sarasvathy, S. D. (2001). Causation and effectuation: Toward a theoretical shift from economic
inevitability to entrepreneurial contingency. Academy of Management Review, 26(2),
243-263.
38
Schjoedt, L. (2009). Entrepreneurial job characteristics: an examination of their effects on
entrepreneurial satisfaction. Entrepreneurship Theory and Practice, 33(3), 619-644.
Seelos, C., and Mair, J. (2005). Social entrepreneurship: Creating new business models to serve
the poor. Business Horizons, 48(3), 241-246.
Shane, S. (2008). The Illusions of Entrepreneurship: The Costly Myths that Entrepreneurs,
Investors and Policymakers Live By. New Haven: Yale University Press.
Shane, S., and Venkataraman, S. (2000). The promise of entrepreneurship as a field of research.
Academy of Management Review, 25(1), 217-226.
Shaw, E., and Carter, S. (2007). Social entrepreneurship: Theoretical antecedents and empirical
analysis of entrepreneurial processes and outcomes. Journal of Small Business and
Enterprise Development, 14(3), 418-434.
Sieger, P., Zellweger, T., Nason, R. S., and Clinton, E. (2011). Portfolio entrepreneurship in
family firms: a resource-based perspective. Strategic Entrepreneurship Journal,
5(4), 327–351.
Smith, J., Todd, P. (2008). Does matching overcome LaLonde’s critique of non-experimental
estimators. Journal of Econometrics, 125(1), 305-353.
Sridharan, S., Maltz, E., Viswanathan, M. and Gupta, S. (2014). Transformative subsistence
entrepreneurship: a study in India. Journal of Macromarketing, 34(4), 486-504.
Studies, 17(4), 1599–1614
Tobias, J. M., Mair, J. and Barbosa-Leiker, C. (2013). Toward a theory of transformative
entrepreneuring: Poverty reduction and conflict resolution in Rwanda's
Tracey, P., and Phillips, N. (2011). Entrepreneurship in emerging markets. Management
International Review, 51(1), 23-39.

39
Venugopal, S., Viswanathan, M. and Jung, K. (2015), Consumption constraints and
entrepreneurial intentions in subsistence marketplaces. Journal of Public Policy &
Marketing, 34(2), 235-51
Viswanathan, M., and Venugopal, S. (2015). Subsistence marketplaces: Looking back, looking
forward. Journal of Public Policy and Marketing, 34(2), 228-234.
Viswanathan, M., Rosa, J. A. and Ruth, J. A. (2010), Exchanges in marketing systems: the case
of subsistence consumer–merchants in Chennai, India. Journal of Marketing, 74(5), 1-17.
Wasserman, N. (2017). The throne vs. the kingdom: Founder control and value creation in
startups. Strategic Management Journal, 38(2), 255-277.
Wheelock, J. and Baines, S. (1998). Dependency of self-reliance? The contradictory case of
work in UK small business families. Journal of Family and Economic Issues, 19(1), 53-
73.
Wheelock, J. and Mariussen, A. (1997). Households, Work and Economic Change: A
Comparative Institutional Perspective. Boston: Kluwer.

40
Figure 1. Balance of covariates before and after matching
a. Propensity scores b. Covariate distributions

41
Table 1. Control and treatment groups – Descriptive measures
Entre Group Control Treatment
Year 2004 2011 2004 2011
Income (Rs.) 45,561 64,953 52,518 98,103
(63,512) (88,069) (64,672) (173,236)
Consumption (Rs.) 3,812 5,015 4,542 6,700
(3,711) (4,891) (4,607) (6,408)
SEWB
(compared to 2004) % of households
1 – worse 10.78% 7.49%
2 – same 52.79% 45.34%
3 – better 36.43% 47.17%
- standard deviations are presented in parentheses
Table 2. Control and treatment groups – Percentage changes
Entre Group Control Treatment
Income (Rs.) 42.6% 86.8%
Consumption (Rs.) 31.6% 167.9%
SEWB 29.5% more households ‘better’
SEWB in the treatment group

42
Table 3. Effect of starting an enterprise on household income
Dependent variable: log(income)
Explanatory variables (1) (2) (3) (4) (5)
Year (=1 if 2011) .313*** .302*** .303*** .139*** -.185***
(.007) (.007) (.031) (.042) (0.040)
Year * Treat .206*** .157*** .164*** .174*** .175***
(.020) (.019) (.019) (.019) (.024)
Year * LowIncomeGroup .736***
(.013)
Year*Treat*LowIncomeGroup .071**
(.035)
No. of adults in HH .139*** .139*** .141*** .112***
(.004) (.004) (.004) (.004)
No. of children in HH .037*** .038*** .035*** .030***
(.004) (.004) (.004) (.004)
Education .029*** .028*** .028*** .026***
(.002) (.002) (.002) (.002)
Constant 10.27*** 9.517*** 9.670*** 9.658*** 9.726***
(.005) (.017) (.050) (.049) (.046)
Observations 53,944 53,899 53,882 53,882 53,882
R-squared .094 .163 .166 .187 .283
Number of Households 27,431 27,430 27,430 27,430 27,430
Social Group-Year FEa Yes Yes Yes
Urban-Year FE Yes Yes Yes
State-Year FE Yes Yes Notes:
Standard errors in parentheses
*** p<0.01, ** p<0.05, * p<0.1
a – FE refers to fixed effects
43
Table 4. Effect of starting an enterprise on household consumption
Dependent variable: log(consumption)
Explanatory variables (1) (2) (3) (4) (5)
Year (=1 if 2011) .274*** .281*** .209*** .320*** .290***
(.005) (.004) (.019) (.026) (.026)
Year * Treat .135*** .090*** .090*** .093*** .076***
(.013) (.012) (.012) (0.012) (.016)
Year * LowIncomeGroup .066***
(.009)
Year*Treat*LowIncomeGroup .046**
(.023)
No. of adults in HH .127*** .126*** .125*** .123***
(.002) (.002) (.002) (.002)
No. of children in HH .054*** .054*** .053*** .053***
(.002) (.002) (.002) (.002)
Education .017*** .017*** .017*** .016***
(.001) (.001) (.001) (.001)
Constant 7.992*** 7.332*** 7.351*** 7.347*** 7.354***
(.003) (.011) (.031) (.030) (.030)
Observations 54,871 54,828 54,810 54,810 54,810
R-squared .150 .267 .268 .291 .293
Number of Households 27,461 27,461 27,461 27,461 27,461
Social Group-Year FEa Yes Yes Yes
Urban-Year FE Yes Yes Yes
State-Year FE Yes Yes Notes:
Standard errors in parentheses
*** p<0.01, ** p<0.05, * p<0.1
a – FE refers to fixed effects

44
Table 5. Effect of starting an enterprise on SEWB
Dependent variable: SEWB 2011
Explanatory variables (1) (2) (3) (4) (5)
Treat (=1) .257*** .216*** .149*** .151*** .064**
(.021) (.021) (.022) (.022) (.031)
LowIncomeGroup (=1) -.268***
(.017)
Treat*LowIncomeGroup .166***
(.043)
Δ Household income .000*** .000*** .000*** .000***
(.000) (.000) (.000) (.000)
Δ Household consumption .000*** .000*** .000*** .000***
(.000) (.000) (.000) (.000)
Δ Education .013*** .009*** .008*** .011***
(.002) (.002) (.002) (.002)
No. of adults in HH .064*** .065*** .050***
(.005) (.005) (.005)
No. of children in HH .004 .011** .014***
(.005) (.005) (.005)
Urban (1=yes) .148*** .146*** .080***
(.016) (.017) (.017)
SEWB 2005 .229*** .206*** .168***
(.010) (.010) (.011)
Δ State mean income -.000 -.000
(.000) (.000)
κ1 -
1.233***
-
1.196***
-.610*** -.558*** -.827***
(.011) (.011) (.050) (.065) (.067)
κ2 .344*** .397*** 1.027*** 1.092*** .833***
(.008) (.009) (.050) (.065) (.067)
No. of households 26,992 26,992 26,958 26,958 26,958
Social group Yes Yes Yes
State level effects Yes Yes Notes:
Standard errors in parentheses
*** p<0.01, ** p<0.05, * p<0.1

45
Table 6. Balance of covariates before and after matching
All households Matched households
Treatment group Control group Treatment group Control group
Distancea 0.143 0.125
0.142 0.142
Income (in Rs.)* 52,530 45,597
51,898 52,431
Consumption (in Rs.)* 4,545 3,815
4,462 4,458
No. of adults* 3.876 3.521
3.849 3.894
No. of children* 1.758 1.690
1.744 1.768
Education* 8.107 6.795 8.077 8.188
Notes:
a – Average distance measure in the treatment and control groups (distance is computed based on the covariates)
* Values in 2004

46
Table 7. Effects on income and consumption using the matched sample
Dependent variable: log(income) log(consumption)
Explanatory variables (1) (2) (3) (4)
Year (=1 if 2011) .123* -.142*** .371*** .329***
(.068) (.064) (.042) (.042)
Year * Treat .156*** .128*** .112*** .108***
(.022) (.028) (.014) (.019)
Year * LowIncomeGroup .723*** .107***
(.024) (.016)
Year*Treat*LowIncomeGroup .085** .013
(.040) (.027)
No. of adults in HH .133*** .104*** .116*** .112***
(.006) (.006) (.004) (.004)
No. of children in HH .031*** .027*** .052*** .052***
(.006) (.006) (.004) (.004)
Education .031*** .028*** .019*** .018***
(.003) (.003) (.002) (.002)
Constant 9.830*** 9.898*** 7.321*** 7.332***
(.086) (.082) (.054) (.054)
Observations 20,400 20,400 20,722 20,722
R-squared .208 .304 .301 .305
Number of Households 10,365 10,365 10,376 10,376
Social Group-Year FEa Yes Yes Yes Yes
Urban-Year FE Yes Yes Yes Yes
State-Year FE Yes Yes Yes Yes Notes:
Standard errors in parentheses
*** p<0.01, ** p<0.05, * p<0.1
a – FE refers to fixed effects

47
Table 8. Effect on SEWB using the matched sample
Dependent variable: SEWB 2011
PSM 1a PSM 2b
Explanatory variables (1) (2) (3) (4)
Treat (=1) .115*** .021 .121*** .042
(.025) (.035) (.025) (.035)
LowIncomeGroup (=1) -.304*** -.282***
(.030) (.030)
Treat*LowIncomeGroup .190*** .167***
(.049) (.050)
Δ Household income .000*** .000*** .000*** .000***
(.000) (.000) (.000) (.000)
Δ Household consumption .000*** .000*** .000*** .000***
(.000) (.000) (.000) (.000)
Δ Education .012*** .015*** .005* .008***
(.003) (.003) (.003) (.003)
No. of adults in HH .057*** .042*** .049*** .035***
(.007) (.008) (.007) (.008)
No. of children in HH .002 .005 -.001 .001
(.008) (.008) (.008) (.008)
Urban (1=yes) .149*** .088*** .146*** .089***
(.025) (.026) (.025) (.026)
SEWB 2005 .186*** .148*** .197*** .163***
(.017) (.017) (.017) (.018)
Δ State mean income -.000* -.000 .000 .000
(.000) (.000) (.000) (.000)
κ1 -.742*** -1.003*** -.554*** -.804***
(.110) (.113) (.109) (.112)
κ2 .859*** .608*** 1.051*** .809***
(.110) (.113) (.109) (.112)
No. of households 10,180 10,180 10,055 10,055
Social group Yes Yes Yes Yes
State level effects Yes Yes Yes Yes Notes:
Standard errors in parentheses
*** p<0.01, ** p<0.05, * p<0.1
a – PSM (propensity score matching) using income in 2004, total consumption in 2004, number of children in 2004,
education in 2004 and location of the household as covariates
b – PSM (propensity score matching)using all covariates in (a), and income in 2011 and consumption in 2011 as
additional covariates
Recommended