1 09SEM8a
Writing about SEM/Best Practices
• Presenting results • Best Practices
» specification » data » analysis » interpretation

2 09SEM8a
Writing about SEM
• Summary of recommendation from Hoyle & Panter, McDonald & Ho, Kline » the model » the data » estimation and fit » parameter estimates » alternative models

3 09SEM8a
Presenting the Model
• H&P suggest presenting a more abstract version of the model first ("conceptual model") followed by a concrete model specified in enough detail to allow the reader to reconstruct the analysis ("statistical model") » reader should be able to compute observations and degrees of
freedom from statistical model » indicate clearly any parameters that were fixed
• M&H want to see more discussion of identifiability • Both want readers to do more theoretical justification
for presence and absence of paths
4 09SEM8a
Data
• Check for violations of assumptions and present diagnostic information » esp., provide information about kurtosis » Mardia's coefficient gives information on multivariate
normality • Give information on missing data (how much?), and
how this was handled (e.g., listwise deletion) • Provide data
» covariance matrix that includes all observed variables OR » correlation matrix and standard deviations » M&H: if > 30 variables, put on web or state that the data are
available from the author

5 09SEM8a
Estimation and Fit
• State what method of estimation you used » Maximum Likelihood best in most cases
• Present strategy for testing fit (H&P) » state which indices will be presented and give justifications
for choosing them » give conceptual definition of each index used » state the cutoff values you will be using
• Give χ2, df, sample size and p value » can do this succinctly: ≈ χ2(48, N = 500) = 303.80, p < .001, TLI = .86, CFI = .90
6 09SEM8a
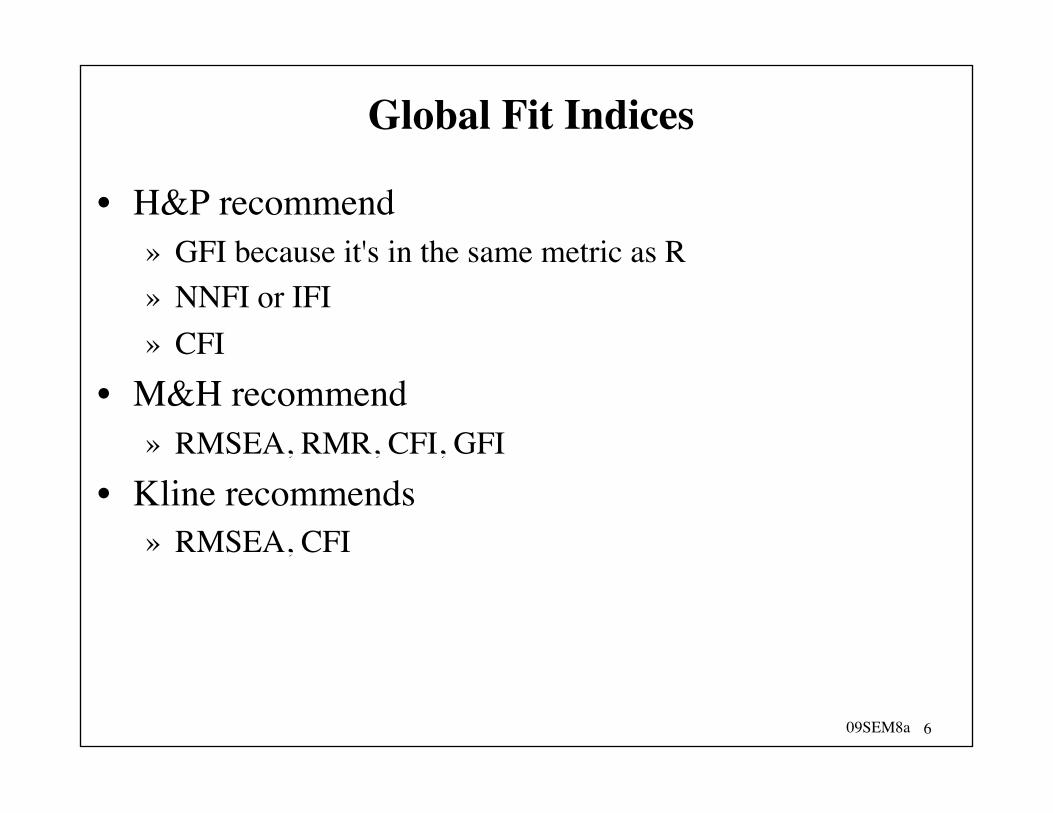
Global Fit Indices
• H&P recommend » GFI because it's in the same metric as R » NNFI or IFI » CFI
• M&H recommend » RMSEA, RMR, CFI, GFI
• Kline recommends » RMSEA, CFI

7 09SEM8a
More on Fit
• M&H and Kline suggest that discrepancy information should be presented » M&H say to present it in the other half of the variance/
covariance matrix of the observed variables • M&H and Kline also both recommend a two-step
testing strategy to insure that structural part of model fits well » See M&H Table 2 (p. 74) for examples in which structural
portion did not fit well but this was masked by the overall good fit of the model
8 09SEM8a
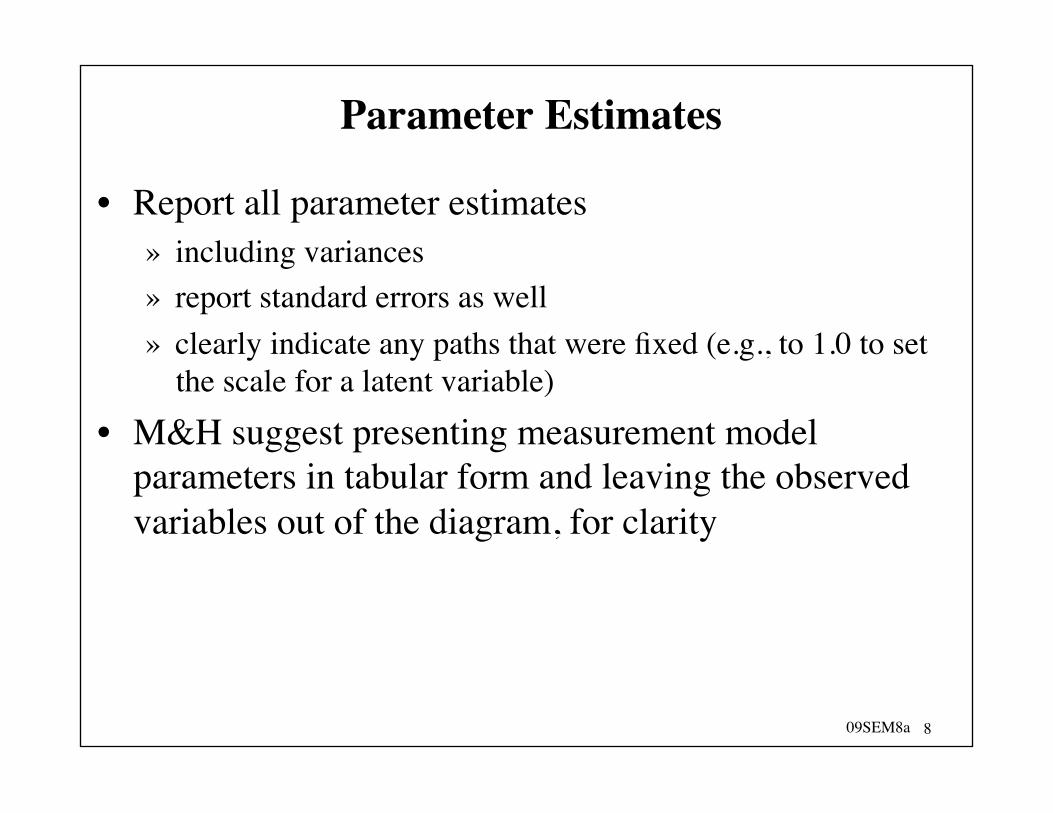
Parameter Estimates
• Report all parameter estimates » including variances » report standard errors as well » clearly indicate any paths that were fixed (e.g., to 1.0 to set
the scale for a latent variable) • M&H suggest presenting measurement model
parameters in tabular form and leaving the observed variables out of the diagram, for clarity

9 09SEM8a
Alternative Models
• Present and test alternative models • If respecification is done, present this information
clearly » H&P recommend that results for the hypothesized model be
presented first » In a separate section, present the modified model
• Test equivalent models, if possible

10 09SEM8a
Cross-Validation
• If you have a holdout sample, test your final model on them and present the results
• If you can't do this, provide estimates of the likelihood that your model will replicate » Browne & Cudeck cross-validation statistic
11 09SEM8a
Keeping Up
• Recommendations are changing, so look for people to continue writing on this topic in: » Psychological Methods » Specialty journals
• Structural Equation Models • Multivariate Behavioral Research • Applied Psychological Measurement • Psychometrika
12 09SEM8a
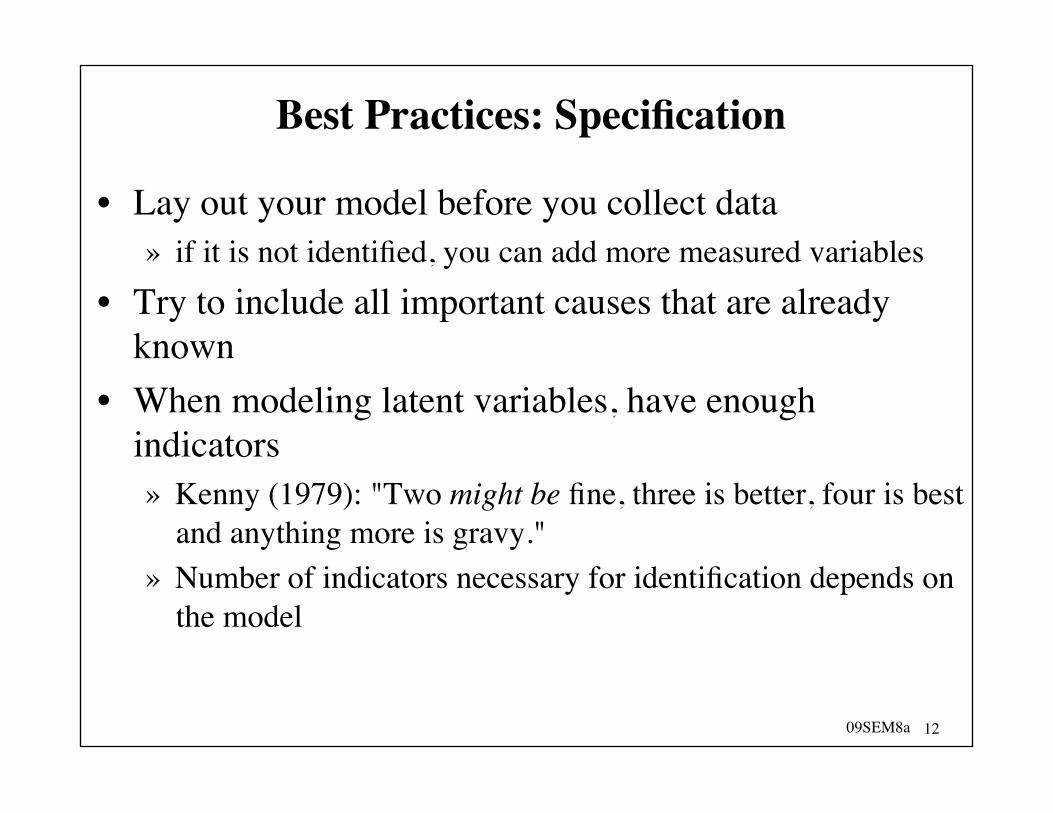
Best Practices: Specification
• Lay out your model before you collect data » if it is not identified, you can add more measured variables
• Try to include all important causes that are already known
• When modeling latent variables, have enough indicators » Kenny (1979): "Two might be fine, three is better, four is best
and anything more is gravy." » Number of indicators necessary for identification depends on
the model

13 09SEM8a
Best Practices: Specification
• Think hard about directionality » does the logic of the study design and protocol rule out some
causal orders? » have some causal orders been confirmed or disconfirmed in
other studies (especially longitudinal or experimental)? » if not, you may want to consider (and test) other causal
orders • Don't use feedback loops (causal arrows going both
ways) as a way to get around thinking hard about directionality

14 09SEM8a
Best Practices: Specification
• Add correlations between error or disturbance terms only when conceptually justified » try to work out ahead of time which error terms may need to
be correlated » avoid correlating error terms solely to improve fit
• Try for indicators that load on one factor (latent variable) only » allow cross-loadings only if clearly justified theoretically

15 09SEM8a
Best Practices: Data
• Implement quality control practices for examining data • Minimize missing data
» If much data is missing, imputation may be the best method, if data are not missing at random
» watch for new developments • Check for violations of assumptions
» normal distributions for endogenous variables » linearity » independence
• Screen for outliers » As in regression and ANOVA, SEM is sensitive to outliers

16 09SEM8a
Best Practices: Analysis
• Use theory and previous findings to guide respecification » modification indices (e.g., Lagrange) can be useful, but do
not rely on them blindly (unless you like making Type I errors)
• Double check your syntax » make sure you are running the model you think you are
• Look carefully at your output for signs of problems » error messages (or not "all is ok" message) » negative variances (and other impossible things) » huge standard errors (and other unlikely things)

17 09SEM8a
Best Practices: Analysis
• Report unstandardized as well as standardized estimates
• Check for multicollinearity » Kline says correlations >.85 may be problematic
• Check your sample size » At least 100 cases AND » 10:1 ratio for cases to parameters estimated (or, at an
absolute minimum, 5:1)

18 09SEM8a
Best Practices: Analysis
• Provide SEM program with start values, if it is having trouble » If program doesn't converge or there are other signs of
problems, but estimates are printed, use those as start values » Kline has several appendices that give advice about
providing start values • Be aware of the possibility of empirical
underidentification • Evaluate the measurement and structural portions of
the model separately

19 09SEM8a
Best Practices: Interpretation
• Look at all of your output » fit indices are important but they are only part of the picture » be sure to look at matrix of residuals -- this lets you know if
all of the model is fitting well or if there are some areas of misfit
• Do not assume, believe, or state that your model must be correct, because fit is good » we can disprove models (state that they must be incorrect)
but we can't prove that a model is correct
20 09SEM8a
Best Practices: Interpretation
• Remember that good fit does not imply anything about how much variance in the endogenous variables is explained » good fit means the variance in the variance-covariance matrix
is well represented by the model » if you care about being able to predict large amounts in the
variance in some or all endogenous variables, you have to look at that separately
• Consider and test alternative models • If possible, consider mathematically equivalent models
» nice if you can rule some out using theory or logic

21 09SEM8a
Best Practices: Interpretation
• Remember that SEM is not a cure for poor theory or design
• Don't reify your factors » you tried to choose indicators so as to create a latent factor
that represents the construct of interest » but you may not have succeeded » when reading other people's work, don't rely just on their
name for the latent variable -- look critically at the indicators • Report enough information so that readers can
reproduce your analysis and try alternative models
Recommended