HAL Id: hal-01736889https://hal.archives-ouvertes.fr/hal-01736889
Preprint submitted on 18 Mar 2018
HAL is a multi-disciplinary open accessarchive for the deposit and dissemination of sci-entific research documents, whether they are pub-lished or not. The documents may come fromteaching and research institutions in France orabroad, or from public or private research centers.
L’archive ouverte pluridisciplinaire HAL, estdestinée au dépôt et à la diffusion de documentsscientifiques de niveau recherche, publiés ou non,émanant des établissements d’enseignement et derecherche français ou étrangers, des laboratoirespublics ou privés.
Zombie Board: Board Tenure and Firm PerformanceSterling Huang, Gilles Hilary
To cite this version:Sterling Huang, Gilles Hilary. Zombie Board: Board Tenure and Firm Performance. 2018. �hal-01736889�
Zombie Board: Board Tenure and Firm Performance
Sterling Huang1
Singapore Management University
Gilles Hilary
Georgetown University
1Accepted by Christian Leuz. We thanks an anonymous referee and our editor for their insightful and constructive
comments that helped significantly improve this paper. Special thanks go to Hannes Wagner for generously sharing
his data on director deaths. We wish to acknowledge the helpful input of Renee Adams, Morten Bennedsen, Daniel
Bens, Lily Brooks, Robert Bushman, Guoli Chen, Lily Fang, Maria Guadalupe, Denis Gromb, Melissa Lewis, Angie
Low, Brian Miller, Amine Ouazad, Urs Peyer, Anil Shivdasani, and workshop and conference participants at INSEAD,
Singapore Management University, the 4th INSEAD-London Conference, the 25th Australasian Banking and Finance
Conference, the 2013 Financial Accounting and Reporting Section Mid-year Conference, the 2013 European
Accounting Association Annual conference, the 2013 European Financial Management Association Annual meeting,
the 2013 American Accounting Association Annual Meeting, and the 2013 Financial Management Association Annual
Meeting. Huang gratefully acknowledges funding from the School of Accountancy Research Center (SOAR) at
Singapore Management University. Send correspondence to Sterling Huang, Singapore Management University, 60
Stamford Road, Singapore 528716; telephone: +65 68087929. E-mail: [email protected]. An Online Appendix to
this paper can be downloaded at http://research.chicagobooth.edu/arc/journal-of-accounting-research/online-
supplements.

1
Zombie Board: Board Tenure and Firm Performance
Abstract
We show that board tenure exhibits an inverted U-shaped relation with firm value and accounting
performance. The quality of corporate decisions, such as M&A, financial reporting quality, and
CEO compensation, also has a quadratic relation with board tenure. Our results are consistent with
the interpretation that directors’ on-the-job learning improves firm value up to a threshold, at which
point entrenchment dominates and firm performance suffers. To address endogeneity concerns,
we use a sample of firms in which an outside director suffered a sudden death, and find that sudden
deaths that move board tenure away from (toward) the empirically observed optimum level in the
cross-section are associated with negative (positive) announcement returns. The quality of
corporate decisions also follows an inverted U-shaped pattern in a sample of firms affected by the
death of a director.
JEL Classification: G30, G32, G34, G38, J33, J44, M41
Keywords: Board Tenure, Firm Value, Corporate Policies, Learning, Entrenchment

2
1. Introduction
The issue of director tenure has gained considerable attention both in the US and abroad.
On the one hand, some governance experts and market participants express concerns about long-
tenured directors. They argue that boards with many long-serving directors are entrenched and
indifferent to shareholder concerns (e.g., ISS 2013-14 Policy Survey). Extended board service can
create a culture of undue deference to management. On the other hand, inexperienced directors
may also be ineffective in their role. A short-tenured board may face less significant governance
problems than a long-tenured board, but may have a less complete understanding of the firm’s
business and history, which may diminish the effectiveness of its monitoring and advising (Pozen
and Hamacher [2015]). Thus, the optimal tenure for directors remains an unresolved issue among
practitioners.
Despite its practical importance, the academic literature on board effectiveness provides
little insight into how the tenure of board members affects the board’s monitoring and advising
abilities. Instead, it mainly focuses on compositional differences across boards (e.g., Chhaochharia
and Grinstein [2007]; Yermack [1996]). In contrast, we examine how board tenure reflects the
trade-off between a board’s independence and knowledge accumulation. More specifically, we
examine how board tenure relates to firm performance and corporate decisions. We operationalize
this tenure by considering the average number of years on the board of different outside directors.
This approach allows us to examine how the knowledge-independence trade-off is integrated in
group decision. As noted in the literature (e.g., Szulanski and Jensen [2006]; van Knippenberg and
Schippers [2007]), the consequences of aggregation at the board level of these individual trade-
offs through group dynamics are not fully understood at this point.
Our analysis consists of two main parts. First, we examine the relation between board
tenure and firm value. We find evidence of an inverted U-shaped relation between board tenure

3
and firm value. Firm value reaches a maximum when the average tenure of outside directors is
approximately 10 years. This finding is robust to the inclusion of controls for an array of 38
corporate governance, CEO, and firm characteristics previously shown as correlated with firm
value, and to the inclusion of firm and year fixed effects. The economic magnitude is such that an
increase in board tenure from 5 to 7 years is associated with an increase in firm value of 2.7% of
the in-sample standard deviation of firm value, while a decrease in board tenure from 13 to 11
years is associated with an increase of 1.3% of this standard deviation. We find these estimates
both plausible and economically significant, particularly when compared with the effects of other
variables (capital expenditures, for example). We reach a similar conclusion when we use the
return on assets (ROA) to measure a firm’s performance. The economic magnitude is such that an
increase in board tenure from 5 to 7 years is associated with an increase in ROA of 4.3% of the
variable standard deviation, while a decrease in board tenure from 13 to 11 years is associated with
an increase of 1.2% of the standard deviation. To mitigate the concern that our results may simply
reflect the effect of tenure diversity on firm performance, we control for the dispersion in
individual director tenures in our specifications. Our results remain unaffected when we consider
other measures of tenure diversity, such as the range and the Herfindahl index of board tenure,
instead of the dispersion, and other aspects of board diversity, such as ethnic, gender, and age
diversity. In addition, we find that the tenure-performance relation is conditional on CEO power
and on information complexity. Specifically, long tenure has a more severe negative effect on the
board when the CEO is more entrenched, for example, when she has a long tenure as CEO, or is
the board chairperson or founder of the firm. Conversely, the negative effect of a short tenure is
exacerbated when the information environment is more complex. For example, with low analyst
coverage, analyst forecasts are more disperse and less accurate.

4
Second, we examine the relation between board tenure and various corporate decisions to
explain the inverted U-shaped relation between board tenure and firm value. We find that the
accumulation of firm-specific knowledge is associated with improvements in the quality of
acquisition decisions, corporate disclosure, and CEO compensation practices. However, these
results hold only up to a certain threshold. As tenure advances beyond this point, additional years
are associated with a decline in board oversight quality and an increase in value-destroying
activities. These findings suggest that for each additional year of tenure, the benefits of learning
dominate for “younger” boards, whereas the costs of entrenchment dominate for “older” boards.
This phenomenon is reminiscent of the effect of audit tenure. Using a quadratic form similar to
ours, prior studies (e.g., Chi and Huang [2005]; Davis, Soos and Trompeter [2009]; Bell, Causholli,
and Knechel [2015]) find that auditor tenure is associated with an increase in audit quality in the
initial years, but only up to a turning point, after which it decreases.2
Although we control for many potentially confounding effects, endogeneity problems may
still obfuscate the interpretation of these results. First, causality may operate in the reverse
direction: poorly performing firms may have trouble attracting new directors, and existing board
members may thus stay longer than optimal. Second, if shareholders can (and do) adjust board
tenure at no cost, each firm should choose the level of board tenure that maximizes its firm value.
In equilibrium, a cross-sectional regression of firm value on board characteristics will not be
informative if this is the case (e.g., Demsetz and Lehn [1985]; Chenhall and Moers [2007]).
However, it has been argued (e.g., Larcker [2003], p. 94) that this assumption “is an extreme view
of the world that is not a useful framework for structuring accounting research.” Instead, some
researchers (e.g., Milgrom and Roberts [1992]) suggest that there should be cross-sectional
2 However, older studies find either consistent negative (e.g., Carey and Simmett [2006]; Mansi et al. [2004]) or
positive (e.g., Myers et al. [2003]; Ghosh and Moon [2005]) effects.

5
variation around the optimal choice. The cross-sectional regression can be informative if this is the
case (the concern about reverse-causality remains a related but separate issue). Consistent with the
view articulated by Milgrom and Roberts [1992], Ittner and Larcker [2001] indicate (p. 398) that
they find it “difficult to believe that the statement ‘everybody optimizes all the time’ characterizes
actual managerial accounting practice.” Rather, they suggest that “all organizations may be
dynamically learning and moving toward the optimal level, but a cross-sectional
sample will consist of observations that are distributed around the optimal choice.”
The issue of learning will be relevant in our setting if the optimal board tenure differs
across firms. In addition, if the transaction costs and other frictions are significant, firms could
deviate from their optimal level of board tenure. For example, it is not physically possible to
immediately add new directors with company-specific experience if a director leaves. This
experience can only be acquired with time. Conversely, it may not be practical, or even feasible,
to terminate directors when their tenure is too long.
To further mitigate these concerns, we examine stock market reactions to announcements
of the sudden death of an outside director, which represents an unexpected exogenous shock to
board tenure. Sudden death announcements that move board tenure away from (closer to) the level
of tenure empirically associated with the maximum Tobin’s Q are associated with a three-day
abnormal announcement return of -1.4% (1%). These results support a causal interpretation of the
relation between board tenure and firm value: firm value changes non-linearly in response to a
change in board tenure. We obtain a similar result when we consider the effect of an outside
director’s death (sudden or not) on firm value and on the quality of corporate decisions (i.e.,
acquisitions, corporate disclosure, and CEO compensation) in the following year. Sudden deaths

6
that move board tenure toward 10 years are associated with a mean abnormal announcement return
of 1%, whereas the corresponding effect of those that move board tenure away from 10 years is
1.4%. These findings further strengthen the causal interpretation of our result, as this sample is
composed of firms that suffer from a significant shock to board tenure, which is reasonably
uncorrelated with firm performance itself.
Our study expands the literature on corporate governance in at least three ways. First, it
complements the growing body of literature that relates board characteristics to firm performance.
The study contributes to this body of literature by showing that board tenure plays a significant
role in firm performance and corporate decisions. However, identifying the effect of tenure on firm
valuation is empirically challenging because of the endogenous relation between governance
structure and corporate outcome. We address this endogeneity concern by examining director
deaths, particularly sudden deaths, which arguably represent an exogenous shock to board tenure
and hence provide a more causal interpretation of our results.
Second, this study contributes to our understanding of how directors are valued. Prior
studies show that directors’ skills and experience are linked with firm performance and corporate
decisions (e.g., Celikyurt, Sevilir, and Shivdasani [2012]; Malmendier, Tate, and Yan [2011]).
This study adds to this body of literature by showing that the contribution of individual directors
to firm value is assessed not only at the individual level, but also in relation to other directors.
More specifically, we show that the effect of a director’s contribution to firm performance depends
in part on her effect on the board’s average tenure. As such, the death of an outside director can
increase or decrease the firm’s value depending on the structure of the board.
Finally, this study contributes to the debate on whether there should be legal limits on the
tenure of board members. Given that many proposals for board governance reform explicitly stress

7
the importance of limiting board tenure, this study shows that board tenure has an inverted U-
shaped relation with both corporate decisions and firm value. We also show that factors such as
managerial entrenchment and the information environment influence the shape of this relation.
The remainder of the paper proceeds as follows. Section 2 provides information on the
institutional background, and develops our hypotheses. Section 3 describes the sample. Section 4
presents the empirical results regarding the effect of board tenure on firm value, followed by a
series of tests to address endogeneity concerns. Section 5 examines the relation between board
tenure and various corporate decisions. Section 6 provides additional robustness tests for the
relation between firm value and board tenure. Section 7 concludes the study.
2. Hypothesis Development
2.1. Tenure Length and Firm Performance
Public companies generally do not have specific term limits on director service (Spencer
and Stuart [2011]), the rationale being that long-serving outside directors are valued because of
their experience and organizational memory. In recent years, some governance experts and market
participants have challenged this view. For example, 74% of investors indicate that long director
tenure is problematic (ISS 2013-14 Policy Survey). The Council of Institutional Investors, which
manages over US$3 billion in pension assets, announced a new policy in 2013, calling for boards
to evaluate director tenure when assessing director independence, and beginning in the 2014 proxy
season, Institutional Shareholder Services (ISS) started to include director tenure in their company
governance ratings. ISS views “tenure of more than nine years as excessive by virtue of potentially
compromising a director’s independence.”3
3 http://www.issgovernance.com/file/files/ISSGovernanceQuickScore2.0.pdf

8
Outside the US, a growing number of countries have adopted tenure-related guidelines or
restrictions on outside directors. With very few exceptions, the “comply and explain” model
prevails, and the recommended maximum tenure for a corporate director is between 9 and 12 years.
For example, the UK corporate governance code states that a board should explain why a director
who has served for more than nine years qualifies as independent. The European Commission
recommends that outside directors serve a maximum of three terms, or 12 years. In Hong Kong,
an outside director is limited to a nine-year tenure, unless voted otherwise by shareholders. In
France, a director is deemed to lose independence after 12 years.4
Aside from practical interest, board tenure captures the trade-off between knowledge
accumulation and board independence. A board acquires more firm-specific knowledge as board
tenure increases, which is associated with an increase in firm value. However, increased familiarity
between the board and management can undermine board independence (Fracassi and Tate [2012];
Hwang and Kim [2009]), which can be associated with a decrease in firm value. Although
anecdotal evidence suggests that long board tenure is negatively associated with firm performance,
empirical evidence on the effect of board tenure on corporate decisions and firm performance
remains scarce.
It is important to note that our focus is not on the effect of the tenure of individual directors.
Although this question may be important, board members make decisions jointly as a group. Even
if each individual director faces the knowledge-independence trade-off, how these director-
specific trade-offs aggregate at the board level through group dynamics is less clear (Szulanski
and Jensen [2006]). A single long-serving director may be sufficient to share firm-specific
knowledge with the rest of the board members, but communication and coordination difficulties
4 http://www.theglobeandmail.com/report-on-business/careers/management/board-games-2013/countries-set-out-
rules-on-directors-tenure/article15574442/

9
may hinder this knowledge diffusion. For example, von Hippel [1994] and Walton [1975] find that
the nature of transferred knowledge changes the effectiveness of knowledge transfers. Conversely,
a single outside director may be sufficient to enforce board independence, but that director is
equally likely to be captured by more senior and powerful directors or CEOs (Coles, Daniel, and
Naveen [2013]; Hermalin and Weisbach [1998]).
We use the average board tenure among all outside directors as a starting point to measure
the aggregate balance needed between independence and knowledge at the board level. Arguably,
there are other candidate measures, such as the standard deviation or the range of tenure. However,
the choice of metric is largely an empirical question, as decision science theory provides limited
guidance on the optimal judgment aggregation procedure. For example, Pauly and van Hees [2006]
show that there is no non-dictatorial decision method for aggregating sets of judgments in a
logically consistent way if the decision method only depends on individual judgments on the
proposition under consideration. List [2005] proposes a review of the different theoretical issues
associated with judgment aggregation. In the organizational behavior literature, van Knippenberg
and Schippers [2007] (p. 533) note that theoretical frameworks to understand the effects of group
diversity suffer from “too little development.” Given this theoretical uncertainty, we start our
analysis with the first moment of the distribution. However, we revisit this issue in Section 6.1
when we consider the effect of different distributional parameters on our main findings.
We also note that our focus on the first rather than the second moment of the distribution
is consistent with the findings in the organizational behavior literature. For example, in their
literature review, Williams and O’Reilly [1998] show that the effect of tenure diversity on team
performance is inconsistent across studies, with some positive and some negative results (and
presumably some insignificant unpublished studies). Wahid [2012] uses the coefficient of

10
dispersion as her key metric to consider the effect of tenure heterogeneity. We define this
coefficient as the ratio of the standard deviation to the mean. In principle, the effect may come
from either the numerator or the denominator. Our analysis complements Wahid’s [2012] by
largely focusing on and establishing a non-linear pattern of the effect of the latter. Our results
suggest that the effect of the former is more limited in our context.
3. Data and Specifications
3.1 Pooled Sample
We use an initial panel of US firms from the WRDS Investor Responsibility Research
Center (IRRC) database, which covers S&P 1,500 firms in the US for the 1998-2010 period. We
apply two filters to the IRRC data. First, each company must have information on the starting year
of the directorship (IRRC variable dirsince) for all board members in a given year. We supplement
missing tenure information by searching the original proxy filings and 10-K filings, which are
available from Capital IQ and the online Edgar data retrieval system. Second, financial information
must be available from Compustat, and CEO information must be available from Execucomp. We
manually match the company identifier from the IRRC database to Compustat by company name
and CEO information, to ensure the correct company identification.
We define “Board Tenure” as the average tenure (in years) of all outside directors. We
provide detailed definitions of other variables in the Appendix. Our pooled sample comprises
2,222 firms with 12,846 firm-year observations.5
Panel A of Table 1 presents the summary statistics for the sample. Board tenure ranges
between 0 and 31 years. Consistent with Spencer and Stuart [2011], the average board tenure is
5 Our sample includes utility and financial firms, although excluding them does not affect our conclusions.

11
8.2 and the median is 7.7. The average age of a CEO is 55 years old, with an average tenure of 8
years and shareholding of 2%. We also note that the majority of our sample firms have independent
boards, with an average of nine board members. We then calculate the standard deviation of board
tenure for each firm and average across all firms. We find that this average is 1.73 (untabulated
result), suggesting that there are significant variations in board tenure across time.
Our sample is further reduced when we consider corporate decisions, as we need additional
information on M&A activity, corporate disclosure, and managerial compensation. We provide
further information on these samples in the Appendix.
3.2 Deaths Sample
Arguably, examining the relation between board composition and firm performance raises
the issue of endogeneity. For example, despite the large body of literature on board independence,
there is surprisingly little evidence of any direct link between board independence and measures
of financial performance or shareholder value (Shivdasani and Zenner [2004]). One possible
reason for this lack of empirical evidence is the endogeneity of board selection (Rosenstein and
Wyatt [1990]). For instance, it may be difficult to estimate the marginal effect of a single board
characteristic if multiple aspects are jointly selected.
We start our analysis by considering a broad sample of firms over a multi-year period using
a large vector of control variables. To address endogeneity more specifically, we supplement our
pooled analysis by studying stock market reactions to announcements of the sudden death of an
outside director. These events represent unexpected exogenous shocks to board tenure, thus
resulting announcement returns should differ depending on where the board is positioned on the
distribution of board tenure. The death of a director is a significant event for the small group of
individuals sitting on a board (as the median board size is nine). Consistent with this view, Nguyen

12
and Nielsen [2011] provide evidence of a significant stock price reaction around the death of an
outside director. We also show in Section 4.5 that sudden deaths have both an economically and a
statistically significant effect on board tenure.
The market response to a director death provides a precise test for the direction of causality.
If the observed tenure-performance relation reflects an optimal level of board tenure, then any
departure from that optimal level will lead to negative announcement returns. Accounting and
finance has a long tradition of using an event study, perhaps starting with Fama et al. [1969]. We
also supplement this analysis by considering the effect of director death (sudden or otherwise) over
a longer period.
We compile the sample of director deaths from various sources. We manually search
Factiva, Edgar, Capital IQ, and S&P Register of Corporations, Directors, and Executives by
keyword for terms related to director (e.g., “director,” “board”) and death (e.g., “passed away,”
“deceased”) for the 1998-2010 period. We then read news articles and on-line filings to determine
the cause of death, and merge these data with the governance information from the IRRC and
Boardex. Our final sample consists of 441 deaths associated with outside directors.6
Further examination of the causes of death reveals that 151 of these 441 deaths were
“sudden deaths,” defined according to Nguyen and Nielsen [2011]. We exclude from the sample
concurrent confounding events, such as merger and acquisition announcements and quarterly
earnings announcements, or any other concurrent news events from Factiva (e.g., Chang, Dasgupta
and Hilary [2010]).
Panel B of Table 1 tabulates the different causes of sudden death in our sample. Deaths
described as “unanticipated” but with no specific cause account for the largest proportion (36%).
6 Table A3 in the Appendix provides a comprehensive reconciliation. The most common explanation for the missing
data is our inability to obtain a proxy statement for a firm traded over-the-counter (OTC).

13
The second most common cause is heart attack (30%), followed by acute illnesses, such as
pneumonia (12%),7 stroke (7%), and accidents (8%).
4. Board tenure and firm performance
4.1 Baseline Regression
Our first set of tests involves panel data estimates relating Tobin’s Q to board tenure and
other corporate governance, CEO, and firm attributes. More specifically, we test the following
specification:
𝑇𝑜𝑏𝑖𝑛𝑖,𝑡 = 𝛼𝑖 + 𝛼𝑡 + 𝛽1 ∗ 𝑇𝑒𝑛𝑢𝑟𝑒𝑖,𝑡−1 + 𝛽2 ∗ 𝑇𝑒𝑛𝑢𝑟𝑒𝑖,𝑡−12 +Γ
′𝑋𝑖,𝑡−1 + 𝜀𝑖,𝑡 (1)
where i indexes firms, t indexes time, and αt and αi denote year and firm fixed effects, respectively.
To alleviate endogeneity concerns, we use lead-lag specifications. We measure the dependent
variables at year t, and all independent variables at year t-1.8 Tenurei,t-1 denotes the average board
tenure of all outside directors, 𝑇𝑒𝑛𝑢𝑟𝑒𝑖,𝑡−12 is the squared term of the average board tenure of all
outside directors, 𝑋𝑖,𝑡−1 is a vector of controls, and εi,t is the error term.
We include control variables that capture the CEO and board characteristics known to be
related to firm value (e.g., Fich and Shivdasani [2006]; Yermac [1996]). We start with a list of 23
variables. We control for a range of CEO characteristics, such as CEO age, CEO tenure, CEO
share ownership, CEO founder status, and CEO-chairman duality. For board characteristics, we
control for tenure diversity, classified board, board independence, busy board status, interlocked
7 Arguably, an acute illness, such as pneumonia, may develop over a short period of time, but the resulting death may
be expected to some extent. However, board members meet four to five times per year on average, and the onset of
acute health conditions may not be immediately discovered by the firm or the media. Thus, these deaths may still
come as a surprise to the market. Another concern is that suicide may be endogenous to firm conditions. We re-run
the tests excluding these two categories of death, and the results continue to hold. 8 Our conclusions are not affected if we do not lag the “stock” control variables. A “stock” variable is measured at a
given date rather than over a period. We present the results of this estimation in Panel F of Table A1 of the Online
Appendix.

14
board, and board size. We also consider a set of firm-level control variables that are likely to be
associated with firm valuation and performance. We control for sales growth, past accounting
performance (ROA) and stock return, firm age, number of acquisitions, goodwill, leverage,
operation segment, firm size, capital expenditures, return volatility, and an IPO/spin-off indicator.
In addition, we control for variables found to be associated with firm value in the cross-listing
literature, such as the liquidity of the firm, the amount of equity issuance, and the amount of debt
issuance (e.g., Lang, Raedy and Yetman [2003]). Further details on the variable definitions are
available in the Appendix. Furthermore, we include firm and year fixed effects. The primary
advantage of these tests is that they help alleviate concerns that our results are attributable to
omitted time invariant (or slow moving) firm characteristics (e.g., industry or location), or common
macroeconomic shocks and time trends. In other words, our test consists of within-group analysis
that relies on comparisons within a given time period and firm.
Column (1) of Table 2 reports the panel regression results for Equation (1). The results
show that an inverted U-shaped relation exists between board tenure and firm value. Both
coefficients of Tenure and Tenure2 are statistically significant at the conventional level. The level
of tenure empirically associated with the maximum Tobin’s Q is approximately 8 to 11 years
(depending on the exact specification). The economic magnitude of the phenomenon is such that
a 5- to 7-year increase in board tenure is associated with an average increase of 2.7% of the sample
standard deviation of the firm value, and a 13- to 11-year decrease in board tenure is associated
with an increase of 1.3% of this standard deviation.9 We find these estimates both plausible and
9 For example, at the five-year tenure, holding all other variables at mean, the predicted Tobin’s Q is 1.697, while at
the seven-year tenure, the predicted Tobin’s Q is 1.720. Therefore, the predicted change in Tobin’s Q is 0.022
(i.e.1.720-1.697). Given that the standard deviation of Tobin’s Q is 0.83, a change of 0.022 in Tobin’s Q is translated
into a 2.69% (0.022/0.83) increase compared with its standard deviation. We follow a similar approach to estimate the
effect of decreasing the tenure length.

15
economically significant, particularly when compared with the effect of other variables. For
example, one standard deviation in capital expenditures is associated with a 4.3% average increase
in Tobin’s Q compared with its standard deviation. The coefficients of control variables are
generally consistent with the results of prior studies.10
To provide a descriptive graphical interpretation of the results, we regress Tobin’s Q on
the control variables (excluding Tenure and Tenure Squared), then plot the residual using locally
weighted polynomial curve (i.e. LOWESS) in Figure 1. The value of Q increases fairly quickly
until board tenure reaches approximately 8 years, then more moderately until it reaches 10 years.
Beyond this tipping point it starts to decrease, moderately up to approximately 11 years, then more
quickly up to 20 years. At that point, the curve becomes flat. However, we note that very few firms
have an average tenure above 20 years (only 1% of the observations), thus the last plateau may be
an artefact of the data.
As Figure 1 presents a relatively flat zone between 8 and 11 years, we create two indicator
variables: D(Tenure<=8) takes the value of 1 if the tenure is below eight years, and 0 otherwise,
and D(Tenure>=11) takes the value of 1 if tenure is above 11 years, and 0 otherwise. We estimate
the following model:
𝑇𝑜𝑏𝑖𝑛𝑖,𝑡 = 𝛼𝑖 + 𝛼𝑡 + 𝛽1 ∗ 𝐷(𝑇𝑒𝑛𝑢𝑟𝑒 ≤ 8)𝑖,𝑡−1 + 𝛽2 ∗ 𝐷(𝑇𝑒𝑛𝑢𝑟𝑒 ≥ 11)𝑖,𝑡−1
+Γ′
𝑋𝑖,𝑡−1
+ 𝜀𝑖,𝑡 (2)
Our benchmark group is firms with tenure between 8 and 11 years. The results in Column
(3) indicate that both variables are significantly negative, suggesting that the optimal tenure is in
the 8-11-year range. The economic magnitude is such that firms with a board tenure below 8 years
10 In contrast to Bebchuk and Cohen [2005], the results indicate that a classified board is positively associated with
Tobin’s Q. This discrepancy is driven by the post-SOX period and our use of firm fixed effects.

16
(above 11 years) are associated with an average decline in firm value of 4.3% (9.7%) of one
standard deviation compared with firms with tenure between 8 and 11 years.
As discussed in the introduction, a key implicit assumption required to
meaningfully estimate Model (1) is that firms do not always optimize their board
tenure. This can happen for different reasons. First, as noted by Itner and Larcker
[2001], firms may not know what the optimal length is, and it may take some time
for the different parties to learn it. This learning process may be relevant in our
setting as we show below that the optimal length varies across firms. Second, even
if this optimal tenure length is known, it may not be possible to immediately reach it. For example,
it is not feasible to increase tenure length if a director leaves (short of letting time pass). Conversely,
it may not be practical, or even feasible, to terminate directors when their tenure is too long. Firms
may have to trade off different attributes. For example, it may not be difficult to retain directors
with specialized knowledge. Firms may have to tradeoff between keeping a director with this
expertise and pushing board tenure beyond its optimal point, or optimizing the tenure length by
forsaking this experience. Agency problems, stock ownerships, legal considerations, social norms,
and other similar factors may also lead firms to retain directors beyond the optimal tenure length.
Generally, relationships between board and CEO established through repeated interactions can
lead to distortions in director selection (Kuhnen [2007]), CEO retention decisions (Nguyen [2008]),
CEO compensation decisions (Hwang and Kim [2009]), and corporate investment decisions
(Fracassi and Tate [2012]).

17
4.2. Sensitivity
We conduct multiple robustness tests. First, several studies (e.g., Bebchuk, Cremers and
Peyer [2011]) show that industry characteristics may drive commonality in firm valuation. To
address this point, we control for firm fixed effects in our main specification. As a robustness
check, we control for industry (at the SIC 2-digit level) and year joint fixed effects. Industry*year
joint fixed effects should absorb any time series variations in industry characteristics that may
confound our results (e.g., Gormley and Matsa [2014]). The results are presented in Panel A of
Table A1 of the Online Appendix. We continue to find a quadratic relation between firm value and
performance and board tenure, with coefficients statistically significant at a minimum of 5% level.
To mitigate any remaining concerns, we also re-estimate Model (1) using accounting performance
(ROA) as a dependent variable (instead of Tobin’s Q). The results reported in Column (2) yield
the same conclusions. However, contemporaneous ROA is affected by decisions that have been
supervised by boards with different characteristics, whereas Q offers a more instantaneous
response to new information if markets are reasonably efficient. The economic magnitude is such
that an increase in board tenure from 5 to 7 years is associated with an increase in ROA of 4.3%
of the variable standard deviation, while a decrease in board tenure from 13 to 11 years is
associated with an increase of 1.2%.11
The second set of robustness checks concerns our econometric specifications. To alleviate
the concern that other unobservable firm-level factors may drive our results, we consider two
alternative specifications. First, we consider a vector of 15 additional firm-year controls. We
control for other aspects of board diversity, such as gender, ethnicity, age diversity, and director
11 For example, holding all other variables at mean, the predicted change in ROA when board tenure changes from 5
to 7 years is 0.298. Given that the standard deviation of ROA is 6.90, a change of 0.298 in ROA is translated into a
4.3% (0.298/6.90) increase in average ROA compared with its standard deviation. We follow a similar approach to
measure the reduction of the average tenure length.
18
shareholding (we provide details on these variables in the Appendix). Fama [1980] argues that an
efficient labor market provides implicit incentives for directors. We measure the implicit
incentives associated with career concerns using the average age of directors and the percentage
of directors who are close to retirement age. 12 Another concern is that the board tenure-
performance relation may stem from differences in the experience of board members. We use the
proportion of directors who have a concurrent outside executive position as a proxy for functional
experience. Malmendier, Tate, and Yan [2011] use a CEO birth cohort as a proxy for life
experience, and show that differences in life experience influence CEOs’ corporate finance
policies. Following their analysis, we use a director birth cohort as a proxy for life experience. To
construct a board-level measure of directors’ life experience, we calculate the percentage of
directors belonging to each birth cohort. In addition, we control for the liquidity of the firm, the
amount of equity issuance, and the amount of debt issuance (e.g., Fich and Shivdasani [2006];
Becker and Stromberg [2012]).
The results reported in Columns (5) and (6) of Table 2 indicate that the variables of interest
remain significant at the 1% level. However, most of the additional controls are statistically
insignificant. In fact, an F-test indicates that the vector of additional controls is jointly statistically
insignificant with a p-value of 0.51. To further alleviate the concern that differences in firm
performance may be attributable to differences in unobservable CEO qualities, we add CEO fixed
effects in addition to firm and year fixed effects. Column (7) and (8) of Table 2 show that we
12 The correlation between director age and director tenure is only 45%, which suggests that a significant proportion
of the variation in director tenure is not related to director age. There is no consensus on the retirement age of directors,
nor is there an age limit on director retirement. We use the retirement age of 70 as the cut-off age, which is consistent
with industry practice following a survey by Spencer and Stuart [2011] and prior studies (e.g., Yermack [2004];
Gibbon and Murphy [1992]).

19
continue to find an inverted U-shaped relation between tenure and performance, and the variables
of interest remain significant at the 5% level.
4.3. CEO Power
Overall, our results in Table 2 suggest that an average tenure of approximately 10 years is
associated with the highest equity valuation, while it starts to drop beyond that point. However, it
is likely that this negative effect is stronger for firms in which the CEO is entrenched. To test this
conjecture, we consider three alternative proxies for CEO power: CEO tenure length (Finkelstein
and Hambrick [1990]), CEO status as a founder, and CEO status as the chairperson of the board
(Fich and Shivdasani [2006]). We estimate Model (2) on subsamples of firms with different
attributes (i.e. partitioned by CEO power), and use stacked regressions.13
We present the results in Table 3. Panels A and D tabulate the results based on CEO tenure
length, Panels B and E tabulate the results based on CEO duality, and Panels C and F tabulate the
results based on founder status. Panels A, B, and C tabulate the results using Tobin’s Q as the
dependent variable, while Panels D, E, and F tabulate the results using ROA as the dependent
variable. We estimate the full Model (2) but only tabulate the key statistics.
In five out of six cases, D(Tenure>=11) is statistically larger (in absolute value) in the
sample of firms with high CEO power (the difference is insignificant in the last case). In all six
cases, we observe no statistically significant difference for D(Tenure<=8) between firms with
different levels of CEO entrenchment. D(Tenure>=11) is statistically different from zero in the
six subsamples of firms with high CEO power, but only in five out of six subsamples of firms with
13 In Table 2, we use both a quadratic specification and one based on indicator variables. In Table 3, we focus on the
latter, as this allows us to estimate directly how CEO power or information complexity affects each curve segment. In
contrast, estimating the former would require us to interpret the cross-partial derivatives of a non-linear function.

20
low CEO power. Overall, these results are consistent with the hypothesis that long board tenure
has a greater effect when CEO power is high.
4.4. Information Complexity
It has long been recognized that the effectiveness of outside directors depends on their
access to information (e.g., Duchin, Matsusaka and Ozbas [2010]; Adams and Ferreira [2007]).
Specifically, when the cost of acquiring firm-specific information is high, outside directors are less
effective at monitoring and advising management than when the cost of information is low. Our
results in Table 2 suggest that an average tenure of approximately 10 years is associated with the
highest equity valuation. Before this point, the equity value drops as the average tenure goes
toward zero. However, it is likely that this negative effect is stronger for firms in which the
economic situation is more complex. To test this conjecture, we consider three alternative proxies
for information complexity: analyst coverage, forecast dispersion, and forecast accuracy (e.g.,
Duchin, Matsusaka and Ozbas [2010]).14 We divide the sample based on the median values of the
three proxies, and estimate Model (2) using stacked regressions in each subsample. We use both
Tobin’s Q and ROA as the dependent variables.
The results reported in Table 4 are largely consistent across the three partitions. Panels A
and D present the results based on analyst coverage, Panels B and E present the results based on
forecast dispersion, and Panels C and F present the results based on forecast errors. Panels A, B,
and C tabulate the results using Tobin’s Q as the dependent variable, while Panels D, E, and F
14 Following Duchin, Matsusaka and Ozbas [2010], we use size-adjusted analyst coverage measure, which is defined
as the residual of regressing analyst coverage on firm size. Our conclusions are not affected when we use non-adjusted
analyst coverage measure.

21
tabulate the results using ROA as the dependent variable. We estimate the full Model (2) but only
tabulate the key statistics.
In all six panels, D(Board tenure<=8) is larger (in absolute value) in subsamples of firms
with high information complexity (i.e., low coverage, high dispersion, and high forecast errors)
than in subsamples of firms with low complexity. The difference is statistically significant in all
six cases, with p-values ranging from 0.00 to less than 0.09. In none of the six cases do we observe
a statistical difference in the coefficients of D(Board tenure>=11) between the two types of
subsamples. D(Board tenure<=8) is statistically different from zero in the six high information
complexity subsamples, but in none of the low information complexity subsamples. Overall, these
results are consistent with the hypothesis that short board tenure has a greater effect when
information complexity is high.
4.5. Sudden Deaths
To provide further evidence of a causal relation between board tenure and firm value, we
consider a largely exogenous shock to the board average tenure: sudden deaths of directors.
Although we cannot entirely exclude the possibility that some deaths are at least partially caused
by poor firm performance, this situation is likely to be rare and we address this concern in the next
section. The shock is indeed economically important. For example, the average board tenure
decreases by approximately 15% after the death of an outside director (from 8.25 years before the
death to 7.25 afterward). This difference is statistically significant at the 5% level. We hypothesize
that when the sudden death of an outside director moves board tenure away from its value-
maximizing level, it will be followed by a negative announcement return, and that when a
director’s death moves board tenure closer to the value-maximizing level, it will be positively
received by the market. The “event-study” approach relies on the absence of systematic bias when

22
market participants process information. Based on Figure 1 and Table 2, we initially choose 10
years as the cut-off value for board tenure.
Panel A of Table 5 reports the results for announcement returns conditional on the direction
of the change in board tenure. We compare board tenure immediately before and after the sudden
death of a director. We set the indicator variable “Move away from 10 years” to 1 if the sudden
death of a director induces board tenure to move away from the optimal level of 10 years. We
tabulate unwinsorized announcement returns in Panel A, winsorized returns at the top and bottom
one percentile in Panel B, and median returns in Panel C. We obtain consistent results across
different panels. The results show that sudden deaths that move board tenure toward 10 years are
associated with a mean (median) abnormal announcement return of 1% (0.4%), whereas sudden
deaths that move board tenure away from 10 years are associated with a negative mean (median)
abnormal announcement return of 1.4% (0.9%). The difference is statistically significant at the 1%
level. In Table A5 of the Online Appendix, we consider the returns in three cases: board tenure
moves away from the 8-11-year range, tenure moves closer to the 8-11-year range, and tenure
remains within the 8-11-year range following a sudden death. The results indicate that the average
returns are −1% and 0.8% in the first two cases (with t-statistics of −2.5 and 1.7), respectively. The
average (or median) return is statistically undistinguishable from zero in the third case. The
difference in announcement returns is inconsistent with a reverse causality argument that poor firm
performance leads to prolonged board tenure.
4.6. All Deaths
Next, we consider the full death sample (sudden or otherwise) using a long window
approach. This sample offers a setting in which the average tenure is subject to a large shock that
is reasonably uncorrelated with the pre-existing firm value. The motivation for this test is that firms
23
cannot physically add additional years of firm-specific board experience when a director dies. This
increases the likelihood that frictions will lead to a temporary deviation from the optimal tenure
level (at least in the case of lack of experience). It generalizes the approach that we follow in the
previous section, and allows us to consider the effect of death over a longer period. We re-estimate
Model (1) cross-sectionally in the year following the director’s death. We report the results in
Table 6. Column (1) uses Tobin’s Q as the dependent variable and Column (2) uses ROA as the
dependent variable. In both columns, we find the familiar quadratic relation between board tenure
and firm performance. Both tenure and tenure squared are statistically significant. The economic
magnitude of the phenomenon is such that a 5- to 7-year increase in board tenure is associated with
an average increase of 6.9% of the sample standard deviation of the Tobin’s Q, and a 13- to 11-
year decrease in board tenure is associated with an increase of 10% of this standard deviation.
Overall, our results support the causal interpretation that changes in board tenure cause changes in
firm valuation.
5. Corporate Decisions
If the relation between board tenure and firm value reflects a trade-off between knowledge
and entrenchment, then corporate policies and decisions should reflect the same trade-off. In this
section, we investigate whether board tenure has an inverted U-shaped relation with important
corporate decisions influenced by the board: 1) M&A performance (Masulis, Wong, and Xie
[2007]), 2) financial reporting quality (Farber [2005]), and 3) CEO compensation (Bebchuk,
Cremers, and Peyer [2011]). For each type of decision, we analyze our pooled sample and consider

24
the death sample for disclosure quality and managerial compensation (sample attrition prevents us
from performing this analysis for the market reaction around M&A announcements).15
5.1. M&A Performance
We obtain a sample of acquisitions from the Securities and Data Corporation’s (SDC)
Merger and Acquisitions database, to empirically test the relation between board tenure and M&A
performance. We follow Masulis Wong and Xie [2007] and impose a few additional filters
(detailed in the Appendix). Our final sample consists of 2,884 acquisitions made between 1998
and 2010. We measure bidder announcement returns over a two-day window (CAR [0,1]), in which
day 0 is the acquisition announcement date provided by the SDC. As a robustness check, we also
consider CAR [-2,2], the market reaction over a five-day announcement window.
In our baseline specification, we consider the 23 standard variables used in Model (1). In
addition, we control for three deal characteristics: Deal Size and two indicator variables denoting
whether the target is a public company (Public Target) and whether the deal is executed on an all-
cash basis (All Cash Deal).
Column (1) in Panel A of Table 7 presents the results for an ordinary least squares (OLS)
regression in which two-day announcement returns is the dependent variable. Column (2) reports
the results when we consider the five-day window. In both cases, we find the expected inverted U-
shaped relation between acquisition announcement returns and board tenure. The results are
consistent with the interpretation that boards with shorter tenure make better investment decisions
that lead to higher firm valuations, whereas boards with longer tenure are more likely to engage in
value destroying acquisitions.
15 For completeness, we connect the valuation result of board tenure to these corporate decisions using a structural
equation modeling (SEM) approach. We present the results in Section VI of the Online Appendix.

25
5.2. Financial Reporting Quality
Several studies (e.g., Farber [2005]) examining the relation between board characteristics
and financial reporting quality show that board structure correlates with financial reporting quality.
To capture financial reporting quality, we use four alternative proxies. The first is the accrual
quality measure derived from Dechow and Dichev [2002], augmented by the fundamental
variables in Jones [1991], which are used extensively in the literature (e.g., McNichols [2002]).
Second, we consider the amount of abnormal accruals by calculating the absolute value of the
residuals in the McNichols model. We multiply both abnormal accruals and the accrual quality
measure by −1, so that the values increase with financial reporting quality. Third, following Khan
and Watts [2009], we use an accounting conservatism measure (C-Score). Watts [2003] argues
that conservatism constrains opportunistic managerial behavior and offsets managerial biases with
its asymmetrical verifiability requirement, and is thus likely to constitute an efficient financial
reporting mechanism in the absence of complete contracting. Fourth, we consider restatements
(Cheng and Farber [2008]; Armstrong et al. [2013]). However, this last proxy presents some
unique characteristics, as restatements are relatively rare and are clustered among firms with
unique characteristics. To address these issues, we obtain a list of restatements from AuditAnalytics.
We then match these observations with non-restating firms using propensity score matching
method (we discuss the details of this procedure in Section V of the Online Appendix). Finally,
we estimate logit regression using the matched sample.
Panel B of Table 7 reports the results of the pooled sample. In addition to the standard set
of 23 control variables, we control for asset tangibility (Tangibility), dividend-paying status
(Dividend), operating cycle (Operating Cycle), volatility of operating cash flow (Vol(CFO)),
volatility of sales (Vol(Sales)), and cash-assets ratio (Cash), which are demonstrated to affect

26
reporting quality (e.g., Biddle, Hilary, and Verdi [2009]). We find that financial reporting quality
first increases and then decreases with board tenure using all four measures of financial reporting
quality. Both the linear and the squared terms of board tenure are statistically significant at
conventional levels.
5.3. CEO Compensation
Next, we consider the effect of board tenure on compensation. We examine three aspects
of compensation: the level (measured by the overall compensation), the excess compensation, and
the sensitivity to performance (measured by the log of the compensation delta). We present the
results of the pooled sample in Panel C of Table 7. In both cases, we observe the familiar inverted
U-shape. A level of tenure close to the optimal reduces excess compensation and increases the
pay-performance sensitivity.
5.4. All Death-Corporate Decisions
Table 8 reports the results of the death sample for financial reporting quality (Column 1 to
3) and for CEO compensation (Column 4 to 6). Following the same intuition as our test for firm
performance, we re-estimate Model (1) cross-sectionally in the year following the director’s death.
Across the three measures of financial reporting quality, we continue to find a quadratic relation
between board tenure and financial reporting quality. For CEO compensation analysis, we find
that death of directors that moves tenure close to the optimal reduces excess compensation and
increases the pay-performance sensitivity. Overall, the results suggest that financial reporting
quality and better compensation contracting are channels through which board tenure affects firm
valuation.

27
6. Further Analysis
6.1. Functional Form
Our analysis so far has focused on the quadratic relation between the mean board tenure
and different corporate variables. The arguments presented in Section 2 theoretically support this
approach (rather than using a cubic specification, for example). Empirically, the approach is also
supported by the non-parametric descriptive statistics in Figure 1, which clearly display a quadratic
pattern. The use of the mean (rather than the median, for example) is less clear from a theoretical
point of view, but the results in Table A1 (Panels B and C) of the Online Appendix indicate that
using the median or mode (instead of the average) tenure results in similar conclusions.
However, the dispersion of tenure may be used as an alternative to the length. Wahid [2012],
for example, considers the coefficient of correlation (i.e., the ratio of the volatility to the average
length of tenure) as a measure of dispersion. To ensure that our analysis is meaningful, we include
the standard deviation of tenure in all of our regressions, and the variables of interest remain
significant at the 5% level. We consider alternative measures of tenure diversity, such as the range
and the Herfindahl index of tenure. We report these results in Panels D and E of Table A1 of the
Online Appendix. We continue to find an inverted U-shape relation between firm value and board
tenure with these alternative measures. Similarly, including or excluding the range or the
Herfindahl index does not affect our conclusion. We note that the volatility, range, and Herfindahl
index are statistically insignificant in most of the specifications when controlling for the tenure
length (i.e. the denominator of the coefficient of correlation). In addition, Columns (5) and (6) of
Table 2 further control for other forms of board diversity that are studied in the literature, such as
diversity in gender, ethnicity, and age. As reported, these additional controls do not affect our
analysis. This lack of robust significance is broadly consistent with the findings in the
organizational literature. For example, in their literature review, Williams and O’Reilly [1998]

28
find that tenure diversity can be associated with both positive and negative effects on team
performance, depending on the study.
Nevertheless, it is possible that dispersion conditionally affects our results. In fact, van
Knippenberg and Schippers [2007], in another review of the organizational literature, call for
greater attention to the interaction effect between group diversity and mediators or moderators on
firm performance. To explore this, we re-estimate Model (2) and partition the sample based on the
median value of two tenure diversity measures: the tenure standard deviation and the Herfindahl
index of tenure. We present the results in Table A2 of the Online Appendix. When we focus on
low board tenure observations, we observe no difference across cells (i.e., board tenure dispersion
is not relevant to explain differences across cells). This is true irrespective of whether we use
Tobin’s Q or ROA as the dependent variable. However, when we consider high tenure dispersion,
we observe that the negative effect of long tenure is more pronounced when tenure dispersion is
low (measured by the volatility or the Herfindahl index). The difference is statistically significant
at the 1% and 7% levels, respectively, when Tobin’s Q is the dependent variable. This result
supports the idea that high dispersion in tenure length mitigates the under-monitoring problem.
We observe a qualitatively similar pattern when we consider the effect on ROA. The point
estimates of the coefficients are more negative in the low dispersion samples (but these differences
are not statistically significant).
6.2. Specialized Committees
Finally, it is possible that a shock to tenure from the death of a director may have a greater
effect if the deceased is the Chairperson of the board (when the Chairperson is not the CEO) or a
committee chair. However, examining one type of director at a time yields extremely noisy
coefficient estimates. We further investigate this aspect by grouping directors who are Chairperson

29
of the board or chair of a committee. We also reproduce the analysis for audit committee members,
but focus on financial reporting in that case. The results are largely inconclusive. Across the
different specifications, we find that the basic inverted U-shape is present in the different
subsamples. However, we do not observe a pattern that is qualitatively different in these
subsamples from the one that we observe in the overall sample (based on the entire board). One
possible explanation for this finding is that the full board takes the important decisions. Another
issue is that this test does not benefit from substantial statistical power. A typical board in our
sample has approximately seven outside directors, while a typical committee has about four
outside directors. In this context, it is difficult to distinguish between the effect of director tenure
on the full board and on different committees.
7. Conclusion
We investigate the relation between average board tenure and both firm performance and
corporate decisions, while holding other firm, CEO, and board characteristics constant. We find
that average board tenure has an inverted U-shaped relation with firm value, and that this relation
is also reflected in M&A performance, financial reporting quality, and CEO compensation. The
results indicate that for firms with short-tenured boards, the marginal effect of board learning
dominates the entrenchment effect, whereas for firms with long-tenured boards, the entrenchment
effect dominates the learning effect. We further show that the marginal benefit of learning depends
on firms’ governance and information environment. Specifically, we find that information
complexity exacerbates the cost of short board tenure, and that CEO entrenchment exacerbates the
cost of long board tenure.
Our results hold for a pooled sample using specifications that control for a large number of
potentially confounding effects. They also hold when we examine stock market reactions to

30
announcements of the sudden death of an outside director (an unexpected exogenous shock to
board tenure) in short windows, and when we consider a longer window immediately following
the death of an external director. The results of these tests are consistent with a causal interpretation
that board tenure drives changes in firm value.
We note that our conclusions are subject to different caveats. For example, the results based
on the pooled sample rely on the premise that adjustment costs or frictions prevent firms from
optimizing board tenure all the time. In addition, the results based on market reactions rely on the
fact that prices can aggregate information in an unbiased way.

31
References
ADAM, R., AND D. FERREIRA. “A Theory of Friendly Boards.” Journal of Finance 62 (2007):
217-250.
ARMSTRONG, C.; D. LARCKER, G ORMAZABAL; AND D. TAYLOR. “The Relation
between Equity Incentives and misreporting: The Role of Risk-taking Incentives.” Journal of
Financial Economics 109 (2013): 327-350.
BAKER, M.; J, STEIN; AND J, WURGLER. “When Does the Market Matter? Stock Prices and
the Investment of Equity-Dependent Firms.” Quarterly Journal of Economics 118 (2003): 969-
1005.
BEBCHUK, L., AND A. COHEN. “The Cost of Entrenched Boards.” Journal of Financial
Economics 78 (2005): 409-433.
BEBCHUK, L.; M. CREMERS; AND U. PEYER. “The CEO Pay Slice.” Journal of Financial
Economics 102 (2011): 199-221.
BECKER, B., AND P. STROMBERG. “Fiduciary Duties and Equity-debtholder Conflicts.”
Review of Financial Studies 25 (2012): 1931-1969.
BELL, T.; M. CAUSHOLLI; AND R. KNECHEL. “Audit Firm Tenure, Non-audit Services, and
Internal Assessments of Audit Quality.” Journal of Accounting Research 53 (2015): 461-509.
BIDDLE, G.; G. HILARY; AND R. VERDI. “How Does Financial Reporting Quality Relate to
Investment Efficiency?” Journal of Accounting and Economics 48 (2009): 112-131.
CAREY, P., AND R. SIMNETT. “Audit Partner Tenure and Audit Quality.” The Accounting
Review 81 (2006): 653-676.
CELIKYURT, U.; M. SEVILIR; AND A. SHIVDASANI. “Venture Capitalist on Boards of
Mature Public Firms.” Review of Financial Studies (2012): 1-46.
CHANG, Y. Y.; S. DASGUPTA, AND G. HILARY. “CEO Ability, Pay, and Firm Performance.”
Management Science 56 (2010): 1633-1652.
CHENHALL, R., AND F. MOERS. “The Issue of Endogeneity within Theory-based Quantitative
Management Accounting Research.” European Accounting Review 16 (2007): 173-196.
CHENG, Q., AND D. FARBER. “Earnings restatement, changes in CEO compensation and firm
performance.” The Accounting Review 83 (2008): 1217-1250.
CHHAOCHHARIA, V., AND Y. GRINSTEIN. “Corporate Governance and Firm Value: The
Impact of the 2002 Governance Rules.” Journal of Finance 62 (2007): 1789-1825.
CHHAOCHHARIA, V., AND Y. GRINSTEIN. “CEO Compensation and Board Structure.”
Journal of Finance 64 (2009): 231-261.
CHI, W., AND H. HUANG. “Discretionary Accruals, Audit Firm Tenure and Audit-partner
Tenure: Empirical Evidence from Taiwan.” Journal of Contemporary Accounting and
Economics 1 (2005): 65-92.
COLES, J.; N. DANIEL, AND L. NAVEEN. “Managerial Incentives and Risk-Taking.” Journal
of Financial Economics 79 (2006): 431-468.
COLES, J.; N. DANIEL; AND L. NAVEEN. “Calculation of Compensation Incentives and Firm-
related Wealth using Execucomp: Data, Program and Explanation.” SSRN working paper
(2013).
CORE, J. AND W. GUAY. “Estimating the value of employee stock option portfolios and their
sensitivities to price and volatility.” Journal of Accounting Research 40 (2002): 613-630.
DAVIS, L. R.; B. S. SOO; AND G. M. TROMPETER. “Auditor Tenure and the ability to Meet or
Beat Earnings Forecasts.” Contemporary Accounting Research 26 (2009): 517-48.

32
DEMSETZ, H., AND K. LEHN. “The Structure of Corporate Ownership: Causes and
Consequences” Journal of Political Economy 93 (1985): 1155-1177.
DECHOW, P., AND I. DICHEV. “The Quality of Accruals and Earnings: The Role of Accrual
Estimation Errors.” The Accounting Review 77 (2002): 35-59.
DUCHIN, R.; J. MATSUSAKA; AND O. OZBAS. “When are Outside Directors Effective.”
Journal of Financial Economics 96 (2010): 195-214.
FAMA, E. F.; L. FISHER; M.C. JENSEN; AND R. ROLL. “The Adjustment of Stock Prices to
New Information.” International Economic Review 10 (1969): 1-21.
FAMA, E. “Agency Problems and the Theory of Firms.” Journal of Political Economy 88 (1980):
288-307.
FARBER, D. “Restoring Trust after Fraud: Does Corporate Governance Matter?” The Accounting
Review 80 (2005): 539-561.
FICH, E., AND A. SHIVDASANI. “Are Busy Boards Effective Monitors?” Journal of Finance
61 (2006): 689-724.
FINKELSTEIN, S., AND D. HAMBRICK. “Top-Management-team Tenure and Organizational
Outcomes: The Moderating role of Managerial Discretion.” Administrative Science Quarterly
35 (1990): 484-503.
FRACASSI, C., AND G. TATE “External Networking and Internal Firm Governance.” Journal
of Finance 67, (2012): 153-194.
GHOSH, A., AND D. MOON. “Auditor Tenure and Perceptions of Audit Quality.” The
Accounting Review 80 (2005): 585-613.
GIBBON, R., AND K. MURPHY. “Optimal Incentive Contracts in Presence of Career Concerns:
Theory and Evidence.” Journal of Political Economy 100 (1992): 468-505.
GORMLEY, T., AND D. MATSA. “Common Errors: How to (and Not to) Control for Unobserved
heterogeneity.” Review of Financial Studies 27 (2014): 617-661.
GUTHRIE, K., SOKOLOWSKY, J., AND K. WAN. 2011 “CEO Compensation and Board
Structure Revisited.” Journal of Finance 67 (2011): 1149-1168.
HERMALIN, B., AND M. WEISBACH. “Endogenously Chosen boards of Directors and their
Monitoring of the CEO.” American Economic Review 88 (1998): 96-118.
HWANG, B., AND S. KIM. “It Pays to Have Friends.” Journal of Financial Economics 93 (2009):
138-158.
ISS 2013-2014 Policy Survey. https://www.issgovernance.com/file/files/ISS2013-
2014PolicySurveyResultsReport.pdf
ITTNER, C. D., AND D. LARCKER. “Assessing Empirical Research in Managerial Accounting:
A Value-based Management Perspective.” Journal of Accounting and Economics 32 (2001):
349-410.
JONES, J. “Earnings Management during Import Relief Investigations.” Journal of Accounting
Research 29 (1991): 193-228.
KHAN, M., AND R. WATTS. “Estimation and Empirical Properties of a Firm-year Measure of
Accounting Conservatism.” Journal of Accounting and Economics 48 (2009): 132-150.
KLINE, R. “Assumptions of Structural Equation Modeling.” In R. Hoyle (Ed.), Handbook of
structural equation modeling (pp. 111-125). (2012): New York: Guilford Press.
KOTHARI, S.P.; A. LEONE; AND C. WASLEY. “Performance Matched Discretionary Accrual
Measure.” Journal of Accounting and Economics 39 (2005): 163-197.
KUHNEN, C. “Social Networks, Corporate Governance and Contracting in the Mutual Fund
Industry.” (2007): Mimeo.

33
LANG, M.; J. S. RAEDY; AND M.H. YETMAN. "How Representative are Firms that are Cross-
listed in the United States? An analysis of accounting quality." Journal of Accounting Research
41 (2003): 363-386.
LARCKER, D. F. “Discussion of ‘Are Executive Stock Options Associated with Future Earnings?”
Journal of Accounting and Economics 36 (2003): 91-103.
LIST, C. “Group Knowledge and Group Rationality: A Judgment Aggregation Perspective.”
Episteme 2 (2005): 25-38.
MALMENDIER, U.; G. TATE; AND J. YAN. “Overconfidence and Early-life Experiences: The
Effect of Managerial Traits on Corporate Financial Policies.” Journal of Finance 66 (2011):
1687-1733.
MANSI, S. A., W.F. MAXWELL; AND D. MILLER. “Does Auditor Quality and Tenure Matter
to Investors? Evidence from the Bond Market.” Journal of Accounting Research 42 (2004):
755-793.
MASULIS, R.; C. WONG; AND F., XIE. “Corporate Governance and Acquirer Returns.” Journal
of Finance 62 (2007): 1851-1889.
MCNICHOLS, M. “Discussion of the Quality of Accruals and Earnings: The Role of Accrual
Estimation Errors.” The Accounting Review 77 (2002): 61-69.
MILGROM, P., AND J, ROBERTS. “Economics, Organization and Management.” Englewood
Cliffs, NJ: Prentice Hall, 1992.
MYERS, J. N.; L.A. MYERS; AND T.C., OMER. “Exploring the Term of the Auditor-client
Relationship and the Quality of Earnings: A case for Mandatory Auditor Rotation.” The
Accounting Review 78(2003): 779-799.
NGUYEN, B. D. “Does the Rolodex Matter? Corporate Elite’s Small World and the Effectiveness
of Boards of Directors.” (2008): Mimeo.
NGUYEN, B. D., AND K. NIELSEN. “The Value of Independent Directors: Evidence from
Sudden Deaths.” Journal of Financial Economics 98 (2011): 550-567.
PAULY, M., AND M. VAN HEES. “Logical Constraints on Judgement Aggregation.” Journal of
Philosophical Logic 35 (2006): 569-585.
POZEN, R., AND T. HAMACHER. “The Trend towards Board Term Limits is Based on Faulty
Logic.” Financial Times, May 31, 2015.
ROSENSTEIN, S., AND J. WYATT. “Outside Directors, Board Independence and Shareholder
Wealth.” Journal of Financial Economics 26 (1990): 175-191.
SHIVDASANI, A., AND M. ZENNER. “Best Practices in Corporate Governance: What Two
Decades of Research Reveal.” Journal of Applied Corporate Finance 16 (2004): 29-41.
Spencer and Stuart, Spencer and Stuart Annual Board Governance Index 2011. Spencer and Stuart.
SZULANSKI, G., AND R. JENSEN. “Presumptive Adaptation and the Effectiveness of
Knowledge Transfer.” Strategic Management Journal 27 (2006): 937-957.
VAN KNIPPENBERG, D., AND M.C. SCHIPPERS. “Work Group Diversity.” Annual Review of
Psychology 58 (2007): 515-541.
VON HIPPEL, E. “Sticky Information and the Locus of Problem Solving: Implications for
Innovation.” Management Science 40 (1994): 429-439.
WAHID, A. “Director Heterogeneity and its Impact on Board Effectiveness.” Unpublished
working paper (2012): Harvard University.
WALTON, R. “The diffusion of New Work Structures: Explaining Why Success Didn’t Take.”
Organizational Dynamics 3 (1975): 3-21.

34
WATTS, R. “Conservatism in Accounting Part I: Explanations and Implications.” Accounting
Horizons 17 (2003): 207-221.
WILLIAMS K. Y., AND C.A. O’REILLY. “Diversity in Organizations: A Review of 40 Years of
Research.” Research in Organizational Behavior 20 (1998): 77-140.
YERMACK, D. “Higher Market Valuation of Companies with a Small Board of Directors.”
Journal of Financial Economics 40 (1996): 185-211.
YERMACK, D. Remuneration Retention and Reputation Incentives for Outside Directors.”
Journal of Finance 59 (2004): 2281-2308.

35
Appendix: Variable Definition and Sample Construction
Firm Performance Measures
1. Tobin: Market value of equity plus book value of assets minus the sum of book value of
common equity and deferred taxes, all divided by the book value of assets.
2. ROA: Log of one plus ROA, where ROA is the net income plus extraordinary items and
discontinued operations, all divided by lagged total assets.
Merger and Acquisition Measures
1. Sample Construction
We obtain a sample of acquisitions from the Securities and Data Corporation’s (SDC) Merger and
Acquisitions database from 1998 to 2010. We follow Masulis, Wong and Xie [2007] and impose
a few additional filters: the acquisition must be completed.
1. The acquirer must control less than 50% of the target’s shares prior to the
announcement, and must own 100% of the target’s shares after the transaction.
2. The deal value must be disclosed in SDC, and must exceed US$1 million.
3. The acquirer must be included in the IRRC database with valid tenure information.
4. The relevant financial information and share price information are available from
Compustat and CRSP.
2. Announcement Returns
We measure bidder announcement returns over a two-day window (CAR [0,1]), in which day 0 is
the acquisition announcement date provided by the SDC. As a robustness check, we also consider
CAR [-2,2], the market reaction over a five-day announcement window. We use the CRSP value-
weighted return as the market return, and estimate market model parameters over the 200-day
period from event day-210 to event day-11. The choices of model and parameters are similar to
those used in prior studies, such as Masulis, Wong and Xie [2007].
Financial Reporting Quality Measures
1. Abnormal Accrual
We examine abnormal accruals (Abn_Accruals), which are widely used to study earnings
management (Dechow and Dichev [2002]; McNichols, 2002; Kothari, Leone, and Wasley [2005].
Following Dechow and Dichev [2002] and McNichols [2002], we estimate the following model
by year for each of the 48 Fama-French industries, requiring at least 20 observations for each
estimation:
TAi, t = α0 + α1CFOi, t-1 + α2CFOi, t + α3CFOi, t+1 + α4∆Sales, t+ α5PPEi, t+εi, t (A1)
where CFO is the operating cash flow, measured as the sum of net income, depreciation and
amortization, and changes in current liabilities, minus changes in current assets, scaled by average

36
total assets. ∆Sales refers to the change in sales revenue, and PPE denotes property, plants, and
equipment. The absolute value of the residuals from the above regression serves as our measure of
abnormal accruals. We further multiply the absolute value of the residuals by -1 to arrive at a
measure that increases with financial reporting quality.
2. Accrual Quality
Accrual Quality at year t is calculated as the standard deviation of the residuals from Model (A1)
during the years t-5 to t-1. We multiply the accrual quality measure by -1 so that the value
increases with financial reporting quality.
3. C-score
The C-score is constructed based on Basu’s (1997) model as follows:
* ,i 1 2 i 3 i 4 i i iX D R D R e
where X is the earnings over the market value of equity at the prior fiscal year end, R is the annual
stock return, and D is an indicator variable that equals 1 if R < 0, and 0 otherwise. The coefficient
β4 captures the incremental timeliness of bad news over good news, that is, accounting
conservatism. Khan and Watts (2009) assume that β3 and β4 are linear functions of firm-specific
characteristics each year, as follows:
,
3 1 2 i 3 i 4 i
4 1 2 i 3 i 4 i
Size MB Lev
CScore Size MB Lev
where Size is the log of the market value of equity, MB is the ratio of the market value of equity to
the book value of equity, and Lev is the total debt divided by the market value of equity. Thus, the
annual cross-sectional regression model that is used to estimate C-score can be written as follows:
( ) ( )
( ) ,
i 1 2 i i 1 2 i 3 i 4 i i i 1 2 i 3 i 4 i
1 i 2 i 3 i 4 i i 5 i i 6 i i i
X D R Size MB Lev D R Size MB Lev
Size MB Lev D Size D MB D Lev
where the coefficients δ1 to δ6 capture the independent effects of firm-specific variables and their
interactions with D on earnings, while the coefficients λ1 to λ4 are used to construct the C-score.
We estimate the above equation cross-sectionally for each industry with at least 20 observations
in a given year based on the Fama-French 48 industry classification.
4. Restatement
We collect data on accounting restatements from Audit Analytics. To be included in our sample,
each restatement must have a start and an end date. We use these dates to determine the fiscal year
to which the restatement applies. A firm is classified as restating its results for a given year if any
financial results (quarterly, annual, or otherwise) are subsequently restated. This classification
tracks the year(s) to which the restatement applies, rather than the year during which the
restatement is announced. (Armstrong et al. [2013]).
CEO Compensation Measures

37
We obtain CEO compensation data from the Execucomp database.
1. Total Compensation: Log of CEO total compensation.
2. Delta: Log of compensation delta. Delta measures the dollar change in wealth associated with
a 1% change in the firm’s stock price, and originates from Coles Daniel and Naveen [2006,
2013] and Core and Guay [2002].
3. Excess Compensation: Excess compensation received by CEO. It is calculated as the residual
of regressing log total compensation on past stock return, stock volatility, firm size, and year
and industry fixed effects.
Independent Variables
1. Board Tenure is the average tenure of all outside directors, where a director’s tenure is
calculated as the year of the annual meeting (IRRC variable meetingdate) minus the start year
of directorship (variable dirsince) minus any breaks in the directorship service (indicated by
the variable priorserv).16 We base the classification of directors on the IRRC classification
(variable classification).17 There are four cases in which conflicting starting year information
may be recorded for the same director in the same company. 1) The same director ID is
assigned to two different individuals. We resolve this issue by checking the original SEC filing.
2) Directors appointed between two annual meetings are usually ratified by shareholders in the
next shareholder meeting. If an appointment and the subsequent annual meeting occur in
different years, conflicting starting year information will be recorded on the SEC filing (and in
the IRRC). In this case, we use the appointment year. 3) Some directors are re-appointed to the
board after a break in service, and the IRRC may record the year of the most recent appointment.
Instead, we use the year of the first appointment and adjust for breaks in service when
calculating a director’s tenure. 4) An inconsistent starting year may be recorded before and
after a corporate transformation (e.g., incorporation, M&A, re-organization). We use the
starting year of the predecessor firm.
2. D(Board Tenure<=8): An indicator variable that equals 1 if the board tenure is equal to or less
than 8 years, and 0 otherwise.
3. D(Board Tenure>=11): An indicator variable that equals 1 if the board tenure is equal to or
more than 11 years, and 0 otherwise.
4. Std Dev of Board Tenure: Standard deviation of board tenure.
16 The IRRC stopped collecting the priorserv indicator variable in 2003. We manually collect this variable for
subsequent years by searching proxy statements for each director. For each director identified as having prior service
with the board, we manually collect the period of prior service on the board. 17 As noted in Chhaochharia and Grinstein (2009), the IRRC uses a more stringent definition of independence to
classify directors than stock exchange listing rules. For example, under stock exchange listing rules, a past employee
of the company may qualify as an independent director as long as the employment relationship ends more than three
years before the board appointment. However, the IRRC treats such a director as a non-independent director. Guthrie,
Sokolowsky, and Wan (2011) show that the re-classification of a director’s independence may introduce systematic
bias. In this study, we focus on the tenure of non-executive directors.

38
5. CEO Age: Age of CEO.
6. CEO Tenure: Tenure of CEO.
7. CEO Shareholding: Percentage of outstanding shares owned by the CEO.
8. CEO-Founder: An indicator variable that equals 1 if the CEO is the founder of the firm, and 0
otherwise. We identify founder information from two sources: 1) the CEO has the title of
“Founder” or “Co-Founder” disclosed in the IRRC, Execucomp, or Boardex, and 2) the CEO
joined the firm before an IPO.
9. CEO-Chair: An indicator variable that equals 1 if the CEO is also the Chairman of the board,
and 0 otherwise.
10. Classified Board: An indicator variable that equals 1 if the board is staggered, and 0 otherwise.
11. Independent Board: An indicator variable that equals 1 if the board has a majority of
independent directors, and 0 otherwise.
12. Busy Board: An indicator variable that equals 1 if a majority of directors hold more than three
directorships, and 0 otherwise.
13. Interlocked Board: An indicator variable that equals 1 if the board is interlocked with another
company as defined by Execucomp, and 0 otherwise.
14. Board Size: Number of directors on the board.
15. Sales Growth: Growth in sales.
16. LagROA: One year lagged ROA, where ROA is the net income plus extraordinary items and
discontinued operations, all divided by lagged total assets.
17. Stock Return: Log of one plus the stock return over the last year.
18. Firm Age: Log of firm age. We calculate firm age from the year a firm was founded. We
estimate the founding year from three sources: we first collect firm age data from Jay Ritter’s
website, in which he collects the age of firms from the founding year. Second, we manually
search for the remaining firms in Capital IQ and Hoover. If neither of these two sources
provides the necessary information, we use the first year when the stock appears in the CRSP
database as the founding year.
19. Num Acq: Number of acquisitions.
20. Goodwill: Goodwill scaled by total assets.
21. Leverage: Short-term debt plus long-term debt, all divided by total assets.
22. Num Seg: Number of business segment disclosed under Compustat Segment files.
23. Firm Size: Log of total assets.
24. Capex: Capital expenditures over total assets.
25. Risk: Log of the standard deviation of the daily stock return over the last year.
26. IPO: An indicator variable that equals 1 if a firm is spun off or listed in that year.
27. Gender Diversity: Blau index of directors’ gender. The Blau Index is calculated as 1 − ∑ 𝑝2𝑠𝑖=1 ,
where s is the number of categories, and p is the fraction of directors belonging to category i.
Gender is measured over two groups: female and male.
28. Ethnic Diversity: Blau index of directors’ ethnicity. The Blau Index is calculated as 1 −
∑ 𝑝2𝑠𝑖=1 , where s is the number of categories, and p is the fraction of directors belonging to

39
category i. Ethnicity is measured over six groups: Caucasian, Indian American, Asian,
Hispanic, Black, and Other.
29. Age Diversity: Blau index of directors’ age cohort. The Blau Index is calculated as 1 − ∑ 𝑝2𝑠𝑖=1 ,
where s is the number of categories, and p is the fraction of directors belonging to category i.
Age is measured in terms of birth cohorts, which are 10-year periods starting in 1920, 1930,
1940, 1950, 1960, and 1970.
30. Director Shareholding: Average share ownership of directors.
31. % Retirement Age Directors: Percentage of directors that are over 70 years of age.
32. Director Age: Average age of directors.
33. % Outside Executives: Percentage of directors that work as executives.
34. % Born in XXX Cohort: Percentage of directors born in XXX birth cohort, where XXX are
10-year periods starting in 1920, 1930, 1940, 1950, 1960, and 1970. We use the percentage of
directors born in 1970 as the holdout group in the regression.
35. Equity Issuance: Following Baker, Stein, and Wrugler [2003], we calculate the amount of
equity issuance as the change in common equity plus the change in deferred taxes minus the
change in retained earnings, all scaled by total assets.
36. Debt Issuance: Percentage change in total liabilities.
37. Liquidity: Current assets over current liabilities.
38. Analyst Coverage: Following Duchin, Matsusaka and Ozbas [2010], we calculate size-adjusted
analyst coverage, which is the residual from a regression of the number of analysts on firm
size.
39. Forecast Errors: Absolute value of the difference between analyst forecasts and actual EPS,
scaled by total assets.
40. Forecast Dispersion: Standard deviation of forecast errors, scaled by total assets.
41. Public Target: An indicator variable that equals 1 if the acquisition target is a public firm, and
0 otherwise.
42. All Cash Deal: An indicator variable that equals 1 if the acquisition is conducted using all cash,
and 0 otherwise.
43. Deal Size: Total value of the transaction over market value.
44. Tangibility: Net PPE over assets.
45. Dividend: An indicator variable that equals 1 if the firm pays dividend in year t, and 0 otherwise.
46. Operating Cycle: Log of 360 times the sum of receivables over sales and inventory over COGS.
47. Vol (CFO): Volatility of operating cash flow over the last 5 years, where CFO is the operating
cash flow, measured as the sum of net income, depreciation and amortization, and changes in
current liabilities, minus changes in current assets, scaled by average total assets.
48. Vol (Sales): Volatility of sales over the last 5 years, where we scale sales by the average total
assets.
49. Cash: Cash over total assets.
50. Tenure Median: Median tenure of all outside directors.
51. Tenure Mode: Mode tenure of all outside directors.

40
52. Board Tenure HHI: The Herfindahl index is defined as the sum of the squared percentage,
where the percentage is the tenure of outside director i over the sum of the tenure of all outside
directors.
53. Board Tenure Range: Maximum director tenure minus minimum director tenure.
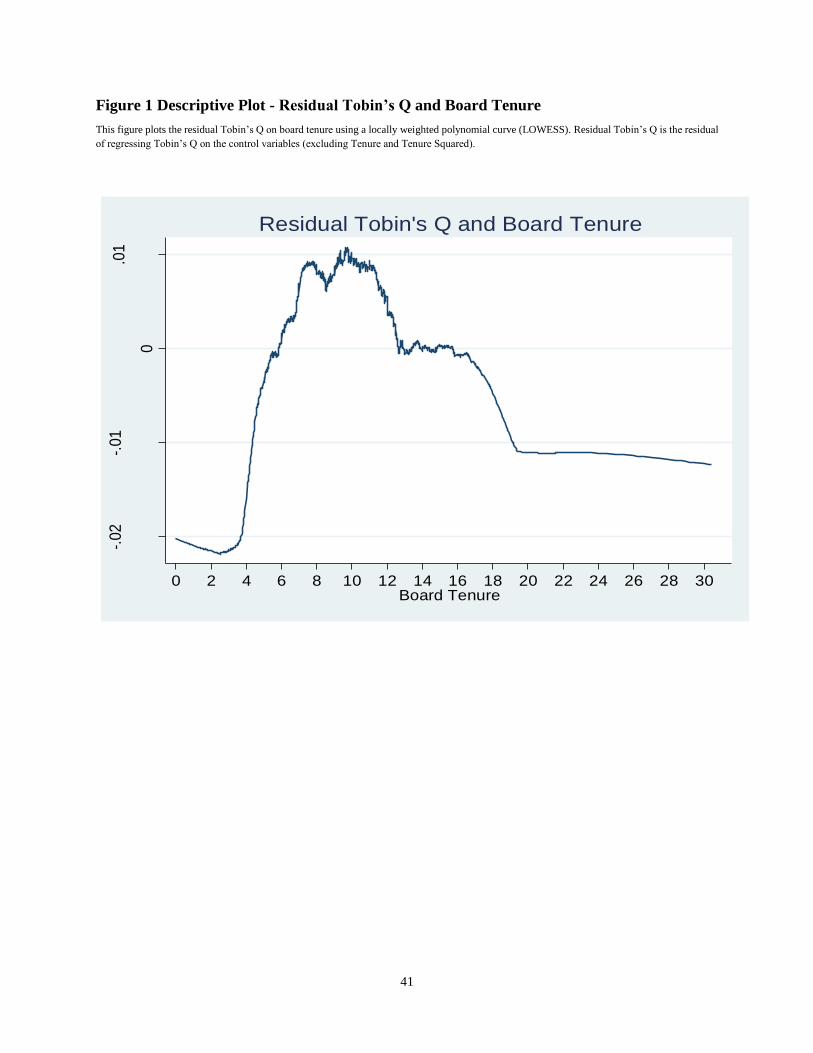
41
Figure 1 Descriptive Plot - Residual Tobin’s Q and Board Tenure
This figure plots the residual Tobin’s Q on board tenure using a locally weighted polynomial curve (LOWESS). Residual Tobin’s Q is the residual
of regressing Tobin’s Q on the control variables (excluding Tenure and Tenure Squared).
-.02
-.01
0
.01
Resi
du
al T
ob
in's
Q
0 2 4 6 8 10 12 14 16 18 20 22 24 26 28 30Board Tenure
Residual Tobin's Q and Board Tenure

42
Table 1 Summary Statistics
The sample period is from 1998 to 2010. We define all variables in the Appendix. We multiply ROA by 100. Panel A reports summary statistics of our pooled sample. Panel B reports the causes of sudden death.
Panel A Pooled Sample
N Mean Median Std P25 P75
Tobin 12034 1.73 1.46 0.83 1.14 2.05
ROA 11604 5.06 5.22 6.90 2.09 8.96
Board tenure 12034 8.22 7.71 3.64 5.71 10.00
Std dev of board tenure 12034 6.07 5.51 3.38 3.67 7.84
CEO age 12034 55.58 56.00 6.98 51.00 60.00
CEO tenure 12034 8.23 6.00 7.13 3.00 11.00
CEO shareholding 12034 2.00 0.29 4.96 0.08 1.06
CEO-Founder 12034 0.20 0.00 0.40 0.00 0.00
CEO-Chair 12034 0.61 1.00 0.49 0.00 1.00
Classified board 12034 0.38 0.00 0.48 0.00 1.00
Independent board 12034 0.85 1.00 0.35 1.00 1.00
Busy board 12034 2.26 2.00 2.09 1.00 3.00
Interlocked board 12034 0.05 0.00 0.21 0.00 0.00
Board size 12034 9.27 9.00 2.34 8.00 11.00
Sale growth 12034 0.11 0.08 0.23 0.00 0.18
LagROA 12034 5.10 5.40 8.32 2.22 9.37
Stock return 12034 0.04 0.08 0.43 -0.17 0.30
Firm age 12034 3.75 3.71 0.75 3.18 4.41
Num acq 12034 0.14 0.00 0.49 0.00 0.00
Goodwill 12034 0.11 0.05 0.14 0.00 0.18
Leverage 12034 0.23 0.22 0.17 0.07 0.34
Num seg 12034 1.77 1.00 1.32 1.00 2.00
Firm size 12034 7.43 7.31 1.47 6.41 8.38
Capex 12034 0.06 0.04 0.05 0.02 0.07
Risk 12034 -2.30 -2.30 0.50 -2.64 -1.96
IPO 12034 0.00 0.00 0.06 0.00 0.00
Gender Diversity 12034 0.16 0.18 0.14 0.00 0.28
Ethnic Diversity 12034 0.29 0.31 0.19 0.17 0.46
Age Diversity 12034 0.58 0.60 0.11 0.52 0.66
Director shareholding 12034 0.38 0.00 1.15 0.00 0.16
% Retirement age directors 12034 0.13 0.11 0.14 0.00 0.20
Director age 12034 61.00 61.14 4.18 58.44 63.71
% Outside executives 12034 0.16 0.13 0.14 0.00 0.25
% born in 1930 cohort 12034 0.04 0.00 0.09 0.00 0.07
% born in 1940 cohort 12034 0.25 0.23 0.18 0.11 0.38
% born in 1950 cohort 12034 0.43 0.43 0.19 0.30 0.56
% born in 1960 cohort 12034 0.22 0.20 0.17 0.10 0.33
% born in 1970 cohort 12034 0.04 0.00 0.08 0.00 0.08
Equity Issuance 10990 0.02 0.01 0.08 -0.01 0.03
Debt Issuance 12011 0.17 0.06 0.46 -0.04 0.21
Liquidity 12034 2.21 1.77 1.60 1.21 2.63

43
Table 1 Summary Statistics, Continued
Panel B Death Sample
Cause of sudden death N %
Accidents 13 8.61
Heart attack 46 30.46
Murder 1 0.66
Stroke 11 7.28
Sudden death undisclosed causes 55 36.42
Acute illness 18 11.92
Suicide 7 4.64
Total sudden death 151 Deaths other than sudden 290 Total deaths 441

44
Table 2 Board Tenure and Firm Value
The sample period is from 1998 to 2010. We define all variables in the Appendix. We multiply the coefficient associated with ROA by 100.
Constants are included but not displayed in all regressions. We measure all monetary items in 2002 dollars, and present t-statistics in parentheses.
***, **, and * denote significance of coefficients at the 1%, 5%, and 10% levels, respectively. We correct standard errors for heteroscedasticity
and clustering of observations at the firm level.
(1) (2) (3) (4) (5) (6) (7) (8)
Tobin ROA Tobin ROA Tobin ROA Tobin ROA
Board tenure 0.028 0.341 0.039 0.353 0.021 0.246
(2.76)*** (3.69)*** (3.46)*** (3.43)*** (1.88)* (2.21)**
Board tenure squared -0.0014 -0.016 -0.002 -0.015 -0.001 -0.012
(-3.39)*** (-4.18)*** (-3.18)*** (-3.73)*** (-2.96)*** (-2.71)***
D(Board tenure<=8) -0.036 -0.275 (-1.88)* (-2.35)**
D(Board tenure>=11) -0.081 -0.267 (-3.76)*** (-2.70)***
Std dev of board tenure 0.000 -0.021 0.003 0.003 -0.002 -0.031 0.004 -0.076
(0.10) (-0.58) (0.76) (0.09) (-0.44) (-0.78) (0.78) (-1.70)*
CEO age -0.003 -0.053 -0.003 -0.055 -0.002 -0.054 -0.009 0.004
(-1.62) (-2.77)*** (-1.63) (-2.83)*** (-0.99) (-2.67)*** (-0.90) (0.04)
CEO tenure 0.006 0.068 0.006 0.071 0.006 0.076 0.020 0.471
(2.56)** (3.29)*** (2.60)*** (3.38)*** (2.42)** (3.59)*** (0.72) (1.57)
CEO shareholding 0.000 0.005 -0.000 0.003 0.001 0.002 -0.004 0.010
(0.04) (0.21) (-0.04) (0.14) (0.28) (0.07) (-1.36) (0.38)
CEO-Founder 0.006 -0.170 0.007 -0.148 0.023 -0.050 0.273 0.100
(0.13) (-0.41) (0.16) (-0.36) (0.47) (-0.12) (0.08) (0.05)
CEO-Chair -0.002 0.188 -0.000 0.204 -0.010 0.281 -0.032 -0.020
(-0.11) (1.04) (-0.01) (1.13) (-0.49) (1.51) (-1.43) (-0.09)
Classified board 0.055 -0.070 0.056 -0.054 0.059 0.005 0.034 -0.105
(2.99)*** (-0.38) (3.05)*** (-0.30) (3.12)*** (0.03) (1.96)** (-0.57)
Independent board 0.001 0.015 0.001 0.015 0.011 0.001 -0.005 -0.034
(0.05) (0.07) (0.03) (0.07) (0.42) (0.01) (-0.17) (-0.14)
Busy board 0.008 -0.030 0.008 -0.026 0.009 -0.037 0.004 -0.069
(1.24) (-0.52) (1.24) (-0.45) (1.27) (-0.62) (0.60) (-1.00)
Interlocked board -0.095 -0.605 -0.090 -0.563 -0.105 -0.677 -0.103 -0.676
(-2.42)** (-1.85)* (-2.32)** (-1.71)* (-2.60)*** (-2.00)** (-2.45)** (-2.05)**
Board size -0.013 -0.029 -0.014 -0.040 -0.009 -0.000 -0.011 -0.012
(-2.08)** (-0.54) (-2.25)** (-0.74) (-1.39) (-0.00) (-1.76)* (-0.18)
Sale growth 0.076 1.302 0.076 1.299 0.066 1.882 0.068 1.337
(2.59)*** (3.57)*** (2.60)*** (3.56)*** (2.05)** (4.92)*** (2.24)** (3.18)***
LagROA 0.005 0.096 0.005 0.097 0.005 0.090 0.002 0.039
(4.41)*** (6.95)*** (4.46)*** (7.03)*** (4.31)*** (6.18)*** (2.10)** (2.47)**
Stock return 0.193 2.948 0.193 2.953 0.195 3.020 0.151 2.884
(13.17)*** (17.24)*** (13.17)*** (17.25)*** (12.74)*** (16.97)*** (10.13)*** (16.52)***
Firm age -0.212 0.183 -0.191 0.529 -0.229 -0.552 -0.141 1.974
(-1.77)* (0.17) (-1.60) (0.51) (-1.85)* (-0.51) (-1.01) (1.27)
Num acq 0.031 0.508 0.031 0.505 0.031 0.511 0.032 0.564
(2.13)** (3.73)*** (2.15)** (3.70)*** (2.07)** (3.59)*** (2.22)** (3.91)***
Goodwill -0.776 -5.656 -0.767 -5.601 -0.798 -6.393 -0.584 -6.688
(-7.02)*** (-5.45)*** (-6.94)*** (-5.36)*** (-6.94)*** (-6.16)*** (-4.50)*** (-4.86)***
Leverage -0.596 -3.876 -0.589 -3.825 -0.706 -4.538 -0.531 -2.794
(-6.90)*** (-4.43)*** (-6.82)*** (-4.36)*** (-7.28)*** (-4.77)*** (-5.29)*** (-2.67)***
Num seg -0.008 -0.086 -0.009 -0.090 -0.008 -0.164 -0.010 -0.124
(-0.97) (-0.98) (-1.06) (-1.02) (-0.95) (-1.84)* (-1.04) (-1.17)

45
Table 2 Board Tenure and Firm Value, Continued
(1) (2) (3) (4) (5) (6) (7) (8)
Tobin ROA Tobin ROA Tobin ROA Tobin ROA Firm size -0.138 -0.234 -0.140 -0.241 -0.138 -0.516 -0.159 -0.499
(-5.22)*** (-0.77) (-5.30)*** (-0.79) (-4.85)*** (-1.66)* (-5.31)*** (-1.06)
Capex 0.840 3.818 0.859 4.007 0.725 1.654 0.284 2.450
(3.41)*** (1.70)* (3.49)*** (1.78)* (2.91)*** (0.72) (1.08) (0.96)
Risk 0.039 -0.460 0.040 -0.456 0.039 -0.372 0.012 -0.137
(2.31)** (-2.47)** (2.39)** (-2.45)** (2.19)** (-1.91)* (0.71) (-0.67)
IPO 0.092 -0.638 0.087 -0.711 0.074 -1.035 0.103 -0.564
(0.97) (-0.60) (0.91) (-0.66) (0.70) (-0.81) (0.89) (-0.57)
Gender diversity -0.154 -1.097 (-1.54) (-1.18)
Ethnic diversity -0.000 0.275 (-0.00) (0.67)
Age diversity -0.157 -0.826 (-1.42) (-0.76)
Director shareholding 0.000 -0.035 (0.04) (-0.39)
% Retirement age directors -0.036 0.091 (-0.39) (0.11)
Director age -0.001 0.028 (-0.15) (0.51)
% Outside executives -0.001 0.315 (-0.02) (0.50)
% born in 1930 cohort 0.075 1.846 (0.23) (0.58)
% born in 1940 cohort 0.261 2.471 (1.00) (0.94)
% born in 1950 cohort 0.344 1.976 (1.35) (0.75)
% born in 1960 cohort 0.576 4.010 (2.16)** (1.48)
% born in 1970 cohort 0.562 3.312 (1.81)* (1.07)
Equity Issuance -0.036 -3.798 (-0.37) (-3.60)***
Debt Issuance 0.014 -0.338 (0.93) (-2.08)**
Liquidity -0.021 -0.367 (-2.00)** (-3.57)***
Observations 12,034 12,846 12,034 12,846 10,314 10,593 12,034 12,846
R-squared 0.708 0.569 0.709 0.568 0.713 0.579 0.774 0.652
Firm fixed effect Yes Yes Yes Yes Yes Yes Yes Yes
CEO fixed effect No No No No No No Yes Yes
Year fixed effect Yes Yes Yes Yes Yes Yes Yes Yes

46
Table 3 CEO Power
The sample period is from 1998 to 2010. We estimate the following regressions for each subsample: 𝐹𝑖𝑟𝑚𝑉𝑎𝑙𝑖,𝑡 = 𝛼𝑖 + 𝛼𝑡 + 𝛽1𝐷(𝑇𝑒𝑛𝑢𝑟𝑒 ≤ 8)𝑖,𝑡−1 + 𝛽2𝐷(𝑇𝑒𝑛𝑢𝑟𝑒 ≥ 11)𝑖,𝑡−1 +Γ𝑋𝑖,𝑡−1 + 𝜀𝑖,𝑡 , where i indexes firm,
and t indexes year. 𝛼𝑖 𝑎𝑛𝑑 𝛼𝑡 are firm and year fixed effects, respectively. 𝐹𝑖𝑟𝑚𝑉𝑎𝑙𝑖,𝑡 is measured by Tobin’s Q (Panel A to Panel C) or ROA (Panel D to Panel F). High (Low) CEO Tenure is an indicator variable equal
to 1 if the CEO tenure is above (below) median, and 0 otherwise. CEO-Chair (No CEO-Chair) is an indicator variable equal to 1 if a CEO is also (is not) the chairman of the board. CEO-Founder (No CEO-Founder) is
an indicator equal to 1 if a CEO is also (is not) the founder of the firm. We define all other variables in the Appendix. For Panel A and D, we include all control variables under Column (1) of Table 2 other than CEO
Tenure. For Panel B and E, we include all control variables under Column (1) of Table 2 other than CEO-Chair Duality. For Panel C and F, we include all control variables under Column (1) of Table 2 other than CEO-
Founder status. The last column of each panel compares the difference in coefficients across two subsamples using seemingly unrelated estimations, and we report the p-value of two-sided t-tests. We measure all monetary
items in 2002 dollars. We multiply the coefficient associated with ROA by 100. We present t-statistics in parentheses. ***, **, and * denote significance of coefficients at the 1%, 5%, and 10% levels, respectively. We
correct standard errors for heteroscedasticity and clustering of observations at the firm level.
Tobin's Q as a measure of firm performance ROA as a measure of firm performance
Panel A CEO Tenure Panel D CEO Tenure
High CEO Tenure Low CEO Tenure test of difference High CEO Tenure Low CEO Tenure test of difference
(1) (2) in coefficients (3) (4) in coefficients
Tobin Tobin p-value ROA ROA p-value
D(Board tenure<=8) -0.080 -0.048 0.399 D(Board tenure<=8) -0.546 -0.487 0.887
(-2.91)*** (-1.77)* (-1.83)* (-1.71)* D(Board tenure>=11) -0.163 -0.068 0.032 D(Board tenure>=11) -0.959 -0.140 0.036
(-5.15)*** (-2.21)** (-3.58)*** (-1.69)*
Controls Yes Yes Controls Yes Yes Observations 6,590 5,650 Observations 7,048 6,039 R-squared 0.711 0.705 R-squared 0.546 0.582 Firm fixed effect Yes Yes Firm fixed effect Yes Yes Year fixed effect Yes Yes Year fixed effect Yes Yes
Panel B CEO-Chair Duality Panel E CEO-Chair Duality
CEO-Chair No CEO-Chair test of difference CEO-Chair No CEO-Chair test of difference
(1) (2) in coefficients (3) (4) in coefficients
Tobin Tobin p-value ROA ROA p-value
D(Board tenure<=8) -0.048 -0.098 0.226 D(Board tenure<=8) -0.318 -1.028 0.161
(-1.98)** (-2.87)*** (-1.53) (-2.22)** D(Board tenure>=11) -0.110 -0.100 0.828 D(Board tenure>=11) -0.752 -0.109 0.087
(-3.40)*** (-2.99)*** (-3.10)*** (-0.37)
Controls Yes Yes Controls Yes Yes Observations 7,281 4,753 Observations 7,697 5,149 R-squared 0.741 0.753 R-squared 0.663 0.592 Firm fixed effect Yes Yes Firm fixed effect Yes Yes Year fixed effect Yes Yes Year fixed effect Yes Yes

47
Table 3 CEO Power, Continued
Panel C CEO-Founder Panel F CEO-Founder
CEO-Founder No CEO-Founder test of difference CEO-Founder No CEO-Founder test of difference
(1) (2) in coefficients (3) (4) in coefficients
Tobin Tobin p-value ROA ROA p-value
D(Board tenure<=8) -0.090 -0.058 0.548 D(Board tenure<=8) -0.739 -0.377 0.511
(-1.88)* (-2.69)*** (-1.47) (-1.65)* D(Board tenure>=11) -0.205 -0.094 0.093 D(Board tenure>=11) -1.126 -0.517 0.098
(-2.90)*** (-4.16)*** (-2.25)** (-2.34)**
Controls Yes Yes Controls Yes Yes Observations 2,437 9,597 Observations 2,624 10,222 R-squared 0.739 0.715 R-squared 0.621 0.575 Firm fixed effect Yes Yes Firm fixed effect Yes Yes Year fixed effect Yes Yes Year fixed effect Yes Yes

48
Table 4 Information Complexity
The sample period is from 1998 to 2010. We estimate the following regressions for each subsample: 𝐹𝑖𝑟𝑚𝑉𝑎𝑙𝑖,𝑡 = 𝛼𝑖 + 𝛼𝑡 + 𝛽1𝐷(𝑇𝑒𝑛𝑢𝑟𝑒 ≤ 8)𝑖,𝑡−1 + 𝛽2𝐷(𝑇𝑒𝑛𝑢𝑟𝑒 ≥ 11)𝑖,𝑡−1 +Γ𝑋𝑖,𝑡−1 + 𝜀𝑖,𝑡 , where
i indexes firm, and t indexes year. 𝛼𝑖 𝑎𝑛𝑑 𝛼𝑡 are firm and year fixed effects, respectively. 𝐹𝑖𝑟𝑚𝑉𝑎𝑙𝑖,𝑡 is measured by Tobin’s Q (Panel A to Panel C) or ROA (Panel D to Panel F). High (Low) Coverage
is an indicator variable equal to 1 if the size-adjusted analyst coverage is above (below) median, and 0 otherwise. Size-adjusted analyst coverage is the residual from a regression of analyst coverage on firm size. High (Low) Forecast Dispersion is an indicator variable equal to 1 if the forecast dispersion is above (below) median, and 0 otherwise. High (Low) Forecast Error is an indicator variable equal
to 1 if the analyst forecast error is above (below) median, and 0 otherwise. We define all other variables in the Appendix. We include all control variables in Column (1) of Table 2. The last column of
every panel compares the difference in coefficients across two subsamples using seemingly unrelated estimations, and we report the p-value of two-sided t-tests. We multiply the coefficient associated with ROA by 100. We measure all monetary items in 2002 dollars, and present t-statistics in parentheses. ***, **, and * denote significance of coefficients at the 1%, 5%, and 10% levels, respectively.
We correct standard errors for heteroscedasticity and clustering of observations at the firm level.
Tobin's Q as a measure of firm performance ROA as a measure of firm performance
Panel A Analyst Coverage Panel D Analyst Coverage
High Coverage Low Coverage test of difference High Coverage Low Coverage test of difference
(1) (2) in coefficients (3) (4) in coefficients
Tobin Tobin p-value ROA ROA p-value
D(Board tenure<=8) -0.020 -0.141 0.001 D(Board tenure<=8) -0.024 -1.312 0.004
(-0.75) (-5.23)*** (-0.10) (-3.43)***
D(Board tenure>=11) -0.128 -0.079 0.240 D(Board tenure>=11) -0.378 -0.796 0.243
(-4.01)*** (-2.71)*** (-1.54) (-2.58)**
Controls Yes Yes
Controls Yes Yes
Observations 6,475 5,559 Observations 6,881 5,965
R-squared 0.759 0.663 R-squared 0.597 0.608
Firm fixed effect Yes Yes Firm fixed effect Yes Yes
Year fixed effect Yes Yes Year fixed effect Yes Yes
Panel B Forecast Dispersion Panel E Forecast Dispersion
High Forecast Dispersion Low Forecast Dispersion test of difference High Forecast Dispersion Low Forecast Dispersion test of difference
(1) (2) in coefficients (3) (4) in coefficients
Tobin Tobin p-value ROA ROA p-value
D(Board tenure<=8) -0.121 -0.026 0.013 D(Board tenure<=8) -1.006 -0.247 0.089
(-3.53)*** (-0.95) (-2.50)** (-1.08)
D(Board tenure>=11) -0.131 -0.090 0.323 D(Board tenure>=11) -0.932 -0.364 0.166
(-3.28)*** (-2.94)*** (-2.75)*** (-1.44)
Controls Yes Yes Controls Yes Yes
Observations 6,123 5,911 Observations 6,470 6,376
R-squared 0.716 0.773 R-squared 0.618 0.604
Firm fixed effect Yes Yes Firm fixed effect Yes Yes
Year fixed effect Yes Yes Year fixed effect Yes Yes
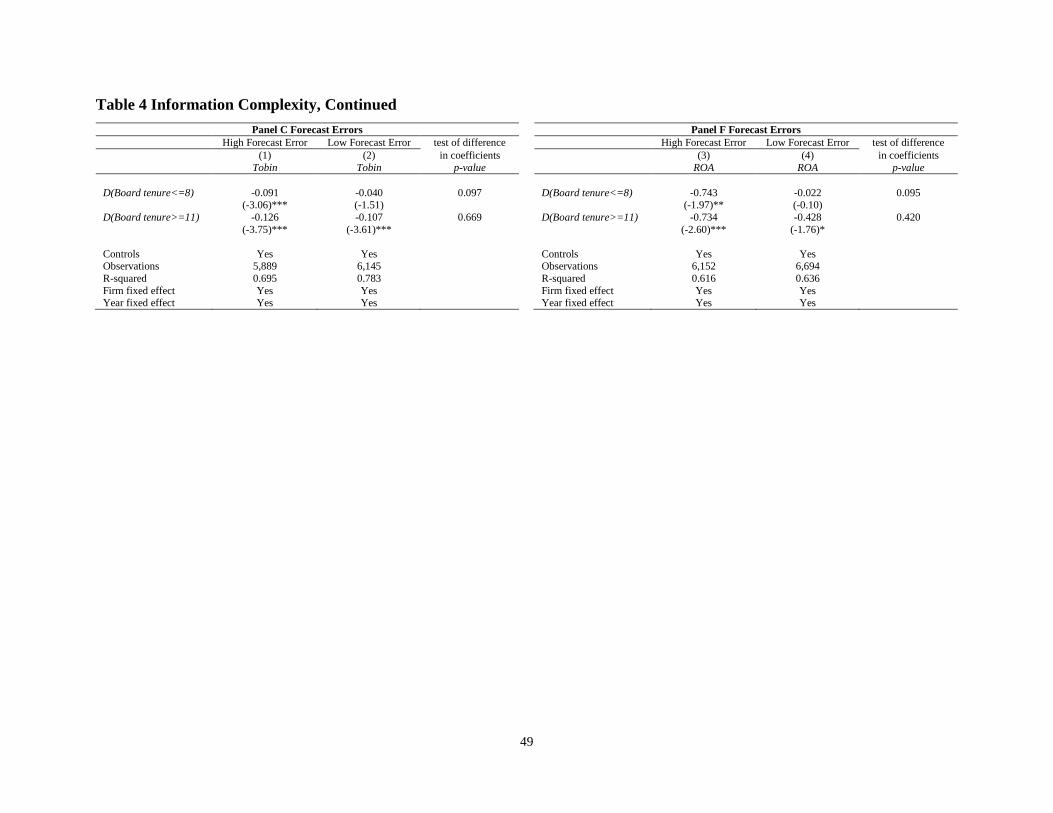
49
Table 4 Information Complexity, Continued
Panel C Forecast Errors Panel F Forecast Errors
High Forecast Error Low Forecast Error test of difference High Forecast Error Low Forecast Error test of difference
(1) (2) in coefficients (3) (4) in coefficients
Tobin Tobin p-value ROA ROA p-value
D(Board tenure<=8) -0.091 -0.040 0.097 D(Board tenure<=8) -0.743 -0.022 0.095
(-3.06)*** (-1.51) (-1.97)** (-0.10)
D(Board tenure>=11) -0.126 -0.107 0.669 D(Board tenure>=11) -0.734 -0.428 0.420
(-3.75)*** (-3.61)*** (-2.60)*** (-1.76)*
Controls Yes Yes Controls Yes Yes
Observations 5,889 6,145 Observations 6,152 6,694
R-squared 0.695 0.783 R-squared 0.616 0.636
Firm fixed effect Yes Yes Firm fixed effect Yes Yes
Year fixed effect Yes Yes Year fixed effect Yes Yes
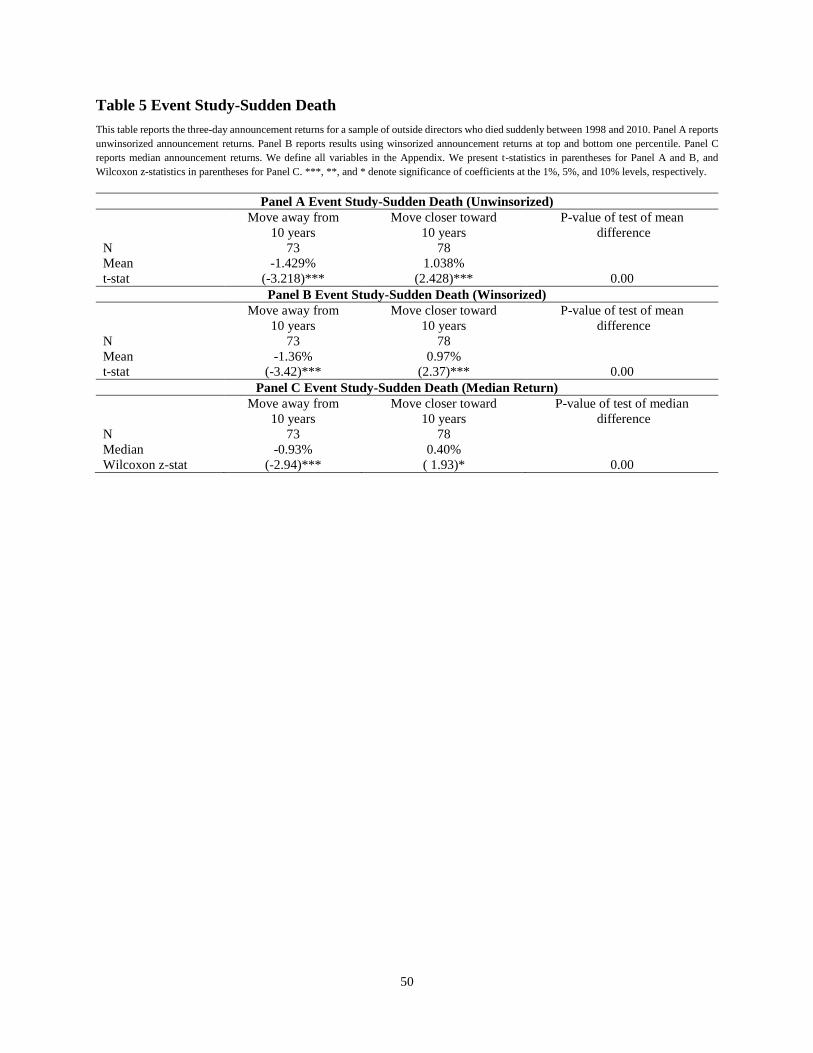
50
Table 5 Event Study-Sudden Death
This table reports the three-day announcement returns for a sample of outside directors who died suddenly between 1998 and 2010. Panel A reports
unwinsorized announcement returns. Panel B reports results using winsorized announcement returns at top and bottom one percentile. Panel C
reports median announcement returns. We define all variables in the Appendix. We present t-statistics in parentheses for Panel A and B, and
Wilcoxon z-statistics in parentheses for Panel C. ***, **, and * denote significance of coefficients at the 1%, 5%, and 10% levels, respectively.
Panel A Event Study-Sudden Death (Unwinsorized)
Move away from
10 years
Move closer toward
10 years
P-value of test of mean
difference
N 73 78 Mean -1.429% 1.038% t-stat (-3.218)*** (2.428)*** 0.00
Panel B Event Study-Sudden Death (Winsorized)
Move away from
10 years
Move closer toward
10 years
P-value of test of mean
difference
N 73 78 Mean -1.36% 0.97% t-stat (-3.42)*** (2.37)*** 0.00
Panel C Event Study-Sudden Death (Median Return)
Move away from
10 years
Move closer toward
10 years
P-value of test of median
difference
N 73 78 Median -0.93% 0.40% Wilcoxon z-stat (-2.94)*** ( 1.93)* 0.00

51
Table 6 Regression-Death Sample
The sample period is from 1998 to 2010. The table reports the regression results for a sample of outside directors who died between 1998 and 2010.
We define all variables in the Appendix. We multiply the coefficient associated with ROA by 100. Constants are included but not displayed in all
regressions. We measure all monetary items in 2002 dollars, and present t-statistics in parentheses. ***, **, and * denote significance of coefficients
at the 1%, 5%, and 10% levels, respectively. We correct standard errors for heteroscedasticity and clustering of observations at the firm level.
(1) (2)
Tobin ROA
Board tenure 0.102 1.021
(1.66)* (1.71)*
Board tenure squared -0.0061 -0.047
(-2.62)*** (-2.31)**
Std dev of board tenure 0.040 0.113
(1.12) (0.40)
CEO age 0.009 -0.055
(0.70) (-0.65)
CEO tenure 0.010 0.137
(0.87) (1.45)
CEO shareholding -0.006 -0.017
(-0.29) (-0.12)
CEO-Founder -0.095 -0.426
(-0.39) (-0.22)
CEO-Chair -0.032 0.666
(-0.17) (0.42)
Classified board 0.082 0.620
(0.64) (0.47)
Independent board -1.560 -2.796
(-1.34) (-0.34)
Busy board 0.037 -0.127
(1.45) (-0.46)
Interlocked board -0.997 -7.872
(-1.39) (-1.06)
Board size -0.058 -0.764
(-1.99)** (-2.26)**
Sale growth 0.488 -1.049
(1.29) (-0.14)
LagROA -0.350 0.165
(-0.82) (2.56)**
Stock return 0.254 3.698
(1.71)* (2.15)**
Firm age -0.030 -0.265
(-0.21) (-0.13)
Num acq 0.351 -0.422
(1.21) (-0.31)
Goodwill -1.037 3.098
(-1.96)* (0.51)
Leverage -1.595 -2.587
(-4.50)*** (-0.66)
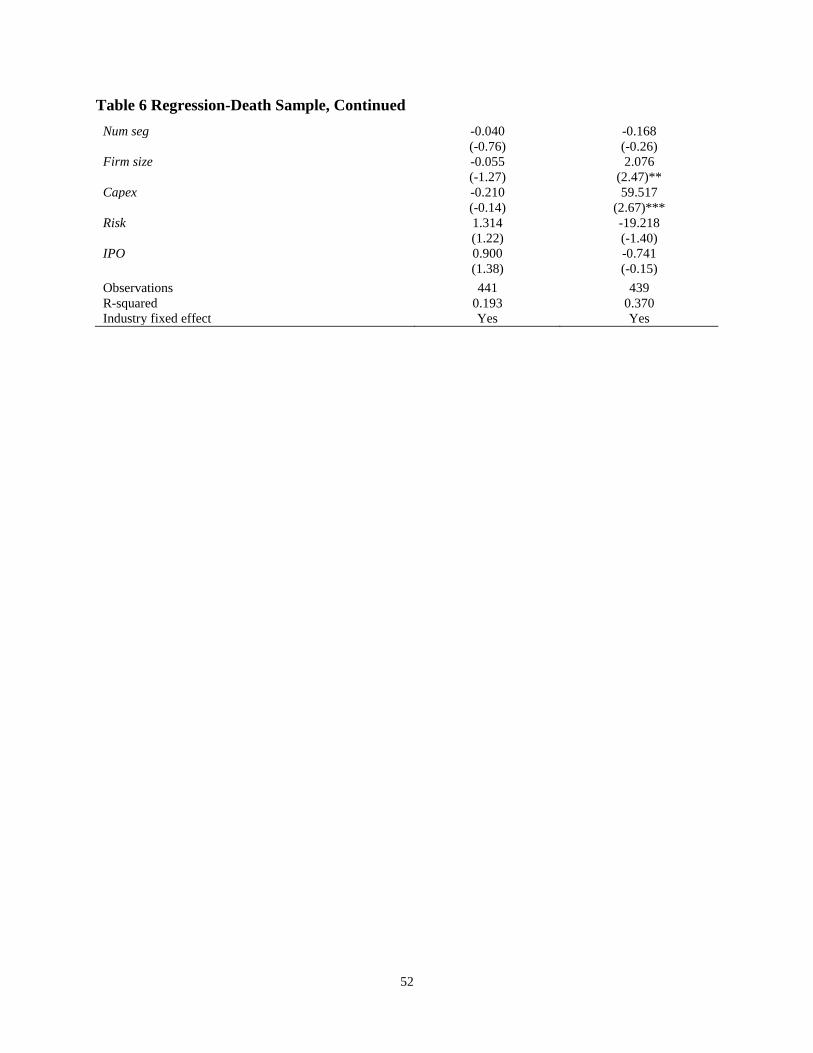
52
Table 6 Regression-Death Sample, Continued
Num seg -0.040 -0.168
(-0.76) (-0.26)
Firm size -0.055 2.076
(-1.27) (2.47)**
Capex -0.210 59.517
(-0.14) (2.67)***
Risk 1.314 -19.218
(1.22) (-1.40)
IPO 0.900 -0.741
(1.38) (-0.15)
Observations 441 439
R-squared 0.193 0.370
Industry fixed effect Yes Yes

53
Table 7 Corporate Policies-Pooled Sample
The sample period is from 1998 to 2010. We define all variables in the Appendix. All regressions contain the same set of control variables as in Column (1) of Table 2. Panel A further controls for Public target, All cash deal, and Deal Size. Panel B further controls for Tangibility, Dividend
paying, Operating cycle, Cash, Vol(CFO), and Vol(Sale). We measure all monetary items in 2002 dollars, and present t-statistics in parentheses.
***, **, and * denote significance of coefficients at the 1%, 5%, and 10% levels, respectively. We correct standard errors for heteroscedasticity and clustering of observations at the firm level.
Panel A M&A Announcement Returns
(1) (2)
CAR[0,1] CAR[-2,2]
Board tenure 0.0019 0.0026
(2.29)** (2.13)**
Board tenure squared -0.0001 -0.0001
(-2.80)*** (-2.12)**
Controls Yes Yes
Observations 2,884 2,884
R-squared 0.070 0.053
Industry fixed effect Yes Yes
Year fixed effect Yes Yes Panel B Financial Reporting Quality
(1) (2) (3) (4)
AQ Abn Acc Cscore Restate
Board tenure 0.003 0.002 0.014 -0.102*
(2.00)** (2.56)** (2.49)** (-1.96)
Board tenure squared -0.00012 -0.0001 -0.00056 0.005**
(-1.82)* (-2.21)** (-2.49)** (2.34)
Controls Yes Yes Yes Yes
Observations 10,976 10,612 11,232 3,632
R-squared 0.386 0.388 0.220 0.01
Firm fixed effect Yes Yes Yes No
Industry fixed effect No No No Yes
Year fixed effect Yes Yes Yes Yes
Panel C CEO Compensation
(1) (2) (3)
Tot Comp Excess Comp Log Delta
Board tenure -0.033 -0.032 0.033
(-2.89)*** (-2.82)* (1.92)*
Board tenure squared 0.001 0.001 -0.0014
(1.86)* (1.75)* (-1.88)*
Controls Yes Yes Yes
Observations 11,499 11,499 10,698
R-squared 0.764 0.580 0.837
Firm fixed effect Yes Yes Yes
Year fixed effect Yes Yes Yes

54
Table 8 Corporate Policies-Death Sample
The sample period is from 1998 to 2010. The table reports the regression results for a sample of outside directors who died between 1998 and 2010.
We define all variables in the Appendix. Constants are included but not displayed in all regressions. We measure all monetary items in 2002 dollars,
and present t-statistics in parentheses. ***, **, and * denote significance of coefficients at the 1%, 5%, and 10% levels, respectively. We correct
standard errors for heteroscedasticity and clustering of observations at the firm level.
(1) (2) (3) (4) (5) (6)
AQ Abn Acc Cscore Tot Comp Excess Comp Log Delta
Board tenure 0.004 0.021 0.750 -0.172 -0.086 0.302
(1.95)* (1.77)* (2.67)*** (-2.36)** (-1.77)* (2.00)**
Board tenure squared -0.0002 -0.001 -0.028 0.0053 0.0048 -0.014
(-1.82)* (-2.09)** (-2.33)** (1.98)** (3.18)*** (-1.94)*
Std dev of board tenure 0.002 0.000 0.093 -0.012 -0.028 0.046
(1.65) (0.00) (0.73) (-0.35) (-0.99) (0.62)
CEO age 0.000 0.002 -0.015 -0.021 -0.007 -0.005
(0.47) (1.38) (-0.24) (-1.87)* (-0.93) (-0.18)
CEO tenure -0.000 0.001 -0.120 0.004 0.008 -0.013
(-0.24) (0.56) (-1.13) (0.28) (0.78) (-0.38)
CEO shareholding 0.001 -0.003 0.132 0.006 -0.004 0.119
(1.48) (-1.06) (1.06) (0.25) (-0.28) (1.40)
CEO-Founder -0.005 -0.006 2.274 0.316 -0.104 -0.146
(-0.61) (-0.22) (1.55) (1.13) (-0.48) (-0.25)
CEO-Chair -0.004 0.016 -1.963 0.006 0.098 0.569
(-0.77) (0.50) (-1.82)* (0.04) (0.81) (1.28)
Classified board 0.006 -0.027 2.107 0.116 0.374 -0.000
(1.07) (-1.41) (1.03) (0.70) (3.14)*** (-0.00)
Independent board -0.022 -0.011 0.953 0.083 0.056 -1.086
(-3.42)*** (-0.14) (0.86) (0.19) (0.24) (-1.06)
Busy board -0.000 -0.005 -0.089 0.079 0.042 0.067
(-0.20) (-1.38) (-0.51) (2.60)** (1.77)* (0.79)
Interlocked board 0.068 0.156 -1.871 -2.311 -2.604 2.605
(2.05)** (1.15) (-0.41) (-1.57) (-3.44)*** (1.47)
Board size 0.001 0.006 -0.164 0.010 -0.050 -0.071
(0.66) (0.81) (-1.16) (0.28) (-2.04)** (-0.66)
Sale growth 0.006 0.014 -0.645 0.165 -0.129 0.315
(1.36) (0.57) (-1.16) (0.47) (-0.35) (0.41)
LagROA -0.011 -0.140 0.856 0.709 -0.336 1.822
(-1.84)* (-1.77)* (0.79) (1.14) (-0.83) (2.34)**
Stock return -0.007 0.011 -1.823 -0.217 0.309 0.553
(-1.30) (0.37) (-1.74)* (-1.35) (2.06)** (1.54)
Firm age -0.013 -0.024 1.137 -0.063 0.059 0.256
(-1.73)* (-0.88) (1.43) (-0.36) (0.49) (0.64)
Num acq 0.008 0.036 -2.106 0.047 0.004 0.168
(2.01)** (1.87)* (-2.64)*** (0.36) (0.04) (0.71)
Goodwill 0.024 0.015 1.454 -0.356 0.197 -0.113
(1.26) (0.18) (0.48) (-0.56) (0.47) (-0.10)
Leverage -0.007 -0.161 3.846 0.953 0.250 1.258
(-0.63) (-1.71)* (1.90)* (1.97)* (0.70) (1.37)
Num seg -0.005 -0.019 0.248 0.114 -0.033 -0.088
(-1.49) (-1.34) (0.61) (1.65) (-0.69) (-0.67)
Firm size 0.003 0.022 0.229 0.015 0.040 0.156
(2.03)** (1.22) (0.82) (0.20) (0.77) (0.80)
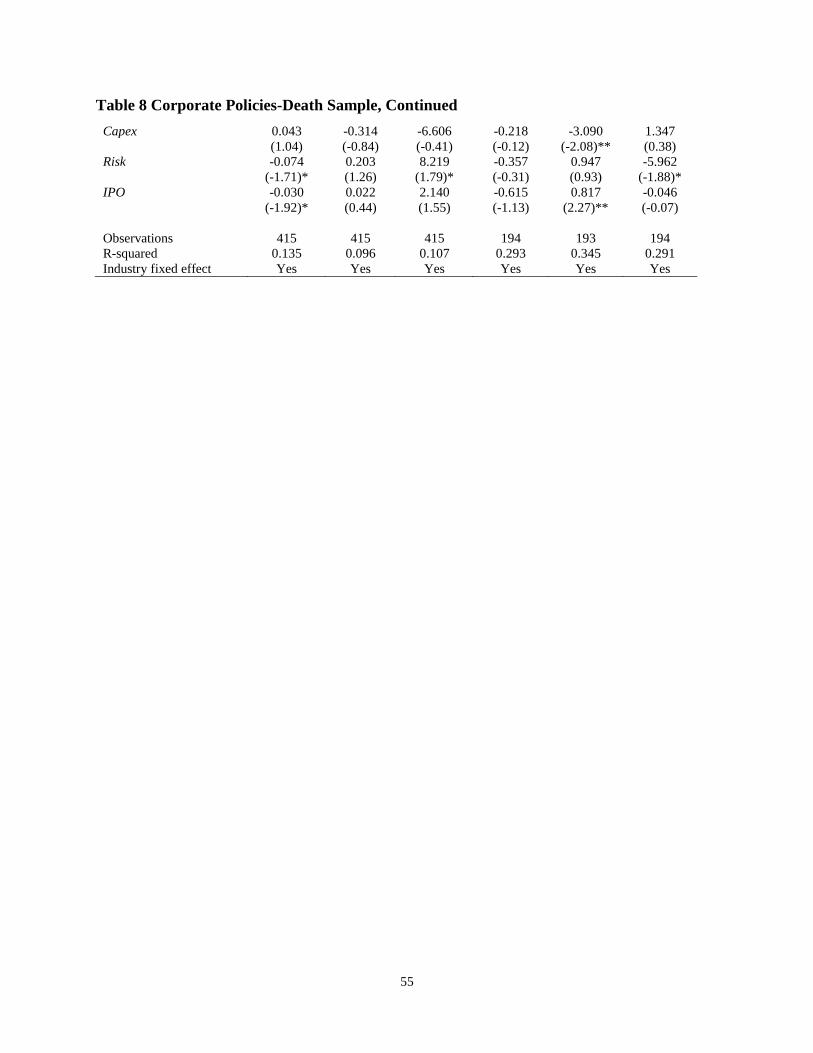
55
Table 8 Corporate Policies-Death Sample, Continued
Capex 0.043 -0.314 -6.606 -0.218 -3.090 1.347
(1.04) (-0.84) (-0.41) (-0.12) (-2.08)** (0.38)
Risk -0.074 0.203 8.219 -0.357 0.947 -5.962
(-1.71)* (1.26) (1.79)* (-0.31) (0.93) (-1.88)*
IPO -0.030 0.022 2.140 -0.615 0.817 -0.046
(-1.92)* (0.44) (1.55) (-1.13) (2.27)** (-0.07)
Observations 415 415 415 194 193 194
R-squared 0.135 0.096 0.107 0.293 0.345 0.291
Industry fixed effect Yes Yes Yes Yes Yes Yes

56
Online Appendix of “Zombie Board: Board Tenure
and Firm Performance”

57
Table of Contents
Table A1 Robustness Tests
Table A2 Tenure Diversity
Table A3 Death Sample Reconciliation
Table A4 Event Study-Truncated Returns
Table A5 Sudden Death-Optimal Tenure Range
Table A6 Restatement-Matched Sample
Table A7 Corporate Policies-Additional Controls
Table A8 Financial Reporting Quality-No Controls
Table A9 Structural Equation Modelling

58
I. Introduction
This Online Supplemental Material complements and extends the analysis carried out in
“Zombie Board: Board Tenure and Firm Performance” in several ways. First, it complements the
main study by considering a battery of robustness checks to ensure that our findings are not
sensitive to alternative definitions and model specifications. Second, we examine how tenure
diversity mediates the relation between board tenure and firm values. Third, we carry out additional
robustness tests related to the event study. In particular, we provide additional information on the
death sample (as mentioned in Footnote 5 of the published study). Second, we consider how
departing from a 10-year tenure affects the stock price in the case of a sudden death. We revisit
this analysis by examining the effect of moving away from an optimal tenure range of 8 to 11 years.
Fourth, we conduct robustness tests related to our corporate policy analyses to mitigate any
potential confounding effects of omitted correlated variables. Lastly, we conduct a structural
equation estimation (SEM) linking various corporate decisions with firm performance.
II. Robustness Tests
We consider a battery of additional robustness checks to ensure that our findings are not
sensitive to alternative definitions and model specifications. We tabulate these results in Table A1.
We include the full set of control variables listed in Column (1) of Table 2 unless otherwise noted.
For brevity, we only tabulate the main variable of interest. First, to mitigate the concern that our
results are attributable to time series variation in industry characteristics, we control for industry
and year joint fixed effects. Industry*Year joint fixed effects should absorb any time series
variations in industry characteristics that may confound our results. Panel A of Table A1 shows
that our results are not caused by unobservable characteristics at the industry-year level.

59
Our next set of robustness tests considers alternative measures of board tenure. We use
average board tenure as the main summary statistics of the tenure profile of the board. However,
the diversity of tenure among board members may affect firm performance and corporate decisions.
To explore this issue, we use two alternative measures of board tenure that are less affected by
board tenure diversity: we use the median in Panel B and the mode in Panel C. We define Board
Tenure Median (Mode) as the median (mode) of tenure among outside directors. We continue to
find an inverted U-shape relation between firm value and board tenure using either tenure measure.
Both linear and quadratic tenure terms are significant at the conventional level. We then consider
alternative measures of tenure diversity. Panel D uses the range of board tenure (Board Tenure
Range) and Panel E uses the Herfindahl index of board tenure (Board Tenure HHI). Our
conclusions are not affected. Board Tenure Range and Board Tenure HHI are both insignificant.
Next, we consider alternative regression specifications. Our main regression uses lead-lag
specification to mitigate endogeneity concerns. Panel F re-estimates the regression measuring all
variables simultaneously (i.e., both dependent variables and independent variables are measured
at year t), and our conclusions are not affected. Lastly, we incorporate firm fixed effects to mitigate
concerns that our results may be confounded by time-invariant unobservable firm characteristics.
The specification relies on within-firm variation in board tenure to identify the valuation effect.
Panel G considers alternative specification in which we do not include firm fixed effects. We
continue to find an inverted U-shaped relation between board tenure and firm valuation.
III. Cross-sectional Analysis of Tenure Diversity
Next, we consider how tenure dispersion mediates the effects of tenure length. To this end,
we re-estimate Model (3) and partition the sample based on the median value of tenure diversity
(using either the standard deviation of tenure or the Herfindahl index as proxy). We present the

60
results in Table A2. When we focus on short tenure cases, we observe no difference across cells
using Tobin’s Q measure (i.e., board tenure dispersion is not relevant to explain differences across
cells). However, we observe that a low dispersion in director tenure exacerbates the negative effect
of long tenure. The difference is statistically significant at the 1% and 7% levels (using the standard
deviation or tenure Herfindahl index as proxy) when Tobin’s Q is the dependent variable. Although
we do not find an average effect of tenure diversity on firm performance, the results in Table A2
suggest that greater diversity helps mitigate the oversight problem when the average tenure is high
(at least when Q is the dependent variable). This finding is consistent with prior studies, such as
Williams and O’Reilly [1998], which find that the effect of diversity on team performance varies
across studies. Our results are consistent with the idea that diversity has a positive effect when
groups are too jaded.
IV. Additional Tests Related to Event Studies
Reconciliation of Death Sample
Our initial sample of 565 deaths covers the 1998-2010 period and is not restricted to S&P
1500 firms, on which the IRRC provides board information. We manually collect board
information from proxy statements in various databases, such as Capital IQ, Boardex, and the
Edgar Archive. The following table reconciles the reduction from the initial sample of 565 to the
final sample of 441 used in the analysis in Table A3. We provide further details and examples for
each category below.
a. Corporate Event. If the death happened in a year during which the company experienced a
corporate event, such as M&A, liquidation, or IPO, we remove the confounding event. For
example, Robert Palmer, who was an independent director of Epixtar Corp, died on June

61
21, 2005. Epixtar Corp filed a voluntary petition for reorganization under Chapter 11 of
the United States Bankruptcy code in October 2005.
b. Private firm-public debt or private equity. The SEC requires companies with more than
US$10 million in assets and a class of equity securities held by more than 500 owners to
file annual and other periodic reports, regardless of whether the securities are publicly or
privately traded. For example, David Anacker, who was an independent director of Grubb
& Ellis Co., died on May 23, 2007. Capital IQ classifies the firm as a private firm with
public debt. As we cannot obtain pricing information for these companies, we exclude them
from the analysis.
c. Private firm-operating subsidiary. Our initial search identifies these events to be associated
with parent-listed companies. Thus, we remove them to avoid misidentification. For
example, Jeffrey A Timmons, who was an independent director of National Mentor
Holdings, Inc., died on April 8, 2008. National Mentor Holdings, Inc. is a non-listed
operating subsidiary of a NYSE listed firm, Civitas Solutions, Inc. (NYSE ticker: CIVI).
d. 20-F Firms. We identify two non-US firms that are listed in the US. For example, Akira
Chiaya, who was an independent director of Hitachi, Ltd. (a Japanese firm), died on
January 22, 2007. We remove these two observations as the nature of boards in Japan is
different from that of boards in the US.
e. Missing Controls. Missing controls are mainly associated with the non-disclosure of
information on director tenure or director age from proxy statements or directors’ profile
pages from Capital IQ. Many of these firms are OTC. For example, Jeff Scheive, who was
an independent director of Golden Star Enterprises Ltd., died on June 3, 2008. The

62
company is traded in the over-the-counter market. We are unable to hand-collect the
information for these cases.
Event Study-truncated Returns
To mitigate the concern that our event studies may be driven by outliers, we present the
analyses sequentially using unwinsorized, winsorized, and median announcement returns in Table
5. To further address this issue, we exclude nine observations that generate large negative abnormal
returns. Table A4 shows that our conclusions are not affected.
Optimal Tenure Range
The empirical observations in both Figure 1 and Table 2 suggest that 10 years is the optimal
length of tenure. Consequently, we use this as the cut-off value in our announcement return tests
in Table 5. We acknowledge that the optimal tenure point may vary across different specifications.
To explore this possibility, we use this section to consider board tenure between 8 and 11 years as
the optimal tenure range. To this end, we partition our samples based on whether board tenure
moves toward or away from this optimal range, and repeat our announcement return tests.
Specifically, we consider the mean and median returns in three cases (board tenure moves away
from, tenure moves closer to, and tenure remains within the 8-11-year range), and report the results
in Table A5. We reach a similar conclusion to that in Table 5. The average returns are -1% and
0.8% in the first two cases, with t-statistics of -2.5 and 1.7, respectively. The average (or median)
return is statistically undistinguishable from zero in the third case.

63
V. Additional Tests Related to Corporate Policies Analyses
Restatements
We examine whether board tenure affects likelihood of restatement. To account for the fact
that firms that restate their financial statements are substantially different from typical firms, we
use a propensity score matching specification. Specifically, propensity scores are created every
year based on Probit regressions that include all of the characteristics tabulated in Panel B of Table
7 and industry fixed effects (Fama and French 48 industry level), which allow us to select, for each
restatement firm, a non-restatement firm that has similar characteristics to function as its control
group. After matching, the difference in propensity scores between restatement firms and control
firms is statistically insignificant across two samples (p-value = 0.80). We then estimate logit
regression using the matched sample. Table A6 below shows that the likelihood of restatement has
a U-shaped relation with board tenure.
Additional Firm-year Controls
We include a vector of 15 additional firm-year controls under valuation analysis in Table
2, and show that most variables are insignificant. To mitigate the concern that a correlated omitted
variable may explain our results on corporate policies, we control for these 15 variables in addition
to the set of control variables and fixed effects that are already included in Table 7. Results are
reported in Table A7. They show that including these additional controls does not change our
conclusions.
Second, there may be a concern that our choice of control variables may bias our results.
More specifically, AQ and AbsAcc are obtained by transforming the residuals of a first stage
regression (we use the standard deviation in the first case and the absolute value in the second).
There may be a concern that there could be a correlation between the noise in the estimated
64
residuals and the variables in the second regression. To ensure that our financial transparency
results are not driven by the inclusion of specific covariates, we first re-estimate our baseline
regression omitting all control variables. If our results are driven by the correlation structure
between the control variables and the estimated residuals from the first stage, excluding these
control variables will materially affect them. Results reported in Table A8 indicate that our
conclusions are not affected. In addition, we randomly select a set of control variables among the
29 variables used in Panel B of Table 7, and re-estimate our baseline model with this alternative
set of controls. We repeat the procedure 1,000 times with both AQ and AbnAcc as dependent
variables. We find that the two variables of interest (Tenure and Tenure2) are always significant
when AQ is the dependent variable. When AbnAcc is the dependent variable, Tenure is always
significant, Tenure2 is significant in 984 specifications out of 1,000 draws.
VI. Structural Equation Modeling
Overall, our analysis of corporate policies and decisions shows that the trade-off driving
the quadratic relation between board tenure and firm value is also evident among corporate
decisions determining the quality of investment, financial reporting, and executive compensation.
For completeness, we connect the valuation result of board tenure to the channel analyses. We use
a SEM approach to examine if these decisions moderates (in a statistical sense) the relation
between tenure and firm value. We focus on financial reporting quality and compensation, as the
relation between M&A announcement returns and tenure is largely cross-sectional, and inclusion
of this relation will lead to severe sample attrition. Specifically, we estimate the following SEM
equations simultaneously:
𝐹𝑅𝑄𝑖𝑡 = 𝛼𝑖 + 𝛼𝑡 + 𝛽1𝑇𝑒𝑛𝑢𝑟𝑒𝑖,𝑡−1 + 𝛽2𝑇𝑒𝑛𝑢𝑟𝑒𝑖,𝑡−12 + Γ′𝑋𝑖,𝑡−1 + 𝜀𝑖,𝑡 (𝐴1𝑎)

65
𝐶𝑜𝑚𝑝𝑖𝑡 = 𝛼𝑖 + 𝛼𝑡 + 𝛽1𝑇𝑒𝑛𝑢𝑟𝑒𝑖,𝑡−1 + 𝛽2𝑇𝑒𝑛𝑢𝑟𝑒𝑖,𝑡−12 + Γ′𝑋𝑖,𝑡−1 + 𝜀𝑖,𝑡 (𝐴1𝑏)
𝑇𝑜𝑏𝑖𝑛𝑖𝑡 = 𝛼𝑖 + 𝛼𝑡 + 𝛽1𝑇𝑒𝑛𝑢𝑟𝑒𝑖,𝑡−1 + 𝛽2𝑇𝑒𝑛𝑢𝑟𝑒𝑖,𝑡−12 + 𝛽3𝐹𝑅𝑄𝑖,𝑡 + 𝛽2𝐶𝑜𝑚𝑝𝑖,𝑡 + Γ′𝑋𝑖,𝑡−1
+ 𝜀𝑖,𝑡 (𝐴1𝑐)
Results in Table A9 should be treated with caution. For example, Kline [2012, p.113] in
his review of structural models, stresses that “interpretation of statistical estimates of direct effects
as indicating causality assumes that the researcher’s model is correct”. This requires multiple
assumptions (e.g., the form of the data distribution is known) are not empirically testable. These
assumptions may be violated in our setting.
These results confirm the curvilinear relationship between both tenure and policies and
tenure and Tobin’s Q. Panel A reports the direct effect of board tenure on firm performance,
holding other endogenous variables (i.e., financial reporting quality and compensation) constant.
Panel B shows the indirect effect of board tenure on firm performance, mediated through financial
reporting quality and compensation measures. Panel B shows that the overall indirect effect of
tenure is also curvilinear and statistically significant at the 10% level, consistent with our findings
that board tenure has a quadratic relation with financial reporting quality and compensation.
Consistent with the idea that the effect of Tenure and Tenure2 partially flows through FRQ and
Comp, we observe that the coefficients of interest have the expected signs in Panel B. The
standardized coefficients (0.020 and -0.019) indicate that the effects of Tenure and of its square
term are economically equivalent, but in opposite directions. Finally, Panel A of Table A9 shows
the direct effect of board tenure on firm performance. We find that there is a curvilinear and
significant effect of tenure on Tobin’s Q, after controlling for FRQ and Comp.

66
References
WILLIAMS K. Y. AND C.A. O’REILLY. “Diversity in Organizations: A Review of 40 Years of
Research.” Research in Organizational Behavior 20 (1998): 77-140.

67
Table A1 Robustness Tests
The sample period is from 1998 to 2010. We define all variables in the Appendix. All panels contain all of the control variables reported in Column
(1) of Table 2, except for Panel D and E. Panel D and Panel E contain all control variables other than the standard deviation of board tenure reported
in Column (1) of Table 2. We measure all monetary items in 2002 dollars. We present t-statistics in parentheses. ***, **, and * denote significance
of coefficients at the 1%, 5%, and 10% levels. We correct standard errors for heteroscedasticity and clustering of observations at the firm level.
Panel A Industry*year Joint Fixed Effects
(1) (2)
Tobin ROA
Board tenure 0.022 0.429
(2.28)** (3.00)***
Board tenure squared -0.001 -0.019
(-2.82)*** (-3.25)***
Controls Yes Yes
Observations 12,010 12,821
R-squared 0.752 0.610
Firm fixed effect Yes Yes
Industry*year joint fixed effect Yes Yes
Panel B Tenure Median
(1) (2)
Tobin ROA
Board tenure median 0.009 0.231
(1.79)* (2.56)**
Board tenure median squared -0.001 -0.011
(-2.62)*** (-2.63)***
Controls Yes Yes
Observations 12,034 12,846
R-squared 0.707 0.569 Firm fixed effect Yes Yes
Year fixed effect Yes Yes
Panel C Tenure Mode
(1) (2)
Tobin ROA
Board tenure mode 0.005 0.077
(1.83)* (2.61)***
Board tenure mode squared -0.000 -0.002
(-2.49)** (-2.94)***
Controls Yes Yes
Observations 12,034 12,846
R-squared 0.707 0.568
Firm fixed effect Yes Yes
Year fixed effect Yes Yes

68
Table A1 Robustness Tests, Continued
Panel D Control for Tenure Range
(1) (2)
Tobin ROA
Board tenure 0.030 0.503
(2.85)*** (3.58)***
Board tenure squared -0.002 -0.022
(-3.30)*** (-3.96)***
Board tenure range -0.001 -0.016
(-0.47) (-1.07)
Controls Yes Yes
Observations 12,034 12,846
R-squared 0.708 0.569
Firm fixed effect Yes Yes
Year fixed effect Yes Yes Panel E Control for Tenure HHI
(1) (2)
Tobin ROA
Board tenure 0.029 0.472
(2.94)*** (3.64)***
Board tenure squared -0.001 -0.021
(-3.29)*** (-3.95)***
Board tenure HHI 0.063 0.001
(0.43) (0.06)
Controls Yes Yes
Observations 12,034 12,846
R-squared 0.708 0.569
Firm fixed effect Yes Yes
Year fixed effect Yes Yes
Panel F Measured at Year t
(1) (2)
Tobin ROA
Board tenure 0.029 0.510
(2.81)*** (3.71)***
Board tenure squared -0.002 -0.024
(-3.42)*** (-4.37)***
Controls Yes Yes
Observations 12,034 12,846
R-squared 0.719 0.580
Firm fixed effect Yes Yes
Year fixed effect Yes Yes
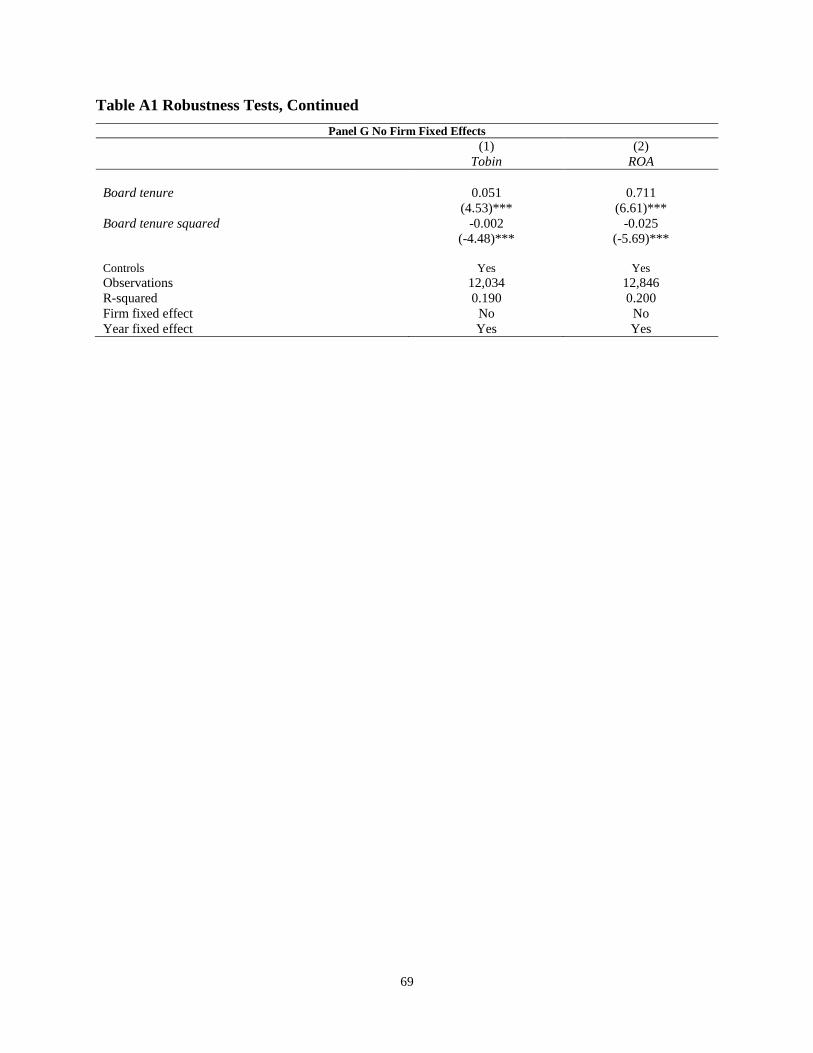
69
Table A1 Robustness Tests, Continued
Panel G No Firm Fixed Effects
(1) (2)
Tobin ROA
Board tenure 0.051 0.711
(4.53)*** (6.61)***
Board tenure squared -0.002 -0.025
(-4.48)*** (-5.69)***
Controls Yes Yes
Observations 12,034 12,846
R-squared 0.190 0.200
Firm fixed effect No No
Year fixed effect Yes Yes

70
Table A2 Tenure Diversity
The sample period is from 1998 to 2010. We estimate the following regressions for each subsample: 𝐹𝑖𝑟𝑚𝑉𝑎𝑙𝑖,𝑡 = 𝛼𝑖 + 𝛼𝑡 + 𝛽1𝐷(𝑇𝑒𝑛𝑢𝑟𝑒 ≤ 8)𝑖,𝑡−1 + 𝛽2𝐷(𝑇𝑒𝑛𝑢𝑟𝑒 ≥ 11)𝑖,𝑡−1 +Γ𝑋𝑖,𝑡−1 + 𝜀𝑖,𝑡 , where
i indexes firm, and t indexes year. 𝛼𝑖 𝑎𝑛𝑑 𝛼𝑡 are firm and year fixed effects, respectively. 𝐹𝑖𝑟𝑚𝑉𝑎𝑙𝑖,𝑡 is measured by Tobin’s Q (Panel A to Panel B) or ROA (Panel C to Panel D). High (Low) Tenure Std
is an indicator variable equal to 1 if the standard deviation of board tenure is above (below) the median, and 0 otherwise. High (Low) Tenure HHI is an indicator variable equal to 1 if the board tenure HHI
is above (below) the median, and 0 otherwise. We define all other variables in the Appendix. For all panels, we include all control variables under Column (1) of Table 2 other than the standard deviation
of board tenure. The last column of each panel compares the difference in coefficients across two subsamples using seemingly unrelated estimations, and we report the p-value of two-sided t-tests. We
measure all monetary items in 2002 dollars. We present t-statistics in parentheses. ***, **, and * denote significance of coefficients at the 1%, 5%, and 10% levels, respectively. We correct standard errors
for heteroscedasticity and clustering of observations at the firm level. Tobin's Q as a measure of firm performance ROA as a measure of firm performance
Panel A Tenure Std Panel C Tenure Std
High Tenure Std Low Tenure Std test of difference High Tenure Std Low Tenure Std test of difference (1) (2) in coefficients
(3) (4) in coefficients
Tobin Tobin p-value ROA ROA p-value D(Board tenure<=8) -0.049 -0.055 0.89 D(Board tenure<=8) -0.663 -0.244 0.43
(-1.15) (-2.47)** (-1.02) (-1.08) D(Board tenure>=11) -0.057 -0.155 0.01 D(Board tenure>=11) -0.539 -0.648 0.80
(-2.10)** (-3.91)*** (-2.17)** (-1.86)* Controls Yes Yes Controls Yes Yes Observations 6,113 5,921 Observations 6,423 6,423 R-squared 0.746 0.737 R-squared 0.648 0.588 Firm fixed effect Yes Yes Firm fixed effect Yes Yes Year fixed effect Yes Yes
Year fixed effect Yes Yes
Panel B Tenure HHI Panel D Tenure HHI
High Tenure HHI Low Tenure HHI test of difference High Tenure HHI Low Tenure HHI test of difference (1) (2) in coefficients
(3) (4) in coefficients
Tobin Tobin p-value ROA ROA p-value D(Board tenure<=8) -0.079 -0.052 0.35 D(Board tenure<=8) -0.709 -0.131 0.10
(-2.93)*** (-2.06)** (-2.25)** (-0.50) D(Board tenure>=11) -0.136 -0.074 0.07 D(Board tenure>=11) -0.657 -0.506 0.72
(-4.18)*** (-2.47)** (-2.50)** (-1.59)
Controls Yes Yes Controls Yes Yes Observations 5,952 6,082 Observations 6,339 6,507 R-squared 0.709 0.776 R-squared 0.618 0.645 Firm fixed effect Yes Yes Firm fixed effect Yes Yes Year fixed effect Yes Yes Year fixed effect Yes Yes

71
Table A3 Death Sample Reconciliation
This table provides a reconciliation of death events from the initial sample to the final sample used in the analysis.
Sample Attrition
Total Events 1998-2010 565
Corporate Events (e.g., IPO, M&A, Bankruptcy) 12
Private Firm–Public Debt or Private Equity 30
Private Firm–Operating Subsidiary of Listed Firms 17
20-F Firms 2
Missing Controls 63
Total in the sample 441

72
Table A4 Sudden Death-Truncated Returns
This table reports the three-day announcement returns for a sample of outside directors who died suddenly between 1998 and 2010. Panel A
reports results using truncated announcement returns in which we exclude nine observations that generate large negative announcement returns.
We present t-statistics in parentheses. ***, **, and * denote significance of coefficients at the 1%, 5%, and 10% levels, respectively.
Panel A Event Study-sudden Death (Truncated)
Move away from
10 years
Move closer toward
10 years
P-value of test of mean
difference
N 69 73 Mean -1.22% 0.85% t-stat (-3.07)*** (2.01)*** 0.00

73
Table A5 Sudden Death-Optimal Tenure Range
The table reports the three-day announcement returns for a sample of outside directors who died suddenly between 1998 and 2010. The panel splits
the sample into three groups: a) those that move away from the tenure range of 8-11 years, b) those that stay within 8-11 years of tenure, c) those
that move toward 8-11 years of tenure. We define all variables in the Appendix, and present t-statistics in parentheses. ***, **, and * denote
significance of coefficients at the 1%, 5%, and 10% levels, respectively.
Event Study-optimal Range
Move away
from
8-11 years
Stay within 8-11
years
Move closer
toward
8-11 years
P-value of test of mean
(median)
difference N 61 30 60 Mean -1.04% -0.24% 0.78% t-stat (-2.47)*** (-0.31) (1.67)* 0.00 Median -0.63% -0.62% 0.50% Wilcoxon z-stat (-2.18)** ( -0.67) ( 1.67)* 0.013

74
Table A6 Restatement-Matched Sample
The sample period is from 1998 to 2010. The table reports results from logit regression using propensity score matched sample. We include
the same set of control variables as in Panel B of Table 7. Restate is an indicator variable that equals 1 if the restatement occurred in year t+1.
All independent variables are measured at year t. We define all other variables in the Appendix. We measure all monetary items in 2002
dollars, and present t-statistics in parentheses. ***, **, and * denote significance of coefficients at the 1%, 5%, and 10% levels, respectively.
We correct standard errors for heteroscedasticity and clustering of observations at the firm level.
PSM Sample
(1) Restate Board tenure -0.102
(-1.96)* Board tenure squared 0.005
(2.34)**
Controls Yes Observations 3,632 R-squared 0.0109 Industry fixed effect Yes Year fixed effect Yes
PSM Score
Restating Sample
Control sample
P-value
0.265
0.266
0.80
Ai and Norton (2003) Corrected Statistics Board tenure squared 0.001 (2.18)**

75
Table A7 Corporate Policies-Additional Controls
The sample period is from 1998 to 2010. We define all variables in the Appendix. Constants are included but not displayed in all regressions.
We measure all monetary items in 2002 dollars, and present t-statistics in parentheses. ***, **, and * denote significance of coefficients at the
1%, 5%, and 10% levels, respectively. We correct standard errors for heteroscedasticity and clustering of observations at the firm level.
(1) (2) (3) (4) (5) (6) (7)
CAR[0,1] AQ Abn Acc Cscore Tot Comp Excess Comp Log Delta
Board tenure 0.002 0.002 0.0036 0.012 -0.041 -0.041 0.033
(2.01)** (2.21)** (2.16)** (1.98)** (-3.00)*** (-2.88)*** (2.55)**
Board tenure squared -0.0001 -0.0001 -0.00013 -0.0005 0.0011 0.001 -0.0013
(-2.30)** (-1.89)* (-2.01)** (-2.00)** (1.96)* (1.77)* (-2.02)**
Std dev of board tenure 0.000 0.000 -0.000 -0.003 0.003 0.002 0.006
(0.30) (0.29) (-0.48) (-1.13) (0.60) (0.44) (1.19)
CEO age -0.000 0.000 -0.000 -0.001 -0.000 -0.000 0.005
(-0.99) (0.63) (-0.66) (-0.95) (-0.12) (-0.01) (1.92)*
CEO tenure 0.000 0.000 0.000 0.001 0.002 0.001 0.042
(0.92) (0.33) (1.09) (0.93) (0.56) (0.29) (12.55)***
CEO shareholding -0.000 -0.000 -0.000 -0.000 -0.011 -0.011 0.105
(-0.07) (-0.07) (-1.40) (-0.03) (-2.68)*** (-2.40)** (22.25)***
CEO-Founder 0.004 0.001 0.001 -0.001 -0.110 -0.114 0.044
(1.58) (0.22) (0.08) (-0.03) (-1.95)* (-2.01)** (0.73)
CEO-Chair 0.001 -0.002 -0.001 -0.015 0.063 0.057 0.157
(0.62) (-1.53) (-0.48) (-1.11) (2.50)** (2.32)** (6.77)***
Classified board -0.001 -0.001 -0.001 0.019 0.034 0.033 0.222
(-0.41) (-0.20) (-0.21) (0.58) (0.63) (0.62) (4.26)***
Independent board -0.004 0.002 0.000 -0.005 0.006 0.011 -0.006
(-1.18) (0.82) (0.01) (-0.32) (0.20) (0.39) (-0.21)
Busy board -0.000 0.001 0.001 0.002 -0.001 -0.002 -0.007
(-0.15) (0.92) (0.72) (0.47) (-0.09) (-0.26) (-0.92)
Interlocked board 0.006 0.003 0.001 -0.009 -0.078 -0.077 -0.079
(1.07) (1.12) (0.26) (-0.35) (-1.73)* (-1.72)* (-1.83)*
Board size -0.001 0.000 -0.000 0.003 -0.011 -0.016 -0.017
(-2.01)** (1.02) (-0.11) (0.59) (-1.42) (-2.02)** (-2.12)**
Sale growth -0.004 -0.007 -0.009 0.026 0.027 0.042 0.049
(-1.84)* (-1.97)** (-1.62) (1.83)* (1.03) (1.66)* (1.98)**
LagROA 0.004 -0.003 -0.016 -0.032 0.131 0.115 0.349
(0.54) (-0.20) (-0.96) (-1.16) (1.72)* (1.55) (5.83)***
Stock return 0.004 0.001 -0.000 0.006 0.187 -0.023 0.255
(1.73)* (0.51) (-0.07) (0.57) (11.03)*** (-1.36) (13.72)***
Firm age 0.003 0.022 0.032 -0.032 -0.150 -0.170 -0.214
(1.83)* (2.14)** (1.81)* (-0.40) (-1.05) (-1.19) (-1.57)
Num acq 0.001 0.001 0.002 0.001 0.008 0.006 0.053
(1.26) (1.23) (0.70) (0.13) (0.51) (0.41) (3.64)***
Goodwill 0.004 0.009 0.019 -0.135 0.016 0.012 -0.095
(0.53) (1.08) (1.13) (-1.76)* (0.15) (0.11) (-0.93)
Leverage 0.002 0.012 -0.007 0.092 -0.330 -0.323 -0.566
(0.38) (1.20) (-0.41) (1.42) (-3.48)*** (-3.43)*** (-6.27)***
Num seg 0.000 -0.001 -0.000 0.004 0.005 0.001 0.000
(0.33) (-0.68) (-0.30) (0.61) (0.40) (0.09) (0.01)
Firm size -0.001 -0.006 -0.013 -0.057 0.255 -0.076 0.268
(-0.76) (-1.52) (-2.22)** (-3.59)*** (7.51)*** (-2.28)** (9.25)***
Capex -0.002 0.000 -0.018 0.227 0.122 0.066 0.452
(-0.07) (0.00) (-0.59) (1.85)* (0.50) (0.28) (1.93)*
Risk 0.005 -0.008 -0.001 0.097 0.023 0.041 0.052
(1.27) (-3.59)*** (-0.13) (3.75)*** (0.65) (1.14) (1.39)
IPO -0.002 -0.009 -0.015 0.006 -0.124 -0.122 0.002
(-0.23) (-1.27) (-1.19) (0.10) (-1.03) (-1.01) (0.03)

76
Table A7 Corporate Policies-Additional Controls, Continued
Additional Controls Gender diversity 0.006 -0.008 -0.008 -0.048 0.035 0.043 0.082
(0.70) (-1.02) (-0.62) (-0.75) (0.33) (0.42) (0.74)
Ethnic diversity -0.003 0.002 -0.001 -0.003 -0.079 -0.095 0.007
(-0.49) (0.51) (-0.22) (-0.11) (-1.51) (-1.83)* (0.12)
Age diversity 0.001 0.003 -0.008 -0.012 0.086 0.077 0.153
(0.11) (0.32) (-0.57) (-0.16) (0.67) (0.60) (1.15)
Director shareholding -0.001 -0.002 -0.003 0.001 -0.004 -0.002 0.024
(-0.51) (-1.17) (-1.37) (0.16) (-0.36) (-0.19) (1.81)*
% Retirement age directors 0.023 -0.010 -0.015 0.040 0.031 0.031 0.025
(2.00)** (-1.51) (-1.36) (0.61) (0.31) (0.30) (0.24)
Director age -0.000 0.000 0.001 -0.006 0.007 0.007 -0.016
(-0.29) (0.13) (0.93) (-1.82)* (0.90) (1.00) (-2.31)**
% Outside executives 0.022 0.005 0.005 -0.049 0.063 0.048 0.206
(2.79)*** (0.94) (0.53) (-1.10) (0.86) (0.67) (2.69)***
% born in 1930 cohort 0.037 0.002 0.014 0.046 0.063 0.003 0.452
(1.00) (0.11) (0.37) (0.23) (0.14) (0.01) (1.22)
% born in 1940 cohort 0.033 -0.001 0.016 0.032 -0.010 -0.123 0.139
(1.04) (-0.04) (0.48) (0.17) (-0.03) (-0.32) (0.41)
% born in 1950 cohort 0.041 -0.006 0.007 -0.012 -0.045 -0.147 0.109
(1.28) (-0.36) (0.20) (-0.06) (-0.12) (-0.38) (0.32)
% born in 1960 cohort 0.039 -0.008 0.020 0.022 -0.031 -0.125 0.067
(1.12) (-0.37) (0.52) (0.11) (-0.08) (-0.31) (0.18)
% born in 1970 cohort 0.017 -0.001 0.023 -0.170 -0.127 -0.223 -0.074
(0.45) (-0.03) (0.48) (-0.73) (-0.26) (-0.46) (-0.18)
Equity Issuance -0.018 -0.043 -0.123 -0.073 0.484 0.337 0.782
(-1.75)* (-3.11)*** (-4.12)*** (-1.22) (4.46)*** (3.09)*** (7.82)***
Debt Issuance 0.000 -0.004 -0.024 -0.001 0.068 0.030 0.059
(0.01) (-2.46)** (-5.34)*** (-0.19) (3.79)*** (1.70)* (3.40)***
Liquidity 0.001 0.001 0.001 -0.002 0.006 0.011 -0.000
(0.82) (2.25)** (1.14) (-0.84) (0.99) (1.99)** (-0.01)
Observations 2,414 9,231 9,542 9,769 9,862 9,862 9,132
R-squared 0.070 0.411 0.416 0.226 0.771 0.589 0.849
Firm fixed effect No Yes Yes Yes Yes Yes Yes
Industry fixed effect Yes No No No No No No
Year fixed effect Yes Yes Yes Yes Yes Yes Yes

77
Table A8 Financial Reporting Quality-No Control
The sample period is from 1998 to 2010. We define all variables in the Appendix. Constants are included but not displayed in all regressions. We measure all monetary items in 2002 dollars, and present t-statistics in parentheses. ***, **, and * denote significance of coefficients at the 1%, 5%,
and 10% levels, respectively. We correct standard errors for heteroscedasticity and clustering of observations at the firm level.
(1) (2)
AQ Abn Acc
Board tenure 0.003 0.004
(2.94)*** (2.59)***
Board tenure squared -0.000 -0.000
(-2.54)** (-2.35)**
Controls No No
Observations 10,976 10,612
R-squared 0.373 0.377
Firm fixed effect Yes Yes
Year fixed effect Yes Yes

78
Table A9 Structural Equation Modeling
The sample period is from 1998 to 2010. The table estimates Structural Equation Model (SEM) of Eq. (A1a)-(A1c). All regressions contain the
same set of control variables as in Column (1) of Table 2. We define all variables in the Appendix. We multiply the coefficient associated with
ROA by 100. We measure all monetary items in 2002 dollars, and present t-statistics in parentheses. ***, **, and * denote significance of
coefficients at the 1%, 5%, and 10% levels, respectively. We correct standard errors for heteroscedasticity and clustering of observations at the firm
level.
Panel A Direct Effect (1) (2) (3) (4)
AQ Log Delta Tobin ROA Board tenure 0.158 0.051 0.065 0.778
(4.92)*** (2.02)** (2.54)** (4.51)***
Board tenure squared -0.116 -0.047 -0.089 -0.032
(-4.28)*** (-2.09)** (-3.82)*** (-4.53)***
AQ -0.019 7.503
(-1.55) (1.32)
Log Delta 0.447 2.215
(5.90)*** (12.89)***
Controls Yes Yes Yes Yes
Firm fixed effect Yes Yes Yes Yes
Year fixed effect Yes Yes Yes Yes
Panel B Indirect Effect (1) (2) (3) (4)
AQ Log Delta Tobin ROA Board tenure 0.020 0.051
( 1.73 )* (2.12)**
Board tenure squared -0.019 -0.002
(-1.85)* (-2.14)**
Controls Yes Yes Yes Yes
Firm fixed effect Yes Yes Yes Yes
Year fixed effect Yes Yes Yes Yes
Recommended