Embed Size (px)
Citation preview
15/07/26(
1(
African Urban Development Context EDGAR PIETERSE | URBAN INFRASTRUCTURE SYMPOSIUM | 21 JULY 2015
• Urbanisation
• Infrastructure
• Selected implications
15/07/26(
2(
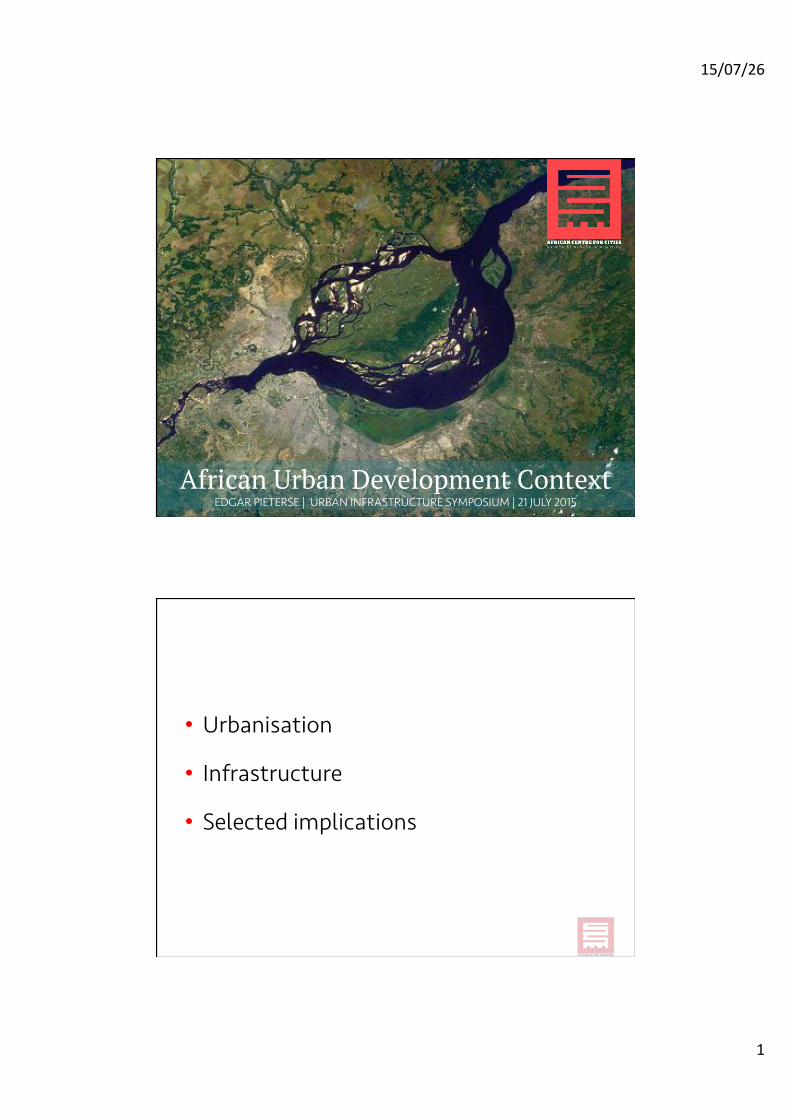
KEY URBANISATION TRENDS
Africa has at least 120 cities of over half a million residents and 47 of over a million, spread out among 54 countries.
15/07/26(
3(
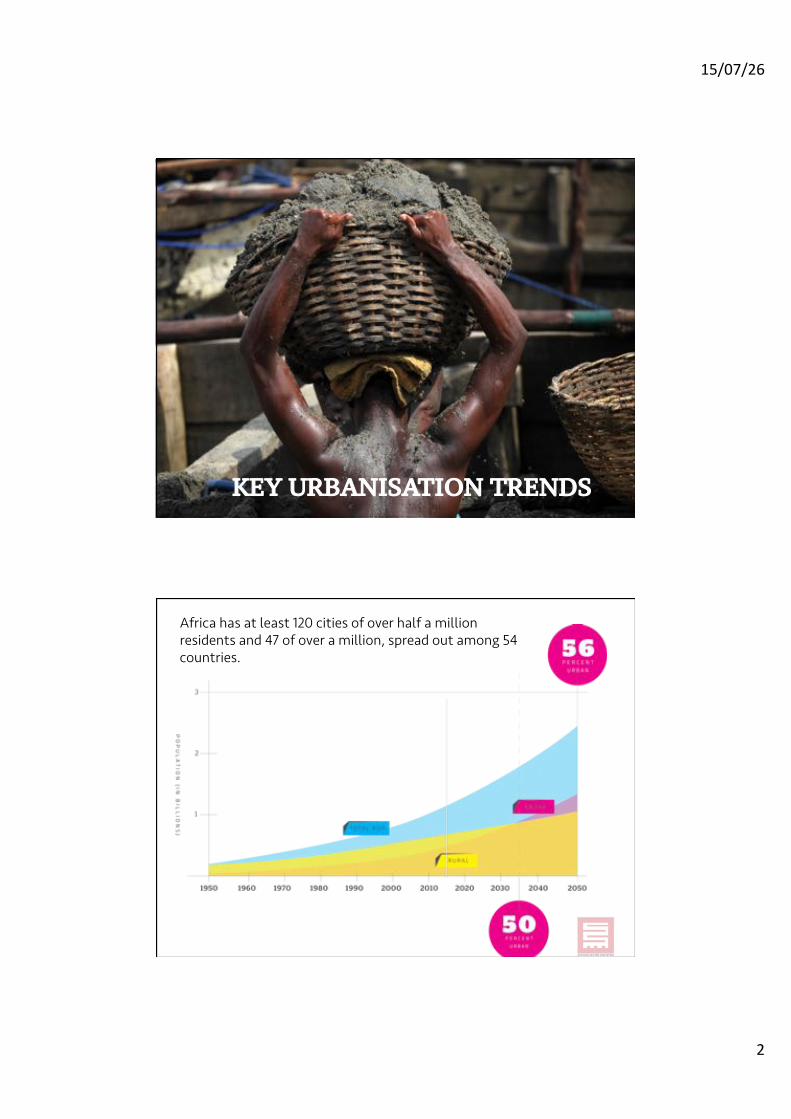
Africa has the most aggressive demographic trajectory, coupled to the fastest rate of urbanisation
Source: WWF, 2012
15/07/26(
4(
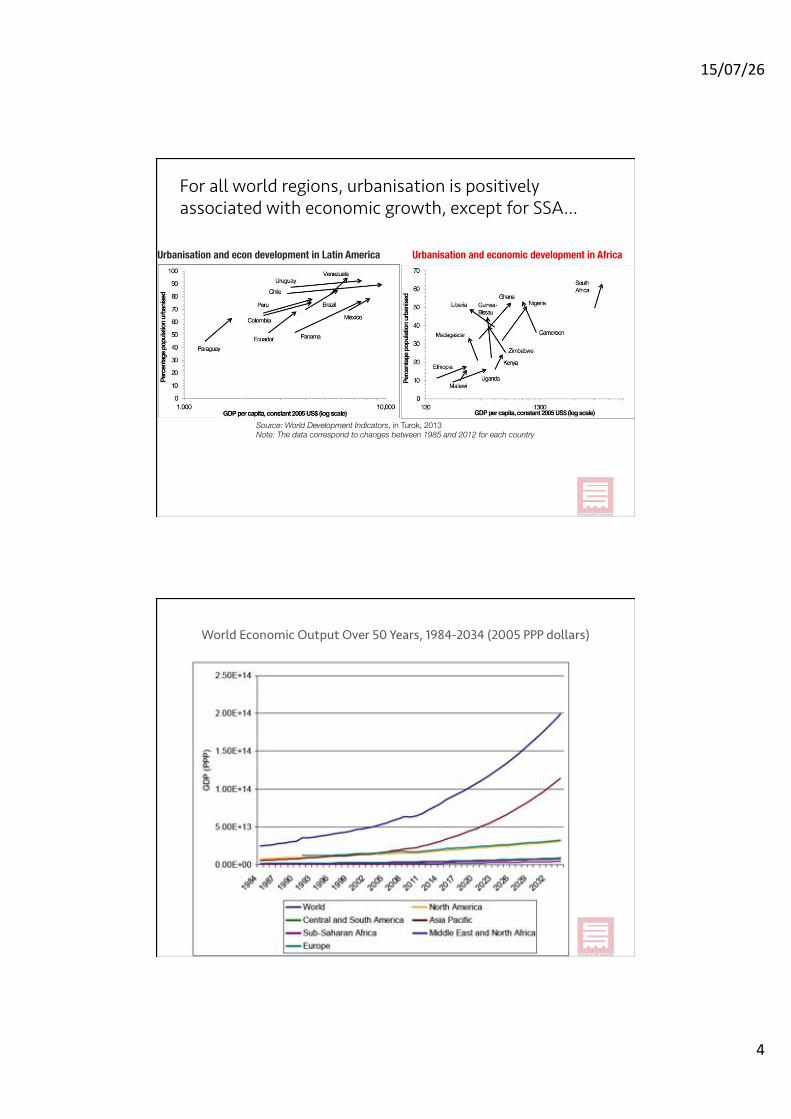
Urbanisation and econ development in Latin America Urbanisation and economic development in Africa
Source: World Development Indicators, in Turok, 2013 Note: The data correspond to changes between 1985 and 2012 for each country
For all world regions, urbanisation is positively associated with economic growth, except for SSA…
World Economic Output Over 50 Years, 1984-2034 (2005 PPP dollars)
15/07/26(
5(
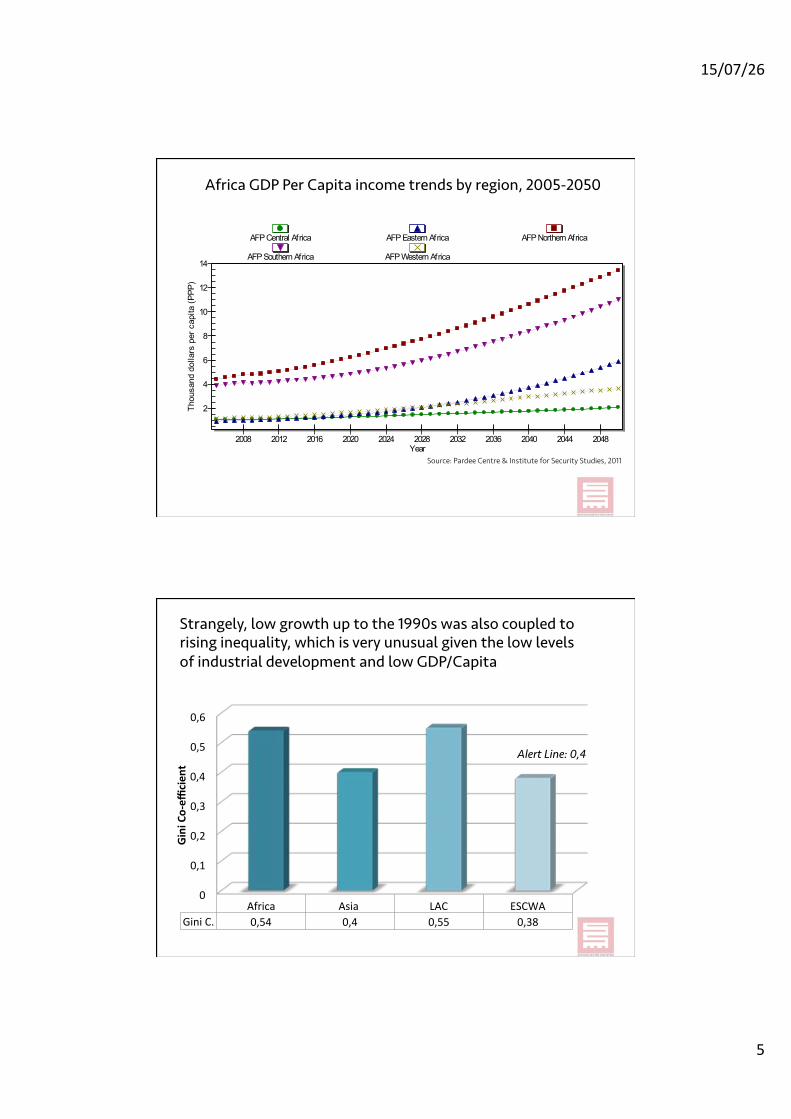
Africa GDP Per Capita income trends by region, 2005-2050
2
4
6
8
10
12
14
Thou
sand
dol
lars
per
cap
ita (
PPP
)
Year2008 2012 2016 2020 2024 2028 2032 2036 2040 2044 2048
AFP Central Africa AFP Eastern Africa AFP Northern Africa
AFP Southern Africa AFP Western Africa
Source: Pardee Centre & Institute for Security Studies, 2011
Strangely, low growth up to the 1990s was also coupled to rising inequality, which is very unusual given the low levels of industrial development and low GDP/Capita
0(
0,1(
0,2(
0,3(
0,4(
0,5(
0,6(
Africa( Asia(( LAC( ESCWA(Gini(C.( 0,54( 0,4( 0,55( 0,38(
Gini$Co'effi
cien
t$
Alert Line: 0,4
15/07/26(
6(
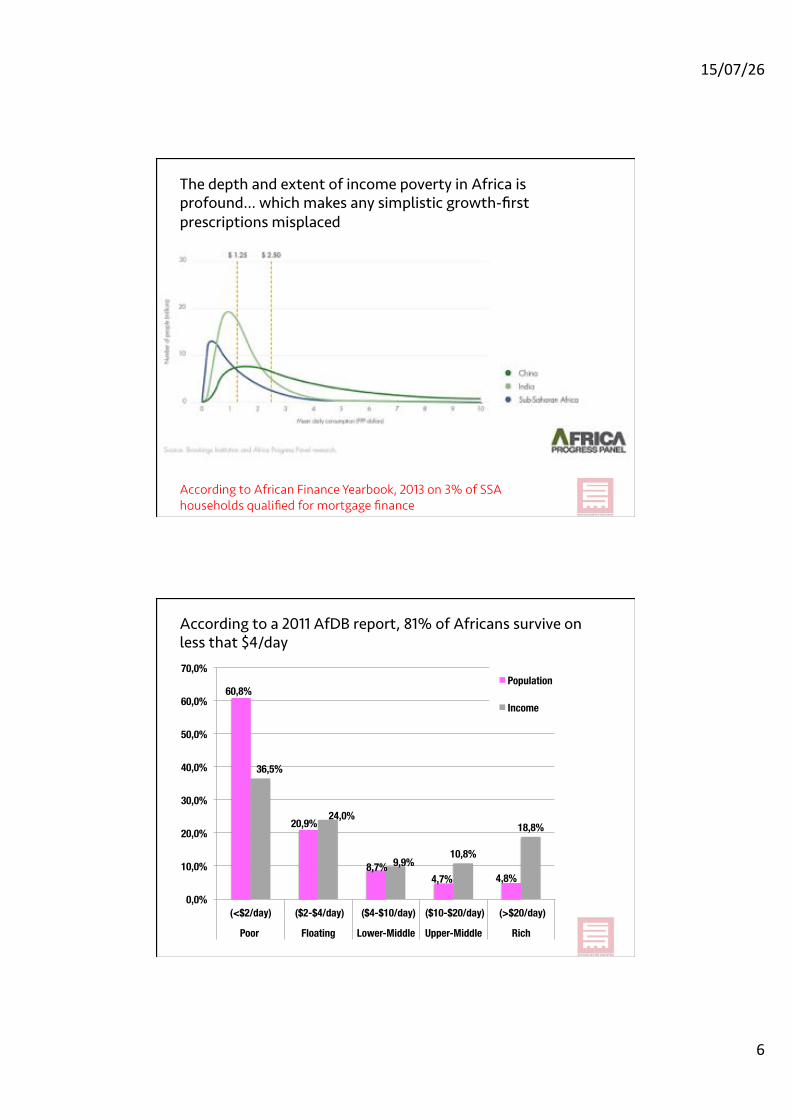
The depth and extent of income poverty in Africa is profound… which makes any simplistic growth-first prescriptions misplaced
According to African Finance Yearbook, 2013 on 3% of SSA households qualified for mortgage finance
60,8%
20,9%
8,7% 4,7% 4,8%
36,5%
24,0%
9,9% 10,8%
18,8%
0,0%
10,0%
20,0%
30,0%
40,0%
50,0%
60,0%
70,0%
(<$2/day) ($2-$4/day) ($4-$10/day) ($10-$20/day) (>$20/day)
Poor Floating Lower-Middle Upper-Middle Rich
Population
Income
According to a 2011 AfDB report, 81% of Africans survive on less that $4/day
15/07/26(
7(
!"
!2.00
!4.00
!6.00
!8.00
!10.00
!12.00
!14.00
!16.00
!18.00
US$!'000
s/capita/yr!P
PP
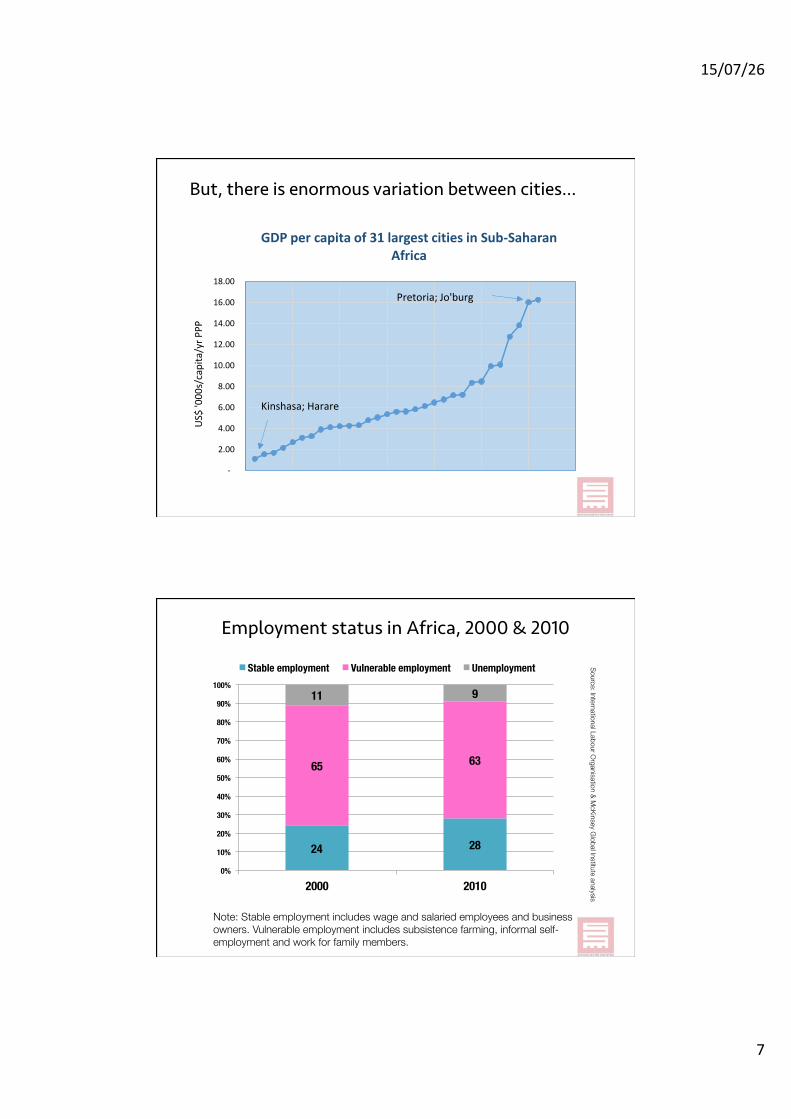
GDP$per$capita$of$31$largest$cities$in$Sub7Saharan$Africa
Pretoria;!Jo'burg
Kinshasa;!Harare
But, there is enormous variation between cities…
24 28
65 63
11 9
0%
10%
20%
30%
40%
50%
60%
70%
80%
90%
100%
2000 2010
Stable employment Vulnerable employment Unemployment Source: International Labour O
rganisation & McK
insey Global Institute analysis
Employment status in Africa, 2000 & 2010
Note: Stable employment includes wage and salaried employees and business owners. Vulnerable employment includes subsistence farming, informal self-employment and work for family members.
15/07/26(
8(
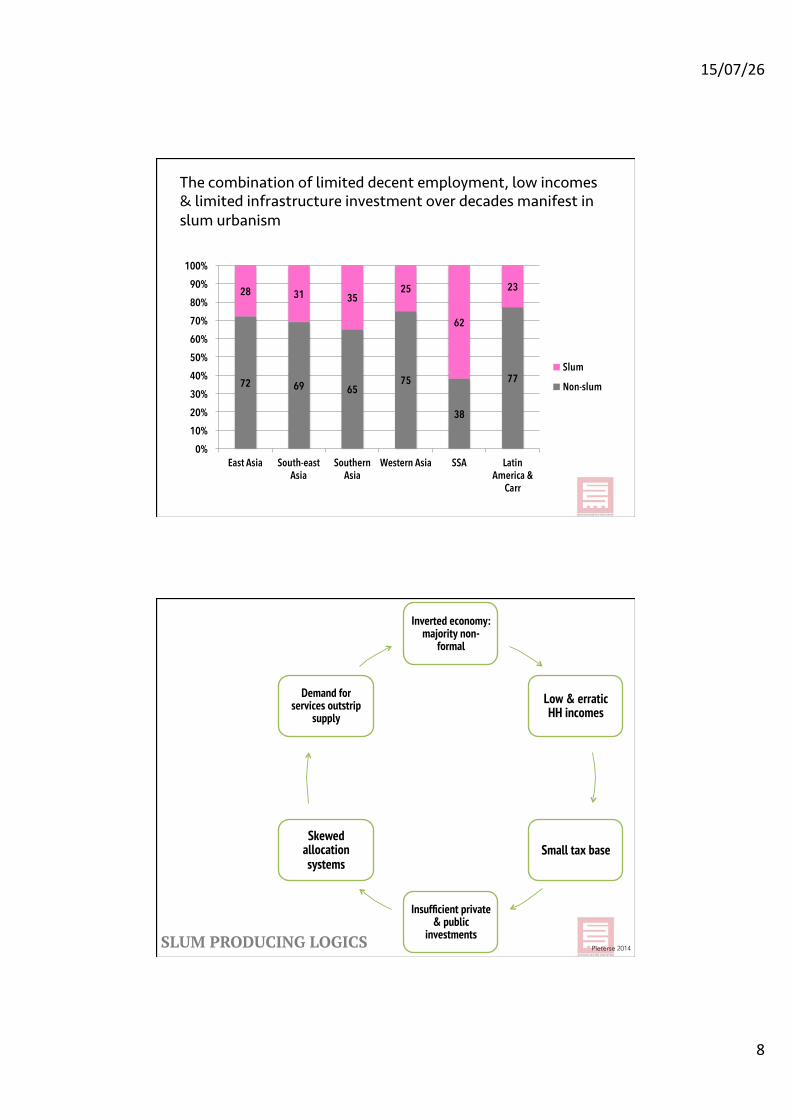
72 69 65 75
38
77
28 31 35 25
62
23
0% 10% 20% 30% 40% 50% 60% 70% 80% 90%
100%
East Asia South-east Asia
Southern Asia
Western Asia SSA Latin America &
Carr
Slum
Non-slum
The combination of limited decent employment, low incomes & limited infrastructure investment over decades manifest in slum urbanism
Inverted economy: majority non-
formal
Low & erratic HH incomes
Small tax base
Insufficient private & public
investments
Skewed allocation systems
Demand for services outstrip
supply
SLUM PRODUCING LOGICS Pieterse 2014
15/07/26(
9(
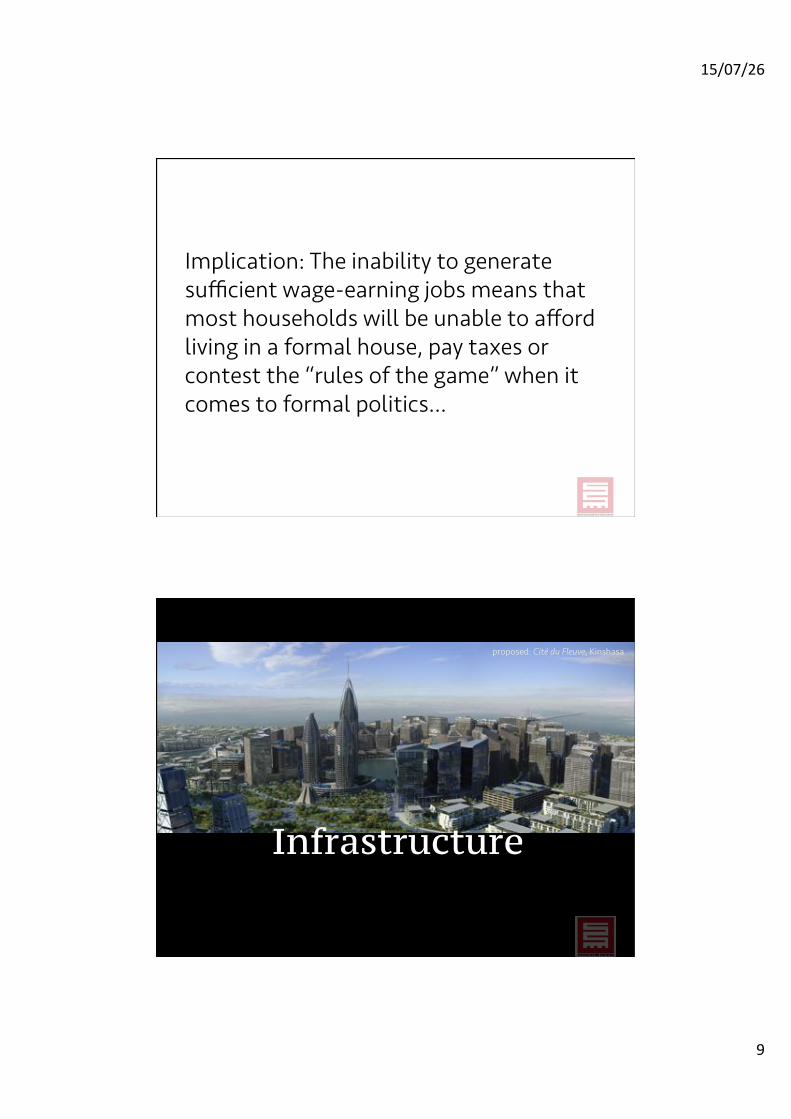
Implication: The inability to generate sufficient wage-earning jobs means that most households will be unable to afford living in a formal house, pay taxes or contest the “rules of the game” when it comes to formal politics…
proposed: Cité du Fleuve, Kinshasa
Infrastructure
15/07/26(
10(
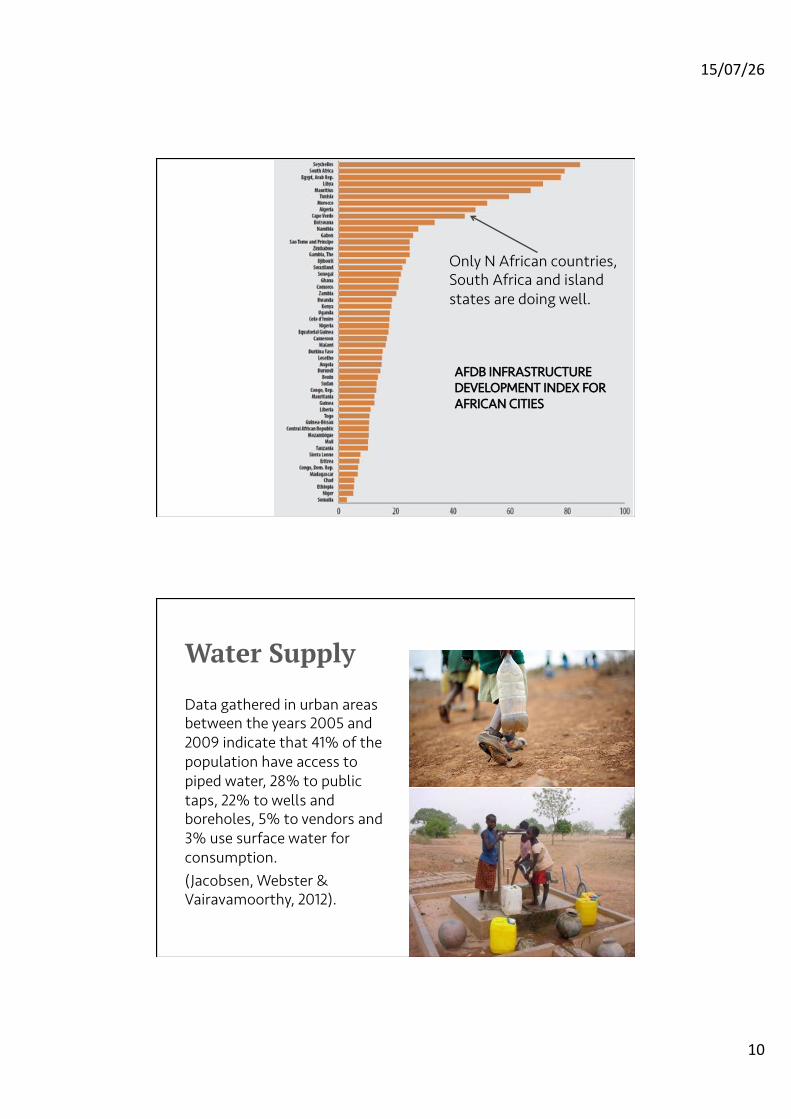
Only N African countries, South Africa and island states are doing well.
AFDB INFRASTRUCTURE DEVELOPMENT INDEX FOR AFRICAN CITIES
Water Supply
Data gathered in urban areas between the years 2005 and 2009 indicate that 41% of the population have access to piped water, 28% to public taps, 22% to wells and boreholes, 5% to vendors and 3% use surface water for consumption. (Jacobsen, Webster & Vairavamoorthy, 2012).
15/07/26(
11(
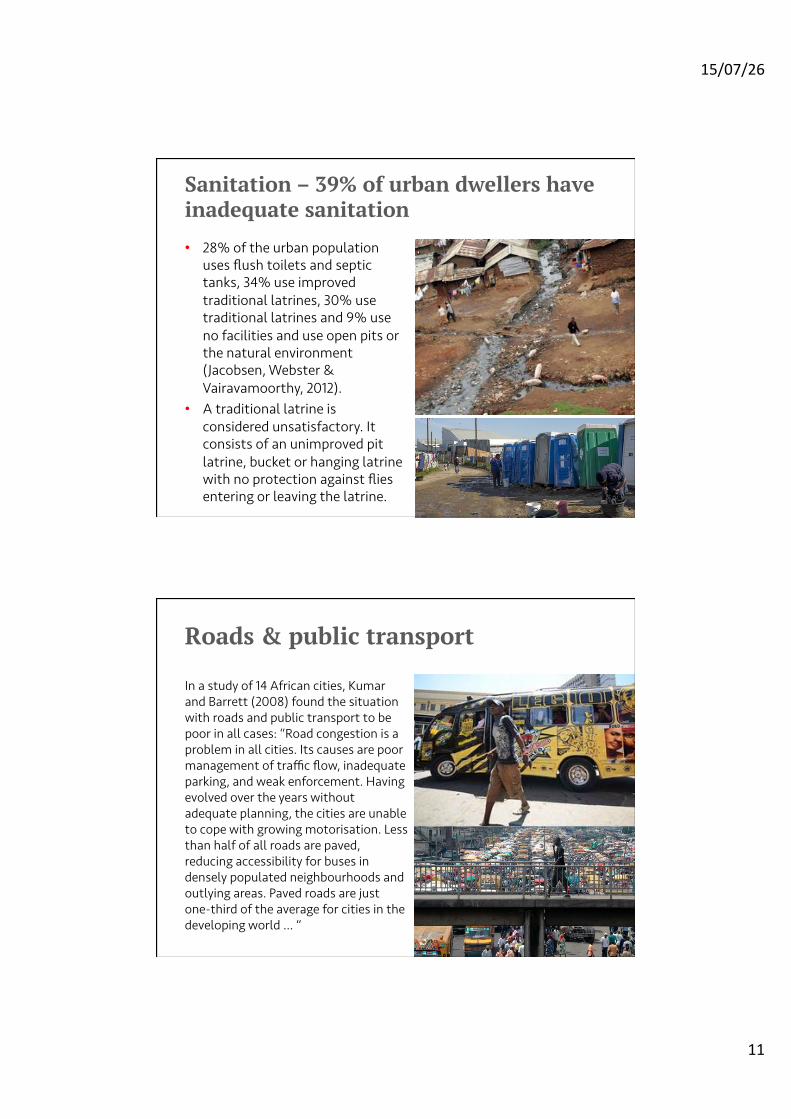
Sanitation – 39% of urban dwellers have inadequate sanitation
• 28% of the urban population uses flush toilets and septic tanks, 34% use improved traditional latrines, 30% use traditional latrines and 9% use no facilities and use open pits or the natural environment (Jacobsen, Webster & Vairavamoorthy, 2012).
• A traditional latrine is considered unsatisfactory. It consists of an unimproved pit latrine, bucket or hanging latrine with no protection against flies entering or leaving the latrine.
Roads & public transport
In a study of 14 African cities, Kumar and Barrett (2008) found the situation with roads and public transport to be poor in all cases: “Road congestion is a problem in all cities. Its causes are poor management of traffic flow, inadequate parking, and weak enforcement. Having evolved over the years without adequate planning, the cities are unable to cope with growing motorisation. Less than half of all roads are paved, reducing accessibility for buses in densely populated neighbourhoods and outlying areas. Paved roads are just one-third of the average for cities in the developing world … “
15/07/26(
12(
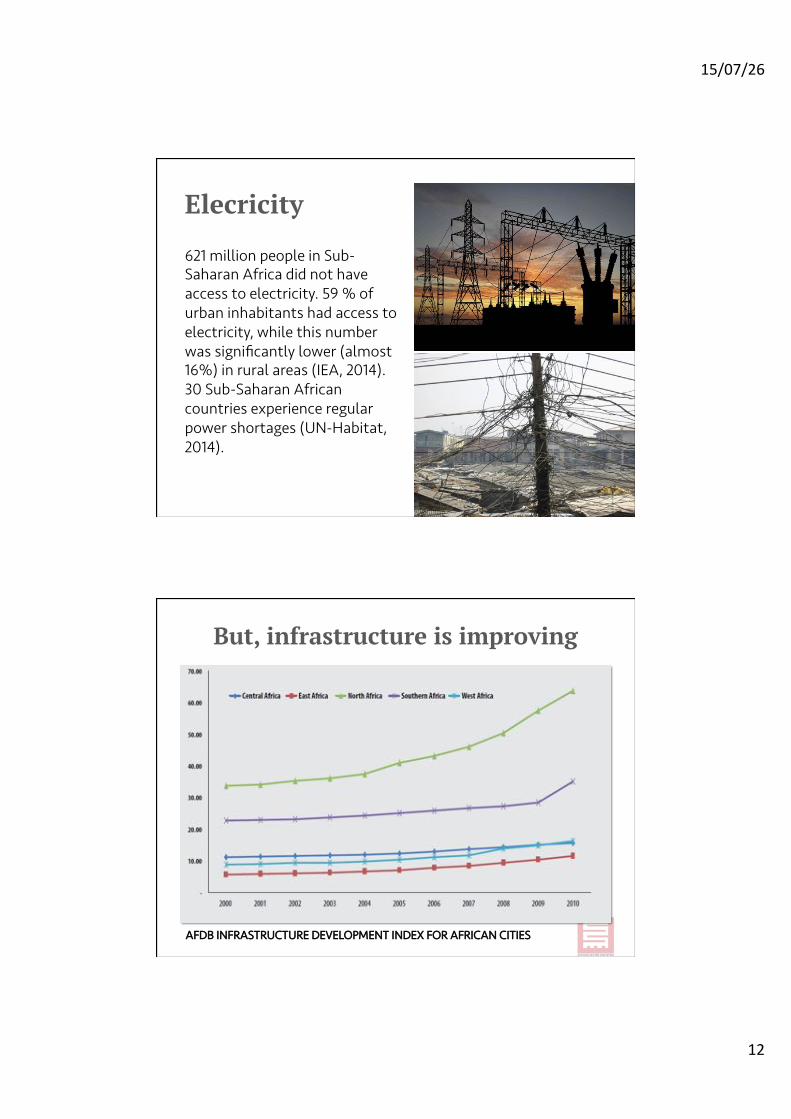
Elecricity
621 million people in Sub-Saharan Africa did not have access to electricity. 59 % of urban inhabitants had access to electricity, while this number was significantly lower (almost 16%) in rural areas (IEA, 2014). 30 Sub-Saharan African countries experience regular power shortages (UN-Habitat, 2014).
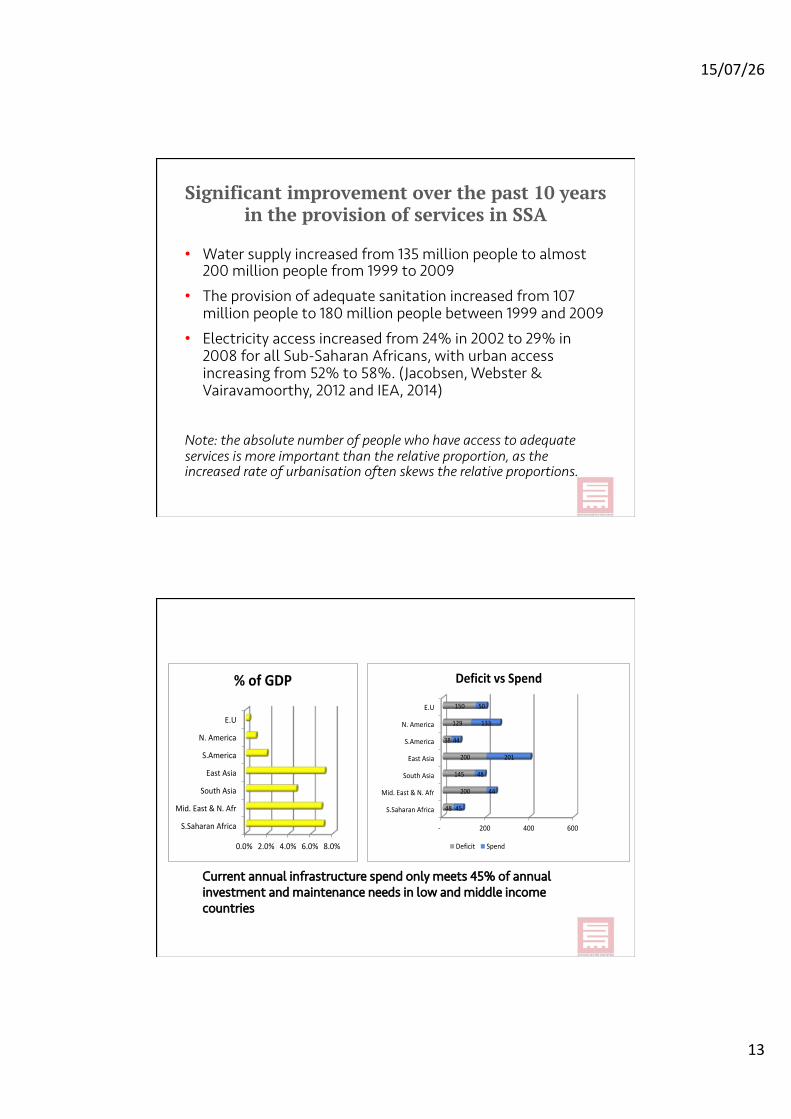
But, infrastructure is improving
AFDB INFRASTRUCTURE DEVELOPMENT INDEX FOR AFRICAN CITIES
15/07/26(
13(
Significant improvement over the past 10 years in the provision of services in SSA
• Water supply increased from 135 million people to almost 200 million people from 1999 to 2009
• The provision of adequate sanitation increased from 107 million people to 180 million people between 1999 and 2009
• Electricity access increased from 24% in 2002 to 29% in 2008 for all Sub-Saharan Africans, with urban access increasing from 52% to 58%. (Jacobsen, Webster & Vairavamoorthy, 2012 and IEA, 2014)
Note: the absolute number of people who have access to adequate services is more important than the relative proportion, as the increased rate of urbanisation often skews the relative proportions.
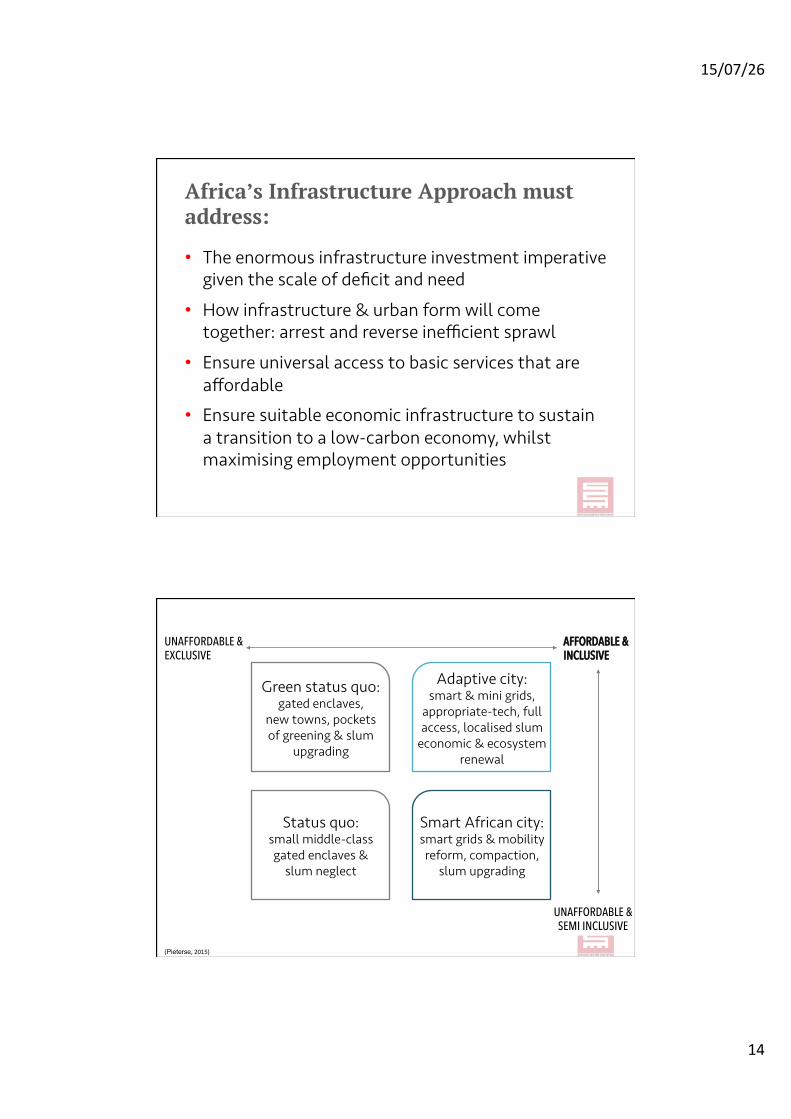
0.0% 2.0% 4.0% 6.0% 8.0%
S.Saharan-Africa
Mid.-East-&-N.-Afr
South-Asia
East-Asia
S.America
N.-America
E.U
%"of"GDP
!" !200 !400 !600
S.Saharan!Africa
Mid.!East!&!N.!Afr
South!Asia
East!Asia
S.America
N.!America
E.U
48!
200!
145!
200!
38!
129!
150!
45!
44!
48!
201!
44!
133!
50!
Deficit'vs'Spend
Deficit Spend
Current annual infrastructure spend only meets 45% of annual investment and maintenance needs in low and middle income countries
15/07/26(
14(
Africa’s Infrastructure Approach must address:
• The enormous infrastructure investment imperative given the scale of deficit and need
• How infrastructure & urban form will come together: arrest and reverse inefficient sprawl
• Ensure universal access to basic services that are affordable
• Ensure suitable economic infrastructure to sustain a transition to a low-carbon economy, whilst maximising employment opportunities
Status quo: small middle-class gated enclaves &
slum neglect
Green status quo: gated enclaves,
new towns, pockets of greening & slum
upgrading
Smart African city: smart grids & mobility reform, compaction,
slum upgrading
Adaptive city: smart & mini grids,
appropriate-tech, full access, localised slum
economic & ecosystem renewal
AFFORDABLE & INCLUSIVE
UNAFFORDABLE & EXCLUSIVE
UNAFFORDABLE & SEMI INCLUSIVE
(Pieterse,(2015)
15/07/26(
15(