Embed Size (px)
Citation preview
Earnings
Conference Call
1Q10
Investor Relations | 1Q10 2/16
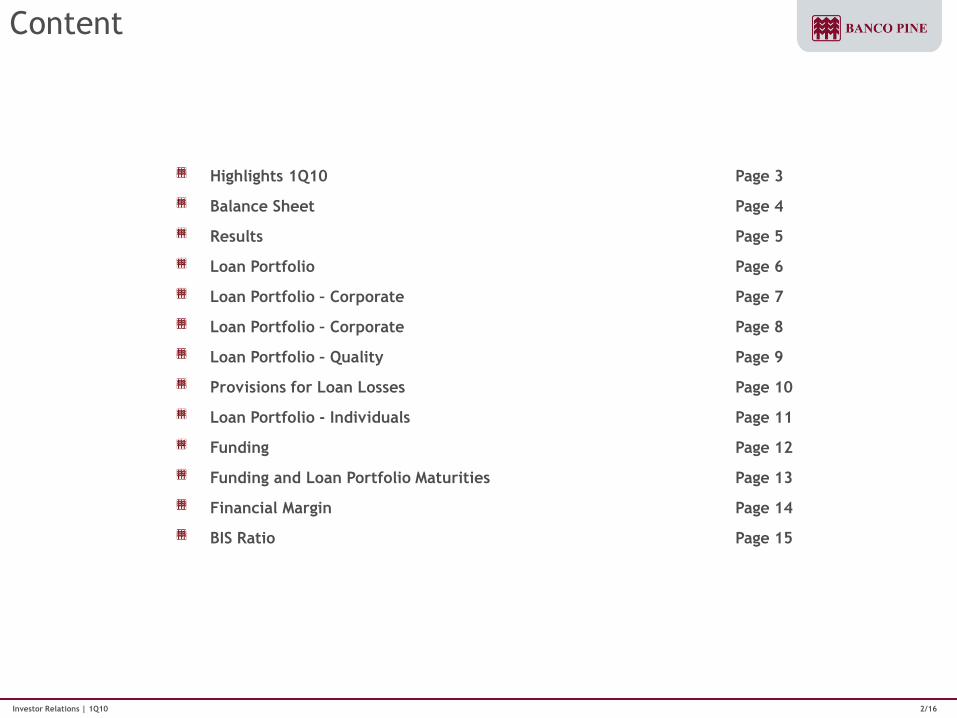
Content
Highlights 1Q10 Page 3
Balance Sheet Page 4
Results Page 5
Loan Portfolio Page 6
Loan Portfolio – Corporate Page 7
Loan Portfolio – Corporate Page 8
Loan Portfolio – Quality Page 9
Provisions for Loan Losses Page 10
Loan Portfolio - Individuals Page 11
Funding Page 12
Funding and Loan Portfolio Maturities Page 13
Financial Margin Page 14
BIS Ratio Page 15
Investor Relations | 1Q10 3/16
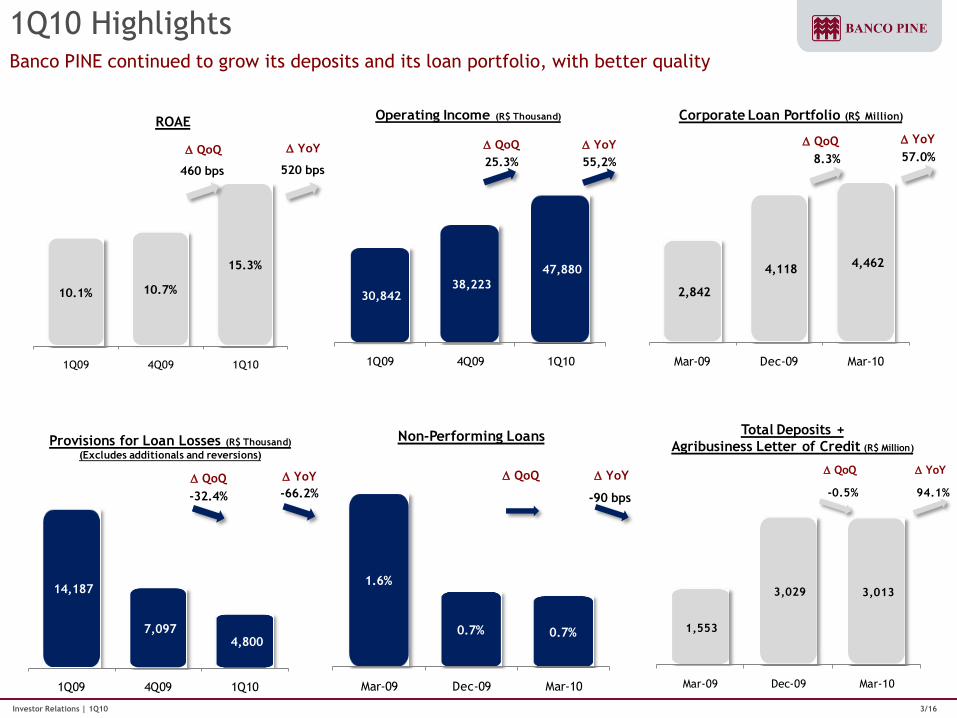
1Q10 HighlightsBanco PINE continued to grow its deposits and its loan portfolio, with better quality
10.1% 10.7%
15.3%
1Q09 4Q09 1Q10
ROAE
520 bps460 bps
D QoQ D YoY
30,842 38,223
47,880
1Q09 4Q09 1Q10
Operating Income (R$ Thousand)
55,2%25.3%
D QoQ D YoY
2,842
4,118 4,462
Mar-09 Dec-09 Mar-10
Corporate Loan Portfolio (R$ Million)
57.0%8.3%
D QoQ D YoY
14,187
7,097 4,800
1Q09 4Q09 1Q10
Provisions for Loan Losses (R$ Thousand)
(Excludes additionals and reversions)
-66.2%-32.4%
D QoQ D YoY
1,553
3,029 3,013
Mar-09 Dec-09 Mar-10
Total Deposits +
Agribusiness Letter of Credit (R$ Million)
94.1%-0.5%
D QoQ D YoY
1.6%
0.7% 0.7%
Mar-09 Dec-09 Mar-10
Non-Performing Loans
-90 bps
D QoQ D YoY
Investor Relations | 1Q10 4/16
R$ million
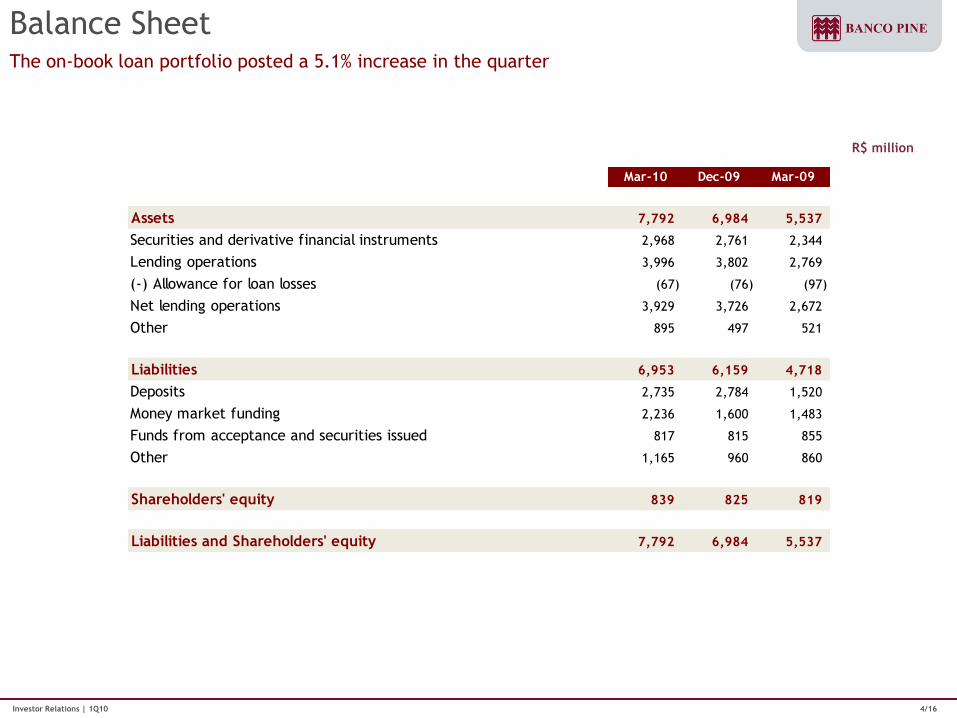
Balance SheetThe on-book loan portfolio posted a 5.1% increase in the quarter
Mar-10 Dec-09 Mar-09
Assets 7,792 6,984 5,537
Securities and derivative financial instruments 2,968 2,761 2,344
Lending operations 3,996 3,802 2,769
(-) Allowance for loan losses (67) (76) (97)
Net lending operations 3,929 3,726 2,672
Other 895 497 521
Liabilities 6,953 6,159 4,718
Deposits 2,735 2,784 1,520
Money market funding 2,236 1,600 1,483
Funds from acceptance and securities issued 817 815 855
Other 1,165 960 860
Shareholders' equity 839 825 819
Liabilities and Shareholders' equity 7,792 6,984 5,537
Investor Relations | 1Q10 5/16
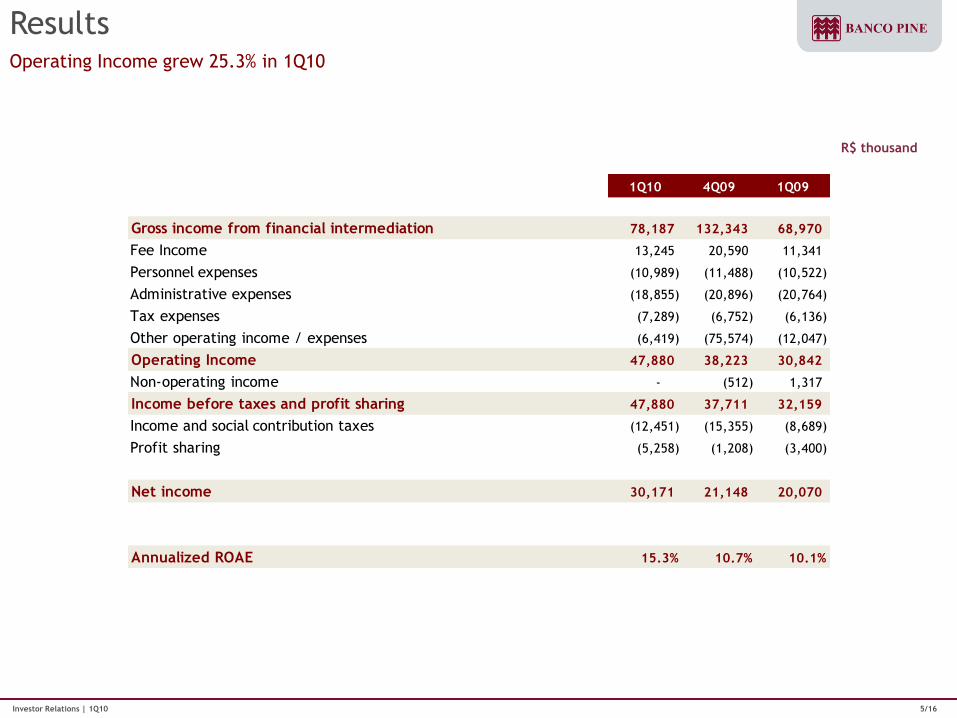
ResultsOperating Income grew 25.3% in 1Q10
R$ thousand
1Q10 4Q09 1Q09
Gross income from financial intermediation 78,187 132,343 68,970
Fee Income 13,245 20,590 11,341
Personnel expenses (10,989) (11,488) (10,522)
Administrative expenses (18,855) (20,896) (20,764)
Tax expenses (7,289) (6,752) (6,136)
Other operating income / expenses (6,419) (75,574) (12,047)
Operating Income 47,880 38,223 30,842
Non-operating income - (512) 1,317
Income before taxes and profit sharing 47,880 37,711 32,159
Income and social contribution taxes (12,451) (15,355) (8,689)
Profit sharing (5,258) (1,208) (3,400)
Net income 30,171 21,148 20,070
Annualized ROAE 15.3% 10.7% 10.1%
Investor Relations | 1Q10 6/16
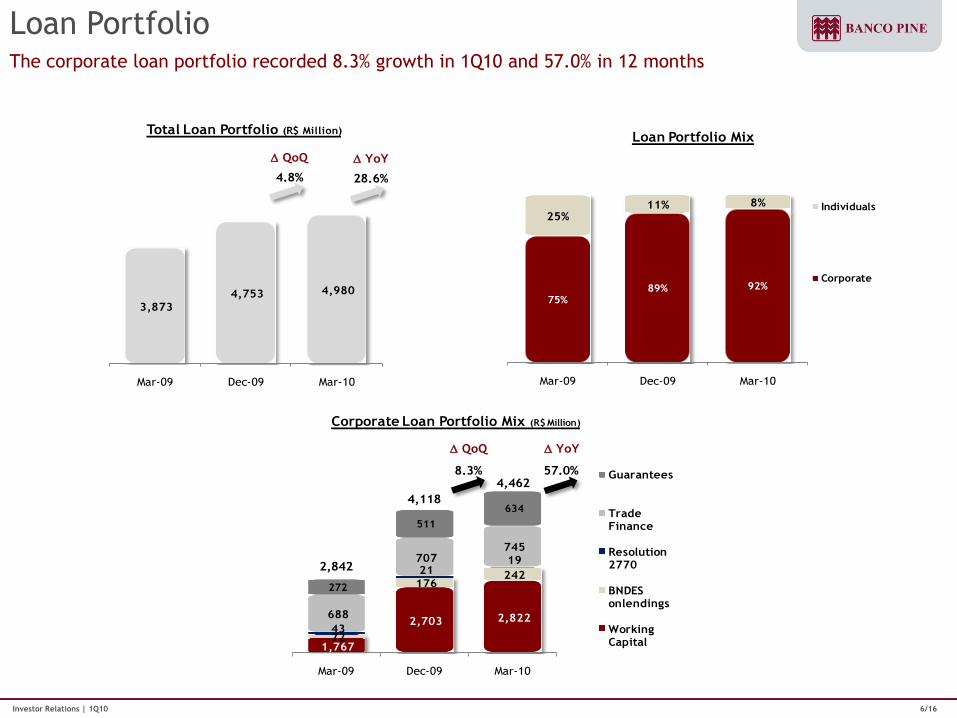
Loan PortfolioThe corporate loan portfolio recorded 8.3% growth in 1Q10 and 57.0% in 12 months
3,873
4,753 4,980
Mar-09 Dec-09 Mar-10
Total Loan Portfolio (R$ Million)
28.6%4.8%
D QoQ D YoY
75%89% 92%
25%11% 8%
Mar-09 Dec-09 Mar-10
Loan Portfolio Mix
Individuals
Corporate
1,767
2,703 2,822
72
176 242
43
21 19
688
707 745
272
511
634
Mar-09 Dec-09 Mar-10
Corporate Loan Portfolio Mix (R$ Million)
Guarantees
Trade Finance
Resolution 2770
BNDES onlendings
Working Capital
8.3% 57.0%
2,842
4,118
4,462
D QoQ D YoY
Investor Relations | 1Q10 7/16
Loan Portfolio by Product
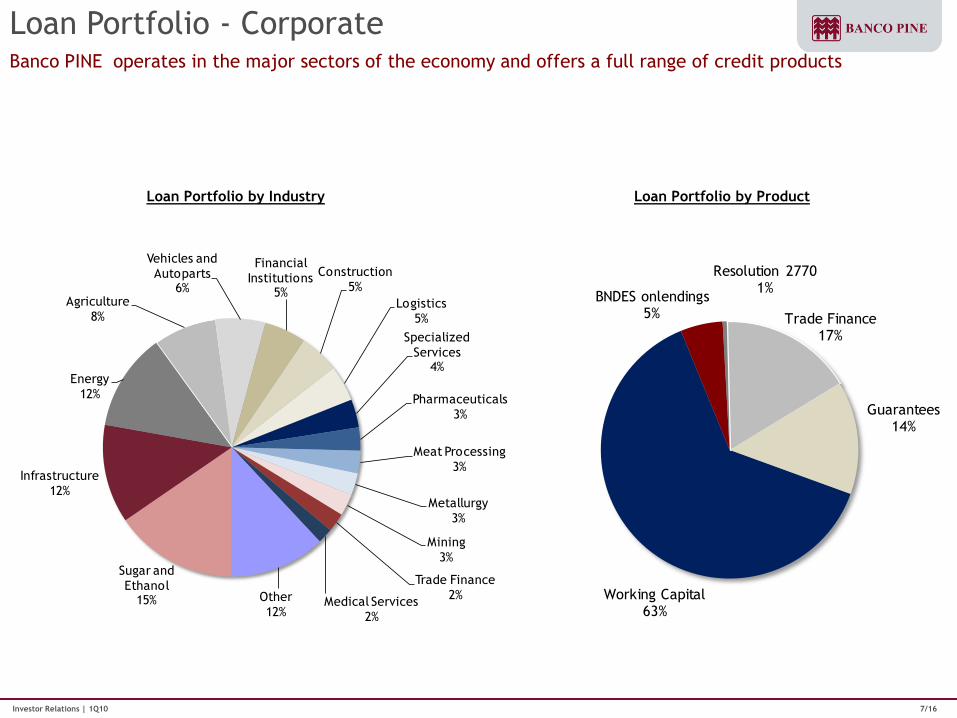
Loan Portfolio - CorporateBanco PINE operates in the major sectors of the economy and offers a full range of credit products
Loan Portfolio by Industry
Sugar and
Ethanol15%
Infrastructure
12%
Energy
12%
Agriculture
8%
Vehicles and
Autoparts6%
Financial
Institutions5%
Construction
5%
Logistics
5%
Specialized
Services4%
Pharmaceuticals
3%
Meat Processing
3%
Metallurgy
3%
Mining
3%
Trade Finance
2%Medical Services
2%
Other
12%
Working Capital63%
BNDES onlendings5%
Resolution 2770 1%
Trade Finance17%
Guarantees14%
Investor Relations | 1Q10 8/16
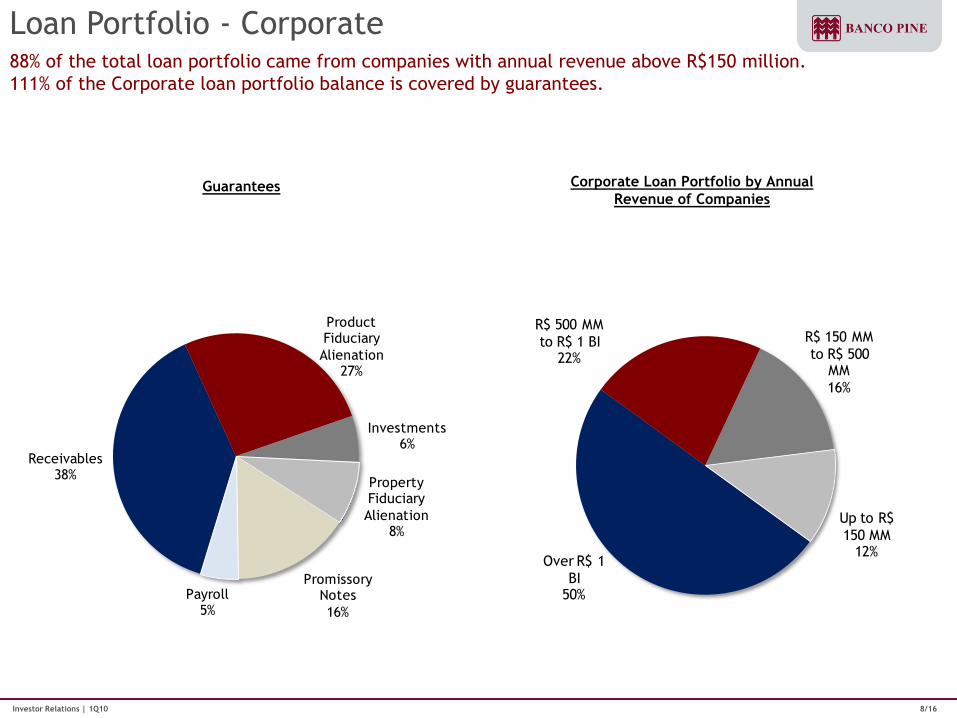
Loan Portfolio - Corporate88% of the total loan portfolio came from companies with annual revenue above R$150 million.
111% of the Corporate loan portfolio balance is covered by guarantees.
Guarantees Corporate Loan Portfolio by Annual
Revenue of Companies
Receivables38%
Product Fiduciary
Alienation27%
Investments6%
Property Fiduciary
Alienation8%
Promissory Notes
16%
Payroll5%
Over R$ 1
BI50%
R$ 500 MM
to R$ 1 BI22%
R$ 150 MM
to R$ 500 MM
16%
Up to R$
150 MM12%
Investor Relations | 1Q10 9/16
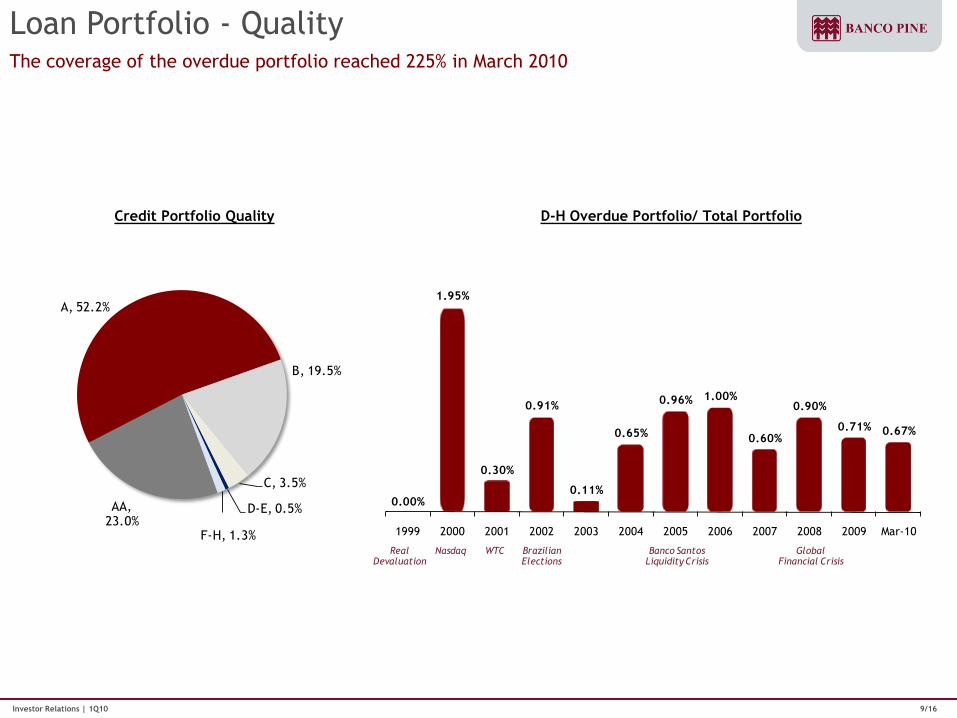
Loan Portfolio - QualityThe coverage of the overdue portfolio reached 225% in March 2010
0.00%
1.95%
0.30%
0.91%
0.11%
0.65%
0.96% 1.00%
0.60%
0.90%
0.71% 0.67%
1999 2000 2001 2002 2003 2004 2005 2006 2007 2008 2009 Mar-10
Real Devaluation
Nasdaq WTC Brazilian Elections
Banco Santos Liquidity Crisis
Global Financial Crisis
D-H Overdue Portfolio/ Total PortfolioCredit Portfolio Quality
AA, 23.0%
A, 52.2%
B, 19.5%
C, 3.5%
D-E, 0.5%
F-H, 1.3%
Investor Relations | 1Q10 10/16
Provisions for Loan Losses
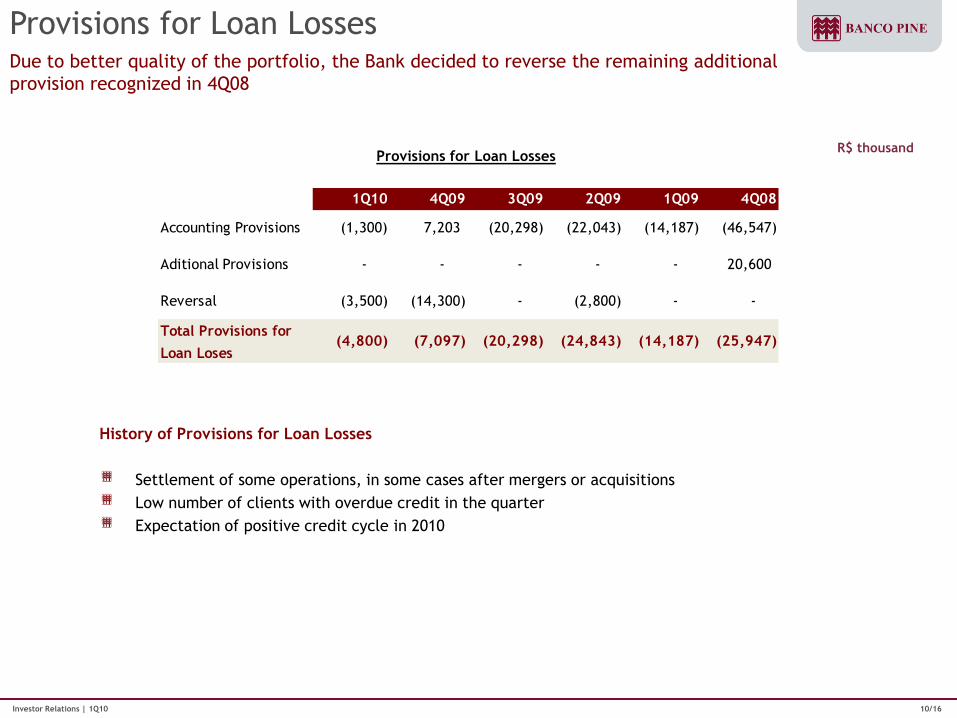
Provisions for Loan LossesDue to better quality of the portfolio, the Bank decided to reverse the remaining additional
provision recognized in 4Q08
R$ thousand
History of Provisions for Loan Losses
Settlement of some operations, in some cases after mergers or acquisitions
Low number of clients with overdue credit in the quarter
Expectation of positive credit cycle in 2010
1Q10 4Q09 3Q09 2Q09 1Q09 4Q08
Accounting Provisions (1,300) 7,203 (20,298) (22,043) (14,187) (46,547)
Aditional Provisions - - - - - 20,600
Reversal (3,500) (14,300) - (2,800) - -
(4,800) (7,097) (20,298) (24,843) (14,187) (25,947) Total Provisions for
Loan Loses
Investor Relations | 1Q10 11/16
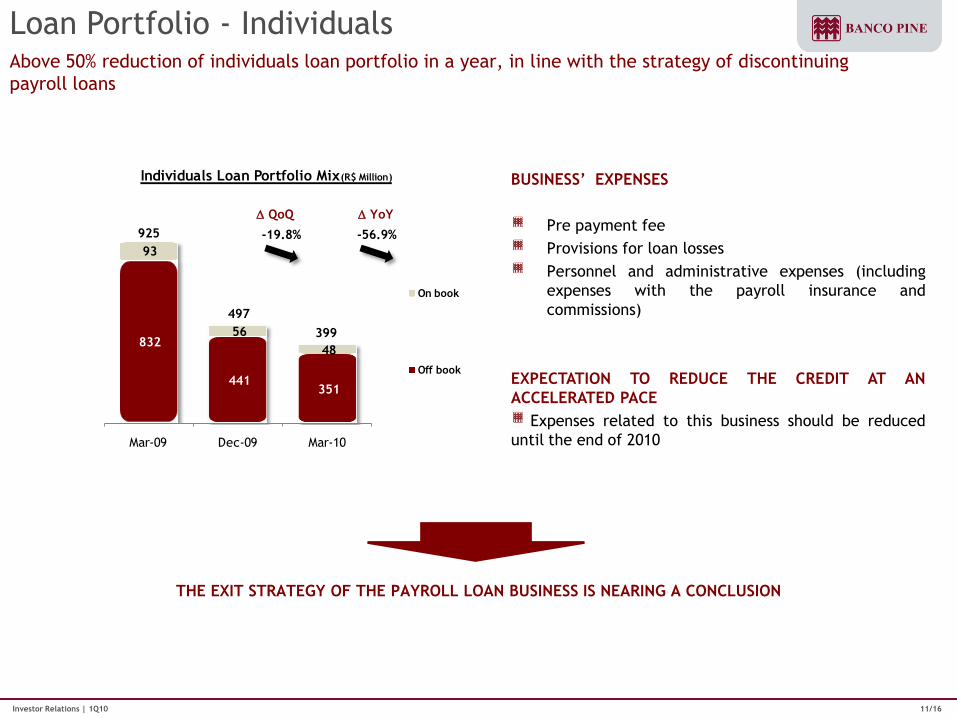
Loan Portfolio - IndividualsAbove 50% reduction of individuals loan portfolio in a year, in line with the strategy of discontinuing
payroll loans
BUSINESS’ EXPENSES
Pre payment fee
Provisions for loan losses
Personnel and administrative expenses (including
expenses with the payroll insurance and
commissions)
EXPECTATION TO REDUCE THE CREDIT AT AN
ACCELERATED PACE
Expenses related to this business should be reduced
until the end of 2010
THE EXIT STRATEGY OF THE PAYROLL LOAN BUSINESS IS NEARING A CONCLUSION
832
441 351
93
56
48
Mar-09 Dec-09 Mar-10
Individuals Loan Portfolio Mix(R$ Million)
On book
Off book
925
497
399
-19.8% -56.9%
D QoQ D YoY
Investor Relations | 1Q10 12/16
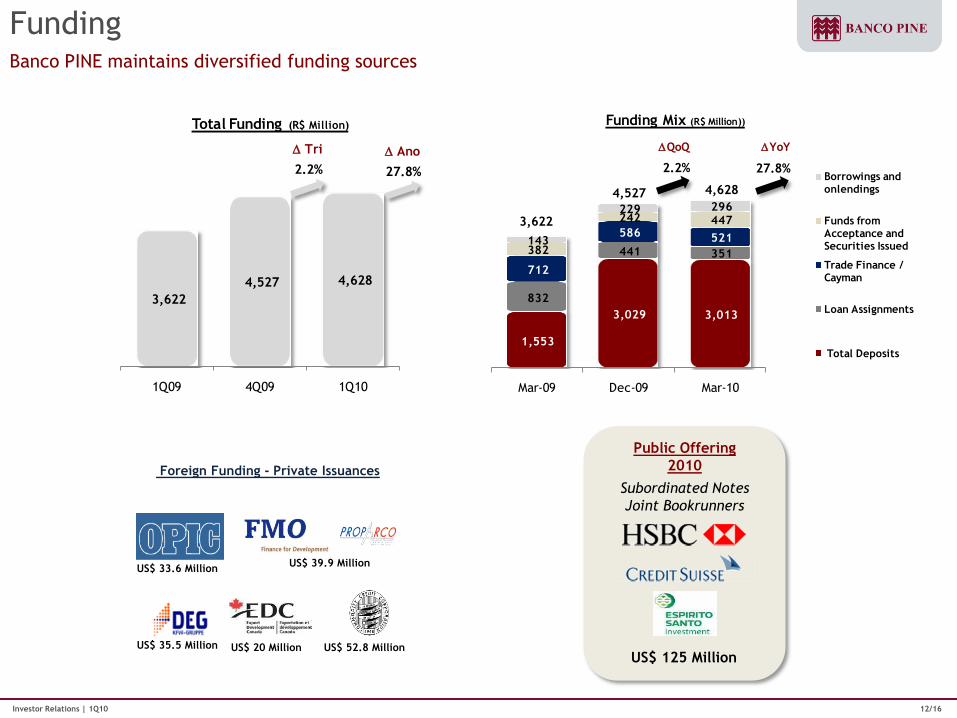
FundingBanco PINE maintains diversified funding sources
Foreign Funding - Private Issuances
US$ 33.6 Million
US$ 35.5 Million US$ 52.8 Million
US$ 39.9 Million
US$ 20 Million
Subordinated Notes
Joint Bookrunners
Public Offering
2010
US$ 125 Million
3,622
4,527 4,628
1Q09 4Q09 1Q10
Total Funding (R$ Million)
27.8%2.2%
D Tri D Ano
1,553
3,029 3,013
832
441 351
712
586 521 382
242 447
143
229 296
Mar-09 Dec-09 Mar-10
Funding Mix (R$ Million))
Borrowings and onlendings
Funds from Acceptance and Securities Issued
Trade Finance / Cayman
Loan Assignments
Total Deposits
2.2%
DQoQ
27.8%
DYoY
3,622
4,6284,527
Investor Relations | 1Q10 13/16
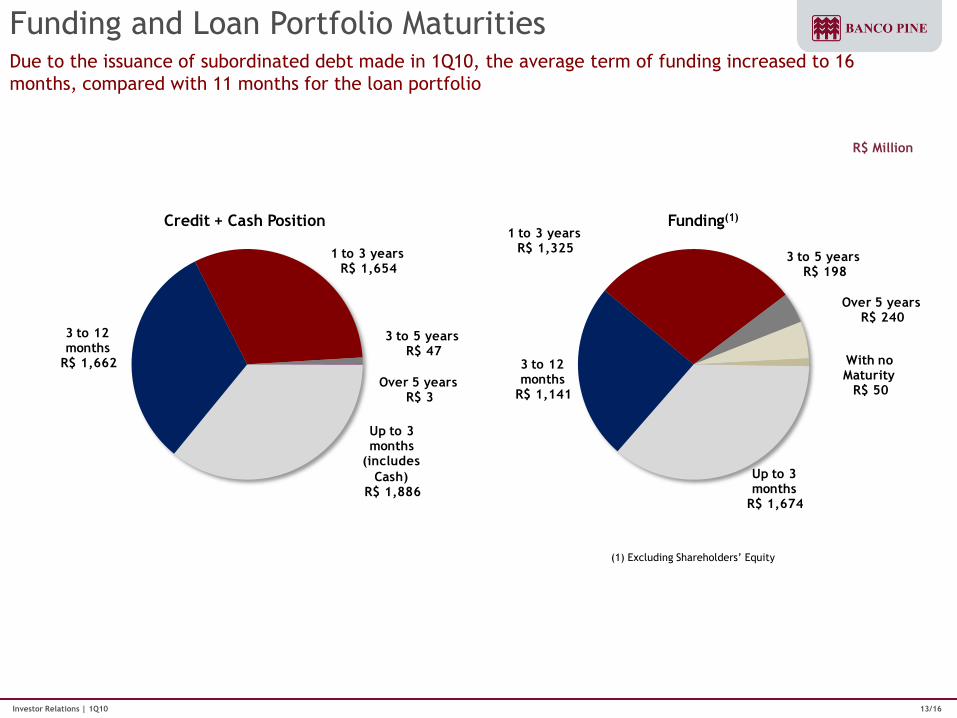
Funding and Loan Portfolio Maturities Due to the issuance of subordinated debt made in 1Q10, the average term of funding increased to 16
months, compared with 11 months for the loan portfolio
(1) Excluding Shareholders’ Equity
R$ Million
Up to 3 months
(includes
Cash)R$ 1,886
3 to 12 months
R$ 1,662
1 to 3 yearsR$ 1,654
3 to 5 yearsR$ 47
Over 5 yearsR$ 3
Credit + Cash Position
With no Maturity
R$ 50
Up to 3 months
R$ 1,674
3 to 12 months
R$ 1,141
1 to 3 yearsR$ 1,325
3 to 5 yearsR$ 198
Over 5 yearsR$ 240
Funding(1)
Investor Relations | 1Q10 14/16
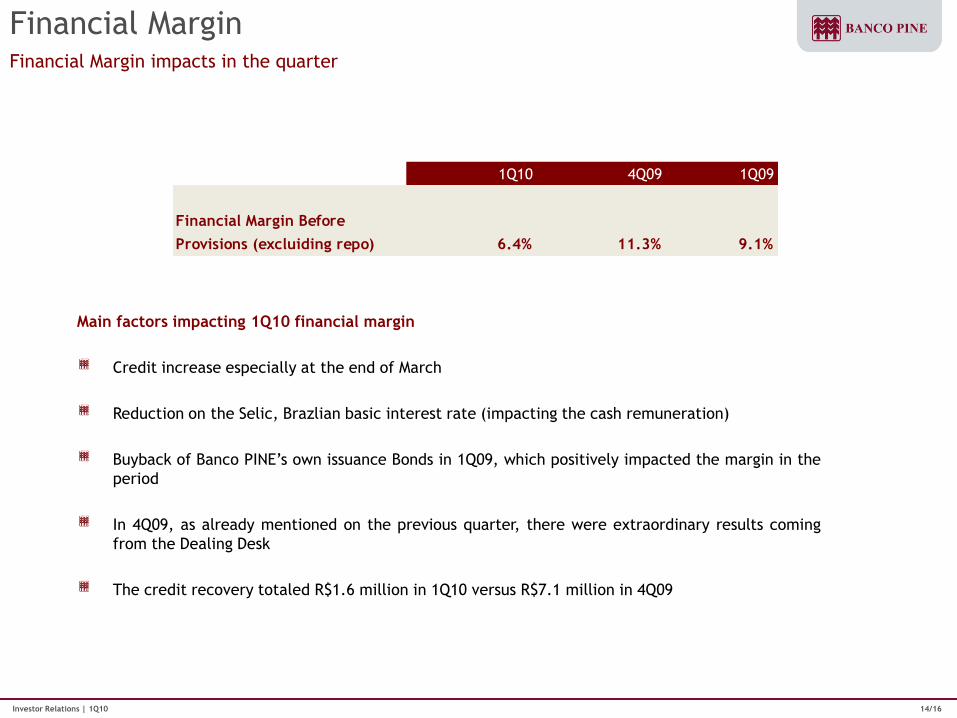
Financial MarginFinancial Margin impacts in the quarter
Main factors impacting 1Q10 financial margin
Credit increase especially at the end of March
Reduction on the Selic, Brazlian basic interest rate (impacting the cash remuneration)
Buyback of Banco PINE’s own issuance Bonds in 1Q09, which positively impacted the margin in the
period
In 4Q09, as already mentioned on the previous quarter, there were extraordinary results coming
from the Dealing Desk
The credit recovery totaled R$1.6 million in 1Q10 versus R$7.1 million in 4Q09
1Q10 4Q09 1Q09
Financial Margin Before
Provisions (excluiding repo) 6.4% 11.3% 9.1%
Investor Relations | 1Q10 15/16
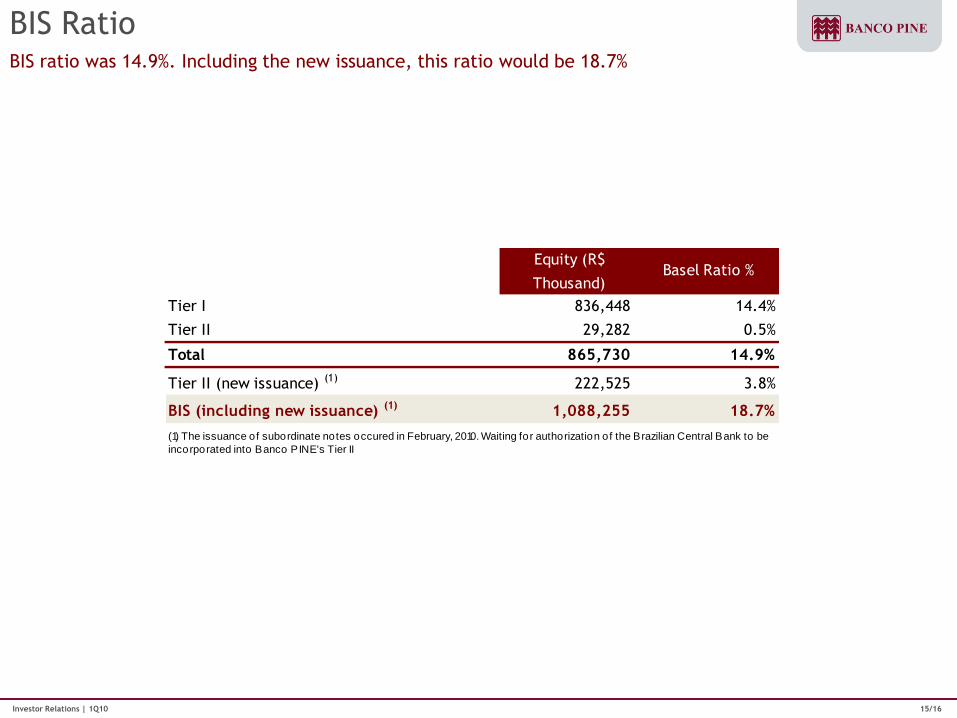
BIS RatioBIS ratio was 14.9%. Including the new issuance, this ratio would be 18.7%
Equity (R$
Thousand)Basel Ratio %
Tier I 836,448 14.4%
Tier II 29,282 0.5%
Total 865,730 14.9%
Tier II (new issuance) (1) 222,525 3.8%
BIS (including new issuance) (1) 1,088,255 18.7%
(1) The issuance of subordinate notes occured in February, 2010. Waiting for authorization of the Brazilian Central Bank to be
incorporated into Banco PINE's Tier II

Investor Relations | 1Q10 16/16
Investor Relations
Noberto Nogueira Pinheiro Jr.
CEO
Nira Bessler
Head of Investor Relations
Alejandra Hidalgo
Investor Relations Analyst
Phone: +55-11-3372-5553 / 5552
www.bancopine.com.br/ir
This presentation contains forward-looking statements relating to the prospects of the business, estimates for operating and financial results, and those related to growth prospects of Banco Pine. These are
merely projections and, as such, are based exclusively on the expectations of Banco Pine’s management concerning the future of the business and its continued access to capital to fund the Company’s
business plan. Such forward-looking statements depend, substantially, on changes in market conditions, government regulations, competitive pressures, the performance of the Brazilian economy and the
industry, among other factors and risks disclosed in Banco Pine’s filed disclosure documents and are, therefore, subject to change without prior notice.