Embed Size (px)
Citation preview

Enel SpA
Investor Relations
2011 Results 2012-2016 Plan
Rome - March 8, 2012

1
Enel SpA
Investor Relations
Agenda
• 2011 macro scenario
› Worldwide
› Energy industry
• 2011 results
• 2012 outlook
• 2012-2016 strategic update
› Macro assumptions
› Key priorities
› Divisional targets
• Managerial actions
› Mature markets
› Growth markets
› Efficiencies
• Financial outcome
• Overall financial targets
F. Conti
F. Conti
2011 Results & 2012-2016 Plan
L. Ferraris
CEO
CFO
“
“
“
“

2
Enel SpA
Investor Relations
4Q „10
Growth markets
2011 macro scenario Worldwide GDP and industrial production evolution1
Group Strategy 2012-2016 Plan
Mature markets
USA Eurozone
+4.0%
0.0%
+2.0%
1Q „10
2Q „10
3Q „10
1Q „11
2Q „11
3Q „11
4Q „11
+1.0%
+2.0%
-0.4%
Latam
+8.0%
+6.0%
+4.0% +5.5%
+3.1%
GDP growth
GDP growth Industrial production growth
2010 3Q11
4Q11
2010 3Q11 4Q11
+6.2%
+2.9%
-0.6%
+5.3%
+3.7% +3.7%
USA Eurozone
+3.6%
1Q12
-1.9%
1Q12
1. Source: Global Insight. Year-on-year changes
1Q „12
-1.0%
+3.0%
+1.0%
4Q „10
1Q „10
2Q „10
3Q „10
1Q „11
2Q „11
3Q „11
4Q „11
1Q „12
+2.0%
Industrial production growth
Emerging markets
+10.3%
+7.3%
+5.4%
2010 3Q11 4Q11
+5.0%
1Q12
+2.2%

3
Enel SpA
Investor Relations
2011 macro scenario Energy industry Electricity demand evolution1
Group Strategy 2012-2016 Plan
2011 2010 2009
Italy Spain2 Slovakia Russia
2008 level = 100
1. Source: local Transmission System Operator (TSO)
2. Peninsular
94 95
99
93
95
97 98
105
98 99
98
96
110
98
102
2011 2010 2009 2011 2010 2009 2011 2010 2009 2011 2010 2009
Latam

4
Enel SpA
Investor Relations
2011 results
2011 Results

5
Enel SpA
Investor Relations
FY10 FY11 % €mn
1. Excluding capital gains, losses and one-off items 2. Excluding net debt of assets held for sale
Revenues
EBITDA
- recurring1
EBIT
Group net income
Group net ordinary income1
Net debt2
73,377
17,480
17,410
11,258
4,390
4,405
44,924
+8.4
+1.4
-
+1.0
-5.5
-7.0
-0.7
Financial highlights Consolidated results
79,514
17,717
17,416
11,366
4,148
4,097
44,629
2011 Results

6
Enel SpA
Investor Relations
From EBIT to Net Income
EBIT
Net financial charges
Interest charges
Other
Net income from equity investments using equity method
EBT
Income tax
Net income (continuing operations & including third parties)
Minorities
Group net income
FY10 FY11 % €mn
2011 Results
11,366
(3,024)
2,776
248
96
8,438
(3,080)
5,358
(1,210)
4,148
+1.0
-5.4
-2.6
-28.7
n.m.
+4.5
+28.3
-5.6
-5.7
-5.5
11,258
(3,198)
2,850
348
14
8,074
(2,401)
5,673
(1,283)
4,390

7
Enel SpA
Investor Relations
Italy Spain2
2013
100
2012 2013
~ 5 - 10
~ 90 - 95
2012
2013
~ 60 - 65
~ 35 - 40
~ 70 - 75
2012
Latam
2013 2012
Slovakia
~ 25 - 30
Unhedged
Hedged
100
100 100
100 100
100 100
~ 55 - 60
~40 - 45(1)
1. Including roll-over 2. Not including domestic coal output
~ 40
~ 60
~ 15
~ 85
Focus on forward electricity sales Level of total production hedged (%)
2011 Results
Forward sales continue to be a strong tool to offset price risk

8
Enel SpA
Investor Relations
66 211
17,480 -210 17,717
1. Including the Engineering & Innovation division and elisions
FY10 G&EM Italy
Market Italy
I&N Italy
Iberia & Latam
S&H1
FY11
+1.4%
Inter-national
EGP
Market
I&N
S&H1
G&EM
Iberia & Latam International
EGP
Group EBITDA evolution (€mn)
+78 +472 +122 -645 +275 +145
3,813 4,285
1,520 1,642
7,896 7,251
1,585
2,392 2,182
2011 Results
483
1,310
561

9
Enel SpA
Investor Relations
EBITDA evolution: G&EM Italy (€mn)
FY10 Generation margin
FY11
-8.8%
Ancillary services
Gas & Trading margin
Other
-408
-84 -36
2,392
2,182 +318
2011 Results

10
Enel SpA
Investor Relations 2011 Results
EBITDA evolution: Infrastructure & Networks Italy (€mn)
-34
FY10 Connection fees
FY11 Energy margin
3,813 +220
+12.4%
+286
Other
4,285

11
Enel SpA
Investor Relations 2011 Results
EBITDA evolution: International (€mn)
712 811
318 289
57 52
433 490
1,520 -29 +99 -5
1,642 +57
FY10 FY11 Russia SEE2 Centrel1 France & Belgium3
SEE France & Belgium
Centrel
Russia
+8.0%
1. Slovenské Elektrárne 2. Romanian, Bulgarian and Greek operations 3. Including Enel Investment Holding
12
Enel SpA
Investor Relations 2011 Results
EBITDA evolution1: Endesa - Iberia (€mn)
1. Enel’s GAAP figures
3,994
4,487
FY10
-11.0%
Liberalized business
Regulated business
FY11
-262
-240 +70
Net capital gains
Perimeter effect
Others
-122 +61

13
Enel SpA
Investor Relations 2011 Results
EBITDA evolution1: Endesa - Latam (€mn)
3,257 3,409
FY10
-4.5%
Generation business
Distribution business
FY11
+24 +22 -109
Net-worth tax
Colombia
-89
Forex effect
1. Enel’s GAAP figures

14
Enel SpA
Investor Relations 2011 Results
EBITDA evolution: Enel Green Power (€mn)
878 871
336 389
84 107 12
34
184
+21.0%
FY10 Italy and Europe
FY11 North America
Other Iberia and Latin America
1,310 -7 +23 +53
+184 1,585
Enel.si
Italy and Europe
Iberia and Latin America
North America
Enel.si
+22

15
Enel SpA
Investor Relations 2011 Results
Net debt evolution (€mn)
1. Net debt change calculated on continuing operations 2. Net financial charges due to interest expenses 3. Including 882€mn of dividends paid to minorities
December 31,
2010
Capex Cash-flow
from operations
Net financial
charges2
Extra-
ordinary
activities4
December 31,
2011
-295 (1)
Dividends3
4. Mainly related with Maritza sale 5. Net financial debt of assets held for sale
(5)
-44,924 -44,629
-636 +16,417
-7,589 -2,526
-3,517 +518
+1(5)
Taxes
-2,371

16
Enel SpA
Investor Relations
Enel‟s debt maturity profile (€bn)
Liquidity available to cover maturities up to 2014
Debt maturity profile Total liquidity available
2012
~30
Cash and cash equivalents5
Bonds4
Tariff Deficit cash in3
~9.7
Long term
Short term
1. Disposal of Terna 0.3€bn, EIB financing 0.3€bn, financial receivable 0.2€bn 2. As of 31st of December 2011. Lines with maturities beyond 2014 3. Additional cash in from private placements occurred during the 1st quarter of 2012
New term loans signed
in February 2012
Long term committed
credit lines2 ~13
~0.8
~3.7
~3.4
~7.0
Other1
~1.7
4. Bond retail 3€bn in February 2012, private placements 0.4€bn during January and February 2012
5. As of 31st of December 2011 6. Commercial paper 3.2€bn, short term debt 1.6€bn as of Dec 31st 2011
2012 2013 2014 2015 2016 After2016
~14.5
~3.9
~5.7 ~6.1 ~6.6
~26.5
~4.8(6)
~9.7
2011 Results

17
Enel SpA
Investor Relations
2012 outlook
Group Strategy 2012-2016 Plan

18
Enel SpA
Investor Relations
2012 outlook Focus on Italy: GEM division
Group Strategy 2012-2016 Plan
Slow demand
recovery
(CAGR 2008-12: -0.4%)
Overcapacity &
PV peak shaving
Gas oversupply
2012 profitability impacted by demand decline, solar overcapacity and gas scenario
2008 2011 2012
339
332 ~334
Electricity demand (TWh)
Net installed capacity (GW)
2008 2011 2012
2008 2011 2012
Gas demand2 (bcm)
34 28 ~27
~75 76
83
99
117 ~121
12 ~15
Thermal generation Residential and industrial
Solar PV Reserve margin
22%
45% >45%
EBITDA (€bn)
2012 2011
1.9(1)
1.3
1. Excluding extraordinary items for ~ 300€mn 2. Net of network losses

19
Enel SpA
Investor Relations
2012 outlook Focus on Spain1
Group Strategy 2012-2016 Plan
Demand decline and increasing commodities prices
Electricity demand (TWh)
2011 2012
264 255 ~ 253
2008
Endesa‟s 2012 EBITDA main parameters
EBITDA (€bn)
CAGR 2008-2012: -1.1%
1. Peninsular 2. Regulated activities include also extra-peninsular operations
~4.0 ~3.7
Unregulated business
Regulated business2
2011 2012
~67%
~33% ~28%
~72%
● LRT + social bonus
● Lower islands margin
● Gas supply

20
Enel SpA
Investor Relations
2012 outlook Focus on Latam
Group Strategy 2012-2016 Plan
Electricity demand1 (TWh)
2011 2012
803
~833
Endesa output (TWh)
2011 2012
62.8
66.1
1. Countries where Enel operates
EBITDA (€bn)
~3.3 ~3.6
2011 2012
~47%
~53% ~50%
~50%
Unregulated business
Regulated business
Organic growth to increase profitability

21
Enel SpA
Investor Relations
2012 outlook Focus on Russia & Slovakia
Group Strategy 2012-2016 Plan
● Gas net back parity: 2023 vs. 2015
● Electricity demand CAGR: +1.3%(1) vs. +1.4%(2)
Russia: change in Plan assumptions Russia EBITDA (€mn)
New Plan
Old Plan
2011 2012
~500 ~500
● Electricity prices CAGR: +4.6%(1) vs. +5.6%(2)
● Electricity demand CAGR: +1.8%(1) vs. +1.9%(2)
New Plan
Old Plan
2011 2012
~800 ~800
Slovakia: change in Plan assumptions Slovakia EBITDA (€mn)
Resilient platforms in a stable scenario 1. CAGR 2011-2016 2. CAGR 2010-2015

22
Enel SpA
Investor Relations
2012 outlook Focus on Renewables
Group Strategy 2012-2016 Plan
Enel Green Power net installed capacity (GW)
2011(1) 2012
~1.4
~1.7
Organic growth to increase profitability
2011 2012
7.1
~8.1
Enel Green Power load factor
2011 2012
~40% ~40%
EBITDA (€bn)
1. Excluding non recurring items

23
Enel SpA
Investor Relations
2012-2016 strategic update
Group Strategy 2012-2016 Plan

24
Enel SpA
Investor Relations Group Strategy 2012-2016 Plan
2012-2016 strategic update Base assumptions of Enel Group‟s Plan
+0.6%
+1.0%
+3.6%
+3.4%
+4.4%
Italy
Spain
Russia
Slovakia
Latam
Electricity demand CAGR 2011-2016
3,4
1. Source: Global Insight 2. Peninsular 3. Brazil, Chile (CIS), Colombia, Peru, Argentina 4. Average growth weighted by Enel’s production 5. CIF ARA
GDP1 CAGR 2011-2016
3
Brent ($/bbl) Coal5 ($/ton)
2012 2014 2016
131 125 128
2011
122
2012 2014 2016
107 100 100
2011
111
Commodities
+1.2%
+1.5%
+1.3%
+1.8%
+5.1%
Italy
Spain
Russia
Slovakia
Latam
2

25
Enel SpA
Investor Relations Group Strategy 2012-2016 Plan
2012-2016 strategic update Base assumptions of Enel Group‟s Plan Focus on CO2
Italy
Iberia
Slovakia
Negative
Balanced net exposure to CO2 prices
CO2 Emissions1 (Mtons)
Emission hedged with CO2 portfolio
Margin correlation to CO2 price increase
Positive
Positive
185
150
15
~60%
1. Enel’s cumulated 2012-16
26
Enel SpA
Investor Relations
2012-2016 strategic update Key priorities
Group Strategy 2012-2016 Plan
A consistent overall strategic approach
Maintaining our leadership in mature energy markets
Deliver organic growth in:
renewables, Latam, Russia and Eastern Europe
Accelerate efficiencies and operational excellence
Leadership in innovation
Consolidate financial stability
Tight control on capex

27
Enel SpA
Investor Relations
2012-2016 strategic update Italian operations
Group Strategy 2012-2016 Plan
Operational excellence
Tight control in capex
Margins resilience
Leadership in free market
● Best practice sharing, synergies and zenith plan
on-going
● Working capital optimization
● “Just in time” approach in the investment
decisions
● Margins protections through hedging and portfolio
optimization
● Optimize marginal plant management
● Focused growth in mass market and SOHO
segments
● Cost leadership and quality of service to final
customers
● Smart grids and electric mobility development
Focus on efficiencies and capex optimization

28
Enel SpA
Investor Relations
2012-2016 strategic update Italian operations Divisional targets (€bn)
~7.1
G&EM
I&N
Market
Capex1
2012 2014 2016
EBITDA2
~3.9
~1.3
~0.5
~3.7
~1.1
~0.5
~3.5
~1.3
~0.5
~5.7
~5.3 ~5.3
Less uncertainties looking forward
Group Strategy 2012-2016 Plan
2012-2016
64%
31% 5%
Maintenance: ~80%
Growth: ~20%
1. Net of connection fees 2. Service&Holding not included

29
Enel SpA
Investor Relations
2012-2016 strategic update Iberian operations
Group Strategy 2012-2016 Plan
Focus on profitability and leadership consolidation
Operational excellence
Tight control in capex
Margins resilience
Leadership in free market
● Proactive with regulation
● Synergies & Zenith plan
● Cash optimization: selective “just in time” investments
● Energy management: leverage on “short position”
strategy with limited risk exposure
● Complete reorganization in distribution
● Maintain quality of service and grid modernization

30
Enel SpA
Investor Relations
2012-2016 strategic update Iberian operations Targets (€bn)
Group Strategy 2012-2016 Plan
EBITDA
~5.3
Unregulated business
Regulated business2
55%
45%
Maintenance: ~82%
Growth: ~18%
2012-2016
Capex1
2012 2014 2016
~3.7 ~3.8
~4.0
~72% ~74%
~74%
~28% ~26% ~26%
1. Net of connection fees 2. Regulated activities include also extra-peninsular operations
Regulated business, demand recovery and price increase to improve long term profitability

31
Enel SpA
Investor Relations
2012-2016 strategic update Latam operations
Group Strategy 2012-2016 Plan
● Generation: ~1.1 GW additional capacity & increasing
pipeline
● Distribution: ~1.8 mn new clients over the period
● Pursue new regulatory model in Argentina
● Capture opportunities to optimize current structure
● Synergies & Zenith plan, Operational excellence
● Cash optimization: selective “just in time” investments
Consolidate leadership position
Structure optimization
Cash optimization
Operational excellence
Organic growth opportunities

32
Enel SpA
Investor Relations
2012-2016 strategic update Latam operations Targets (€bn)
EBITDA
Group Strategy 2012-2016 Plan
Unregulated ~40%
Regulated ~60% Maintenance
Growth
~5.4
2012 – 2016
Capex
47%
53%
2012 2014 2016
~3.6 ~3.9
~4.6
~50% ~50% ~49%
~50% ~50%
~51%
Regulated Unregulated
Democracy, Demography and Development as a driver to increase profitability

33
Enel SpA
Investor Relations
2012-2016 strategic update International operations
Group Strategy 2012-2016 Plan
Strengthen market position
Increase sales to Centrel area
Strengthen market position
Efficiency programmes
Slovakia
Russia
Margin growth through capacity additions and efficiencies
● Organic growth and margins protection
● Strict financial discipline in investment decisions
● Best practice sharing, Zenith plan on-going

34
Enel SpA
Investor Relations
2012-2016 strategic update International operations Divisional targets (€bn)
International operations confirmed as a growth pillar for the Group
Group Strategy 2012-2016 Plan
~4.0
Russia
Slovakia
Other2
2012 2014 2016
EBITDA
~0.8
~0.5
~0.3
~0.9
~0.6
~0.3
~1.2
~0.8
~0.4
~1.6
~1.8
~2.4
2012-2016
Maintenance: 45%
Growth: 55%
1. Net of connection fees 2. Romania, France & Belgium and Enel Investment Holding
55%
30%
15%
Capex1
35
Enel SpA
Investor Relations
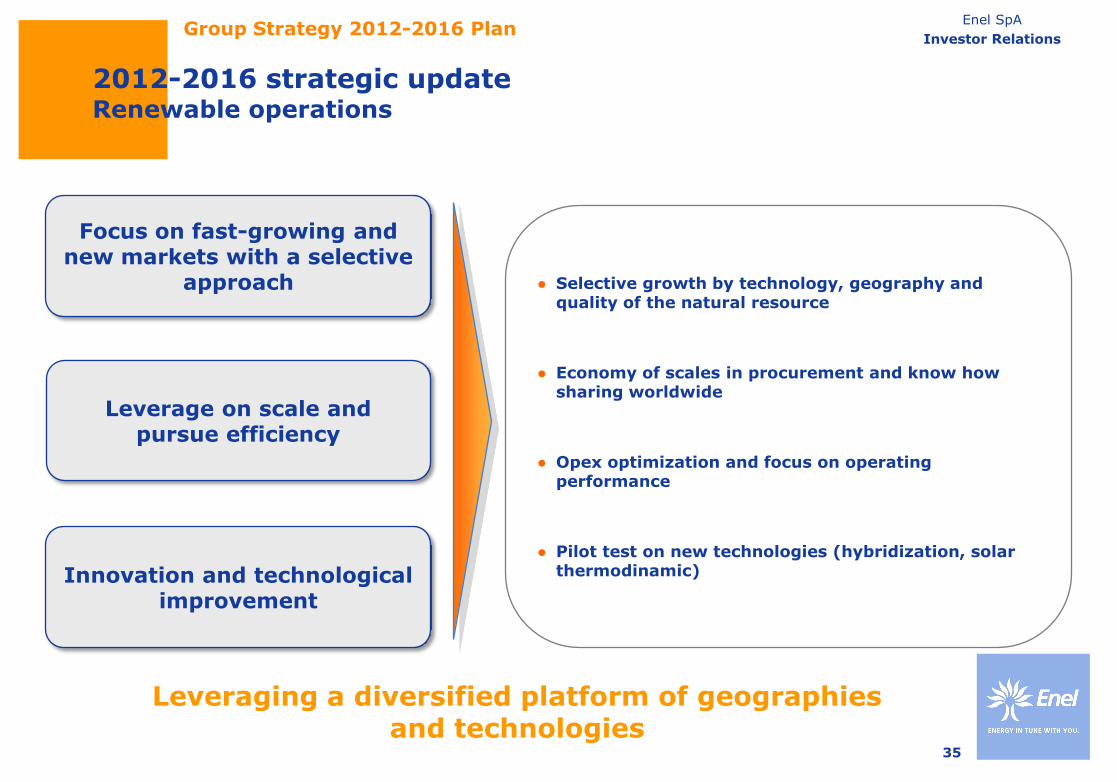
2012-2016 strategic update Renewable operations
Group Strategy 2012-2016 Plan
Leveraging a diversified platform of geographies and technologies
● Selective growth by technology, geography and quality of the natural resource
● Economy of scales in procurement and know how sharing worldwide
● Opex optimization and focus on operating performance
● Pilot test on new technologies (hybridization, solar thermodinamic)
Leverage on scale and pursue efficiency
Focus on fast-growing and new markets with a selective
approach
Innovation and technological improvement

36
Enel SpA
Investor Relations
2012-2016 strategic update Renewable operations Targets (€bn)
Group Strategy 2012-2016 Plan
6.1
Capex
2012 2014 2016
EBITDA
~1.7
~2.2
~2.6
2012-2016
Maintenance: ~10%
Growth: ~90%
Steady growing profitability levels
Latam
North America
Italy
Rest of Europe
Iberia
29%
4%
11% 34%
22%

37
Enel SpA
Investor Relations
Managerial actions
Group Strategy 2012-2016 Plan

38
Enel SpA
Investor Relations
Managerial actions Mature markets
Group Strategy 2012-2016 Plan
• Gas sourcing diversification and flexibility
o Upstream gas
o LNG midstream (Porto Empedocle)
• Generation portfolio flexibility and competitiveness
o New pumping storage opportunities in Spain
o Backup capacity & efficiency projects in Italy
• Smart grids and services for final customer o Smart meters and electric vehicles
• Margin hedging through solid customer base
Upward vertical integration
Generation
Distribution
Sales
Iberia
Italy
Maintaining leadership in core energy markets

39
Enel SpA
Investor Relations
Managerial actions Growth markets
Group Strategy 2012-2016 Plan
Russia and East. Europe
Latin America
Solid growth in attractive business and geographies
Total capacity increase ca. +6.6GW by 2016
Worldwide Renewables
● New capacity added: ~ 4.5 GW
• New capacity added: ~ 1.1 GW
• Russia: revamping initiatives
• Slovakia: ca. + 1 GW new nuclear capacity
• Romania: Efficiency improvements (smart meters)

40
Enel SpA
Investor Relations Group Strategy 2012-2016 Plan
2011-15 Old Plan
~31
~27
2012-2016 New Plan
A more focused and effective capex programme
1. Net of connection fees
Growth
Maintenance
~62%
~38%
~52%
~48%
Capex optimization
Asset allocation
Efficiencies
● -3€bn: lower capex in Italy&Spain
(mainly in liberalized business)
● -1€bn: Optima Capex Project
Managerial actions Efficiencies: cash flow optimization
Focus on asset allocation (€bn)1
41
Enel SpA
Investor Relations
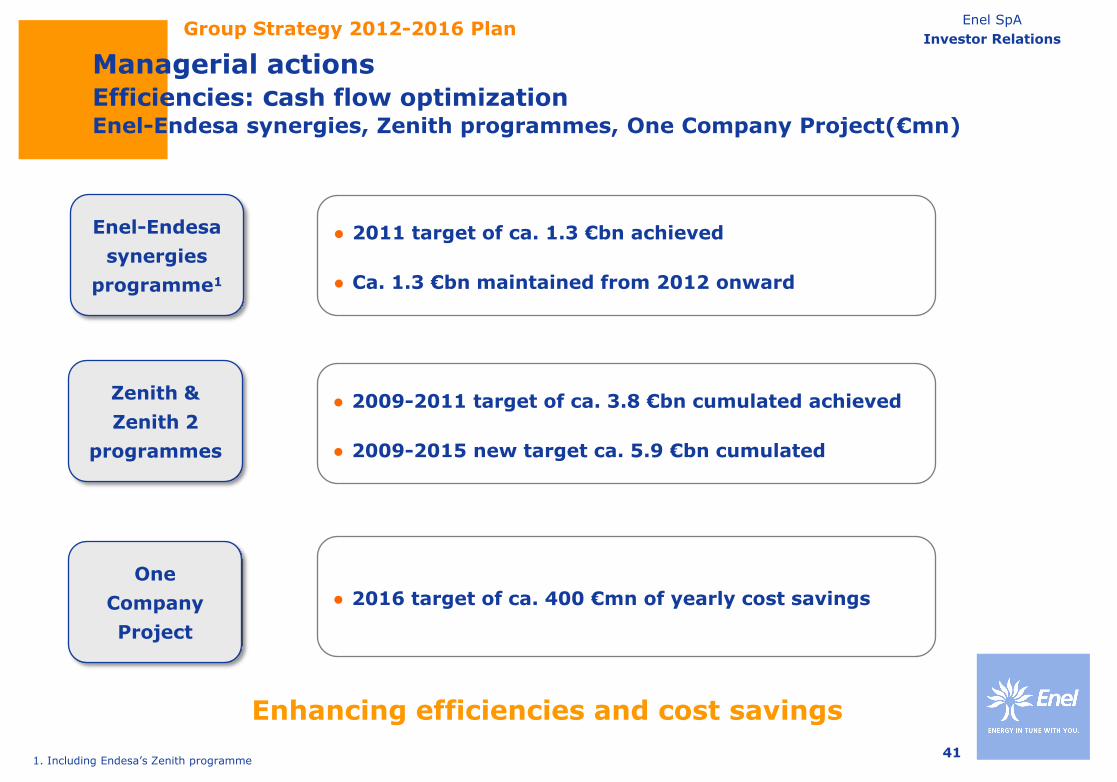
Managerial actions Efficiencies: cash flow optimization Enel-Endesa synergies, Zenith programmes, One Company Project(€mn)
Group Strategy 2012-2016 Plan
Enel-Endesa
synergies
programme1
Zenith &
Zenith 2
programmes
One
Company
Project
● 2011 target of ca. 1.3 €bn achieved
● Ca. 1.3 €bn maintained from 2012 onward
● 2009-2011 target of ca. 3.8 €bn cumulated achieved
● 2009-2015 new target ca. 5.9 €bn cumulated
● 2016 target of ca. 400 €mn of yearly cost savings
Enhancing efficiencies and cost savings
1. Including Endesa’s Zenith programme

42
Enel SpA
Investor Relations
Financial targets
Group Strategy 2012-2016 Plan

43
Enel SpA
Investor Relations
Financial targets Dividends
Balance sheet strength, flexibility and growth
New dividend policy
Cumulated cash out new Plan 2012-2016
~ 11 €bn
Group Strategy 2012-2016 Plan
~ 7.5 €bn
~ 3.5 €bn
Enel‟s shareholders
Minorities
Dividend pay-out policies
Other public subsidiaries‟ dividend payments expected to be reduced by 30-40% on
average vs 2011
Other dividend payments
Enel
Endesa2
EGP2
Based on
2011 results
Based on
2012-16 results
60%(1)
1. Balance equal to 0.16 euro per share to be paid in June 2012 2. Dividends to be paid once a year
40%(2) as a floor
30%
30%
30%
To be decided year
on year

44
Enel SpA
Investor Relations
Financial targets 2012-2016 cumulated cash flow available to net debt reduction (€bn)
Cash flow
available
from operations
~14
Capex
programme2
Dividends3
~66
Cash flow from
operations1
~11
~1.8
Net financial
charges
~27
Financial discipline confirmed as a priority
Group Strategy 2012-2016 Plan
Disposals
~14 ~14.5
Total cash flow
available
~1.3
Minority
stakes
buy-out &
other
1. Post-tax 2. Net of connection fees equal to about 3.4 €bn and including capitalized financial expenses 3. Ca. 7.5 €bn to Enel’s shareholders and ca. 3.5 €bn to minorities

45
Enel SpA
Investor Relations
Overall financial targets (€bn)
• EBITDA1
• Ordinary net income
• Net debt
2012
• ~ 16.5
• ~ 3.4
• ~ 43
(40% dividend pay-out)
2014
• ~ 17.0
• ~ 3.8
• ~ 39
2016
• ~ 19.0
• ~ 5.0
• ~ 30
Group Strategy 2012-2016 Plan
1. Recurring Ebitda, excluding non-cash items and capital gains

Enel SpA
Investor Relations
Annexes

47
Enel SpA
Investor Relations 2011 results - Operational annexes
Group production mix
CCGT
Oil & gas Coal
Nuclear
Other renewables
Hydro
293.9 290.2
+1.3%
79.0 81.6
-3.2%
214.9 208.6
+3.0%
Italy
FY10 FY11
FY10 FY11
FY10 FY11
Production mix (TWh)
20.7%
9.9%
21.7%
25.3%
2.7%
19.7%
2.8%
21.6%
34.1%
34.4%
7.1%
15.6%
13.2%
25.2%
14.2%
3.9%
27.9%
12.9%
16.2%
29.3%
13.4%
4.3%
23.9%
1.5%
21.7%
41.0%
28.0%
7.8%
17.2%
14.1%
25.0%
22.4%
2.9%
18.4%
International

48
Enel SpA
Investor Relations 2011 results - Operational annexes
MW Hydro Nuclear Coal Oil & gas ST/OCGT
Iberia
Centrel
Italy
SEE
Americas
TOTAL
CCGT
Russia
TOTAL Other ren.
-
5,401
1,445
1,760
9
654(4)
800
4,668
13,647
4,684
2,329
14
9,591
30,265
-
3,526
1,818
-
-
5,344
6,804
5,455
845
488
17,215
12,022
4,936(3)
400
-
2,492
24,454
5,964
4,746(2)
-
-
3,880
15,390
- - - 3,623 4,604 800
39,882
25,107
668
17,251
9,027
97,336
FY2011 Group total net installed capacity1: breakdown by source and location
1. Including Group renewable capacity 2. Including 123 MW of installed capacity in Morocco
3. Including 1,013 MW of installed capacity in Ireland 4. Including 166 MW other renewable capacity in France

49
Enel SpA
Investor Relations 2011 results - Operational annexes
2,624
20,415
Other ren.
6,136
3,579
25
768(4)
2,041
12,549
GWh Hydro
22,144
6,311
3,791
25
37,952
70,223
Nuclear
-
25,177
14,340
-
-
39,517
Coal
32,423
26,728
2,259
2,085
86,142
Oil & gas ST/OCGT
1,148
9,923(3)
-
-
5,638
38,010
Iberia
Centrel
Italy
SEE
Americas
TOTAL
CCGT
17,137
7,939(2)
-
-
21,237
47,421
1. Including Group renewable capacity 2. Including 745 GWh of net production in Morocco
- - - 20,023 21,301 Russia 1,108
TOTAL
78,988
79,657
3,417
68,953
42,432
293,862
3. Including 70 GWh of net production in Ireland 4. Including 245 GWh of net production in France
FY2011 Group total net production1: breakdown by source and location

50
Enel SpA
Investor Relations 2011 results - Operational annexes
Geothermal MW Wind Other TOTAL Hydro
605
722
-
47
1,525
701
313
2,539 769
1,272
1,664
3,541
64
121
45
230
Iberia & Latam
Italy & Europe
North America
TOTAL
3,583
2,486
1,010
7,079
FY2011 renewables net installed capacity: breakdown by source and location

51
Enel SpA
Investor Relations 2011 results - Operational annexes
Hydro Wind Other TOTAL Geothermal GWh
Iberia & Latam
Italy & Europe
North America
TOTAL
FY2011 renewables net production: breakdown by source and location
1,409
5,300
-
268
5,689
3,339
1,069
10,097 5,568
1,572
3,161
6,142
22
476
175
673
12,583
6,976
2,921
22,480

52
Enel SpA
Investor Relations 2011 results - Financial annexes
49%
42%
9%
FY2011 EBITDA
17,717 €mn
Unregulated
Regulated
EGP
Forward sales and
hedging procurement contracts to protect
margin
Stability and high
visibility
Group EBITDA: regulated/unregulated activities

53
Enel SpA
Investor Relations 2011 results - Financial annexes
1. Including Engineering and Innovation division and and Other & Elisions
+145
66
+30
+115 211
FY10 Import FY11 Other
EBITDA evolution - Services & Holding1 (€mn)

54
Enel SpA
Investor Relations 2011 results - Financial annexes
-88
FY10 Regulated market
FY11 Free market
483
+166
561
+16.1%
EBITDA evolution: Market Italy (€mn)

55
Enel SpA
Investor Relations
<12m 2013 2015 2016 After 2016
Endesa
Enel Group (excluding Endesa)
9,672
3,866 5,673
6,061
26,529
6 years and 7 month Average cost of gross debt: 4.9%
2014
6,574
2011 results - Financial annexes
Enel‟s long-term debt maturity profile (€mn)
Bonds Bank loans and others
2,473
7,199
5,413
4,259
1,796
2,070
1,192
4,481
688
5,373
841
5,733
3,010
23,519

56
Enel SpA
Investor Relations
Committed credit lines
Cash and cash equivalents
Total
Uncommitted lines
Commercial paper
Total liquidity
Amount Available Outstanding
25,505
-
25,505
2,745
9,309
37,559
1. Of which 13€bn with maturity after 2014
9,649
(7,015)
2,634
798
3,211
6,643
15,856
7,015
22,871
1,947
6,098
30,916
(1)
2011 results - Financial annexes
Enel Group liquidity analysis (€mn)

57
Enel SpA
Investor Relations
• Average debt maturity: 6 years and 7 months
• Average cost of gross debt2: 4.9%
• (Fixed+hedged)/Total gross long-term debt: 78%
• (Fixed+hedged)/Total net debt: 96%
• Rating: Standard&Poor‟s = A-/A-2 Negative credit watch
Moody‟s = A3/P-2 Negative outlook
Fitch = A-/F2 Stable outlook
1. As of December 31st, 2011 2. Average cost of net debt equal to 5.9% 3. Including current maturities of long-term debt 4. Including factoring and other current receivables
December 31, 2010
% €mn December 31,
2011
49,873
11,208
(16,157)
44,924
Long-term Short-term3
Cash4
Net debt
45,127
14,471
(14,969)
44,629
-9.5
+29.1
-7.4
-0.7
2011 results - Financial annexes
Debt structure1

58
Enel SpA
Investor Relations
€mn
Bank loans – maturities > 12m Bonds – maturities > 12m Preference shares > 12m Other loans – maturities > 12m Financial receivables – maturities > 12m Total net LT debt - maturities > 12m Bank loans – maturities < 12m Bonds – maturities < 12m Preference shares < 12m Other loans – maturities < 12m Financial receivables – maturities < 12m Total net LT debt - maturities < 12m Other ST bank debt Commercial paper Cash Collateral and other derivatives payables Other ST financial debt ST debt Factoring receivables Cash Collateral and other derivatives receivables Other ST financial receivables Cash at banks and marketable securities Total net ST debt (incl. current maturities) Net financial debt
Enel Group (excluding Endesa)
12.31.2010
12.31.2011
12.31.2010
12.31.2011
Group - Total
12.31.2011
Endesa
1. As of December 31, 2011
10,778 28,655
- 257
-1,439
38,251
465 1,138
- 27
-25 1,605
211
5,343 343 129
6,026
-319 -671 -415
-3,427 2,799
41,050
8,333
32,445 -
398 -2,499
38,677
4,199 1,075
- 139
-110 5,303
826
2,016 650
4 3,496
-370
-1,076 -592
-4,313 2,448
41,125
4,806 5,746 1,474
724 -1,128
11,622
484 716
- 169
-9,265 -7,896
70
2,062 -
51 2,183
-
-47 -156
-1,832 -7,748
3,874
2011 results - Financial annexes
Enel‟s group financial debt evolution1
1,585 5,016
180 746
-1,077
6,450
2,695 1,398
- 166
-5,522 -1,263
62
1,188 -
53 1,303
- -
-232 -2,754 -2,946
3,504
9,918
37,461 180
1,144 -3,576
45,127
6,894 2,473
- 305
-5,632 4,040
888
3,204 650 57
4,799
-370 -1,076
-824 -7,067
-498
44,629

59
Enel SpA
Investor Relations
Enel SpA Slovenské €mn EFI2 Other Total Endesa EIH2 EP2 ED2
Bonds
Bank loans
Preference shares
Other loans
Commercial paper
Other
Total
1. As of December 31st, 2011
2. EFI: Enel Financial International; EIH: Enel Investments Holding; EP: Enel Produzione; ED: Enel Distribuzione
15,332
4,363
-
(159)
-
(1,170)
18,366
2011 results - Financial annexes
Enel‟s group financial debt by subsidiary1
39,934
16,812
180
(7,759)
3,204
(7,742)
44,629
223
1,748
-
(426)
-
(2,338)
(793)
-
2,657
-
(678)
-
(92)
1,887
-
627
-
(241)
-
(110)
276
-
627
-
(568)
-
(26)
33
297
-
-
-
-
(130)
167
6,414
4,280
180
(5,687)
1,188
(2,871)
3,504
17,668
2,510
-
-
2,016
(1,005)
21,189

60
Enel SpA
Investor Relations
50.944.9 44.6
2009 2010 2011
2009 2010 2011
7:1
Average residual maturity (years:months)
6:8
Net financial debt (€bn)
6:7
2011 results - Financial annexes
Enel‟s group financial debt
4.6% 4.6% 4.9%
2009 2010 2011
5.0%
5.5% 5.9%
2009 2010 2011
Fixed + Hedged /Total net debt
Fixed + Hedged /Total gross long term debt
Average cost of net debt Average cost of gross debt
80% 93% 96%
2009 2010 2011
71% 79% 78%
2009 2010 2011

61
Enel SpA
Investor Relations
1. Including preference shares
€mn
Bank loans Bonds Other Total
<12m
Enel Group (excluding Endesa)
2013 2014 After 2016
€mn
Bank loans Bonds Other1
Total
<12m
Endesa
2013 2014 After 2016
2015
2015
2016
2016
417 1,600
53 2,070
4,199 1,075
139 5,413
2,327 2,102
52 4,481
1,492 3,837
44 5,373
2,915 20,402
202 23,519
1,182 4,504
47 5,733
2011 results - Financial annexes
Enel‟s long-term debt maturity profile (€mn)
319 1,182
295 1,796
2,695 1,398
166 4,259
370 723 99
1,192
207 422 59
688
456 2,138
416 3,010
233 551 57
841

62
Enel SpA
Investor Relations
1. As of December 31st, 2011
2. Including 1,420€mn relating to a committed line pertaining to Slovenske Elektrarne
60M credit facility for Endesa acquisition
2009 credit facility for Endesa acquisition (2014)
2009 credit facility for Endesa acquisition (2016)
Other committed credit lines2
Total committed credit lines
Other short-term bank debt – uncommitted lines
Total credit lines
Commercial paper
Total credit lines + CP
Cash and cash equivalents
Total liquidity
Amount Available Outstanding
1,933
1,359
617
14,359
18,268
1,223
19,491
6,000
25,491
-
25,491
1,933
1,359
617
3,908
7,817
778
8,595
2,021
10,616
(4,261)
6,355
-
-
-
10,451
10,451
445
10,896
3,979
14,875
4,261
19,136
2011 results - Financial annexes
Enel Group liquidity analysis excluding Endesa (€mn)1

63
Enel SpA
Investor Relations
Total committed credit lines
Other short-term bank debt – uncommitted lines
Total credit lines
Commercial paper issued by the Endesa Group
Total credit lines + CP
Cash and cash equivalents
Total liquidity
Amount Available Outstanding
1. As of December 31st, 2011
7,237
1,522
8,759
3,309
12,068
-
12,068
2011 results - Financial annexes
Endesa liquidity analysis (€mn)1
1,832
20
1,852
1,190
3,042
(2,754)
288
5,405
1,502
6,907
2,119
9,026
2,754
11,780

64
Enel SpA
Investor Relations
648 432
62 90
92 81
FY10 FY11
+5.6%
7,090
Iberia & Latam
Market
I&N
S&H
G&EM
International
EGP
1. Continuing operations, gross of connection fees
7,484
2011 results - Financial annexes
Capex by business area (€mn)1
2,866 2,491
1,557
1,147 1,383
1,210 1,450
1,065

65
Enel SpA
Investor Relations
FY10 FY11 % €mn
44,924
53,866
98,790
44,629
54,440
99,069
-0.7
+1.1
+0.3
Net financial debt
Shareholders‟ equity
Net capital employed
2011 results - Financial annexes
Balance sheet

66
Enel SpA
Investor Relations
% €mn
Revenues
EBITDA
EBIT
Capex
Headcount
+32.0
-8.8
-13.2
-33.3
-4.0
FY11
23,146
2,182
1,590
432
6,334
FY10
17,540
2,392
1,832
648
6,601
2011 results - Financial annexes
Generation & Energy Management - Italy

67
Enel SpA
Investor Relations
Revenues
EBITDA
EBIT
Capex
Headcount
-5.2
+16.1
+143.1
+45.2
-2.0
17,731
561
141
90
3,745
18,697
483
58
62
3,823
% €mn FY11 FY10
2011 results - Financial annexes
Market - Italy

68
Enel SpA
Investor Relations
% €mn
Revenues
EBITDA
EBIT
Capex
Headcount
+0.4
+12.4
+15.0
+20.6
-1.0
7,460
4,285
3,347
1,383
18,951
7,427
3,813
2,911
1,147
19,152
FY11 FY10
2011 results - Financial annexes
Infrastructure & Network - Italy

69
Enel SpA
Investor Relations
Revenues
EBITDA
EBIT
Capex
Headcount
+21.3
+8.0
+17.6
+19.8
-7.4
% €mn
7,715
1,642
1,062
1,450
13,779
6,360
1,520
903
1,210
14,876
FY11 FY10
2011 results - Financial annexes
International

70
Enel SpA
Investor Relations
Revenues
EBITDA
EBIT
Capex
Headcount
+4.4
-8.2
-12.6
-13.1
-7.5
% €mn
32,647
7,251
4,057
2,491
22,877
31,263
7,896
4,643
2,866
24,731
FY11 FY10
2011 results - Financial annexes
Iberia & Latam

71
Enel SpA
Investor Relations
Revenues
EBITDA
EBIT
Capex
Headcount
+16.5
+21.0
+11.8
+46.2
+9.3
% €mn
2,539
1,585
1,080
1,557
3,229
2,179
1,310
966
1,065
2,955
FY11 FY10
2011 results - Financial annexes
Enel Green Power

72
Enel SpA
Investor Relations
FY11 % €mn
Revenues
Holding
Services
Engineering & Innovation
EBITDA2
Holding
Services
Engineering & Innovation
2,515
762
1,356
397
211
(38)
237
12
FY10
2,420
679
1,133
608
66
(68)
136
14
+3.9
+12.2
+19.7
-34.7
+219.7
-
+74.3
-14.3
1. Including the Engineering & Innovation division 2. Including Other & Elisions of -16€mn in FY10 and 0€mn in FY11
2011 results - Financial annexes
Services & Holding1

73
Enel SpA
Investor Relations
EBIT2
Holding
Services
Engineering & Innovation
Capex
Holding
Services & other
Engineering & Innovation
Headcount
Holding
Services & other
Engineering & Innovation
89
(52)
132
9
81
13
64
4
6,445
873
4,245
1,327
-
-
+407.7
-10.0
-12.0
+85.7
-20.0
-20.0
+4.4
+8.7
+5.3
-0.9
(55)
(75)
26
10
92
7
80
5
6,175
803
4,033
1,339
FY11 % €mn FY10
1. Including the Engineering & Innovation division
2. Including Other & Elisions of -16€mn in FY10 and 0€mn in FY11
2011 results - Financial annexes
Services & Holding1 - Continued

74
Enel SpA
Investor Relations
FY10 FY11
+1.0%
Iberia & Latam
Market I&N
S&H1
G&EM
International
EGP
+143.1%
+17.6%
-13.2%
+11.8%
-12.6%
+15.0%
n.m.
1. Including Engineering and Innovation division and Other & Elisions
2011 results - Financial annexes
EBIT by business area (€mn)
58 141
966 89
11,258 11,366
4,643 4,057
2,911 3,347
1,832 1,590
903 1,062
1,080
-55

75
Enel SpA
Investor Relations
Disclaimer
This presentation contains certain statements that are neither reported financial results nor other historical information (“forward-looking statements”). These forward-looking statements are based on Enel S.p.A.‟s current expectations and projections about future events. Because these forward-looking statements are subject to risks and uncertainties, actual future results may differ materially from those expressed in or implied by these statements due to any number of different factors, many of which are beyond the ability of Enel S.p.A. to control or estimate precisely, including changes in the regulatory environment, future market developments, fluctuations in the price and availability of fuel and other risks. You are cautioned not to place undue reliance on the forward-looking statements contained herein, which are made only as of the date of this presentation. Enel S.p.A. does not undertake any obligation to publicly release any revisions to any forward-looking statements to reflect events or circumstances after the date of this presentation.
Pursuant to art. 154-BIS, par. 2, of the Unified Financial Act of February 24, 1998, the executive in charge of preparing the corporate accounting documents at Enel, Luigi Ferraris, declares that the accounting information contained herein correspond to document results, books and accounting records.

76
Enel SpA
Investor Relations
Contact us
Investor Relations Team ([email protected])
Visit our website at:
www.enel.com (Investor Relations)
• Luca Torchia (Head of IR)
• Pedro Cañamero (Equity IR)
• Elisabetta Ghezzi (Fixed income IR)
+39 06 83053437
+39 06 83055292
+39 06 83052708