Embed Size (px)
Citation preview

2016 Defined Contribution Trends
CALLAN INVESTMENTS INSTITUTE
Survey

2016 Defined Contribution Trends 1Knowledge. Experience. Integrity.
Table of Contents
Key Findings 2
Respondent Characteristics 4
Plan Structure: Bundled vs. Unbundled Arrangements 6
ERISA Section 404(c) Compliance 7
Investment Policy Statement 8
Fee Policy and Use of Investment Consultants 9
DC Plan Management and Measurement 10
Fiduciary Positioning 11
Areas of Focus 12
Decision Makers 13
Company Match 14
Automatic Features 15
Roth Features 18
Company Stock 19
Investments/Target Date Funds 22
Re-enrollment 34
Investment Advice 35
Post-Employment Assets 38
Plan Leakage 39
Retirement Income Solutions 40
Fees 42
Participant Communication 50

2016 Defined Contribution Trends 2Knowledge. Experience. Integrity.
Key Findings
Callan fielded the 2016 Defined Contribution (DC) Trends Survey in the fall of 2015. Survey results include responses from 144 plan sponsors, primarily large and mega 401(k) plans. We highlight key themes and findings from 2015 and expectations for 2016.
of DC plan sponsors took steps within the past 12 months to ensure 404(c)compliance
83%
See page 7 for additional details
CONTRIBUTIONRATE
COSTEFFECTIVENESS
3 most important factors in measuring plan success
Department of Labor’s 2011-2012
fee disclosure requirements
2006 Pension Protection Act
It’s a tie for plan sponsors’ top ranking event influencing the management of DC plans
1 in 5 plan sponsors
engaged in an asset re-enrollment
62% have Roth-designated
accounts
4/5plans with auto enroll
also auto escalate
61%have auto enrollment
Happy 10th anniversary to the PPA!
say communicating about diversification is the top step taken
73%
Plan sponsors are taking a closer look at company stock, likely a direct result of the U.S. Supreme Court’s 2014 decision in Fifth Third Bancorp vs. Dudenhoeffer.
Average number of actions taken to limit liability around company stock 3
Most important step to improving fiduciary position:
Updating or reviewing the investment policy statement
What influence has the PPA had?
See page 11 for additional details See page 10 for additional details
See page 20 for additional details
PARTICIPATION

2016 Defined Contribution Trends 3Knowledge. Experience. Integrity.
Key Findings
97% use a QDIA as the default investment
fund
Target date funds continue to be the most prevalent default choice at 86%Plans offering their record-
keeper’s proprietary target
date fund declined from 70%
in 2011 to 32% in 2015
Fee Review: the second most important step to improving a DC plan’s fiduciary position
45%have a written fee payment
policy in place
53% are likely to rebate
revenue sharing
3/4benchmark fees as a part
of fee calculations
1 COMPLIANCE
2 FUND/MANAGER DUE DILIGENCE
3 PLAN FEES
Top 2016 Priorities
88%of plan sponsors offer investment guidance/
advisory services
59%with a money market fund are still evaluating actions to take
given SEC regulations
15%11%
More plan sponsors report increasing the number of funds (15%) than decreasing the number of funds (11%) in 2015
Incr
ease
#
of fu
nds
Decrease
# of funds
of plan sponsors evaluated the suitability of their glide path in 2015
plan to evaluate theirs in 2016
22%
30%
See page 35 for additional details See page 30 for additional details
See page 31 for additional details
See page 12 for additional detailsSee pages 22 and 23 for additional details
See page 24 for additional details

2016 Defined Contribution Trends 4Knowledge. Experience. Integrity.
$501 mm to $1 bn 10.6%
$201 to $500 mm 18.3%
$101 to $200 mm 10.6%
$51 to $100 mm 7.0%
$20 to $50 mm 4.9%
401(k) 71.5%
457 7.6%
Other 0.7%Profit sharing 2.1%401(a) 6.9%
403(b) 11.1%
>100,000 7.7%
50,001 to 100,000 6.3%
10,001 to 50,000 26.8%
5,001 to 10,000 14.1%
1,001 to 5,000 24.6%
501 to 1,000 7.7%
100 to 500 8.5%
<100 4.2% <$20 million 5.6%
>$1 billion 43.0%
Callan conducted the 2016 Defined Contribution (DC) Trends Survey online in September and October of 2015. The survey incorporates responses from 144 plan spon-sors, including both Callan clients and other organizations.
The majority of respondents offer a 401(k) plan (71.5%) as the primary DC plan. Another 11.1% offer 403(b) plans and 7.6% sponsor 457 plans.
Over 80% of plans in the survey have more than $100 million in assets; more than two-fifths (43.0%) are “mega plans” with greater than $1 billion in assets. The proportion of mega plans is modestly lower than last year’s DC Trends Survey (46.2%).
Respondent Characteristics
What is the primary DC plan that you offer?
What is the size of the primary DC plan?
How many participants are in the primary DC plan?
Note: Charts may not sum to 100% due to rounding.

2016 Defined Contribution Trends 5Knowledge. Experience. Integrity.
Two-thirds of the DC plan sponsors surveyed also offer a defined benefit (DB) plan, although over a fourth of respon-dents indicate their DB plan is frozen.
Respondents span a wide range of industries. The top indus-tries include government (14%), energy/utilities (13%), health care (9%), financial services (9%), manufacturing (8%), and not-for-profit (8%).
Respondent Characteristics
Does your firm/agency offer a defined benefit plan?
No32.6%
Yes39.0%
Yes, but it is frozen28.4%
In what industry is your firm?
Government 14.1%
Energy/Utilities 12.7%
Health Care 9.2%
Financial Services 8.5%
Manufacturing 7.7%
Not for Profit 7.7%
Insurance 6.3%
Technology 6.3%
Retail 5.6%
Professional Services 4.9%
Construction and Mining 4.2%
Other 4.2%Education 2.8%Entertainment/Media 2.1%Transport 1.4%Additional categories:Aerospace/Defense 0.7%Automotive 0.7%Telecom 0.7%

2016 Defined Contribution Trends 6Knowledge. Experience. Integrity.
Only 14.2% of plans are fully bundled in 2015, a smaller pro-portion than in prior years. Partially bundled plans increased from 34.8% in 2014 to 39.0% in 2015. Fully unbundled plans, including those using the same vendor for multiple functions, are up modestly (41.8% to 44.0%).
Similar to last year, few mega plans (assets greater than $1 billion) have a fully bundled structure (1.6%) while more than half (59.0%) are fully unbundled. One-third of mega plans (34.4%) use all separate vendors, and one-quarter (24.6%) are fully unbundled but use the same vendor for multiple functions. One-fourth of mid-sized plans ($50–$200 million in assets) use a fully bundled structure.
Plan Structure: Bundled vs. Unbundled Arrangements
Describe your plan structure
Fully bundled
Fully unbundled but use the same vendor for multiple functions
Use multiple recordkeepers and/or custodians
Partially bundled
Fully unbundled
16.3%2.8%
27.7%
14.2%
39.0%
0%
20%
40%
60%
80%
100%
201520142013201220112010
Fully bundled: The recordkeeper and trustee are the same, and all of the investment funds are managed by the recordkeeper.
Partially bundled: The recordkeeper and trustee are the same, but not all of the investment funds are managed by the recordkeeper.
Fully unbundled: The recordkeeper and trustee are independent, and none of the investment funds are managed by the recordkeeper.

2016 Defined Contribution Trends 7Knowledge. Experience. Integrity.
1.0%
OtherDon't knowNoneAttorney review Consultant review
Plan sponsor review
6.9%9.9%
40.6%42.6%
61.4%
14.1%4.7%
81.3%
0%
20%
40%
60%
80%
100%
2015201420132012201120102009
Don’t know
Yes
No
Most plans are designed to be in compliance with ERISA sec-tion 404(c) (81.3%), up slightly from 77.9% in 2014. Relative to 2014, more plan sponsors do not know if their plan is com-pliant (14.1% up from 9.3%).
Although 457 plans are not covered by ERISA, 18.2% of 457 respondents are 404(c) compliant, meaning they seek to adhere to these standards even though it is not required.
Most DC plan sponsors (83.2%) took steps within the past 12 months to ensure compliance. More than half (61.4%) personally reviewed compliance. Many engaged third parties to review 404(c) compliance, such as their attorney (40.6%) and their consultant (42.6%). Approximately 7% of respon-dents did not know what steps had been taken to ensure compliance, down from 12.0% in 2014.
ERISA Section 404(c) Compliance
Is your DC plan designed to be ERISA section 404(c) compliant?
What steps have you taken in the past 12 months to ensure that your plan is ERISA section 404(c) compliant?*
*Multiple responses were allowed.
83.2% took stepsto ensure compliance
2016 Defined Contribution Trends 8Knowledge. Experience. Integrity.
Within the past 3years 12.6%
Don’t know 0.8%More than 3 years ago 2.4%
2009 2010 2011 2012 2014
7.0%2.8%
90.1%
20150%
20%
40%
60%
80%
100%
2013
Within the past 12 months84.3%
Don’t know
Yes
No
63%Updated IPS in past 12 months
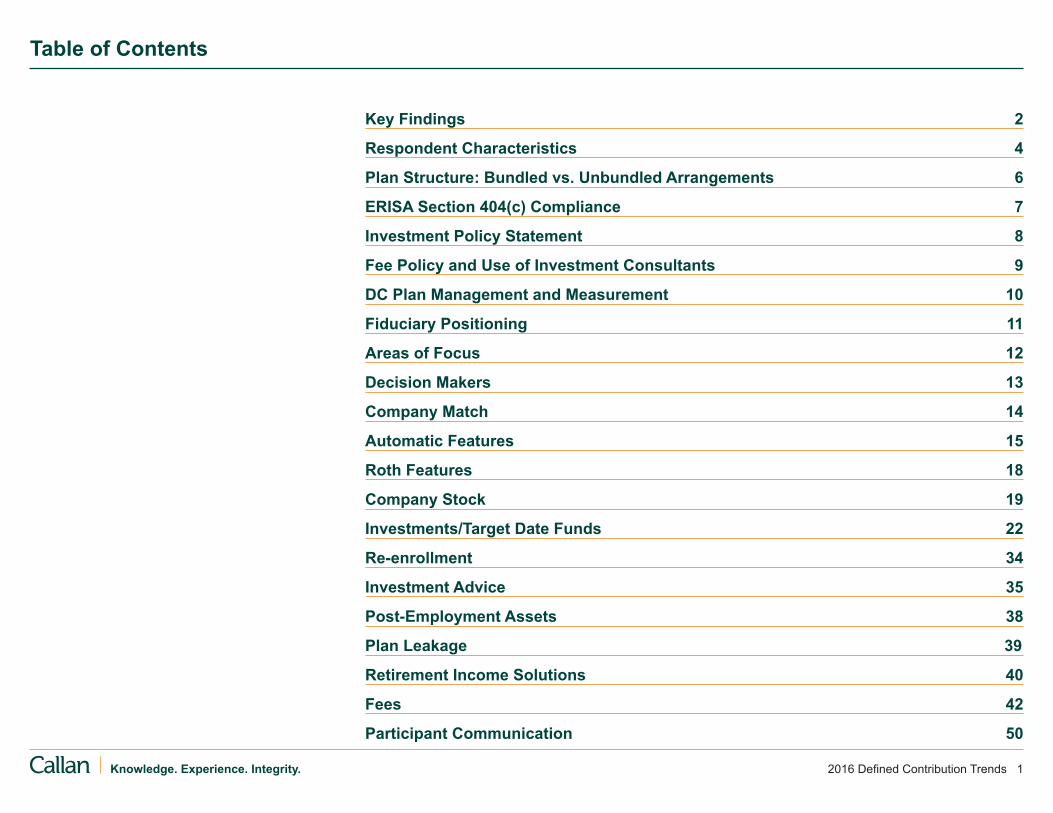
Most DC plans maintained an investment policy statement (IPS) in 2015 (90.1%), representing an increase from 2014 (84.7%). The percent of respondents that do not know if they maintain an IPS fell to 2.8%, from 4.2% in 2014. About a fifth of 403(b) and 457 plans do not maintain an IPS.
More than 84% of plan sponsors indicate having reviewed their plan’s IPS in the past year. Of those, 63% made updates to the IPS within the past year. Best practice dic-tates a review of the IPS on a regular basis—at least once per year—particularly if changes are made to the DC plan.
Investment Policy Statement
Do you maintain an investment policy statement for the DC plan?
When did you last review and/or update the investment policy statement?

2016 Defined Contribution Trends 9Knowledge. Experience. Integrity.
Don’t know
No
Yes
Yes, as part of the investment policy statement
Yes, as a separate document
Don’t know
No
Other
No, but plan to in the next 12 months
10.2%2.2%
0.7%
42.3%
16.9%
83.1%
0%
20%
40%
60%
80%
100%
201520142013201220112010
201326.3%
18.2%
0%
20%
40%
60%
80%
100%
20152014201320122011
Approximately 45% of plan sponsors have a written, plan-fee payment policy in place, either as part of their invest-ment policy statement (26.3%) or as a separate document (18.2%). This is the highest rate recorded in our survey.
The percent of plan sponsors that engage an investment consultant rose from 80.0% in 2014 to 83.1% in 2015.
Fee Policy and Use of Investment Consultants
Do you have a written, plan-fee payment policy?
Do you use an investment consultant?
2016 Defined Contribution Trends 10Knowledge. Experience. Integrity.
Investment Performance 9.6Department of Labor’s 2011- 5.12012 fee disclosure requirements
2006 Pension Protection Act 5.1
2008-2009 market collapse 4.3
2013 EBSA’s Tips for ERISA 4.2fiduciaries in monitoring and evaluating target date funds
2006 Schlichter, Bogard, and 3.6Denton fee lawsuits
Supreme Court’s 2014 decision 2.8invalidating presumption of prudence as a stock-drop lawsuit defense
U.S. Treasury initiatives to facilitate 2.6use of lifetime income solutions in DC plans
Other 2.0
Investment Performance 9.6Contribution/savings rate 4.4
Participation rate/plan usage 4.4
Cost effectiveness 4.0
Employee satisfaction 3.9
Investment performance 3.9
Investment diversification 3.8
Benchmark against other plans 3.6
Retirement income adequacy 3.6
Ability to attract/retain employees 3.5
Mos
t im
porta
nt
Weighted Average Score (7=Most important) Weighted Average Score (5=Most important)
Additional categories: Don’t measure (2.6) Don’t know (1.3)
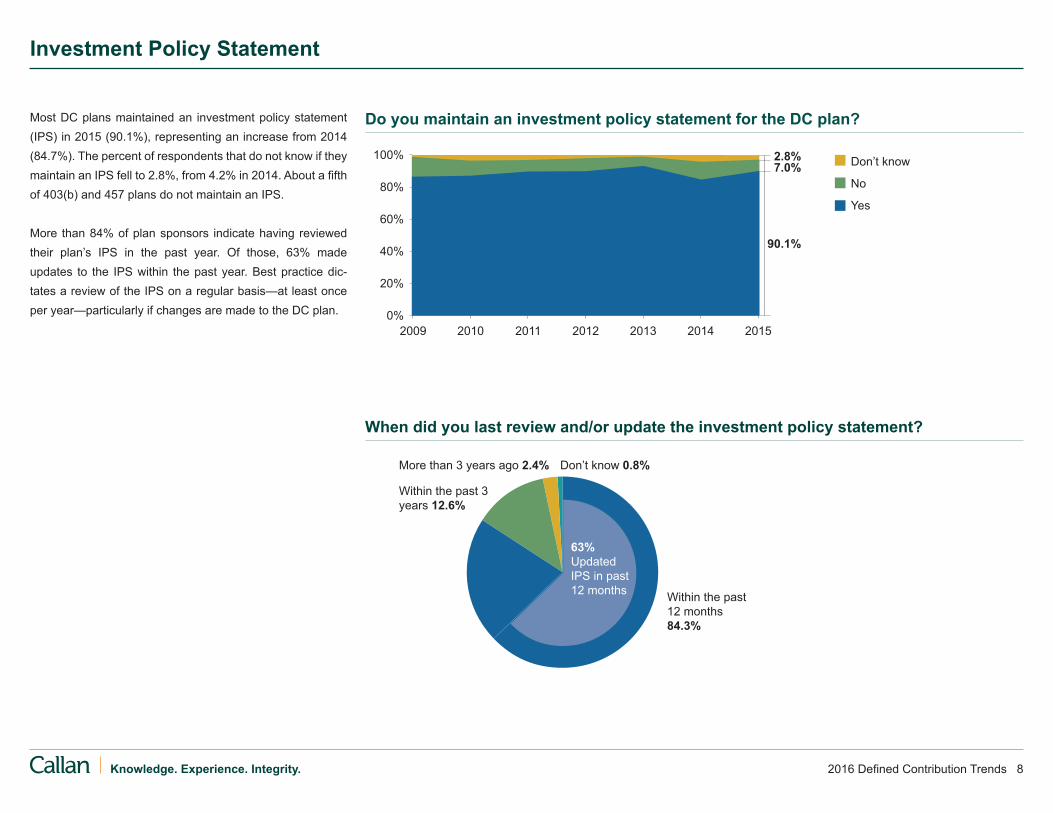
The Department of Labor’s (DOL) 2011–2012 fee disclosure requirements tie with the 2006 Pension Protection Act (PPA) as plan sponsors’ top-ranking event influencing the man-agement of DC plans. The PPA marks its 10th anniversary in 2016.
In measuring the success of their plan, respondents indicate contribution/savings and participation are the two most impor-tant measures. Cost effectiveness comes next, closely fol-lowed by employee satisfaction and investment performance.
DC Plan Management and Measurement
Rank which of the following events have most influenced the management of your organization’s DC plan
How do you measure the success of your plan?
2016 Defined Contribution Trends 11Knowledge. Experience. Integrity.
Weighted Average Score (15=Most important)
Investment Performance 9.6
Mos
t im
porta
nt a
ctio
ns
Changed communication approach 9.3
Updated or reviewed investment 12.8policy statement
Reviewed plan fees 12.3
Changed investment menu 12.1
Conducted formal fiduciary 11.9training Reviewed 404(c) compliance 11.9
Replaced fund manager(s) 11.5
Changed/hired investment 10.9consultant Reviewed/changed qualified 9.9default investment alternative Changed recordkeeper 9.4
Additional categories: Changed trustee/custodian 8.8 Implemented a written plan-fee policy statement 8.7Changed approach to company stock 8.5 Audited security protocols 8.3 Changed plan to safe harbor arrangement 7.3
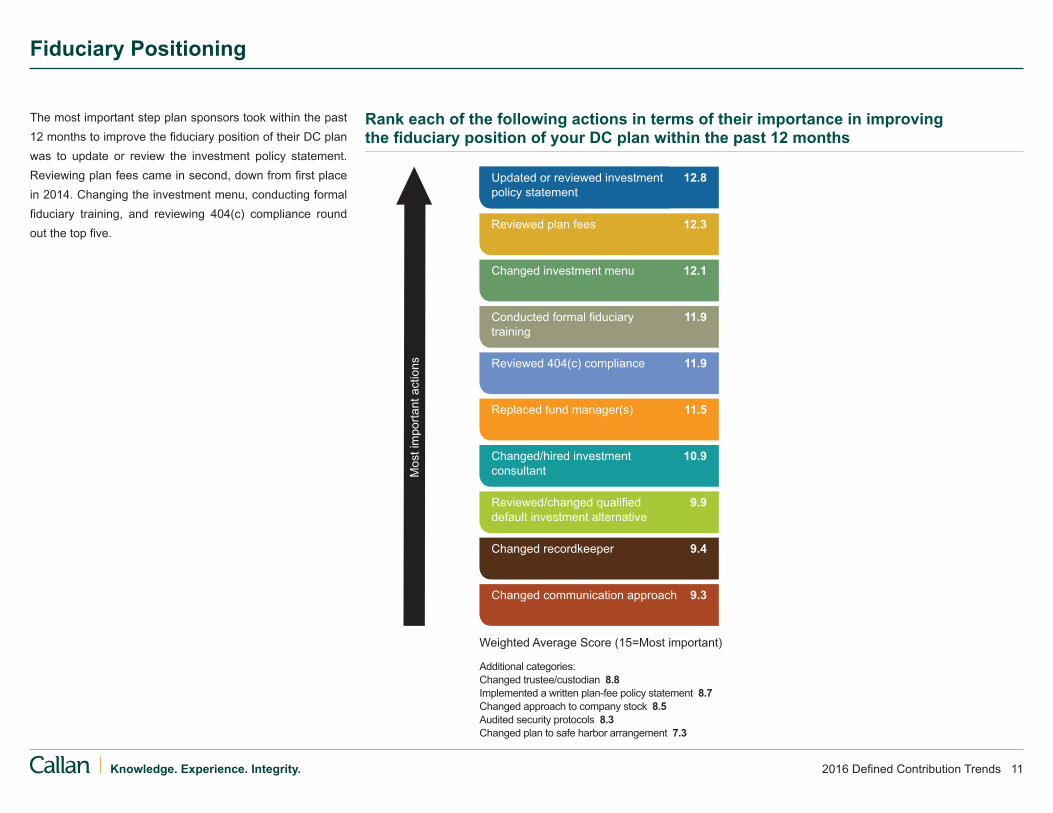
The most important step plan sponsors took within the past 12 months to improve the fiduciary position of their DC plan was to update or review the investment policy statement. Reviewing plan fees came in second, down from first place in 2014. Changing the investment menu, conducting formal fiduciary training, and reviewing 404(c) compliance round out the top five.
Fiduciary Positioning
Rank each of the following actions in terms of their importance in improving the fiduciary position of your DC plan within the past 12 months
2016 Defined Contribution Trends 12Knowledge. Experience. Integrity.
Change to company stock(e.g., removal, addition, change to restrictions)
Addition of staff
Plan design(e.g., level of company match)
Committee education
Plan features(e.g., whether or not to offer automatic
enrollment, automatic escalation)
Quality of providers(e.g., recordkeeper, legal, consulting)
Investment structure(e.g., number, types of funds)
Participant communication
Plan fees
Fund/manager due diligence
Compliance
1 2 3 4 5
5.3%3.2%
18.9% 27.4% 45.3%
5.0%6.0%
14.0% 30.0% 45.0%
6.9%2.9%
18.6% 35.3% 36.3%
9.3%2.8%
23.1% 43.5% 21.3%
10.8%15.1% 15.1% 28.0% 31.2%
11.2%12.4% 28.1% 25.8% 22.5%
13.5%15.6% 29.2% 17.7% 24.0%
19.5%18.3% 20.7% 23.2% 18.3%
17.3%22.2% 23.5% 22.2% 14.8%
12.3%67.7% 4.6% 9.2% 6.2%
10.6%71.2% 9.1% 3.0%6.1%
Total Rating
4.1
4.0
4.0
3.7
3.5
3.3
3.2
3.0
2.9
1.7
1.6
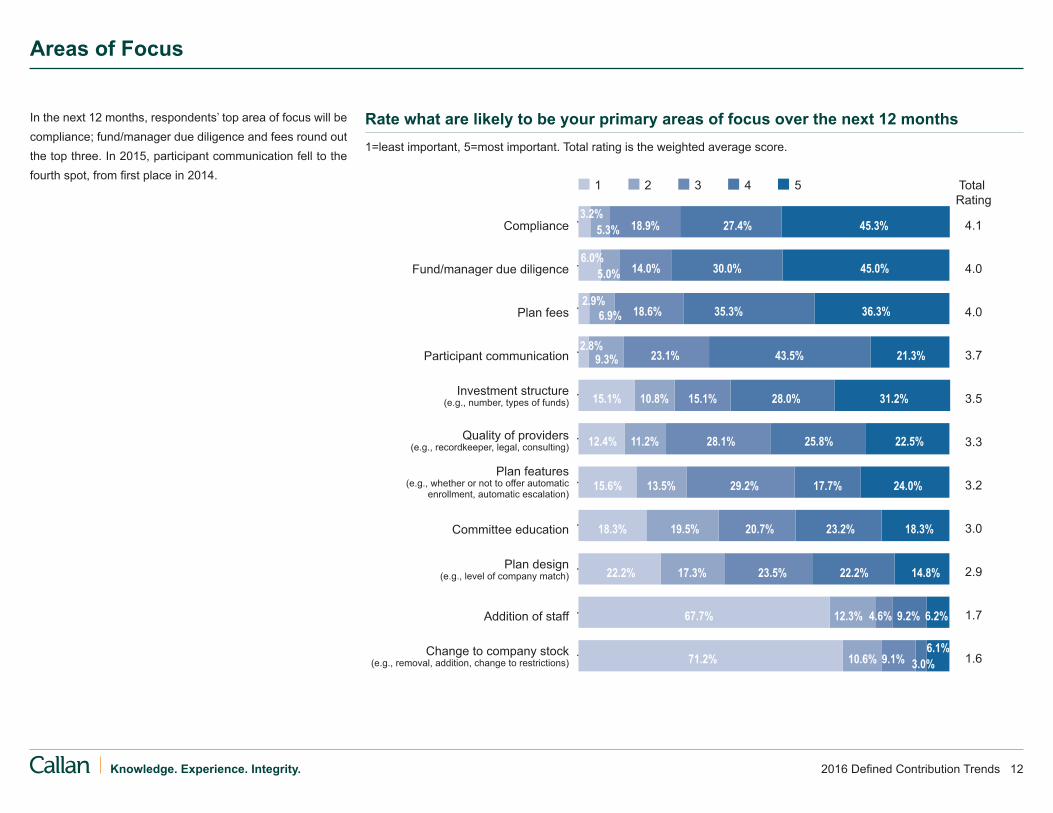
In the next 12 months, respondents’ top area of focus will be compliance; fund/manager due diligence and fees round out the top three. In 2015, participant communication fell to the fourth spot, from first place in 2014.
Areas of Focus
Rate what are likely to be your primary areas of focus over the next 12 months1=least important, 5=most important. Total rating is the weighted average score.

2016 Defined Contribution Trends 13Knowledge. Experience. Integrity.
Investment Performance 9.6Human resources 70.8%
Executives 47.4%(e.g., CEO, CIO, CFO, etc.)
Treasury/Finance 38.7%
Legal 24.1%
DB plan fiduciaries 19.7%
Investment staff 11.7%
Other 11.7%
Investment Performance 9.6Treasury/Finance 54.7%
Executives 54.0%(e.g., CEO, CIO, CFO, etc.)
Human resources 43.8%
DB plan fiduciaries 35.8%
Investment staff 31.4%
Legal 29.9%
Other 11.7%
Administration-related decisions Investment-related decisions
Additional category: Don’t know (0.7%) Additional category: Don’t know (0.0%)
A mix of human resources, treasury/finance professionals, and executives most commonly make plan administrative and investment-related decisions.
Not surprisingly, human resource professionals most com-monly make administrative decisions for the DC plan (70.8%). Treasury/finance professionals and executives are most likely to make investment-related decisions (54.7% and 54.0%, respectively). Legal is involved in administrative decision making for 24.1% of plans and investment-related decisions for 29.9%.
Decision Makers
Who are the voting committee members when it comes to administration-related and investment-related decisions for the DC plan?*
*Multiple responses were allowed.
2016 Defined Contribution Trends 14Knowledge. Experience. Integrity.
Investment Performance 9.6Increase 31.6%
Restructure 15.8%
Don’t know 15.8%
Reduce 10.5%
Change to stretch match 10.5%
Change timing 10.5%
Investment Performance 9.6Don’t know 68.0%
Add a match true-up feature 16.0%
Restructure 12.0%
Change to stretch match 12.0%
Increase 8.0%
Change timing 4.0%
Past 12 months Next 12 months
Add a match true-up feature 10.5%
Move to safe harbor design 5.3%
Move to safe harbor design 4.0%
Additional categories with 0.0%: Eliminate, Reinstate Additional categories with 0.0%: Eliminate, Reduce, Reinstate
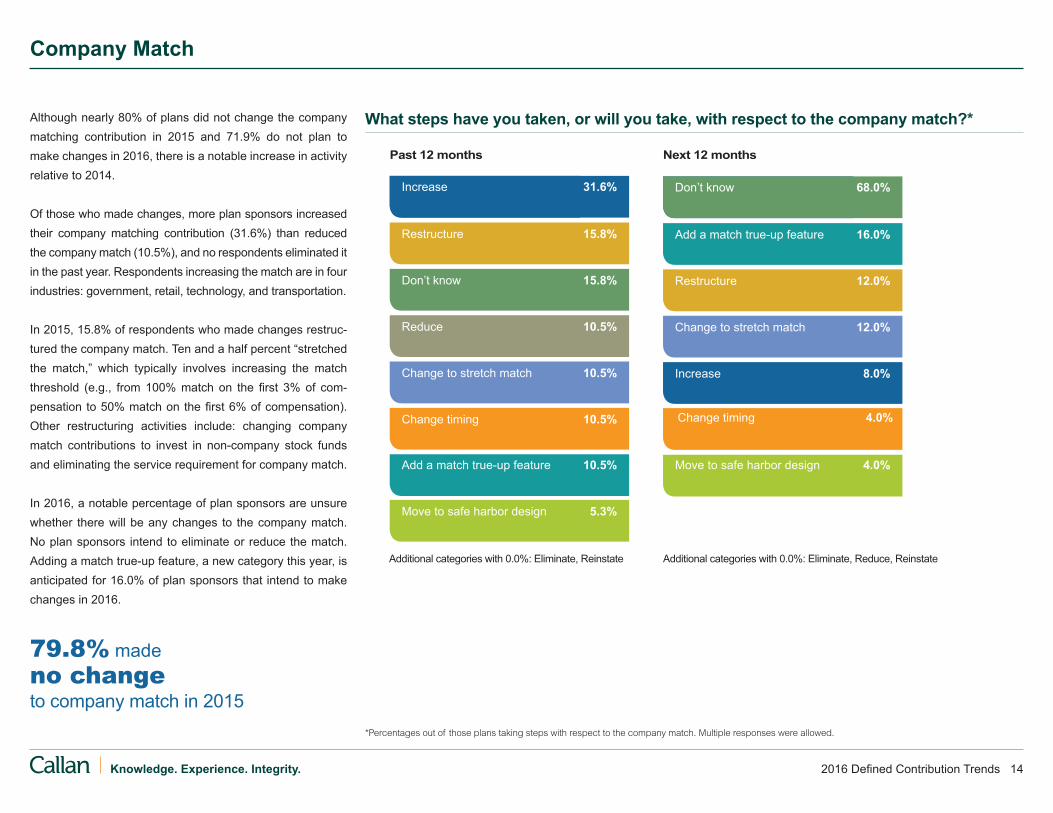
Although nearly 80% of plans did not change the company matching contribution in 2015 and 71.9% do not plan to make changes in 2016, there is a notable increase in activity relative to 2014.
Of those who made changes, more plan sponsors increased their company matching contribution (31.6%) than reduced the company match (10.5%), and no respondents eliminated it in the past year. Respondents increasing the match are in four industries: government, retail, technology, and transportation.
In 2015, 15.8% of respondents who made changes restruc-tured the company match. Ten and a half percent “stretched the match,” which typically involves increasing the match threshold (e.g., from 100% match on the first 3% of com-pensation to 50% match on the first 6% of compensation). Other restructuring activities include: changing company match contributions to invest in non-company stock funds and eliminating the service requirement for company match.
In 2016, a notable percentage of plan sponsors are unsure whether there will be any changes to the company match. No plan sponsors intend to eliminate or reduce the match. Adding a match true-up feature, a new category this year, is anticipated for 16.0% of plan sponsors that intend to make changes in 2016.
Company Match
What steps have you taken, or will you take, with respect to the company match?*
*Percentages out of those plans taking steps with respect to the company match. Multiple responses were allowed.
79.8% madeno changeto company match in 2015

2016 Defined Contribution Trends 15Knowledge. Experience. Integrity.
4.4%Fiduciary concerns
Lack of buy-in by upper management
Employees would not like it
Other
Too administratively challenging
Too costly
Non-ERISA plan (not permitted due to state wage garnishment laws)
Unnecessary (participation is adequate)
Not a high priority
Somewhat unlikely
Very likely
Somewhat likely60.4%
4.2%6.3%
Undecided
Very unlikely
Don’t know
6.3%
10.4%
12.5%
2015
58.3% 52.1%61.0% 61.7% 47.6% 51.3%
201120122013 20102014
11.1%
20.0%
26.7%
31.1%
8.9%
15.6%
6.7%
15.6%
Use of automatic enrollment remains steady this year (61.0% in 2015 vs. 61.7% in 2014). Plan sponsors continue to offer automatic enrollment primarily to new hires; however, 17.7% of those who automatically enroll also include existing employees. Most respondents (87.5%) said they automati-cally enroll all populations (i.e., they do not exclude sub-pop-ulations such as unbargained participants).
Approximately two-thirds (63.4%) of 401(k) plans offer auto-matic enrollment to new hires. Alternatively, only 11.1% of 457 plans offer automatic enrollment to new hires. DC plan sponsors that do not have an open DB plan are more likely to automatically enroll participants into their DC plan than those with an open DB plan: 66.2% of plans that automati-cally enroll employees do not have an open DB plan.
Nearly one-fifth of plan sponsors that do not automatically enroll employees are somewhat or very likely to implement this feature next year. Key reasons for not implementing automatic enrollment include: low prioritization, not being perceived as necessary, and not being permitted due to state wage garnishment laws. “Other” responses largely had to do with high employee turnover.
Virtually all plan sponsors with automatic enrollment intend to continue offering it in 2016. For 2016, 4% of plan sponsors intend to change the automatic enrollment default percentage.
Automatic Enrollment
Does your DC plan offer automatic enrollment?
If you do not currently offer automatic enrollment, will you offer it in 2016?
Reasons you do not currently offer automatic enrollment*
*Multiple responses were allowed.
2016 Defined Contribution Trends 16Knowledge. Experience. Integrity.
1.7%Too costly
Regulatory reasons
Fiduciary concerns
Other
Lack of buy-in by upper management
Unnecessary(savings rates are adequate)
Employees would not like it
Not a high priority
Somewhat unlikely
Very likely
Somewhat likely53.0%
9.1%7.6%
Undecided
Very unlikely
Don’t know
4.5%
13.6%
12.1%
Opt in Opt out Don’t know
21.4%
39.3%
1.8%
0%
20%
40%
60%
80%
100%
201520142013201220112010
37.5%
BothYes
20%
30%
40%
50%
60%
201520142013201220112010
11.9%
22.0%
22.0%
39.0%
10.2%
18.6%
6.8%
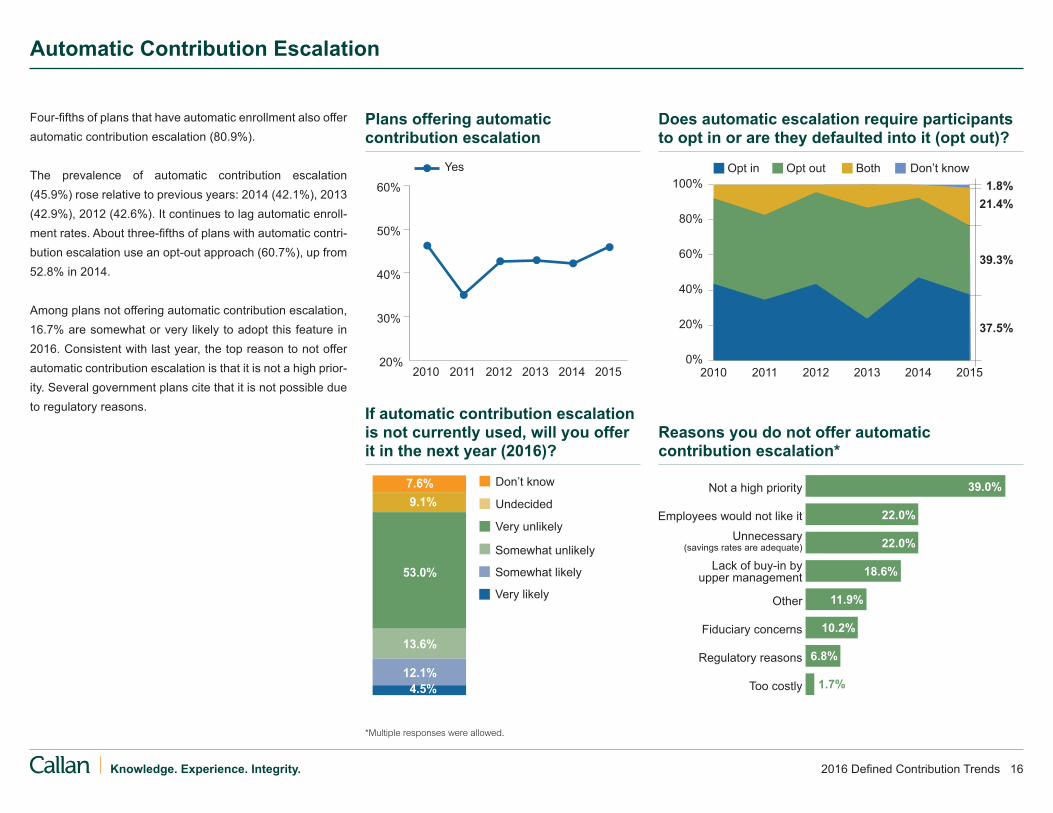
Four-fifths of plans that have automatic enrollment also offer automatic contribution escalation (80.9%).
The prevalence of automatic contribution escalation (45.9%) rose relative to previous years: 2014 (42.1%), 2013 (42.9%), 2012 (42.6%). It continues to lag automatic enroll-ment rates. About three-fifths of plans with automatic contri-bution escalation use an opt-out approach (60.7%), up from 52.8% in 2014.
Among plans not offering automatic contribution escalation, 16.7% are somewhat or very likely to adopt this feature in 2016. Consistent with last year, the top reason to not offer automatic contribution escalation is that it is not a high prior-ity. Several government plans cite that it is not possible due to regulatory reasons.
Automatic Contribution Escalation
Reasons you do not offer automatic contribution escalation*
Plans offering automatic contribution escalation
Does automatic escalation require participants to opt in or are they defaulted into it (opt out)?
If automatic contribution escalation is not currently used, will you offer it in the next year (2016)?
*Multiple responses were allowed.

2016 Defined Contribution Trends 17Knowledge. Experience. Integrity.
Other
Maximize likelihood that participants will reach their
retirement income goals
Adhere to safe harbor
Prevalent within industry/plan type
Likely to be most palatable to participants/limit opt outs
Allow participants to receive the full company match 47.9%
39.4%
19.7%
15.5%
11.3%
11.3%
Additional categories: Cost considerations (8.5%) Recommended by third party (1.4%)
Adhere to safe harbor
Other
Recommended by third party
Prevalent within industry/plan type
Likely to be most palatable to participants/limit opt outs
Maximize likelihood that participants will reach their
retirement income goals40.6%
37.5%
18.8%
18.8%
15.6%
12.5%
Average Median
In 20162015
4.0%
3.0%
4.2% 4.0%
Average Median
19.2%
10.0%
Among plans offering automatic enrollment, 87.5% offer it to the full population of employees (i.e., they do not exclude sub-populations such as unbargained participants). In 2015, default contribution rates range from 1% to 11%. The median default rate is expected to increase from 3.0% in 2015 to 4.0% in 2016. The two most common reasons behind the selection of the default rate are allowing participants to maxi-mize the company match and participant palatability.
Similar to last year, plans with opt-out automatic contribution escalation most frequently have an annual increase rate of 1%, though a number of plan sponsors report a 2% increase rate. The most common cap on automatic contribution esca-lation is 10%, with caps ranging from 5% up to 100%. The most common reasons behind the selection of the cap are maximization of the likelihood that participants will reach their retirement income goals and palatability to participants.
Automatic Features: Rates and Caps
For the automatic enrollment default contri-bution rate, why did you select the rate that you did?*
*Multiple responses were allowed.
What is/will be the automatic enrollment default contribution rate for your plan?
For automatic escalation, why did you select the cap that you did?*
What is the cap on contributions under automatic escalation?

2016 Defined Contribution Trends 18Knowledge. Experience. Integrity.
No, and not considering
No, but consideringin next 12 months
Don’t know
Yes
21.4%
2.7%
14.3%
61.6%
2015
49.4% 47.1%61.6% 62.3% 53.8% 49.3%
201120122013 20102014
Yes No, but intend to offer in next 12 months
No
47.5%
12.5%
0%
20%
40%
60%
80%
100%
20152014201320122011
40.0%
2009 2008
37.0% 27.8%
13.2%1.9%
22.6%
62.3%
2015 2014
The prevalence of Roth contributions in DC plans has been stagnant—62.3% in 2014 and 61.6% in 2015 offer Roth. This is interesting given that over 20% of plan sponsors said they were considering offering Roth in their plans in 2014.
While 21.4% do not allow (and are not considering) Roth-designated accounts, this survey’s results show 14.3% of plan sponsors are considering them over the coming year.
There is a modest increase in the percent of plans allow-ing for in-plan Roth conversions in 2015, with 40% of plan sponsors allowing for this feature. A portion (12.5%) of plan sponsors intend to offer this option in the next year.
Roth Features
Does your DC plan allow for Roth designated accounts?
DC plans allowing Roth designated accounts
Does your DC plan allow for in-plan Roth conversions?

2016 Defined Contribution Trends 19Knowledge. Experience. Integrity.
No, but a stand-aloneESOP is offered
Yes, as an ESOP
No
Yes, as an investment option
2015
40.0% 44.1%39.3% 34.3% 44.4% 46.8%
201120122013 20102014
Never offered Offered in past, since eliminated itOffered in past, but have frozen it
2.1%2.1%
68.1%
2009
48.3%
1.2%
59.5%
15.5%
23.8%
Other Don’t know
0%
20%
40%
60%
80%
100%
201520142013201220112010
27.7%
Just under 40% of plans offer company stock either as an available investment option or as an ESOP. This is down from nearly half of plans offering company stock in 2009, but up marginally from last year.
Most plans that do not offer company stock indicate that the plan has never done so (68.1%). However, over one-quarter respond that the plan once offered company stock but has since eliminated it.
Company Stock: Prevalance
Do you offer company stock in the plan?
Is company stock offered in the plan?
If company stock is not currently offered, please describe the plan’s past experience with company stock

2016 Defined Contribution Trends 20Knowledge. Experience. Integrity.
Other
Company stock is frozen
Provide clear guidelines for evaluation andmonitoring in the investment policy statement
No insiders are on the oversight committee
Outsource oversight of company stock
Hardwire company stock into the plan document(e.g., require that it is offered as an investment option)
Cap contributions to company stock
Offer tools to improve diversification out of company stock
Regularly review company stock in investment committee meetings
Communicate to improve diversification out of company stock73.3%
54.5%
50.0%27.3%
46.7%36.4%
30.0%9.1%
30.0%40.9%
23.3%27.3%
16.7%9.1%
13.3%9.1%
9.1%
6.7%4.5%
0.0%
2015 2014
All plan sponsors that offer company stock have taken some action to limit their liability, with an average of three actions being taken. The most common is to communicate diversification principles (73.3%), significantly higher than last year (54.5%). Half of plan sponsors regularly review company stock in investment committee meetings, nearly double from 2014. Conversely, hardwiring company stock into the plan document dropped from more than 40% in 2014 to 30% in 2015.
The change in the proportion of plan sponsors monitoring (versus hardwiring) company stock is likely a direct result of the U.S. Supreme Court’s 2014 decision in Fifth Third Bancorp et al v. Dudenhoeffer. The Court found that the law does not create a special presumption of prudence for ESOP fiduciaries, and many interpret this to mean that hardwiring (mandating company stock be offered) no longer provides a defense in a stock-drop lawsuit. Many believe the ruling means monitoring and evaluating company stock on an ongoing basis—just like other funds in the DC plan. Despite this, there has been only a slight uptick in plan sponsors pro-viding clear guidelines for evaluation and monitoring of com-pany stock in the investment policy statement.
Limiting Company Stock Liability
How do you limit potential liability with respect to company stock?*
*Multiple responses were allowed.
100% have taken some actionto limit potential liability

2016 Defined Contribution Trends 21Knowledge. Experience. Integrity.
Anticipated Changes to Company Stock
More than half of respondents (58.6%) anticipate no changes to their company stock in the coming year, a lower proportion than in prior years (72.7% in 2014 and 76.0% in 2013).
In 2016, expect more plan sponsors (17.2%) to begin regu-lar reviews of company stock. Nearly 14% intend to increase communication around participant diversification away from company stock. However, one in ten plan sponsors await the outcome of the U.S. Supreme Court’s decisions on stock-drop lawsuits before making changes to company stock in the near term.
What changes do you anticipate with respect to company stock in the next year?*
Change language in the investment policy statement
Eliminate insiders from investment commitee
Outsource oversight of company stock
Freeze company stock
Cap contributions to company stock
Waiting to make decision pending the outcome of recent stock drop lawsuits
Increase communication to improve diversification out of company stock
Regularly review company stock in investment committee meetings
No changes anticipated 58.6%
17.2%
13.8%
10.3%
6.9%
6.9%
6.9%
6.9%
3.4%
Additional categories with 0.0%: Offer more tools to improve diversification out of company stock, Eliminate company stock,Hardwire company stock into plan document
*Multiple responses were allowed.

2016 Defined Contribution Trends 22Knowledge. Experience. Integrity.
Yes
80%
85%
90%
95%
100%
20152014201320122011201020092008
Target date retirement
Stable value or money market
Other
Balanced fund
Target risk
Managed account
85.5%
7.7%
2.6%0.9%
3.4% 4.6%
6.9%72.4%
6.9%
2.3%
2015 2013
3.4%
5.9%74.6%
3.4%
1.7%
2014
11.0% 6.9%
Most DC plans have a qualified default investment alterna-tive (QDIA) as the default investment fund (96.7%), a nota-ble increase from prior years.
A key provision of the PPA provides relief to DC fiduciaries that default participant assets into QDIAs under regulation 404(c)(5). Plan sponsors complying with this provision are responsible for the prudent selection and monitoring of plan QDIAs, but are not liable for any loss that occurs by partici-pants invested in the QDIA.
Target date funds continue to trump other options as the most prevalent choice of default investment fund for par-ticipant-directed monies (85.5%), a substantial uptick from last year (74.6%). Only 6.0% of plans use target risk or bal-anced funds as their defaults, and less than 1% use man-aged accounts.
While money market accounts or stable value funds are gen-erally not QDIAs, 7.7% of plans use these investments as the default. The majority of respondents using stable value or money market funds are 457 plans, which are not subject to ERISA’s QDIA regulations.
Default Investments
Is your DC plan’s default investment fund a qualified default investment alternative?
What is your current default investment alternative for non-participant directed monies?
2016 Defined Contribution Trends 23Knowledge. Experience. Integrity.
Don't know
DOL/EBSA Guide recommended it
Branding
To leverage funds in the DB plan
Ability to hire/terminate underlying managers
Prefer to control the glide path
Seek best-in-class underlying funds or to leverage funds in the core lineup
Better cost structure 73.7%
73.7%
73.7%
73.7%
5.3%
5.3%
5.3%
Mutual fund or collective trust of recordkeeper
9.0%16.2%
26.1%
23.4%
25.2%0%
50%
100%
Will use in 2016
20152014201320122011
Mutual fund that isn’t recordkeeper’s
Collective trust that isn’t recordkeeper’s
Custom target date strategies
Other
Don’t know
36.8%
17.1%
23.4%
21.6%
32.4%
4.5%0.9%
Other
Custodian
Recordkeeper
Consultant
Investmentmanager
Plansponsor 84.2%
52.6%
31.6%
15.8%
10.5%
5.3%
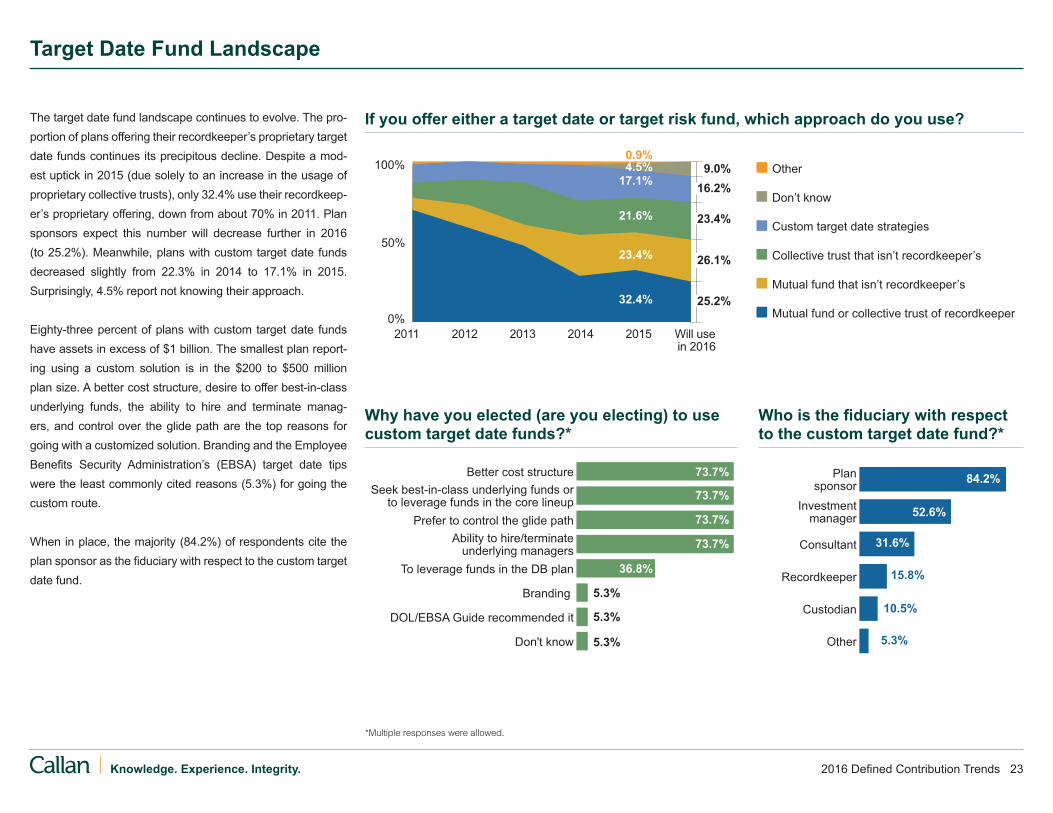
The target date fund landscape continues to evolve. The pro-portion of plans offering their recordkeeper’s proprietary target date funds continues its precipitous decline. Despite a mod-est uptick in 2015 (due solely to an increase in the usage of proprietary collective trusts), only 32.4% use their recordkeep-er’s proprietary offering, down from about 70% in 2011. Plan sponsors expect this number will decrease further in 2016 (to 25.2%). Meanwhile, plans with custom target date funds decreased slightly from 22.3% in 2014 to 17.1% in 2015. Surprisingly, 4.5% report not knowing their approach. Eighty-three percent of plans with custom target date funds have assets in excess of $1 billion. The smallest plan report-ing using a custom solution is in the $200 to $500 million plan size. A better cost structure, desire to offer best-in-class underlying funds, the ability to hire and terminate manag-ers, and control over the glide path are the top reasons for going with a customized solution. Branding and the Employee Benefits Security Administration’s (EBSA) target date tips were the least commonly cited reasons (5.3%) for going the custom route.
When in place, the majority (84.2%) of respondents cite the plan sponsor as the fiduciary with respect to the custom target date fund.
Target Date Fund Landscape
If you offer either a target date or target risk fund, which approach do you use?
Why have you elected (are you electing) to use custom target date funds?*
*Multiple responses were allowed.
Who is the fiduciary with respect to the custom target date fund?*
2016 Defined Contribution Trends 24Knowledge. Experience. Integrity.
Actively managedIndexed34.5%
23.0%
42.5%0%
50%
100%
201520142013201220112010
Change communication approach to target date fund
Eliminate target date fund
Move to a target date collective trust
Replace target date fund/manager
Change share class of target date fund
Evaluatesuitability ofglide path
Expected in 20162015
67.7%
75.7%
22.6%16.2% 16.1%
8.1%
16.1%
2.7% 6.5% 2.7%0.0%
3.2%
Additional categories (2015/expected 2016 data): Shift to all-passive target date fund (0.0%/2.7%), Shift to all-active target date fund (0.0%/0.0%), Shift to a mix of active and passive target date fund (0.0%/5.4%), Move to custom target date funds (0.0%/5.4%), Change from target date fund to a different default fund (0.0%/0.0%), Other (0.0%/2.7%)
Mix of index and active management
What investment approach does your target date fund use?
If action was/is expected to be taken with your target date fund, please describe*
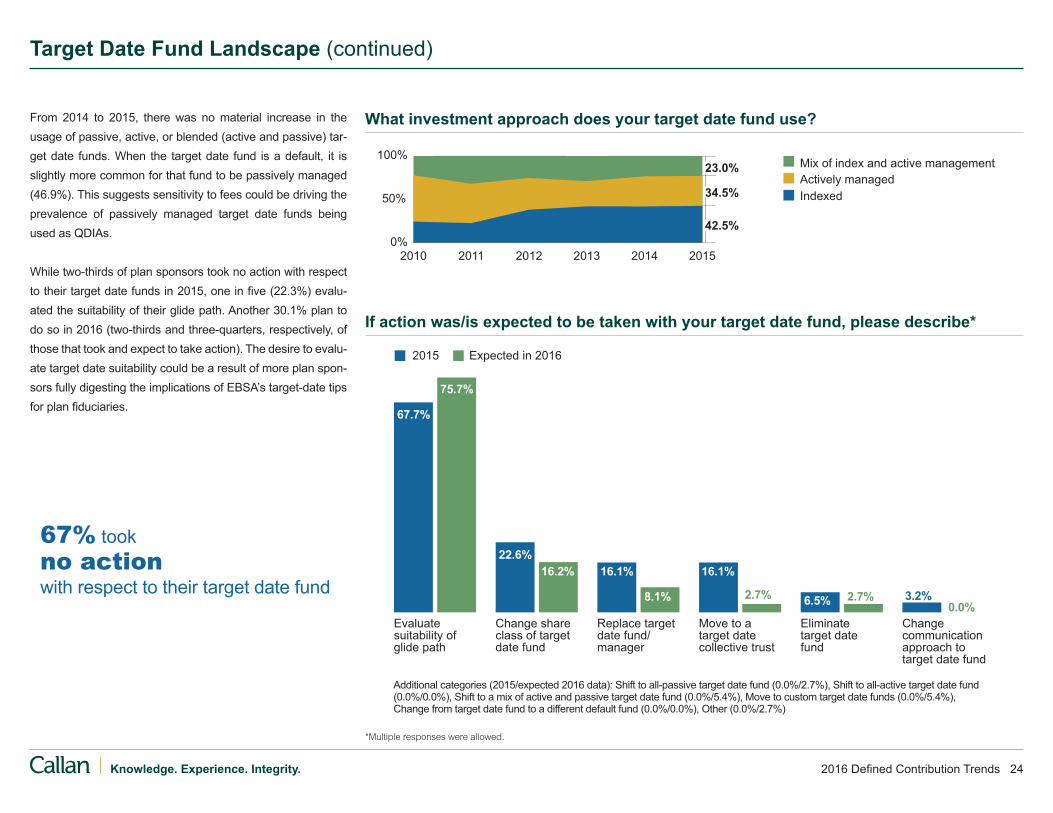
From 2014 to 2015, there was no material increase in the usage of passive, active, or blended (active and passive) tar-get date funds. When the target date fund is a default, it is slightly more common for that fund to be passively managed (46.9%). This suggests sensitivity to fees could be driving the prevalence of passively managed target date funds being used as QDIAs.
While two-thirds of plan sponsors took no action with respect to their target date funds in 2015, one in five (22.3%) evalu-ated the suitability of their glide path. Another 30.1% plan to do so in 2016 (two-thirds and three-quarters, respectively, of those that took and expect to take action). The desire to evalu-ate target date suitability could be a result of more plan spon-sors fully digesting the implications of EBSA’s target-date tips for plan fiduciaries.
Target Date Fund Landscape (continued)
*Multiple responses were allowed.
67% tookno actionwith respect to their target date fund

2016 Defined Contribution Trends 25Knowledge. Experience. Integrity.
Weighted Average Score (10=Most important)
Investment Performance 9.6
Mos
t im
porta
nt k
ey a
ttrib
utes
Other 2.7
Whether the funds are managed 2.7by the recordkeeper
Portfolio construction 9.0(i.e., asset allocation or “glide path”) Fees 8.4 Performance 7.8
Risk 7.0
Number, type, and quality 6.6of underlying funds
Active vs. passive investment style 5.1
Ability to achieve pre-specified 4.6retirement goal Usage of tactical asset allocation 3.9
Name recognition 3.1
Respondents report portfolio construction as the top criterion for selecting or retaining a target date fund; as in 2014, fees and performance round out the top three. Consistent with Callan’s previous surveys, both name recognition and being proprietary to the recordkeeper score low for respondents.
Target Date Fund Selection
What are the most important criteria for selecting or retaining target date retirement funds?
2016 Defined Contribution Trends 26Knowledge. Experience. Integrity.
OtherDo not benchmark
Don't knowRetirement income adequacy analysis
Custom benchmark
Peer benchmarking
Industry benchmark
Benchmark provided by investment manager
n/a
5.2%
33.0%35.1%
65.6%
23.9%
20142015
3.5%6.2%
36.3%40.7%
67.3%
n/a 0.9% 0.9%3.1% 2.1%
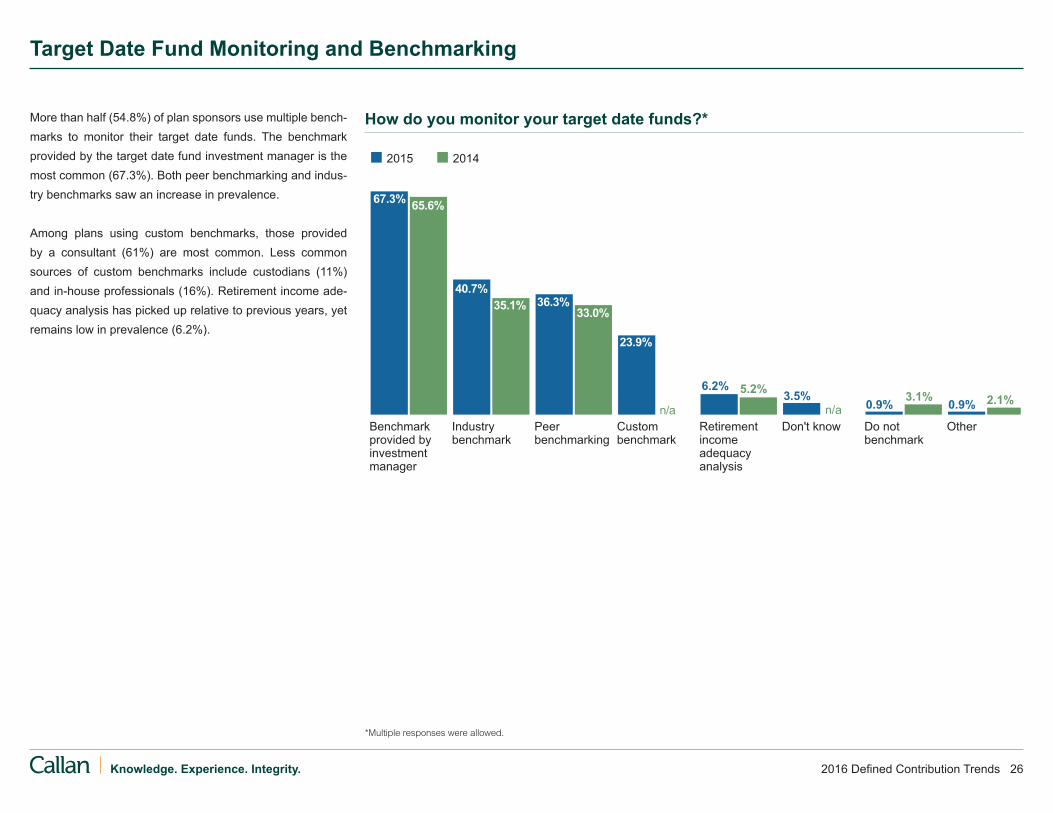
More than half (54.8%) of plan sponsors use multiple bench-marks to monitor their target date funds. The benchmark provided by the target date fund investment manager is the most common (67.3%). Both peer benchmarking and indus-try benchmarks saw an increase in prevalence.
Among plans using custom benchmarks, those provided by a consultant (61%) are most common. Less common sources of custom benchmarks include custodians (11%) and in-house professionals (16%). Retirement income ade-quacy analysis has picked up relative to previous years, yet remains low in prevalence (6.2%).
Target Date Fund Monitoring and Benchmarking
How do you monitor your target date funds?*
*Multiple responses were allowed.

2016 Defined Contribution Trends 27Knowledge. Experience. Integrity.
All active funds
Active/passive mirror
Mix of active and passive funds
4.3%3.4%5.1%
18.8% All passive funds
Don’t know
68.4%
No47.0%
Don’t know7.0%
Yes46.1%
No49.6%
Yes42.5%
2015 2014
Don’t know8.0%
100%
80%
60%
40%
20%
0%2012 20142013 2015
As in 2014, fewer than half of plan sponsors (46.1%) use a tiered investment structure (e.g., tier one: asset alloca-tion, tier two: core options, and tier three: specialty options) within their fund lineup. Nearly half (47.0%) do not use a tiered investment structure and 7.0% are not sure. Of those using a tiered investment structure, a common variation is to offer target date options as one tier with separate core tiers for active and passive options.
More than two-thirds of DC plans surveyed have a mix of active and passive investment funds (68.4%). Active/passive mirror strategies, where both active and passive options represent major asset classes, are a distant second in popularity at 18.8%. Both all-active (4.3%) and all-passive lineups (3.4%) remain less prevalent in the DC landscape.
Investment Menu
Does your plan use a tiered investment structure?
What best describes your plan’s investment menu approach?
Tiered investment structure: allows plan spon-sors to build fund lineups that appeal to a heteroge-neous participant base that includes “do-it-for-me” (tier 1), “do-it-myself” (tier 2), and “investment-savvy” participants (tier 3).

2016 Defined Contribution Trends 28Knowledge. Experience. Integrity.
Pooled insurance company separate account
Variable annuities
Fixed annuities
Unitized or private label funds
Brokerage
Separate accounts
Collective trusts
Mutual funds
38.9%
42.7%
60.0%
88.2%
1.8%2.7%
5.3%
15.9%
40.7%
70.8%
82.3%
n/a
Additional categories (2015 data): Other (2.7%), ETFs (0.0%)
7.3%1.8%
201320142015
9.1%
14.5%
n/a
85.2%
51.9%
50.6%
13.6%
7.4%
1.2%
1.2%
Mutual funds remain commonplace DC plan options at 82.3%. Collective trusts notably increased in prevalence, with 70.8% of plans offering them in 2015, up from 60.0% in 2014. Collective trusts are a common stable value option (43.4%) but more often are used for other (i.e., non-stable value) funds (49.6%).
Within the separate account category, stable value is 24.8% and non-stable value is 28.3%. Separate account preva-lence overall stood at 40.7%. Some respondents offer both types of separate accounts.
More than three-quarters of plans (77.8%) offer an institutional-structured option—either collective trusts, separate accounts, or unitized private label funds. When stable value funds are excluded, 65.4% of plans utilize an institutional structure.
Only one 401(k) surveyed offers a fixed annuity.
Investment Vehicles
Does your plan offer the following investment types within the fund lineup?*
*Multiple responses were allowed.

2016 Defined Contribution Trends 29Knowledge. Experience. Integrity.
Participant demand for additional funds
New recordkeeper
Newconsultant
Switching to different vehicle structures(e.g., unitized funds, separate accounts, collective trusts)
Add additionaldiversification opportunities
Streamline the fund lineup
Identify overlaps and gaps in the fund lineup
Regular due diligence
12.4%
21.9%5.7%
30.5%
81.0%
8.6%
24.8%
20142015
13.3%
23.8%
36.2%
79.0%
Additional category (2015 data): Other (3.8%)
16.2%
Within last 4 – 5 years
Within last year
Within last 2 – 3 years
23.5%
3.5%
65.2%
Don’t know or don’t recall
More than 5 years ago
4.3% 3.5%
24.6%4.2%
60.2%
9.3% 1.7%
27.9%
4.7%
61.6%
3.5% 2.3%
1.0%5.7%
1.0%1.9%
2015 2014 2013
Nearly two-thirds (65.2%) of plan sponsors conducted an investment structure evaluation within the past year, consis-tent with Callan’s prior surveys. Fewer than 10% either do not recall the last investment structure review (4.3%) or con-ducted one more than five years ago (3.5%).
As in previous years, regular due diligence (79.0%) is the most common reason for conducting an investment structure evaluation. Fewer plan sponsors are motivated to identify overlaps and gaps in the fund lineup (36.2%) or by a desire to streamline the fund lineup (23.8%).
Investment Structure Evaluation
When was the last time your organization conducted an investment structure evaluation to determine gaps/overlaps in the investment offerings?
What motivated the most recent investment structure evaluation?*
*Multiple responses were allowed.

2016 Defined Contribution Trends 30Knowledge. Experience. Integrity.
Expectedin 2016
Expectedin 2016
2015 2015
Increased # of funds
Decreased # of funds
# of funds remained the same
Increased proportion of active funds
Increased proportion of passive funds
Mix of active and passive remained the same
2.6% 4.3%13.2%
15.0%
89.1%6.5% 6.4%
89.4%11.3%
73.8%
84.2%
4.3%
Assets mapped to default fund 12.2%
Assets mapped to the most similar fund based on matching the risk level of the existing fund 75.6%
Unsure2.4% Both
9.8%
As in past years, in 2015 the majority of plan sponsors (73.8%) did not change the number of funds in their plan. Bucking recent trends, more plan sponsors report increas-ing the number of funds (15.0%) than decreasing the num-ber of funds (11.3%). According to the Callan DC IndexTM, DC plans have an average of 15 funds (as of September 30, 2015), excluding target date funds.
The majority of plan sponsors did not change the proportion of active versus passive funds (89.4%). Unlike 2014, when 27.3% increased the proportion of passive funds, only 6.4% report such an increase in 2015. Just 4.3% increased their active funds.
Balanced funds are the most commonly eliminated funds, while real return, high yield, non-U.S. (equity and fixed income), target date, and money market funds all tie for the most frequently added to the investment lineup in 2015. In the coming year, real return funds appear to be the investment option most likely to be added to plan lineups. Interestingly, several plan sponsors report the intent to add direct real estate options.
Sponsors report that the most common approach to han-dling assets of a fund that has been eliminated is to map the assets to a fund with the most similar risk level (75.6%). Just over one in ten (12.2%) plan sponsors report mapping assets to the default fund in 2015, and another one in ten use both mapping approaches. Either approach may be protected under ERISA section 404(c).
Investment Structure Changes
How did/will the plan’s investment menu change?
If funds were eliminated, how were assets mapped from the eliminated fund(s)?
2016 Defined Contribution Trends 31Knowledge. Experience. Integrity.
Unsure/still evaluating
No 47.7%
Yes48.6%
Don’t know3.6%
None, because the money market fund will not be subject to a floating NAV and/or liquidity gates
Will change to a government money market fund (stable NAV)
None, have evaluated the money market fund and found a floating NAV and/or liquidity gates are acceptable
Will change to a stable value fund
58.7%
17.4%
13.0%6.5%4.3%
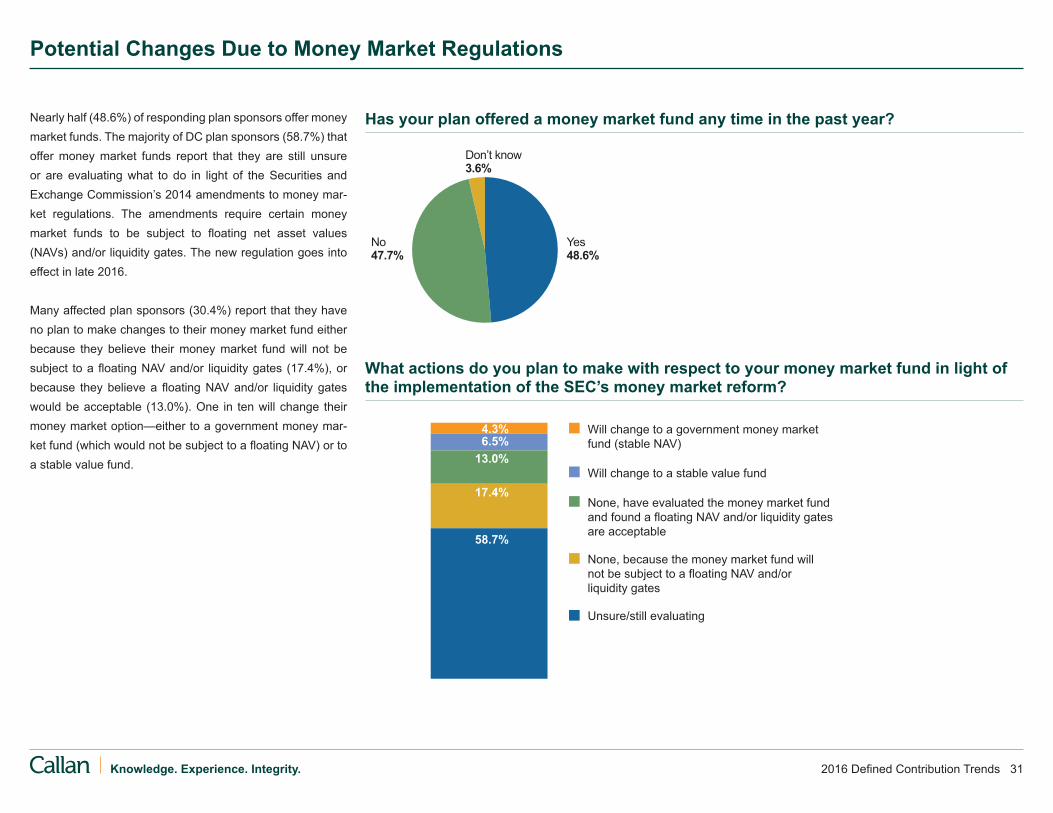
Nearly half (48.6%) of responding plan sponsors offer money market funds. The majority of DC plan sponsors (58.7%) that offer money market funds report that they are still unsure or are evaluating what to do in light of the Securities and Exchange Commission’s 2014 amendments to money mar-ket regulations. The amendments require certain money market funds to be subject to floating net asset values (NAVs) and/or liquidity gates. The new regulation goes into effect in late 2016.
Many affected plan sponsors (30.4%) report that they have no plan to make changes to their money market fund either because they believe their money market fund will not be subject to a floating NAV and/or liquidity gates (17.4%), or because they believe a floating NAV and/or liquidity gates would be acceptable (13.0%). One in ten will change their money market option—either to a government money mar-ket fund (which would not be subject to a floating NAV) or to a stable value fund.
Potential Changes Due to Money Market Regulations
Has your plan offered a money market fund any time in the past year?
What actions do you plan to make with respect to your money market fund in light of the implementation of the SEC’s money market reform?
2016 Defined Contribution Trends 32Knowledge. Experience. Integrity.
Weighted Average Score (11=Most important)
Investment Performance 9.6
Mos
t im
porta
nt k
ey a
ttrib
utes
Participation request 2.5
Brand name/market image 3.7
Investment performance 9.6
Fills style or strategy gap 9.3
Cost and fees 8.9
Investment management 8.7team stability Style consistency 7.9
Quality of service to plan 5.7sponsors Leverage existing pension 4.9fund managers Participant communication and 4.4educational support Ease of integration with 4.3recordkeeping system
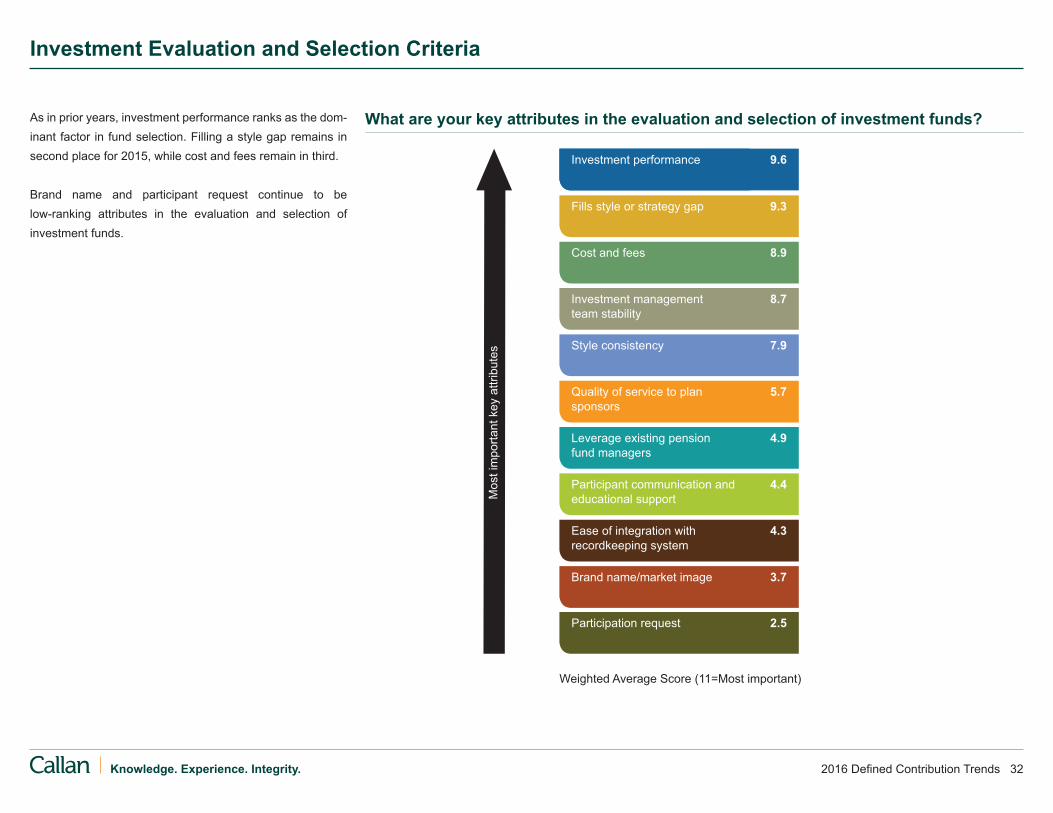
As in prior years, investment performance ranks as the dom-inant factor in fund selection. Filling a style gap remains in second place for 2015, while cost and fees remain in third.
Brand name and participant request continue to be low-ranking attributes in the evaluation and selection of investment funds.
Investment Evaluation and Selection Criteria
What are your key attributes in the evaluation and selection of investment funds?

2016 Defined Contribution Trends 33Knowledge. Experience. Integrity.
3.8%
Small cap equity
Non-U.S. equity
Fixed income
Mid cap equity
7.1%
32.1%
25.0%
7.1%
2010 2011 2012 20152013
56.7%
39.4%
Target date/balanced
Specialty
Large cap equity 7.1%
17.9%
21.4%
20140%
20%
40%
60%
80%
100% Don’t know
Yes
No
Nearly 40% of plan sponsors replaced managers and/or funds for performance-related reasons. Not surprisingly—given changes to the bond fund management landscape in late 2014—fixed income replacements were most common, followed by small cap and non-U.S. equity. Target date fund changes are significantly lower than in 2014, (7.1% versus 26.9%, respectively). This is especially surprising as many plan sponsors report that they evaluated the suitability of their target date fund glide path during the past year (22.3%). Nearly one in three plan sponsors intend to evaluate target date fund glide path suitability in 2016, which may result in an uptick in target date fund changes.
When sponsors changed managers/funds in 2015, the aver-age number replaced was 1.7 and the median was 1.0 funds/managers. Most survey respondents replaced no more than three managers, although one sponsor replaced five.
Manager/Fund Replacement
Did you replace managers/funds in the past year due to performance-related reasons?
Which funds did you replace?*
*Multiple responses were allowed. Percentages are out of just those funds that made changes.

2016 Defined Contribution Trends 34Knowledge. Experience. Integrity.
No, and not planning toYes
1.8%
New recordkeeper
Poor existing investment elections by participants
Changes to the fund lineup
Plan merger or other significant event
3.7%
70.4%
2010 2011 2012 20142013
Don’t know
20.4%
Other
18.5%
29.6%
22.2%
20150%
20%
40%
60%
80%
100%
Mos
t im
porta
nt re
ason
s
Already re-enrolled participants 1.9
Too many employers to coordinate 4.7with to be feasible
Participants would object 8.2to re-enrollment
Not necessary 7.7
Not a priority 7.6
Too much potential fiduciary liability 7.2 Too many administrative 6.7complexities
Too difficult to communicate 6.6
Other 5.5
Objections from senior 5.3management Too costly 4.9
4.4%
73.5%
No, but plan to in next 12 months
Weighted Average Score (10=Most important)
The prevalence of asset re-enrollment reported by plan sponsors jumped considerably in 2015. Asset re-enrollment is defined as requiring all participants in the plan to recon-firm fund elections, select new ones, or else be mapped into the default investment option. In 2015, one in five plan sponsors indicate they had ever engaged in an asset re-enrollment, up from 11.6% in 2014. Only 4.5% of plan spon-sors indicate they had planned a re-enrollment for 2015; a similar proportion (4.4%) plan a re-enrollment for 2016.
As in prior years, “changes to the fund lineup” is the most common motivation for the re-enrollment—although it is cited by significantly more respondents in 2015 than in 2014 (70.4% and 52.6%, respectively). More than a third of those citing a fund lineup change note that the re-enrollment was also prompted by a recordkeeper change or a plan merger. In 2015, fewer plan sponsors cite “poor existing investment elections by participants” versus 2014 (22.2% and 42.1%, respectively). However, one plan sponsor notes that the re-enrollment was “overdue” given poor existing investment elections. An additional “other” response includes moving to a white-label fund structure.
The plan sponsors that did not engage in re-enrollment cite “participants would object” as their top reason, followed by “re-enrollment is not necessary,” “not a priority,” and “too much potential fiduciary liability.” These reasons all topped the list in previous years, with the exception of the newly added “not a priority” response. A number respond that while they think re-enrollment is unlikely in the near future (for various reasons), it is a possibility down the line.
Re-enrollment
Have you ever engaged in an asset re-enrollment of the plan?
What is the motivation for the re-enrollment?*
Why was there no re-enrollment?
*Multiple responses were allowed.

2016 Defined Contribution Trends 35Knowledge. Experience. Integrity.
2015
88.3%
79.5%
2011
71.3%
2012
69.9%
2013
68.1%
2010
79.1%
2014
Full financial planning(e.g., Ayco, E&Y)
One-on-one advisory services
Managed accounts (e.g., Financial Engines, Morningstar)
Guidance
On-site seminars
Online advice(e.g., Financial Engines, Morningstar)
Financial wellness services (e.g., HelloWallet)
58.2%59.8%
63.8%
46.9%
51.7%
43.9%
39.1%41.3%
35.7%
35.6%27.6%
35.7%
36.8%36.2%
9.2%9.2%10.3%
9.2%
43.1%
n/an/a
201320142015
Additional categories (2015 data): Other (3.1%), Don’t know (1.0%)
The majority of DC plan sponsors (88.3%) offer some form of investment guidance or advisory service to participants. In many cases, sponsors provide a combination of different advisory/guidance services.
Online advice remains most prevalent (58.2%) and on-site seminars (46.9%) are also widely used. While not as ubiqui-tous, both managed accounts and one-on-one advisory ser-vices are still common. Full financial planning and financial wellness services are the least common. Financial wellness is a new category and refers to services that assist employ-ees with their full financial planning picture—generally online.
Investment Advice: Prevalence
Do you offer investment guidance/advisory services?
What type of guidance or advice do you offer?*
*Multiple responses were allowed.
2016 Defined Contribution Trends 36Knowledge. Experience. Integrity.
Included in record- keeping fee 28.9%
Shared by participantand plan sponsor 13.3%
Plan sponsor 22.2%
Participant 33.3%
Don’t know 2.2%
Opt out 7.7%
Don’t know 15.4%
Opt in 76.9%
Investment Advice: Enrollment and Payment
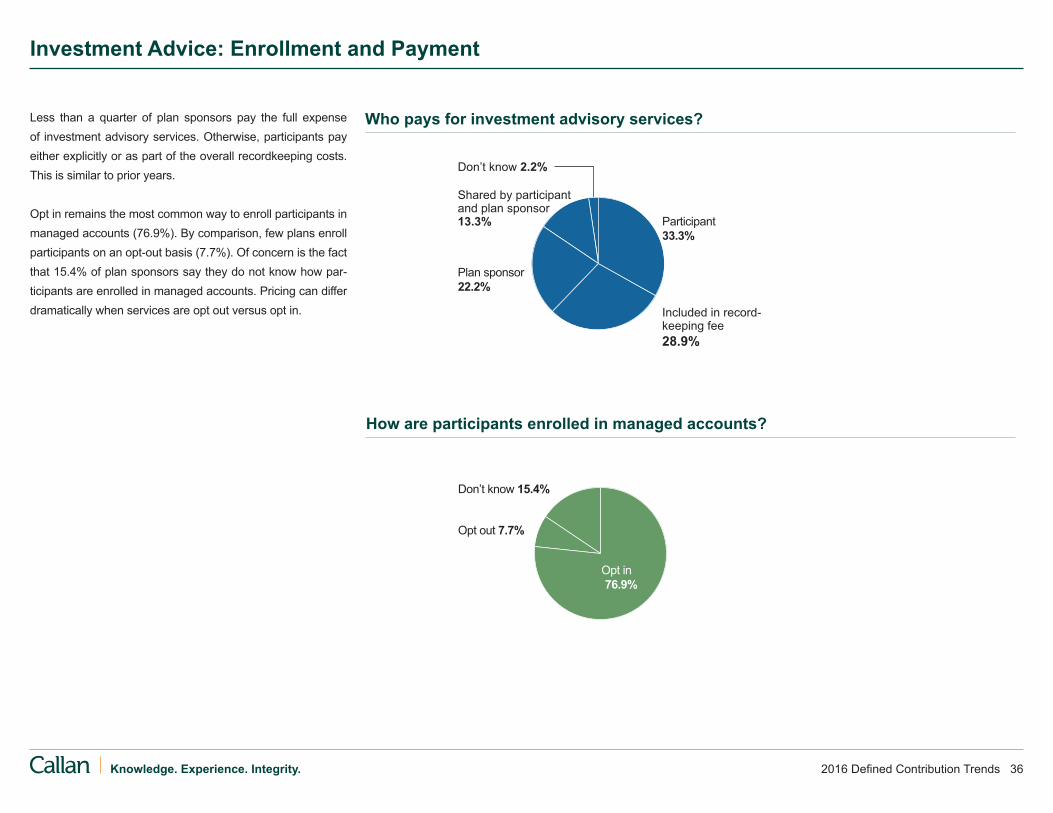
Less than a quarter of plan sponsors pay the full expense of investment advisory services. Otherwise, participants pay either explicitly or as part of the overall recordkeeping costs. This is similar to prior years. Opt in remains the most common way to enroll participants in managed accounts (76.9%). By comparison, few plans enroll participants on an opt-out basis (7.7%). Of concern is the fact that 15.4% of plan sponsors say they do not know how par-ticipants are enrolled in managed accounts. Pricing can differ dramatically when services are opt out versus opt in.
How are participants enrolled in managed accounts?
Who pays for investment advisory services?
2016 Defined Contribution Trends 37Knowledge. Experience. Integrity.
Financial wellness services(e.g., HelloWallet)
Investment Performance 9.6Low participant demand/ 4.7potential utilization
Too costly to participants 4.4
Dissatisfied with available 4.1products
Not a high priority 4.0
Unsure how to do so in 3.4current regulatory environment
Too costly to plan sponsor 2.6
Weighted Average Score (6=Most important)
Somewhat unlikelySomewhat likely
20.5%
64.1%
2.6%
Very likelyVery unlikely
12.8%
7.1%
88.1%
4.8% Eliminate servicesAdd services
49.2%
43.8%50.0%
52.6%39.5%
25.0%64.6%
35.1%54.4%
43.3%43.3%
38.7%45.2%
Very satisfied/somewhat satisfied
45.9%
Full financial planning(e.g., Ayco, E&Y)
One-on-oneadvisory services
Managed accounts(e.g., Financial Engines, Morningstar)
Guidance
On-site seminars
Online advice(e.g., Financial Engines, Morningstar)
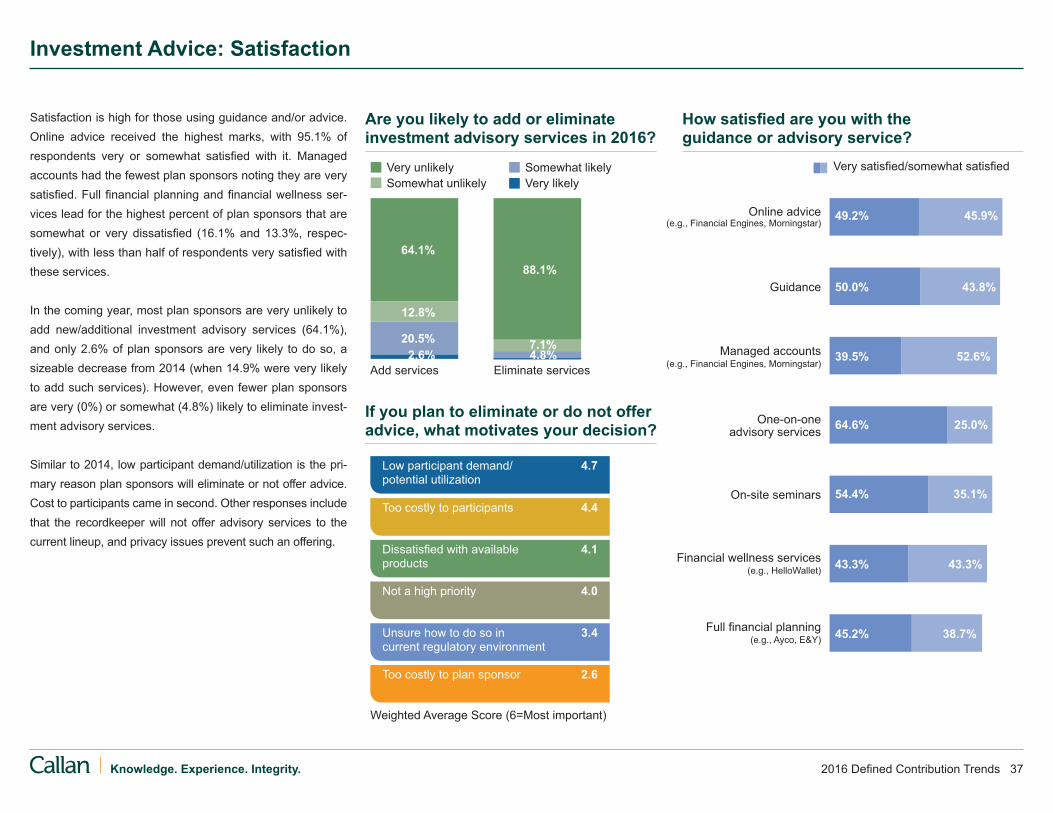
Satisfaction is high for those using guidance and/or advice. Online advice received the highest marks, with 95.1% of respondents very or somewhat satisfied with it. Managed accounts had the fewest plan sponsors noting they are very satisfied. Full financial planning and financial wellness ser-vices lead for the highest percent of plan sponsors that are somewhat or very dissatisfied (16.1% and 13.3%, respec-tively), with less than half of respondents very satisfied with these services.
In the coming year, most plan sponsors are very unlikely to add new/additional investment advisory services (64.1%), and only 2.6% of plan sponsors are very likely to do so, a sizeable decrease from 2014 (when 14.9% were very likely to add such services). However, even fewer plan sponsors are very (0%) or somewhat (4.8%) likely to eliminate invest-ment advisory services.
Similar to 2014, low participant demand/utilization is the pri-mary reason plan sponsors will eliminate or not offer advice. Cost to participants came in second. Other responses include that the recordkeeper will not offer advisory services to the current lineup, and privacy issues prevent such an offering.
Investment Advice: Satisfaction
Are you likely to add or eliminate investment advisory services in 2016?
If you plan to eliminate or do not offer advice, what motivates your decision?
How satisfied are you with the guidance or advisory service?

2016 Defined Contribution Trends 38Knowledge. Experience. Integrity.
2015
49.4% 56.6%43.5% 59.1% 61.3% 55.6%
201120122013 20102014
Seek to retain assets of terminated participants
Do not seek to retain assets of terminated participants
Do not seek to retain retiree assets
Seek to retain retiree assets
No policy Other/Don’t know
20142015
27.6%
37.1%
22.2%24.1%
31.4%
53.7%
15.7% 14.8%
22.9%
2.8%
20.0%
5.7%
In a shift from 2014, just 43.5% of plan sponsors have a policy for retaining retiree/terminated participant assets in 2015. A notable 53.7% of sponsors do not have a policy and another 2.8% do not know if they do.
Among plan sponsors that have a policy, more seek to retain assets (60.2%) than do not (39.8%). Of those seeking to retain post-employment assets, slightly more favor retaining retiree assets over assets of terminated participants.
Many of the plans seeking to retain assets offer an institu-tional structure that is more cost effective than what is avail-able in the retail market.
Post-Employment Assets
Does your plan have a policy for retaining retiree/terminated assets?
*Multiple responses were allowed.
If you have a policy with respect to retaining retiree/terminated assets within the plan, what is that policy?*
2016 Defined Contribution Trends 39Knowledge. Experience. Integrity.
Place restrictions on distributions
Restructure loan plan provisions^
Don't know
Actively seek to retain terminated/retiree assets
Offer partial distributions
Allow terminated/retired participants to continue paying off loans
Encourage rollovers in from other qualified plans
None
^e.g., reduce number of loans allowed, change loan frequency
41.6%43.6%
45.5%25.8%
30.9%n/a
16.9%16.0%
17.8%14.6%
16.0%19.8%
14.6%13.8%
18.8%13.5%
8.5%9.9%
5.6%3.2%
5.0%4.5%4.3%4.0%
20142015Plan to in 2016
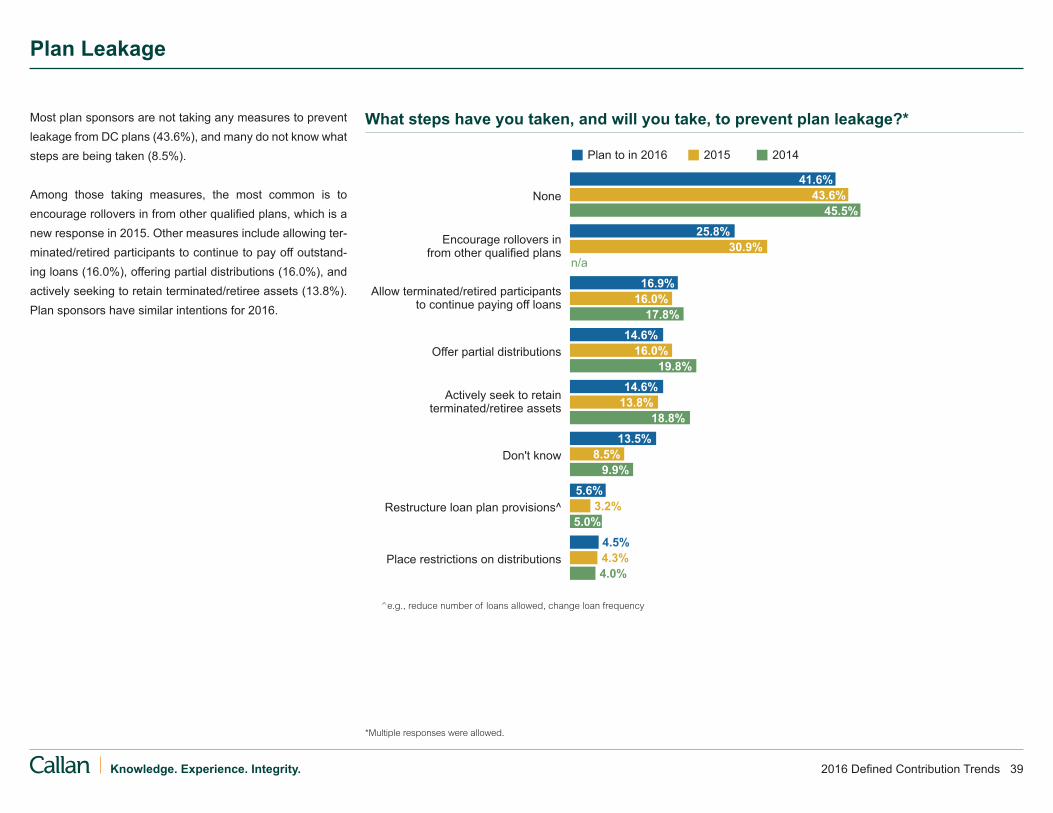
Most plan sponsors are not taking any measures to prevent leakage from DC plans (43.6%), and many do not know what steps are being taken (8.5%).
Among those taking measures, the most common is to encourage rollovers in from other qualified plans, which is a new response in 2015. Other measures include allowing ter-minated/retired participants to continue to pay off outstand-ing loans (16.0%), offering partial distributions (16.0%), and actively seeking to retain terminated/retiree assets (13.8%). Plan sponsors have similar intentions for 2016.
Plan Leakage
What steps have you taken, and will you take, to prevent plan leakage?*
*Multiple responses were allowed.
2016 Defined Contribution Trends 40Knowledge. Experience. Integrity.
Annuity placement services (e.g., Hueler Income Solutions)
In-plan guaranteed income for life product
(e.g., MetLife, Prudential)
Managed accounts/income drawdown modeling services
(e.g., Financial Engines)
Annuity as a form of distribution payment
Access to definedbenefit plan
None
53.7%58.9%
74.4%
30.6%
18.7%
11.1%
14.0%9.0%
11.1%
8.4%6.4%
4.6%
6.5%2.6%
1.9%
6.5%
5.1%
n/a
201320142015 Likely to offer in 2016Unlikely to offer in 2016
Longevity insurance
26.3% 73.7%
17.9% 82.1%
16.5% 83.5%
12.5% 87.5%
8.9% 91.1%
7.7% 92.3%
52.9% 47.1%
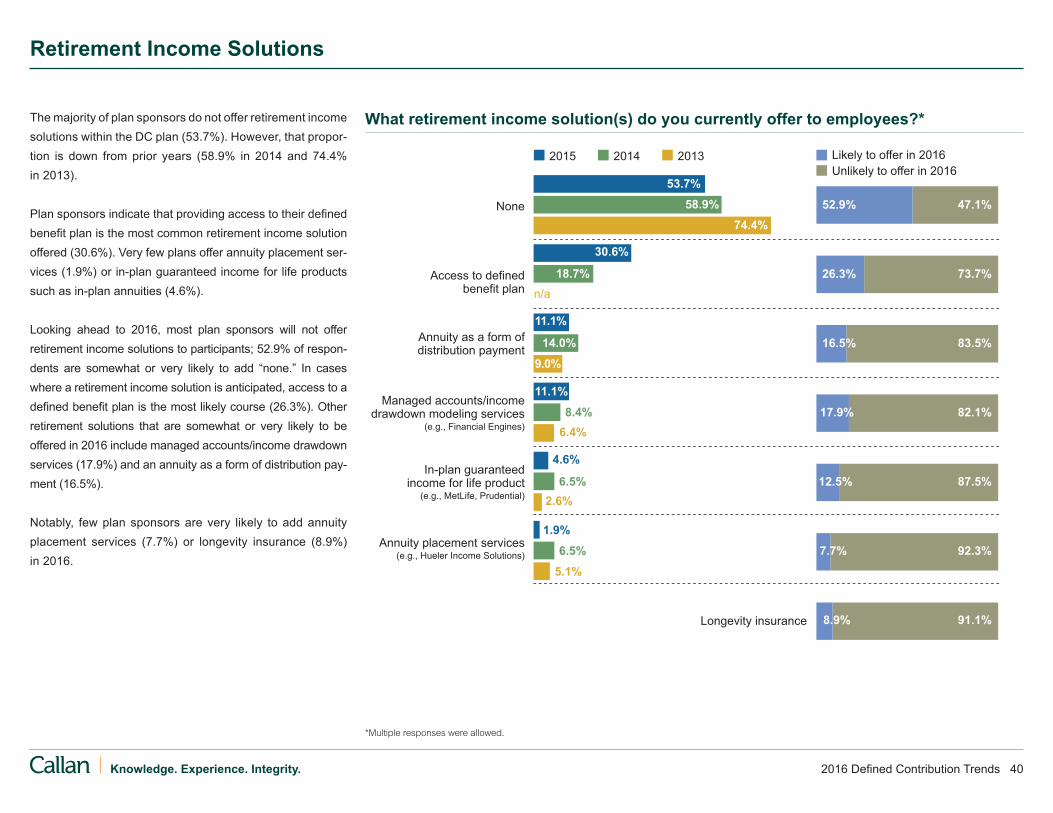
The majority of plan sponsors do not offer retirement income solutions within the DC plan (53.7%). However, that propor-tion is down from prior years (58.9% in 2014 and 74.4% in 2013).
Plan sponsors indicate that providing access to their defined benefit plan is the most common retirement income solution offered (30.6%). Very few plans offer annuity placement ser-vices (1.9%) or in-plan guaranteed income for life products such as in-plan annuities (4.6%).
Looking ahead to 2016, most plan sponsors will not offer retirement income solutions to participants; 52.9% of respon-dents are somewhat or very likely to add “none.” In cases where a retirement income solution is anticipated, access to a defined benefit plan is the most likely course (26.3%). Other retirement solutions that are somewhat or very likely to be offered in 2016 include managed accounts/income drawdown services (17.9%) and an annuity as a form of distribution pay-ment (16.5%).
Notably, few plan sponsors are very likely to add annuity placement services (7.7%) or longevity insurance (8.9%) in 2016.
Retirement Income Solutions
What retirement income solution(s) do you currently offer to employees?*
*Multiple responses were allowed.

2016 Defined Contribution Trends 41Knowledge. Experience. Integrity.
Weighted Average Score (5=Most important)
Investment Performance 9.6
Mos
t im
porta
nt
Difficult to communicate to 3.0participants
Lack of product knowledge 3.1
Unnecessary or not a priority 3.9
Availability of defined 3.8benefit plan Concerned about insurer risk 3.7
Uncomfortable/unclear about 3.6fiduciary implications Uncomfortable with available 3.5products
Too costly to plan sponsors/ 3.5participants
No participant need or demand 3.4
Products are not portable 3.4
Too administratively complex 3.3
Recordkeeper will not support 2.3this product
There are a number of reasons plan sponsors will not offer an annuity-type product in the near term. The top reason is plan sponsors believe it is unnecessary or not a priority. Other key reasons include participants having access to a defined benefit plan and concern over insurer risk.
Reasons for Not Offering Annuities
If your DC plan is unlikely to offer an annuity-type product in 2016, please indicate why by rating the following choices

2016 Defined Contribution Trends 42Knowledge. Experience. Integrity.
Weighted Average Score (6=Most focus)
Investment Performance 9.6
Mos
t foc
us
Reasonable 4.9
Well monitored and documented 4.6
Compliant with 2012 DOL fee 3.3 regulations
Well communicated to participants 3.2
The lowest possible 2.8
Equitable (e.g., administration fees 2.7are shared equally across all plan participants)
Other 0.9
When it comes to DC plan fees, plan sponsors’ greatest area of focus for 2016 is that fees will be reasonable, reflecting no change from the previous three years. The second high-est priority around fees is that they are sufficiently monitored and documented.
Fee regulations and the number of likely DC fee lawsuits likely continue to influence these focus areas. Ensuring that fees are equitable does not rank highly among plan spon-sors: excluding “other” responses, it came in last for the third consecutive year.
Fees: Areas of Focus in 2016
Rank your key areas of focus around plan fees for 2016. It is important that fees are:

2016 Defined Contribution Trends 43Knowledge. Experience. Integrity.
Don’t know
Never
Over 36 months ago
Past 36 months
Past 24 months
Past 12 months
4.5%
2011 2012 20152013
85.5%
2014
4.5%3.6%1.8%
Don't knowOtherActuaryInvestment manager
RecordkeeperPlan sponsorConsultant/advisor
35.9%
45.6% 43.4%49.1%
20142015
56.3%53.8%
6.6% 4.9% 5.7%1.0% 1.9%1.9% 1.9% 1.0%
0%
20%
40%
60%
80%
100%
The number of plan sponsors that calculated their DC plan fees within the past 12 months remains flat at 85.5% between 2014 and 2015. This is down from a high of 92.9% in 2013. Ninety percent calculated plan fees within the past two years, down from 99.0% in 2013. While no plan spon-sors said that they have never done so, the percent of plan sponsors who did not know increased this year (4.5%).
In many cases, a combination of entities assess fees. Fees are most frequently calculated by the consultant (53.8%), plan sponsor (49.1%), and/or recordkeeper (43.4%). Less than a quarter of plan sponsors report they are solely responsible for calculating plan fees (21.7%), down from 2014 (44.8%).
Fee Calculation
When was the last time you calculated fees for your DC plan?
Who was responsible for your fee calculation?*
*Multiple responses were allowed.
2016 Defined Contribution Trends 44Knowledge. Experience. Integrity.
Don’t know
Yes
No
76.0%
17.3%6.7%
OtherActuaryInvestmentmanager
Record-keeper
Plan sponsor
Consultant/advisor
7.6%
27.8%
75.9%
Don't knowCustomized survey of other plan sponsors
Placing plan out to bid (i.e., RFP)
Data from individual recordkeeper’s database
Customized survey of multiple recordkeepers (i.e., RFI)
General benchmarking data (such as from CEM or CIEBA)
Consultant database
20.0%24.7% 27.7%
52.3%
26.0%
39.0%43.1%
54.5%
20142015
15.6%
6.2%7.8%
26.2%
11.7%n/a
1.3%1.3%3.8%
Additional category (2015/2014 data): Other (1.3%/1.5%)
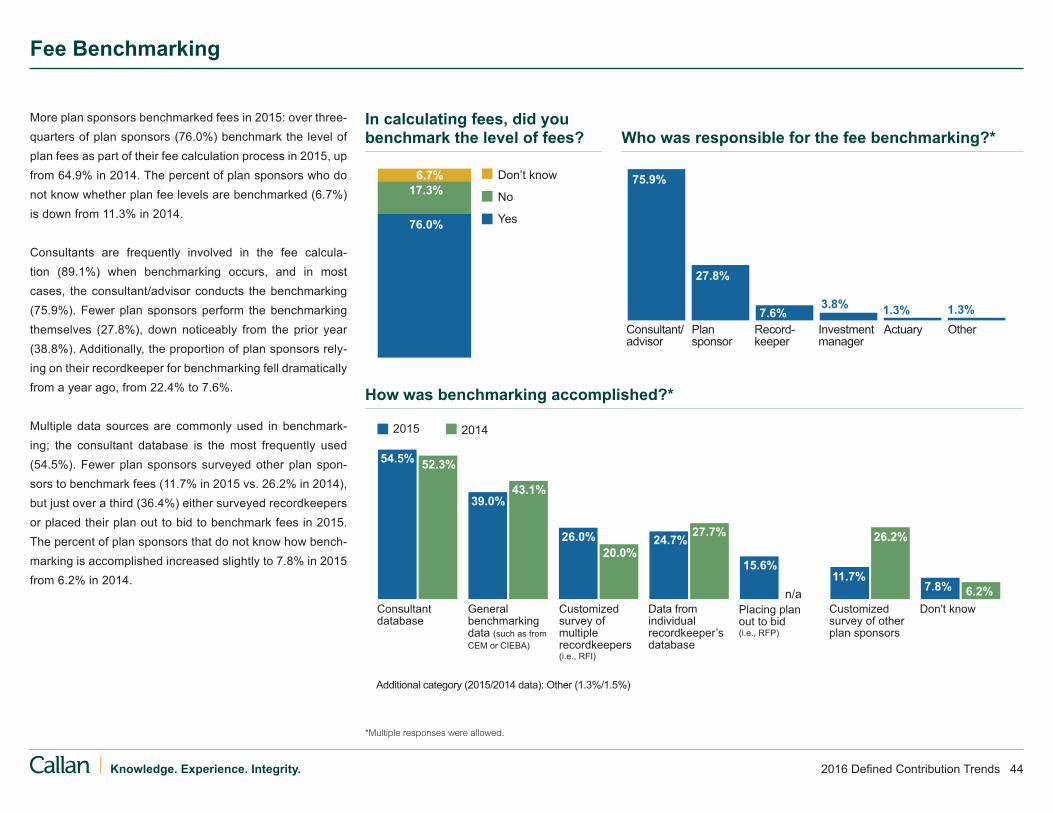
More plan sponsors benchmarked fees in 2015: over three-quarters of plan sponsors (76.0%) benchmark the level of plan fees as part of their fee calculation process in 2015, up from 64.9% in 2014. The percent of plan sponsors who do not know whether plan fee levels are benchmarked (6.7%) is down from 11.3% in 2014.
Consultants are frequently involved in the fee calcula-tion (89.1%) when benchmarking occurs, and in most cases, the consultant/advisor conducts the benchmarking (75.9%). Fewer plan sponsors perform the benchmarking themselves (27.8%), down noticeably from the prior year (38.8%). Additionally, the proportion of plan sponsors rely-ing on their recordkeeper for benchmarking fell dramatically from a year ago, from 22.4% to 7.6%.
Multiple data sources are commonly used in benchmark-ing; the consultant database is the most frequently used (54.5%). Fewer plan sponsors surveyed other plan spon-sors to benchmark fees (11.7% in 2015 vs. 26.2% in 2014), but just over a third (36.4%) either surveyed recordkeepers or placed their plan out to bid to benchmark fees in 2015. The percent of plan sponsors that do not know how bench-marking is accomplished increased slightly to 7.8% in 2015 from 6.2% in 2014.
Fee Benchmarking
In calculating fees, did you benchmark the level of fees?
How was benchmarking accomplished?*
Who was responsible for the fee benchmarking?*
*Multiple responses were allowed.
2016 Defined Contribution Trends 45Knowledge. Experience. Integrity.
Changed the way fees are communicated to participants
Initiated a manager search
Increased services
Implemented an ERISA-type account
Other
Rebated excess revenue sharing back to participants
Initiated a recordkeeper search
Changed the way fees are paid^
Reduced plan fees
Kept fee levels the same
17.5%
49.5%
21.4%
32.7%
20142015
36.1%
43.9%
9.2%
4.1%
8.2%
7.2%
4.1%
4.1%
4.1%
4.1%
5.2%
3.1%
0.0%
2.0%
8.2%
2.1%
^e.g., change from use of revenue sharing to an explicit participant fee.
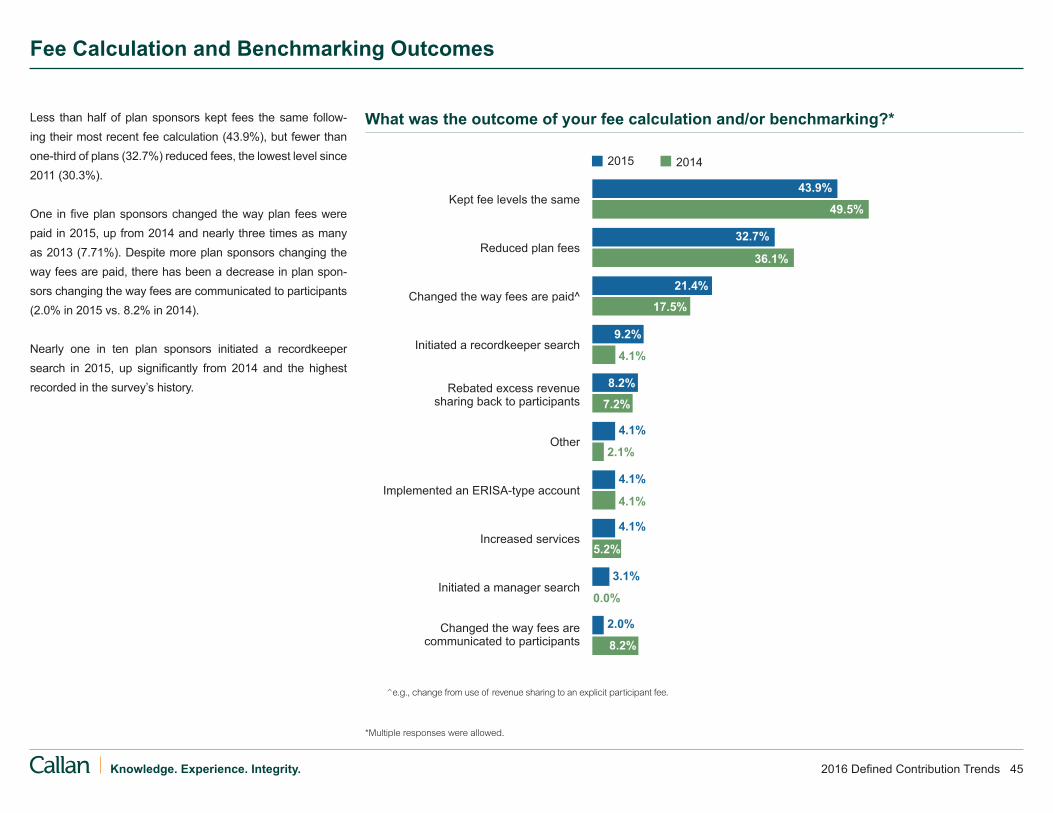
Less than half of plan sponsors kept fees the same follow-ing their most recent fee calculation (43.9%), but fewer than one-third of plans (32.7%) reduced fees, the lowest level since 2011 (30.3%).
One in five plan sponsors changed the way plan fees were paid in 2015, up from 2014 and nearly three times as many as 2013 (7.71%). Despite more plan sponsors changing the way fees are paid, there has been a decrease in plan spon-sors changing the way fees are communicated to participants (2.0% in 2015 vs. 8.2% in 2014).
Nearly one in ten plan sponsors initiated a recordkeeper search in 2015, up significantly from 2014 and the highest recorded in the survey’s history.
Fee Calculation and Benchmarking Outcomes
What was the outcome of your fee calculation and/or benchmarking?*
*Multiple responses were allowed.

2016 Defined Contribution Trends 46Knowledge. Experience. Integrity.
Investment management fees are most often entirely paid by participants (88.1%), generally through fund expense ratios. In contrast, 52.3% of plan sponsors indicate all administra-tive fees are paid by participants; 78.9% note that at least some administrative fees are participant paid.
In just over half of cases (51.8%), participants pay adminis-trative fees either solely through revenue sharing or through a combination of revenue sharing and explicit per-participant fees. This proportion continues to decrease and is notably down from its peak in 2012 (66.6%).
While the proportion of plan sponsors solely using an explicit per-participant dollar fee to pay for administration is flat, the proportion of plan sponsors that solely use a percentage fee increased from 10.7% in 2014 to 20.0% in 2015.
2015 2013 2012
4.3%
36.2%
15.9%
13.0%
6.4%89.4%
30.4%
4.3%
100% paid by plan participants (e.g., through expense ratios of investment funds)
Partially paid by plan sponsor and plan participants
100% paid by plan sponsor
Other/Don’t know
88.1%5.5%5.5%0.9%
52.3%
20.2%
26.6%
0.9%
2014
27.0%
20.6%
15.9%
33.3%
3.2%
35.7%
22.6%
10.7%
26.2%
4.8%
29.4%
22.4%
20.0%
22.4%
5.9%
Through a combination of revenue sharing and an explicit per-participant charge
Other/Don’t know
Solely through revenue sharing or some kind of administrative allocation back from the investment fund
Solely as a percentage fee that is assessed across some or all funds outside of the investment management fees
Solely through an explicit per-participant dollar fee
78.9%at least partially paid by participants
93.6% at least partially paid by participants
Fee Payment
How are the plan’s investment management fees paid?
How do participants pay for the administration of the plan?
How are the plan’s administrative fees paid?
Revenue sharing: A practice whereby a portion of a fund’s expense ratio may be used to offset administra-tive expenses. Commonly, this may be a sub-transfer agency fee or a 12b-1 fee. It may also be an internal allocation made between a recordkeeper’s investment management and recordkeeping divisions.

2016 Defined Contribution Trends 47Knowledge. Experience. Integrity.
2015
Don’t know
100%
76% to 99%
2.3%22.7%
6.8%
15.9%
13.6%
25.0%
20132014 2012
13.6%
51% to 75%
26% to 50%
10% to 25%
<10%
10.5%
2.6%
18.4%
31.6%
18.4%
10.5%
2.1%8.3%
14.6%
16.7%
25.0%
14.6%
16.3%
14.0%
9.3%
14.0%
23.3%
18.8%
23.3%
7.9%
Nearly half of plans with revenue sharing (46.6%) indicate that only a quarter or fewer of their funds generate revenue in this manner.
When only some funds pay revenue sharing, it means administrative payments are not equitably shared among plan participants. Indeed, it is possible for some participants to pay substantial administrative costs and others to pay none, simply based on fund selection.
Of concern is the fact that the percent of plan sponsors that do not know what portion of their funds pay revenue sharing nearly doubled this year versus last (16.3% in 2015 vs. 8.3% in 2014). Revenue sharing has been the subject of numer-ous lawsuits.
Revenue Sharing
What percentage of the funds in the plan offer revenue sharing or some kind of administrative allocation back from the investment fund?

2016 Defined Contribution Trends 48Knowledge. Experience. Integrity.
Over two-thirds of the plans with revenue sharing have an ERISA account, up from 26.6% in 2009. The percent of plan sponsors that do not know if they have an ERISA account decreased from 9.6% in 2014 to 6.8% in 2015; however, this is still up from 2013 when no participants said they did not know.
In most cases (66.7%), reimbursed administrative fees are held as a plan asset. This is up from 61.5% in 2014.
ERISA accounts are most commonly used to defray plan costs such as auditing (66.7%), consulting (63.0%), legal (48.1%), and communication (37.0%) expenses. Overall these num-bers are down from 2014. Instead, more plans are rebating excess revenue sharing back to plan participants.
This practice has increased from 36.0% of plans in 2014 to 44.4% in 2015. These reimbursements can accrue to all par-ticipants in the plan regardless of their fund choices or can be rebated directly back to participants who were in the fund actually generating the revenue sharing. This increase is con-sistent with the more widespread ability of recordkeepers to support rebating.
Yes No Don’t know
25.0%
68.2%
6.8%
0%
20%
40%
60%
80%
100%
2015201420132012201120102009
Held as assets of the plan
Held outside the plan
Don’t know
18.5%
14.8%
66.7%
Other/Don't knowCommunicationExcess revenue sharing is rebated to plan partici-pants' accounts
LegalConsultingAuditing
56.0%
72.0%
48.1%
63.0%
80.0%
66.7%
20142015
44.4%
8.0%
22.2%
52.0%
37.0%36.0%
ERISA Accounts for Plans with Revenue Sharing
Do you currently have an ERISA expense reimbursement account?
Are ERISA account assets held out-side the plan or as assets of the plan?
What expenses are paid through the ERISA account?*
*Multiple responses were allowed.
Excess revenue sharing occurs when the administra-tive offsets generated exceed the actual cost of admin-istering the plan.
ERISA accounts, or expense reimbursement accounts, are used as a repository for excess revenue sharing within DC plans. These monies are made available to pay for legitimate plan expenses.

2016 Defined Contribution Trends 49Knowledge. Experience. Integrity.
Change part or all of the expense structure from plan sponsor to participant paid
Conduct a trustee/custodian search
Move some or all funds from activelymanaged to index funds
Change part or all of the expense structure from participant to plan sponsor paid
Renegotiate investment manager fees
Unbundle the plan by using collective trusts and/or separate accounts
Conduct a recordkeeper search
Change the way fees are paid
Reduce or eliminate the use of revenue sharing to pay for plan expenses
Switch certain funds to lower-fee share classes
Renegotiate recordkeeper fees
Rebate participant fees/revenue sharing
Conduct a fee study 32.0% 20.0% 25.3% 22.7%
29.4% 23.5% 10.3% 36.8%
23.1% 10.3% 25.6% 41.0%
20.8% 40.3% 12.5% 26.4%
18.5% 15.4% 10.8% 55.4%
12.7% 12.7% 23.9% 50.7%
12.0% 8.0% 10.7% 69.3%
8.5% 6.8% 15.3% 69.5%
5.6% 23.9% 33.8% 36.6%
12.9% 82.3%
3.1% 10.9% 21.9% 64.1%
13.6% 78.8%
9.1% 83.6%
Very likely Somewhat likely Somewhat unlikely Very unlikely
3.2% 1.6%
3.0% 4.6%
1.8% 5.5%
More than half of plan sponsors are either somewhat or very likely to conduct a fee study in 2016 (52.0%). This is in line with last year (51.7%). In a significant increase from last year, 52.9% of plan sponsors are somewhat or very likely to rebate participant fees in 2016, and 61.1% are somewhat or very likely to switch certain funds to lower-fee share classes (up from 36.5% and 46.6% in 2014, respectively).
About a third (33.9%) of plan sponsors say that they are somewhat or very likely to reduce or eliminate the use of revenue sharing to pay for plan expenses.
Few plan sponsors intend to shift who pays for plan expenses. Notably, several plan sponsors indicate that they have already done many of the activities reflected on the list in prior years.
Fee Initiatives in 2016
What steps around fees are you most likely to engage in next year (2016)?

2016 Defined Contribution Trends 50Knowledge. Experience. Integrity.
Investment Performance 9.6Contribution levels 8.0
Plan participation 7.6
Investing 7.3(e.g., market activity, diversification, etc.)
Retirement income adequacy 7.3
Financial wellness 6.3
Managing income in retirement 5.7
Fees 5.5
Additional categories: Loans (3.8), Withdrawals (3.3), Company stock (2.4), Other (1.8)
Other
Text messaging
Blogs
Employee meetings
Social media (e.g., Facebook, Twitter)
Mobile apps
Postal mail
Company website/intranet
84.1%
86.9%
91.6%
3.7%
21.5%
6.5%
0.9%Weighted Average Score (10=Most focus)
0.9%
3.7%
Contribution levels rank as the highest likely area of focus for DC participant communication for 2016, followed by plan participation. In third place, plan sponsors will be equally focused on investing and retirement income ade-quacy. Financial wellness, a new option in this year’s sur-vey, ranks fifth.
Company stock ranks at the bottom of list again in terms of communication focus for plan sponsors.
In terms of media channels, the company website emerges as the most used for plan communications (91.6%). Email finished second with 86.9% of plan sponsors using it to com-municate plan information. The next most prevalent media channel, postal mail, drops out of the number one spot for the first time. Still, 84.1% of plan sponsors communicate plan information using postal mail.
Mobile apps increased from 12.4% in 2014 to 21.5% in 2015, reflecting recordkeepers’ advances in this space. Other day-to-day popular media channels (text messaging, social media, and blogs) are not yet very common in the DC com-munication space. Only 3.7% of plan sponsors intend to use employee meetings to communicate plan information.
Participant Communication
Which areas of communication will you focus on in 2016?
What media channels do you use to communi-cate plan changes, information, benefits, etc. to participants?*
*Multiple responses were allowed.

2016 Defined Contribution Trends 51Knowledge. Experience. Integrity.
Other/Don't know
Verbally, via the benefits center
Through other mailed statement
Through a third-party advice provider
On the participant statement
Via the benefits website
66.7%
35.0%
16.7%
15.0%
3.3%
6.7%
80.0%
40.0%
12.0%
16.0%
6.7%
20142015
30.8%
9.3%3.7% Don’t know
No
No, but plan to add in 2016
Yes
56.1%
1.3%
Other/Don't know
Third-party provider
Plan sponsor
Advice provider
Recordkeeper81.4%
20.3%21.1%
10.5%
1.7%
75.0%
40.0%
15.3%
3.4%6.6%
20142015
5.3%Other/Don't know
As a projection of annual income in retirement
As a projected balance at retirement
As a projection of monthly income in retirement
71.2%
32.2%
23.7%
8.5%
69.7%
35.5%
30.3%
20142015
5.3%
Plan sponsors providing a retirement income projection, showing plan participants how their current balance may translate into income in retirement, decreased from last year (56.1% in 2015 vs. 70.1% in 2014).
As in past years, the benefits website is the most common way to provide the retirement income projection. Participant state-ments also show the projection (35.0% in 2015 vs. 40.0% in 2014). This information is also disseminated via other mailed statements (15.0%) or through a third party (16.7%).
The recordkeeper typically provides the projection calcula-tion (81.4%). It is usually shown as a projection of monthly income in retirement (71.2%). However, 32.2% of respon-dents also show the projected balance at retirement on a stand-alone basis or coupled with the income projection.
Retirement Income Projections
Do you provide a retirement income projection for participants?
How is the projected retirement income calculation displayed?*
How is the retirement income projection provided?*
Who provides the projection calculation?*
*Multiple responses were allowed.

2016 Defined Contribution Trends 52Knowledge. Experience. Integrity.
Lori Lucas, CFA, is an Executive Vice President and Defined Contribution Practice Leader at Callan Associates. Lori is
responsible for setting the direction of Callan’s DC business, providing DC support both internally to Callan’s consultants
and externally to Callan’s clients, and developing research and insights into DC trends for the benefit of clients and the
industry. Lori is a member of Callan’s Management Committee and is a shareholder of the firm.
Formerly, Lori was Director of Retirement Research at Hewitt Associates. Lori has also served as a vice president at Ibbot-
son Associates, a pension fund consultant at J.H. Ellwood & Associates, and an analyst and product development leader
at Morningstar, Inc.
Lori received a Masters from the University of Illinois and a BA from Indiana University. Additionally, she earned the right
to use the Chartered Financial Analyst designation. Lori is a former columnist for Workforce Management online magazine
and her views have been featured in numerous publications. She is Chair of the Employee Benefit Research Institute’s Re-
search Committee, and she is Chair of the Defined Contribution Institutional Investment Association. Lori is also a frequent
speaker at pension industry conferences.
Jamie McAllister is a Vice President and defined contribution consultant in Callan’s Fund Sponsor Consulting group
based in the Chicago office. Jamie joined Callan in 2011 and is responsible for providing support to Callan’s DC clients and
consultants, including DC provider searches, structure reviews, fee analyses, maintaining the recordkeeping database,
and developing DC research. In addition to her role at Callan, Jamie regularly participates in judging the Innovator Awards
sponsored by Pensions & Investments (P&I) and the Defined Contribution Institutional Investment Association (DCIIA) as
well as the Plan Sponsor Council of America (PSCA) Signature Awards. She is a shareholder of the firm.
Jamie has over 10 years of defined contribution experience. Prior to joining Callan, Jamie was an investment consultant
to defined contribution, defined benefit, and endowment clients at Hewitt EnnisKnupp. Jamie also served as an analyst in
Aon Hewitt’s Human Resources Outsourcing Group where she primarily worked with the administration of large defined
contribution plans.
Jamie earned a BBA in Finance with a concentration in international business from the University of Notre Dame.
About the Authors

About Callan AssociatesCallan was founded as an employee-owned investment consulting firm in 1973. Ever since, we have empowered institutional clients with creative, customized investment solutions that are uniquely backed by proprietary research, exclusive data, ongoing education and decision support. Today, Callan advises on nearly $2 trillion in total assets, which makes us among the largest independently owned investment consulting firms in the U.S. We use a client-focused consulting model to serve public and private pension plan sponsors, endowments, foundations, operating funds, smaller investment consulting firms, investment managers, and financial intermediaries. For more information, please visit www.callan.com.
About the Callan Investments InstituteThe Callan Investments Institute, established in 1980, is a source of continuing education for those in the institutional investment community. The Institute conducts conferences and workshops and provides published research, surveys and newsletters. The Institute strives to present the most timely and relevant research and education available so our clients and our associates stay abreast of important trends in the investments industry.
For more information about this report, please contact: Lori Lucas, CFA, Defined Contribution Practice Leader or Jamie McAllister, Defined Contribution Consultant at 312.346.3536
© 2016 Callan Associates Inc.

Corporate Headquarters
Callan Associates600 Montgomery StreetSuite 800San Francisco, CA 94111800.227.3288415.974.5060
www.callan.com
Regional Offices
Atlanta800.522.9782
Chicago800.999.3536
Denver855.864.3377
New Jersey800.274.5878