Embed Size (px)
Citation preview

The Loanable Funds theory
We use the term “loanable funds market” to describe the arrangements and institutions
by which saving of households is made available to borrowers.
Factor income
Consu
mpt
ion
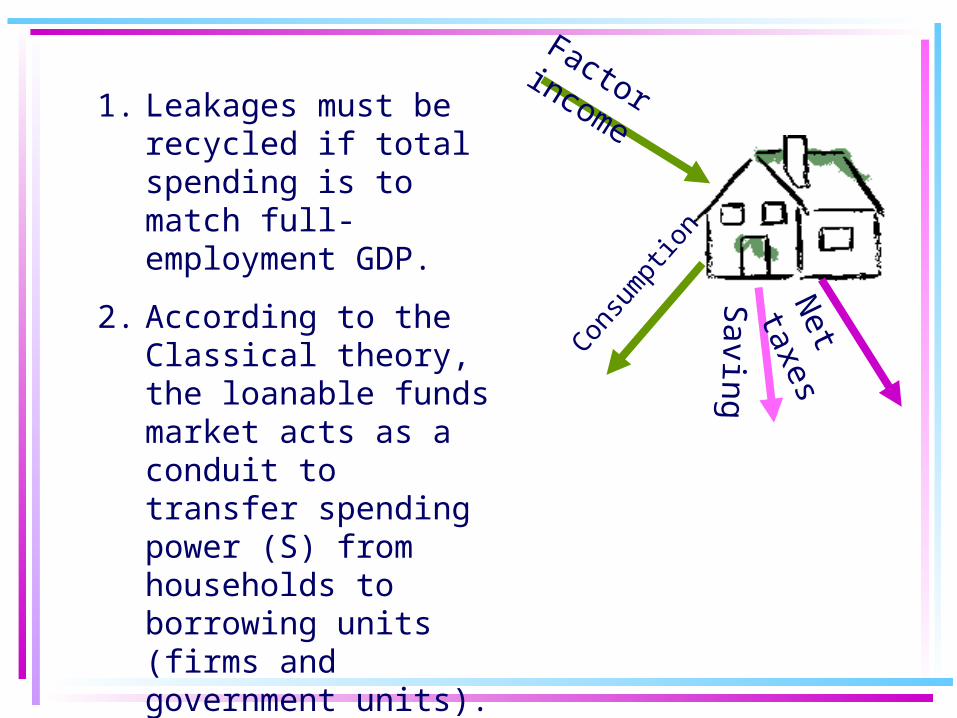
1. Leakages must be recycled if total spending is to match full-employment GDP.
2. According to the Classical theory, the loanable funds market acts as a conduit to transfer spending power (S) from households to borrowing units (firms and government units).
3. Saving (S) is the “source” of loanable funds.
Saving
Net taxes

1. To have a more secure future, to start a business, to finance a child’s education, to satisfy miserliness, . . .
2. To earn interest. We view interest as
the “reward for saving” or the “reward for postponing
gratification.”
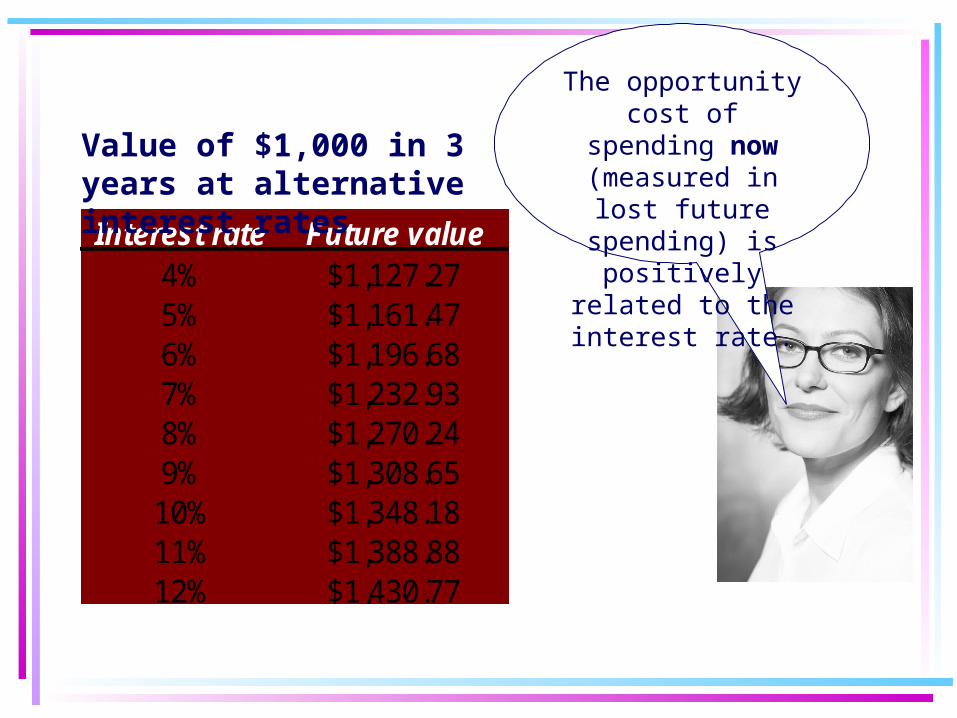
Interest rate Future value4% $1,127.275% $1,161.476% $1,196.687% $1,232.938% $1,270.249% $1,308.6510% $1,348.1811% $1,388.8812% $1,430.77
Value of $1,000 in 3 years at alternative interest rates
The opportunity cost of spending now (measured in lost
future spending) is positively related to
the interest rate.
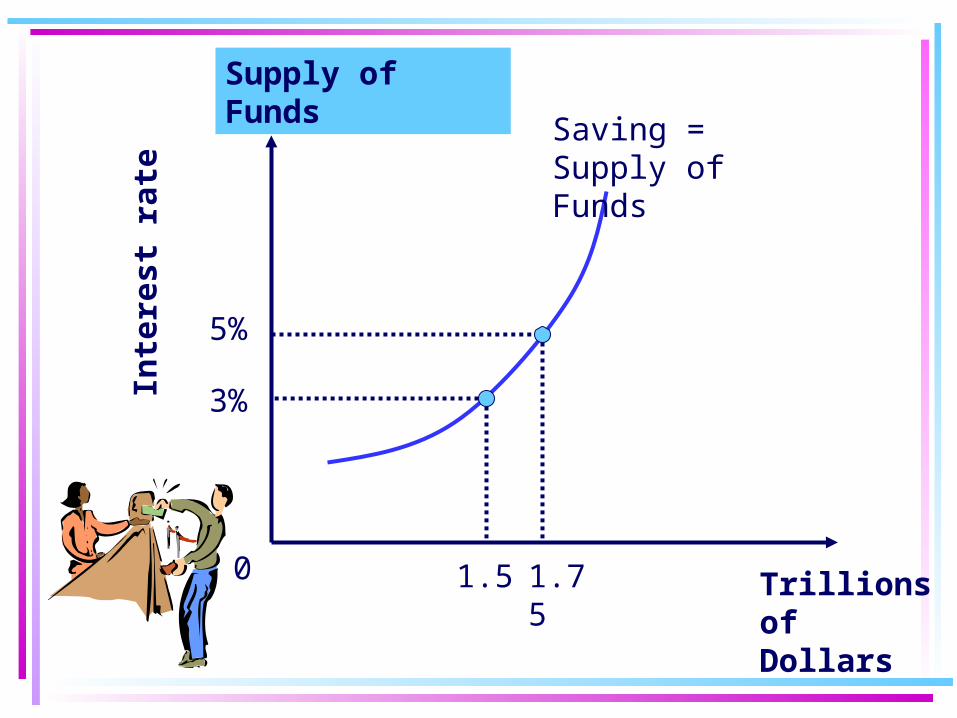
Saving = Supply of Funds
Trillions of Dollars
0
Inte
rest
rat
e
3%
5%
1.5 1.75
Supply of Funds

•To finance the acquisition of long-lived capital goods.
•The rate of interest is the cost of borrowing or the price of loanable funds.
•The investment demand curve indicates the level of investment spending at various interest rates.
•As the interest rate decreases, more investment projects become attractive in the assessment of business decision-makers—hence, the investment demand function is downward-sloping with respect to the interest rate.
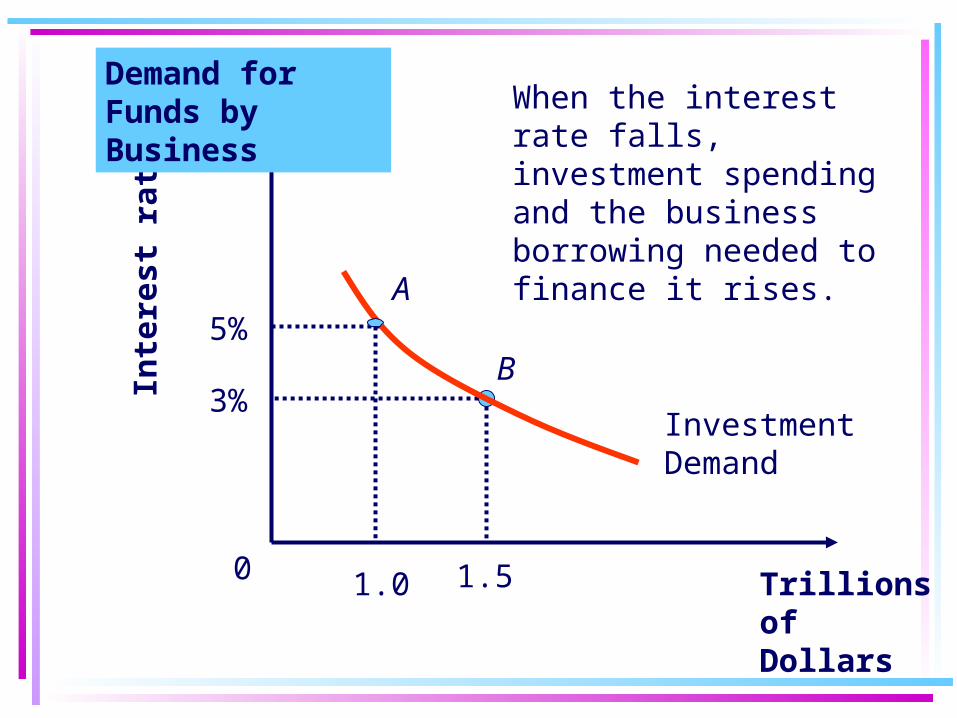
Investment Demand
Trillions of Dollars
0
Inte
rest
rat
e
3%
5%
1.5
Demand for Funds by Business
1.0
A
B
When the interest rate falls, investment spending and the business borrowing needed to finance it rises.
Public sector borrowing
•Let G denote public sector (or government) spending for goods and services in a year
•T is net tax receipts in a year.
•If G is greater than T, the the public sector has a budget deficit equal to G – T.
•If T is greater than G, then the public sector has a surplus equal to T – G.
•If the public sector has a budget deficit, it must borrow.
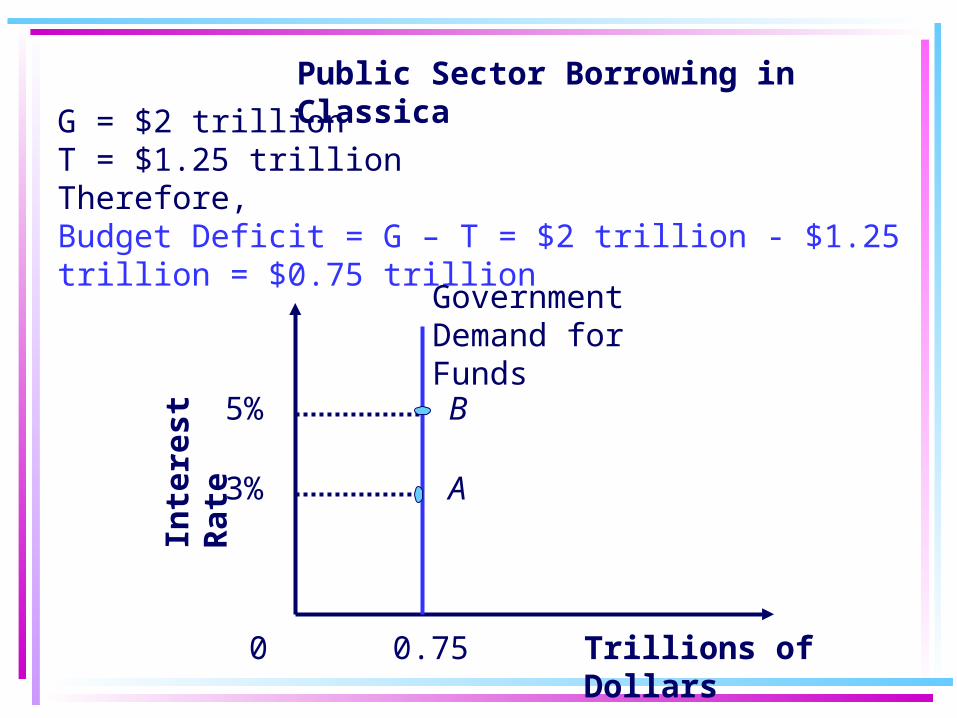
Public Sector Borrowing in Classica
G = $2 trillionT = $1.25 trillionTherefore, Budget Deficit = G – T = $2 trillion - $1.25 trillion = $0.75 trillion
0.750
5%
3%
Government Demand for Funds
I nt e
rest
Ra t
e
Trillions of Dollars
A
B
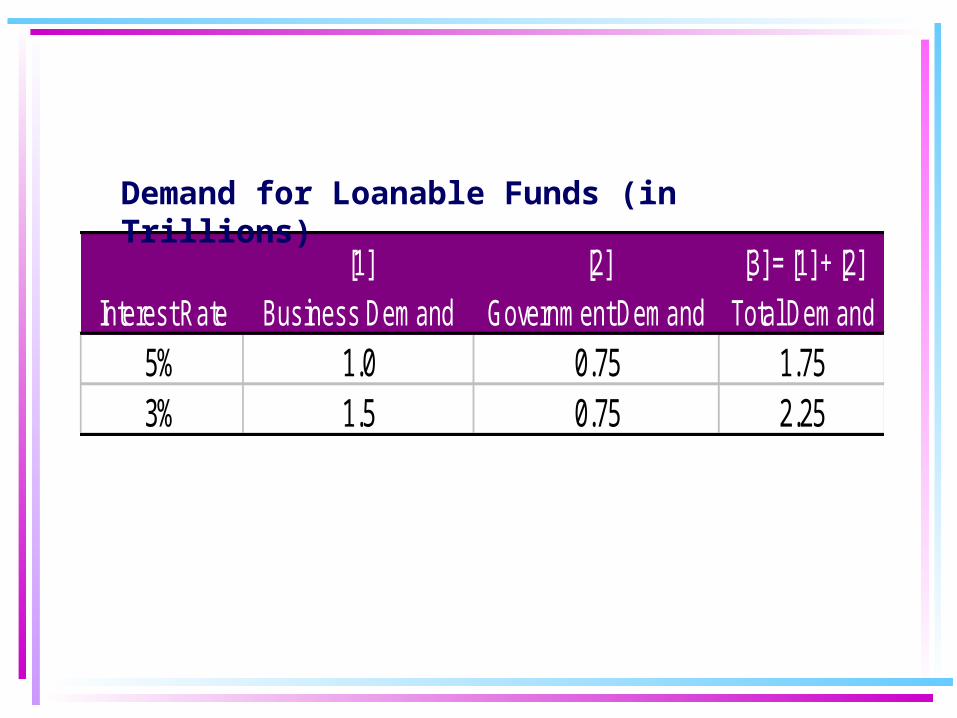
[1] [2] [3] = [1] + [2]
Interest Rate Business Demand Government Demand Total Demand
5% 1.0 0.75 1.753% 1.5 0.75 2.25
Demand for Loanable Funds (in Trillions)
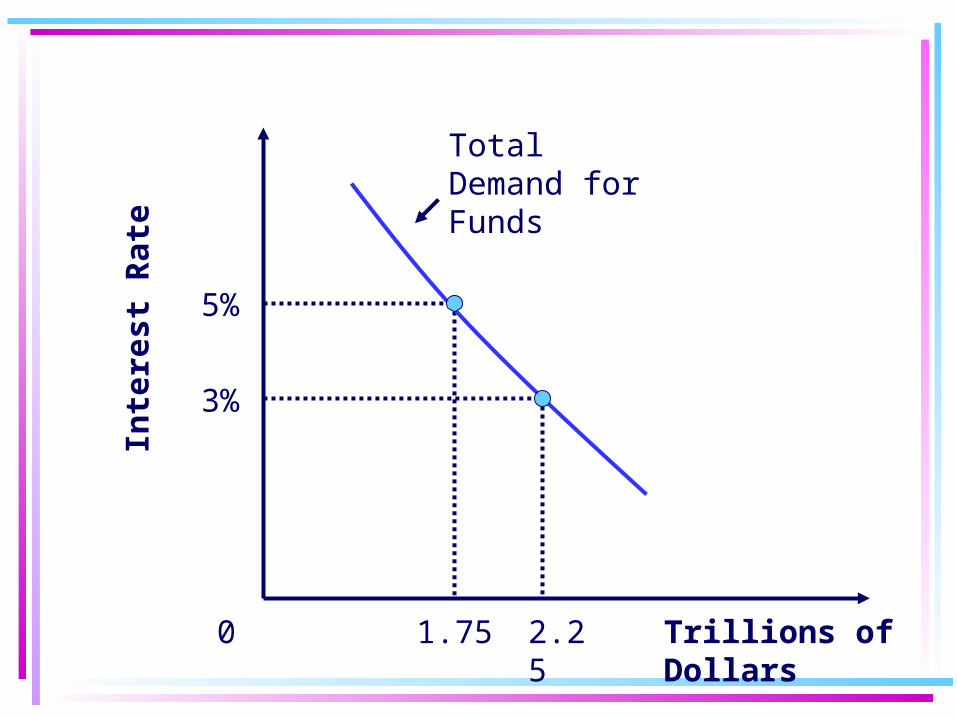
Inte
rest
Rat
e
Trillions of Dollars0
3%
5%
1.75 2.25
Total Demand for Funds
Inte
rest
Rat
e
Trillions of Dollars
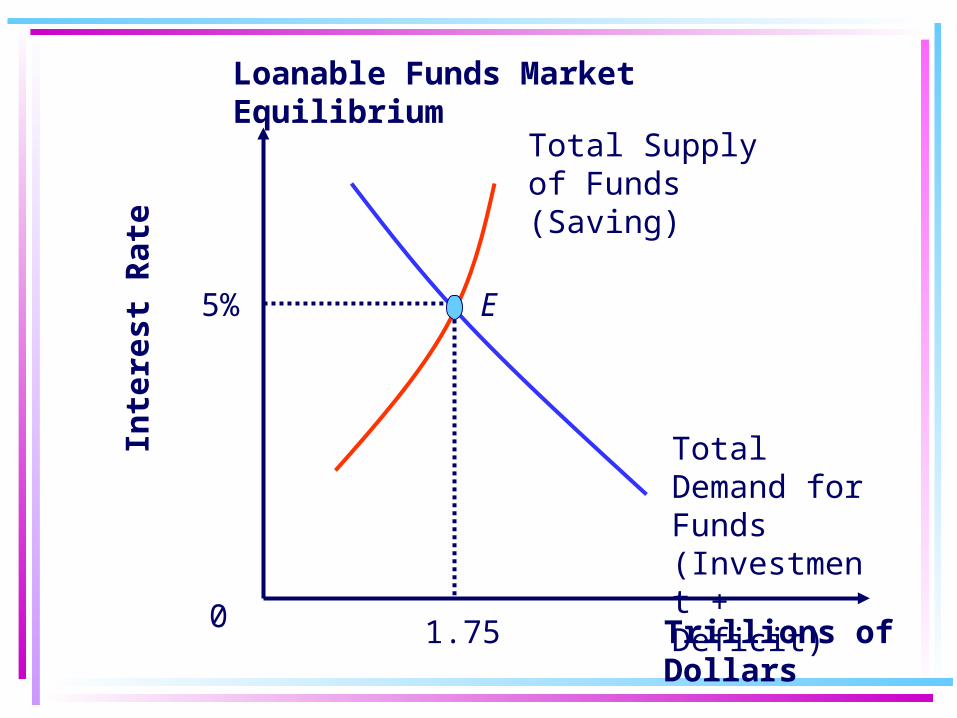
Loanable Funds Market Equilibrium
Total Supply of Funds (Saving)
Total Demand for Funds (Investment + Deficit)
E5%
0 1.75
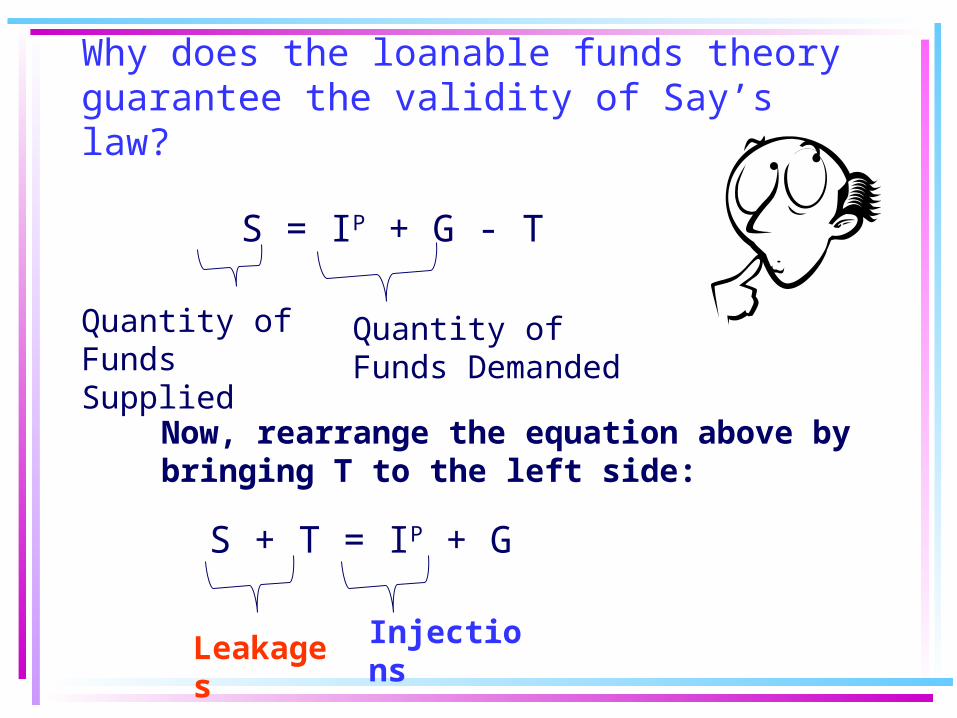
Why does the loanable funds theory guarantee the validity of Say’s law?
S = IP + G - T
Quantity of Funds Supplied
Quantity of Funds Demanded
Now, rearrange the equation above by bringing T to the left side:
S + T = IP + G
Leakages Injections

So long as the loanable funds market “clears,” leakages (Saving) will be offset to
injections (investment and government spending).
Firms
Government
Households
Resource Markets
GoodsMarkets
Loanable Funds Markets
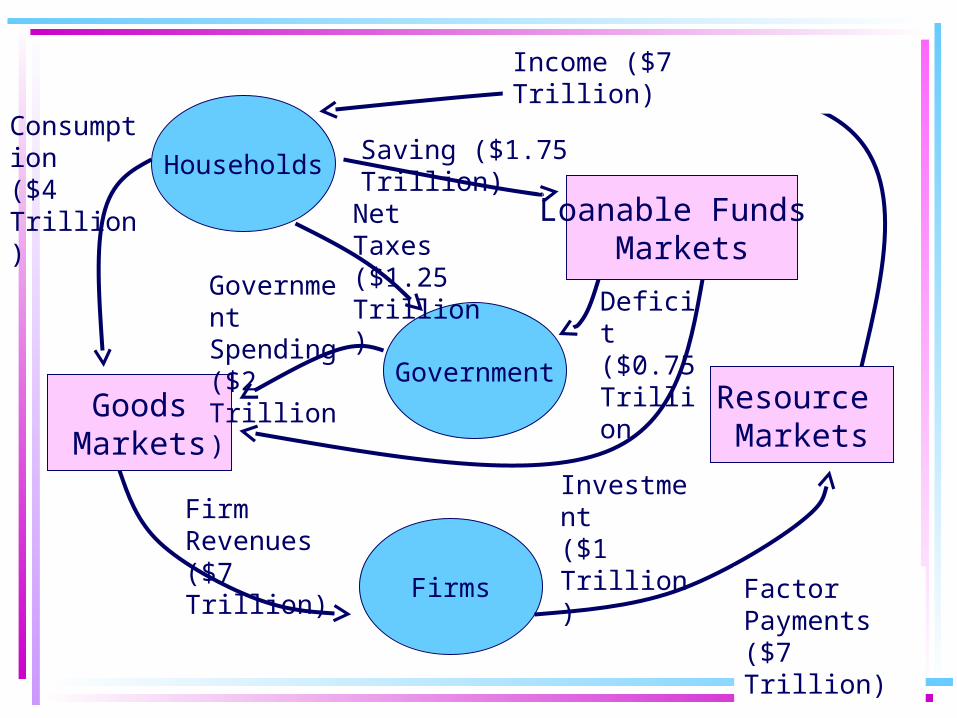
Income ($7 Trillion)
Factor Payments ($7 Trillion)
Government Spending ($2 Trillion)
Investment ($1 Trillion)
Consumption ($4 Trillion)
Firm Revenues ($7 Trillion)
Deficit ($0.75 Trillion
Income ($7 Trillion)
Saving ($1.75 Trillion)
Net Taxes ($1.25 Trillion)
Changes in government spending, transfer payments, and taxes designed to change total spending in the economy and thereby influence total output and employment.
The Classical view of Fiscal policy
Friends, we believe that fiscal policy is unnecessary and
ineffective. The economy is doing just fine without meddling by
Washington.
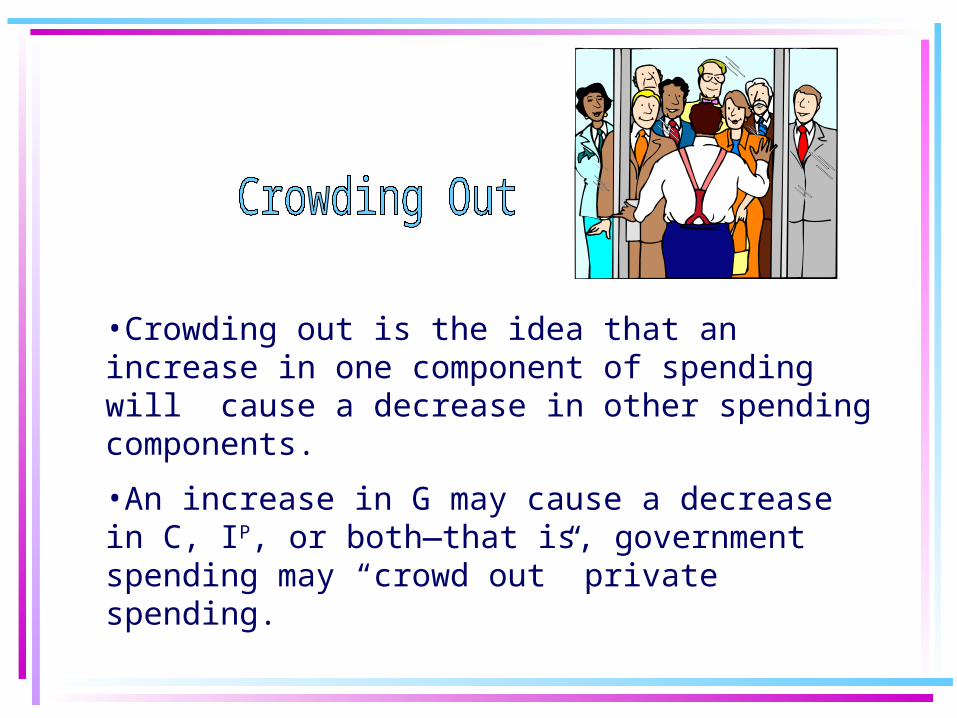
•Crowding out is the idea that an increase in one component of spending will cause a decrease in other spending components.
•An increase in G may cause a decrease in C, IP, or both—that is, government spending may “crowd out” private spending.
Inte
rest
Rat
e
Trillions of Dollars
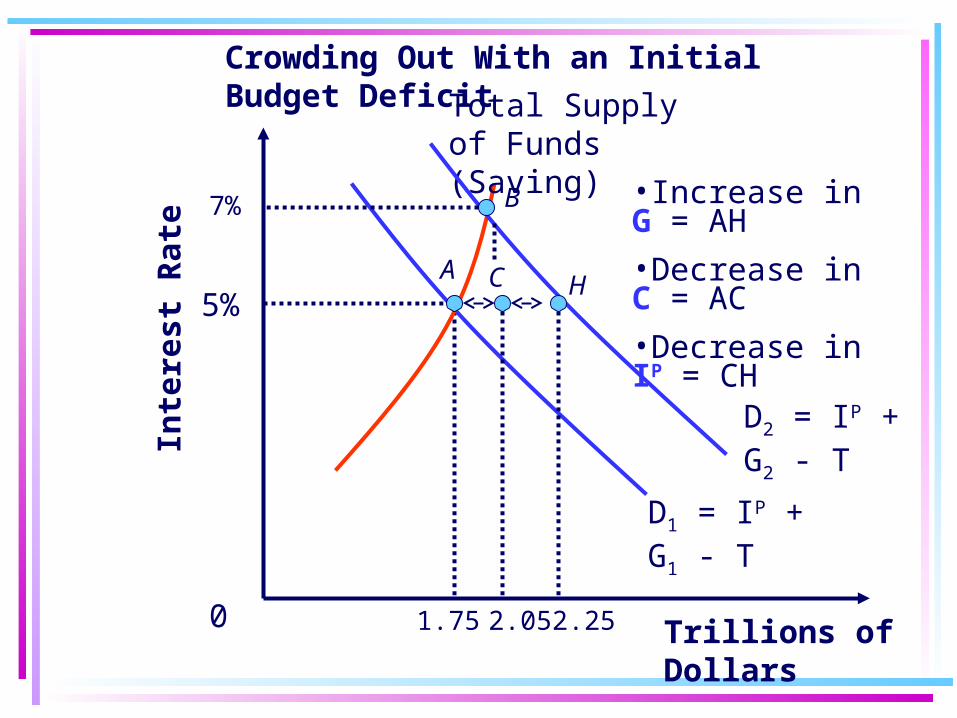
Crowding Out With an Initial Budget Deficit
Total Supply of Funds (Saving)
D1 = IP + G1 - T
H5%
0 1.75
D2 = IP + G2 - T
7%
2.05 2.25
A C
B •Increase in G = AH•Decrease in C = AC•Decrease in IP = CH
Inte
rest
Rat
e
Trillions of Dollars
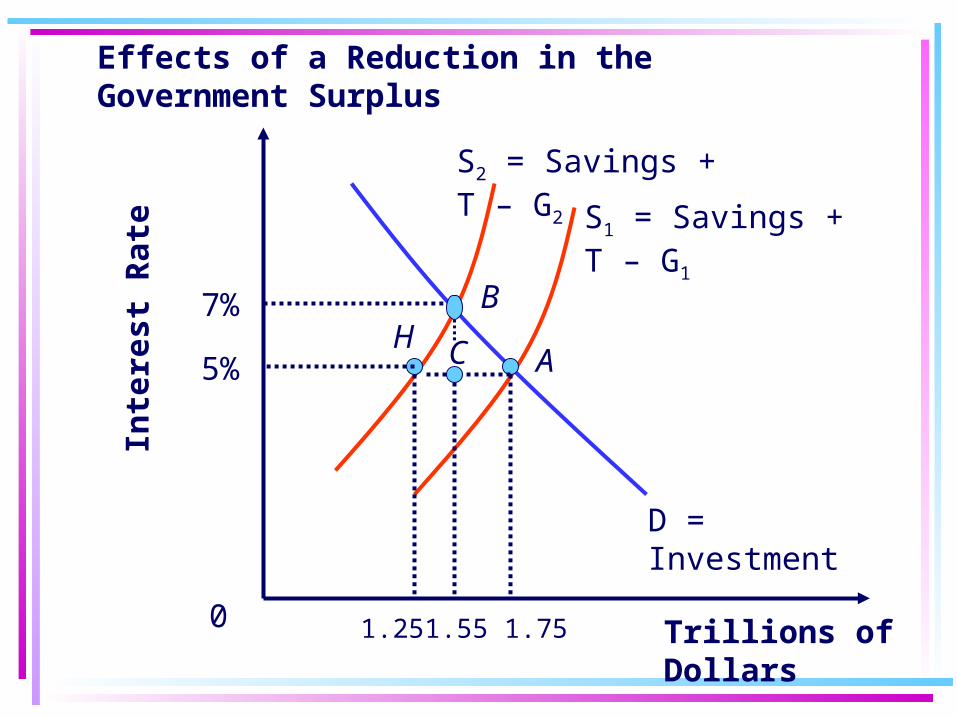
Effects of a Reduction in the Government Surplus
S1 = Savings + T – G1
D = Investment
B
5%
0 1.75
S2 = Savings + T – G2
AH
7%
C
1.25 1.55