Embed Size (px)
Citation preview
Action Construction Equipment
BUY
- 1 of 16 - Monday 18th August, 2014
This document is for private circulation, and must be read in conjunction with the disclaimer on the last page.
ST
OC
K P
OIN
TE
R
Target Price `42 CMP `28 FY16E EV/Sales 0.55x
Index Details With the new government according top priority to the
infrastructure sector, we believe the infrastructure sector is on
the cusp of a turn-around. The government has already taken
many steps (making funding easier for infrastructure sector,
expediting approval process, debottlenecking the system,
simplifying bureaucratic complexities, restoring confidence of
the investors, etc) which will show visible improvement over
next few quarters. Action Construction Equipment (ACE), being
in the derived demand space, is ideally poised to benefit from
the revival of the infrastructure sector.
We initiate coverage on Action Construction Equipment with a
BUY recommendation and a Price Objective of `42 implying a
potential upside of ~51%. We value the company on EV/Sales
multiple as the company is in a turn-around phase and
EV/Sales methodology captures its valuation more
appropriately than any other methodology. We assign EV/Sales
multiple of 0.55x to its FY16 estimated sales, which is lower as
compared to its historical average of 0.6x. We expect revenue
and profits to post a CAGR of ~23% and ~128%, respectively,
through FY14-16E. At the CMP of `28, the stock is trading at
EV/Sales of 0.6x and 0.4x for FY15E and FY16E, respectively.
Growth set to revive across all crane segments
Due to the sharp & prolonged slowdown in the infrastructure space, the demand
for cranes had dwindled significantly from a high of 4,297 registered in FY11 to a
low of 2,428 registered in FY14. However with growth expectations back, we
expect the sales to pick up from H2FY15 onwards.
Sensex 26,391
Nifty 7,874
BSE 100 7,947
Industry Infra
Scrip Details
Mkt Cap (` cr) 280.0
BVPS (`) 31.1
O/s Shares (Cr) 9.9
Av Vol (Lacs) 0.5
52 Week H/L 35/8
Div Yield (%) 0.4
FVPS (`) 2.0
Shareholding Pattern
Shareholders %
Promoters 68.3
DIIs 2.8
FIIs 0.2
Public 28.7
Total 100.0
ACE vs. Sensex
Key Financials (` in Cr)
Y/E Mar Net
Revenue EBITDA PAT EPS
EPS Growth (%)
ROE ROCE EV/
Sales P/E (x)
2013 667.8 29.7 7.2 0.7 (74.7) 2.4 3.6 38.4 13.8
2014 614.9 24.2 4.0 0.4 (44.1) 1.3 2.0 68.7 16.8
2015E 608.9 27.4 4.1 0.4 0.7 1.3 2.3 68.2 14.1 2016E 933.4 46.7 21.0 2.1 418.5 6.4 6.2 13.2 8.0

- 2 of 16 - Monday 18th August, 2014
This document is for private circulation, and must be read in conjunction with the disclaimer on the last page.
Crane volumes are expected to rally from the lows of FY2011 to 4,200 in FY16. With
its predominant market share of 53%, 60% and 90% in the Pick N Carry, Fixed
Tower, and Mobile Tower segments, respectively, ACE should benefit immensely
when the demand for cranes picks up.
Over all the revenue from crane segment is expected to grow at a CAGR of 22.8%
over FY14-16E.
Tractor / agri-equipment diversification to lower revenue &
profit volatility
To diversify the revenue streams and reduce its dependence on the infrastructure
sector, the company had forayed into manufacturing tractors / agri-equipments in
FY10. The tractor / agri-equipment segment has continued to gain traction through
FY10-14, with number of units sold increasing to 4,217 in FY14 from 2,562 units in
FY10. Sales have also grown at a robust CAGR of 22.9% to `179.5 cr in FY14 from
`78.8 cr in FY10. Overall we expect Tractor sales to grow at a CAGR of 33.4% from
3,936 units in FY14 to 7,000 units in FY16E. In line with this, we expect the sales to
grow at CAGR of 31.6% over FY14-16E to `308.7 cr on the back of sales of ~7,700
units in FY16 as compared to 4,217 units in FY14.
ACE intrinsically linked to the economy and infrastructure growth revival
The growth of construction equipment industry is interlinked with the growth of
infrastructure sector and hence indirectly fluctuates with the fortunes of the Indian
economy at large. With the economy having bottomed out in FY14 and is all set to
revive with the formation of new government, better policy initiatives, moderating
inflation leading to easing of tight monetary stance and mild recovery of global
growth. According to World Bank estimates, GDP growth forecasts for FY15 and
FY16 are 5.5% and 6.3%, respectively, which will correspondingly reflect in revenue
growth of ACE.
Few examples of steps taken by the new government to revive Infrastructure growth
Banks permitted to raise long term funds for lending to infrastructure sector
with minimum regulatory preemption
The government has announced that it will allow online submission of
applications for environmental clearances and forest clearances
The government is also attempting to move towards a single-window
clearance mechanism for core sector projects
- 3 of 16 - Monday 18th August, 2014
This document is for private circulation, and must be read in conjunction with the disclaimer on the last page.
Valuation
We initiate coverage on Action Construction Equipment with a BUY recommendation
and a Price Objective of `42 implying a potential upside of ~51%. We value the
company on EV/Sales multiple as the company is in turn-around phase and
EV/Sales methodology captures its valuation more appropriately than any other
methodology. We assign an EV/Sales multiple of 0.55x to its FY16 estimated sales,
(historical average of 0.6x). At the CMP of `28, the stock is trading at EV/Sales of
0.6x and 0.4x for FY15E and FY16E, respectively.
- 4 of 16 - Monday 18th August, 2014
This document is for private circulation, and must be read in conjunction with the disclaimer on the last page.
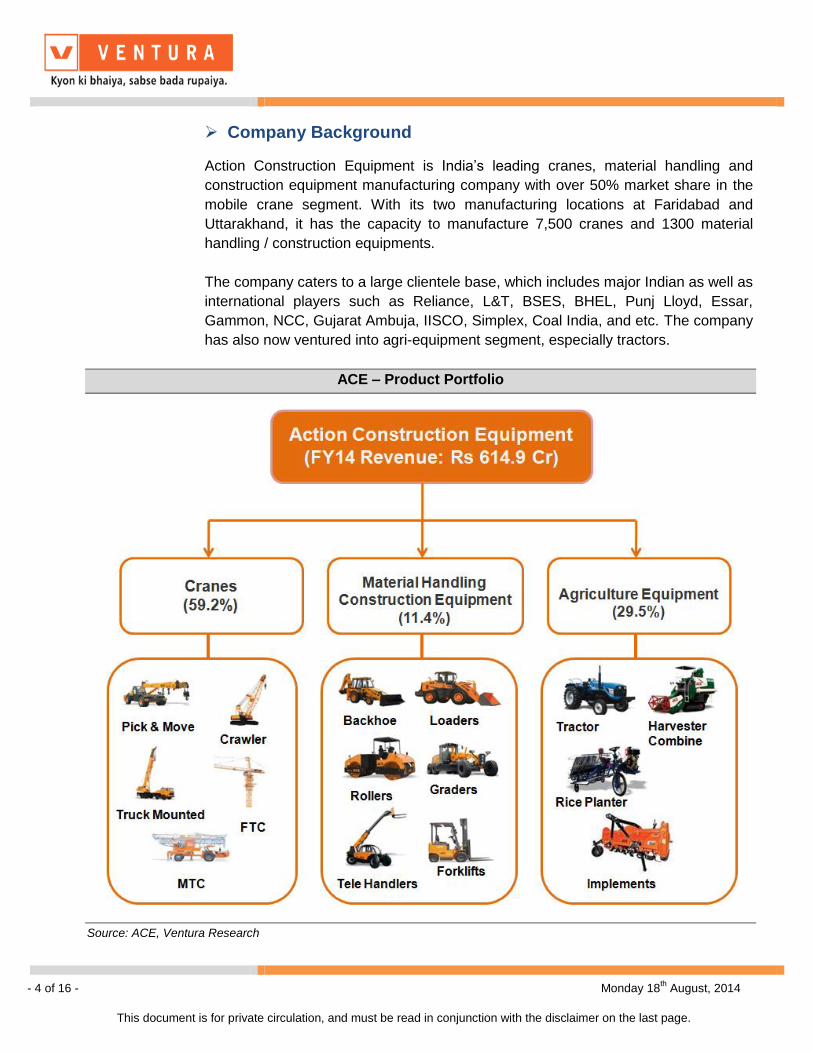
Company Background
Action Construction Equipment is India’s leading cranes, material handling and
construction equipment manufacturing company with over 50% market share in the
mobile crane segment. With its two manufacturing locations at Faridabad and
Uttarakhand, it has the capacity to manufacture 7,500 cranes and 1300 material
handling / construction equipments.
The company caters to a large clientele base, which includes major Indian as well as
international players such as Reliance, L&T, BSES, BHEL, Punj Lloyd, Essar,
Gammon, NCC, Gujarat Ambuja, IISCO, Simplex, Coal India, and etc. The company
has also now ventured into agri-equipment segment, especially tractors.
ACE – Product Portfolio
Source: ACE, Ventura Research
- 5 of 16 - Monday 18th August, 2014
This document is for private circulation, and must be read in conjunction with the disclaimer on the last page.
Key Investment Highlights
Growth set to revive across all crane segments
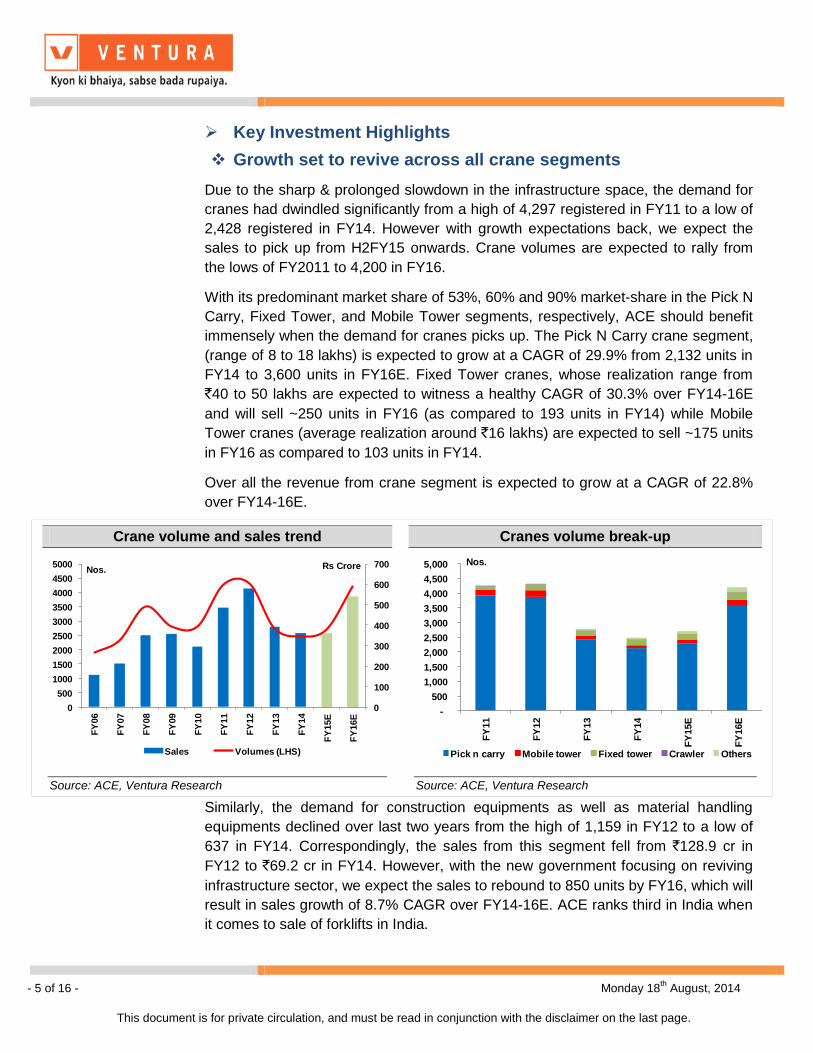
Due to the sharp & prolonged slowdown in the infrastructure space, the demand for
cranes had dwindled significantly from a high of 4,297 registered in FY11 to a low of
2,428 registered in FY14. However with growth expectations back, we expect the
sales to pick up from H2FY15 onwards. Crane volumes are expected to rally from
the lows of FY2011 to 4,200 in FY16.
With its predominant market share of 53%, 60% and 90% market-share in the Pick N
Carry, Fixed Tower, and Mobile Tower segments, respectively, ACE should benefit
immensely when the demand for cranes picks up. The Pick N Carry crane segment,
(range of 8 to 18 lakhs) is expected to grow at a CAGR of 29.9% from 2,132 units in
FY14 to 3,600 units in FY16E. Fixed Tower cranes, whose realization range from
`40 to 50 lakhs are expected to witness a healthy CAGR of 30.3% over FY14-16E
and will sell ~250 units in FY16 (as compared to 193 units in FY14) while Mobile
Tower cranes (average realization around `16 lakhs) are expected to sell ~175 units
in FY16 as compared to 103 units in FY14.
Over all the revenue from crane segment is expected to grow at a CAGR of 22.8%
over FY14-16E.
Similarly, the demand for construction equipments as well as material handling
equipments declined over last two years from the high of 1,159 in FY12 to a low of
637 in FY14. Correspondingly, the sales from this segment fell from `128.9 cr in
FY12 to `69.2 cr in FY14. However, with the new government focusing on reviving
infrastructure sector, we expect the sales to rebound to 850 units by FY16, which will
result in sales growth of 8.7% CAGR over FY14-16E. ACE ranks third in India when
it comes to sale of forklifts in India.
Crane volume and sales trend Cranes volume break-up
0
100
200
300
400
500
600
700
0
500
1000
1500
2000
2500
3000
3500
4000
4500
5000
FY
06
FY
07
FY
08
FY
09
FY
10
FY
11
FY
12
FY
13
FY
14
FY
15E
FY
16E
Rs Crore
Sales Volumes (LHS)
Nos.
-
500
1,000
1,500
2,000
2,500
3,000
3,500
4,000
4,500
5,000
FY
11
FY
12
FY
13
FY
14
FY
15E
FY
16E
Nos.
Pick n carry Mobile tower Fixed tower Crawler Others
Source: ACE, Ventura Research
Source: ACE, Ventura Research

- 6 of 16 - Monday 18th August, 2014
This document is for private circulation, and must be read in conjunction with the disclaimer on the last page.
Forklift, (average realization of `8 lakhs ) which is the largest selling equipment in
MH/CE segment, is expected to grow at a CAGR of 18.8% to ~750 units in FY16E
as compared to 531 units in FY14.
MH / CE volume and sales trend MH / CE volume break-up
0
20
40
60
80
100
120
140
0
200
400
600
800
1000
1200
1400
FY
07
FY
08
FY
09
FY
10
FY
11
FY
12
FY
13
FY
14
FY
15E
FY
16E
Rs Crore
Sales Volumes (LHS)
Nos.
-
200
400
600
800
1,000
1,200
1,400
FY
11
FY
12
FY
13
FY
14
FY
15E
FY
16E
Nos.
Backhoe Forklift Compactor Grader Wheel Loader
Source: ACE, Ventura Research
Source: ACE, Ventura Research
Industry outlook for MH/CE
Industry revenues estimated to grow at a CAGR of 20.9% and reach $22.7 bn by 2020 from ~ $6 bn in
2014 $4.2 billion in 2011)
Total infrastructure spend to be about 10% of GDP during the 12th Five-Year Plan
Backhoe loaders & Crawlers excavators expected to account for significant sales in earth moving
equipment segment
Significant increase in replacement market sales expected to drive growth further
The organized construction sector in India (for example, roads, urban infrastructure) accounts for
approximately 55.0% of the MH/CE industry. Mining, irrigation and other infrastructure segments
(power, railways) account for the remaining
MH / CE industry trend MH /CE industry sales outlook
0%
20%
40%
60%
80%
100%
120%
2006 2012A 2016E
Backhoe loaders Crawler Excavators Mobile cranes
Compaction equipment Wheeled Loaders Others
4.26
22.7
0
5
10
15
20
25
2011 2014E 2020E
($ bn)
Source: IBEF, Ventura Research
Source: IBEF, Ventura Research
- 7 of 16 - Monday 18th August, 2014
This document is for private circulation, and must be read in conjunction with the disclaimer on the last page.
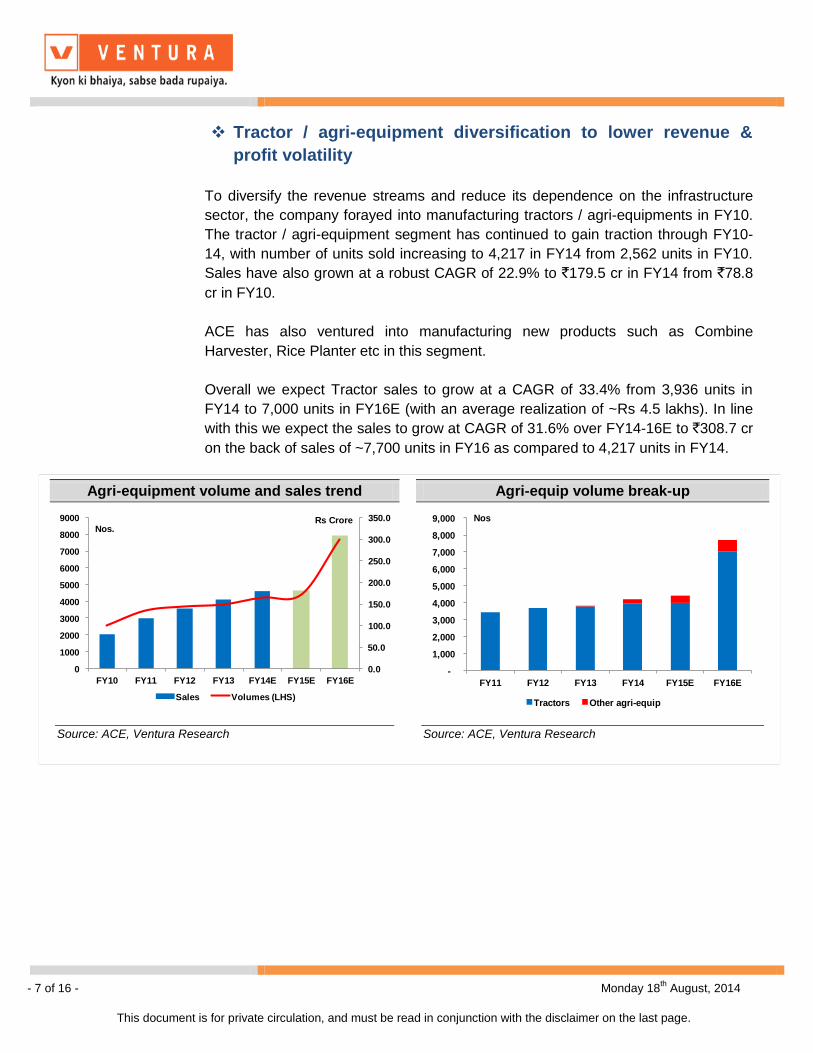
Tractor / agri-equipment diversification to lower revenue &
profit volatility
To diversify the revenue streams and reduce its dependence on the infrastructure
sector, the company forayed into manufacturing tractors / agri-equipments in FY10.
The tractor / agri-equipment segment has continued to gain traction through FY10-
14, with number of units sold increasing to 4,217 in FY14 from 2,562 units in FY10.
Sales have also grown at a robust CAGR of 22.9% to `179.5 cr in FY14 from `78.8
cr in FY10.
ACE has also ventured into manufacturing new products such as Combine
Harvester, Rice Planter etc in this segment.
Overall we expect Tractor sales to grow at a CAGR of 33.4% from 3,936 units in
FY14 to 7,000 units in FY16E (with an average realization of ~Rs 4.5 lakhs). In line
with this we expect the sales to grow at CAGR of 31.6% over FY14-16E to `308.7 cr
on the back of sales of ~7,700 units in FY16 as compared to 4,217 units in FY14.
Agri-equipment volume and sales trend Agri-equip volume break-up
0.0
50.0
100.0
150.0
200.0
250.0
300.0
350.0
0
1000
2000
3000
4000
5000
6000
7000
8000
9000
FY10 FY11 FY12 FY13 FY14E FY15E FY16E
Rs Crore
Sales Volumes (LHS)
Nos.
-
1,000
2,000
3,000
4,000
5,000
6,000
7,000
8,000
9,000
FY11 FY12 FY13 FY14 FY15E FY16E
Nos
Tractors Other agri-equip
Source: ACE, Ventura Research
Source: ACE, Ventura Research

- 8 of 16 - Monday 18th August, 2014
This document is for private circulation, and must be read in conjunction with the disclaimer on the last page.
Growth drivers for the agri-equipment segment
India is the largest manufacturer of tractors in the world, accounting for about one-third of global production.
Growing sales of tractors, tillers and other agri-equipments reflects the increasing level of mechanization in
farming; over FY07-14, tractor sales has increased at a CAGR of 11.7%.
Growth drivers
Higher MSP for key crops leading to higher income for farmers
Increasing rural wages makes alternative (tractors / agri-equipment) viable
Ease of credit availability enables farmers to buy tractors / agri-equipment
Mechanization helps in raising farm income by increasing productivity and limiting post-harvest
losses
Tractor sales volumes trend Agriculture credit target
-5%
0%
5%
10%
15%
20%
25%
30%
-
100,000
200,000
300,000
400,000
500,000
600,000
700,000
FY07 FY08 FY09 FY10 FY11 FY12 FY13 FY14
Nos.
Tractors sold Growth
0%
5%
10%
15%
20%
25%
30%
35%
40%
0
100000
200000
300000
400000
500000
600000
700000
800000
FY05 FY06 FY07 FY08 FY09 FY10 FY11 FY12 FY13 FY14
Rs Crore
Agriculture credit target YoY growth
Source: Industry report, Ventura Research
Source: RBI, Ventura Research
Avg daily rural wages for men on the rise MSP increasing over the years
0%
5%
10%
15%
20%
25%
0
50
100
150
200
250
FY07 FY08 FY09 FY10 FY11 FY12 FY13
Rs / day
Average daily rural wages for men Growth (RHS)
200
400
600
800
1000
1200
1400
1600
FY06 FY07 FY08 FY09 FY10 FY11 FY12 FY13 FY14
Rs per quintal
Paddy Coarse Cereal Wheat
Source: RBI, Ventura Research
Source: RBI, Ventura Research
- 9 of 16 - Monday 18th August, 2014
This document is for private circulation, and must be read in conjunction with the disclaimer on the last page.
ACE intrinsically linked to the economy and infrastructure
growth revival
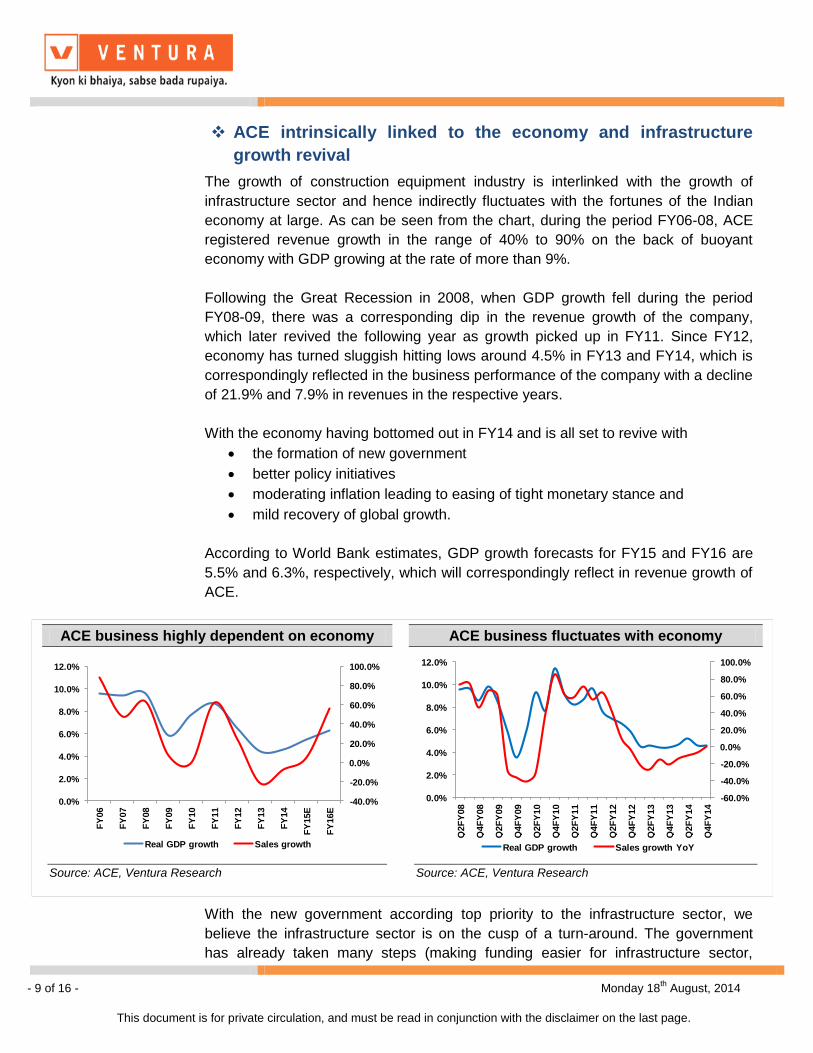
The growth of construction equipment industry is interlinked with the growth of
infrastructure sector and hence indirectly fluctuates with the fortunes of the Indian
economy at large. As can be seen from the chart, during the period FY06-08, ACE
registered revenue growth in the range of 40% to 90% on the back of buoyant
economy with GDP growing at the rate of more than 9%.
Following the Great Recession in 2008, when GDP growth fell during the period
FY08-09, there was a corresponding dip in the revenue growth of the company,
which later revived the following year as growth picked up in FY11. Since FY12,
economy has turned sluggish hitting lows around 4.5% in FY13 and FY14, which is
correspondingly reflected in the business performance of the company with a decline
of 21.9% and 7.9% in revenues in the respective years.
With the economy having bottomed out in FY14 and is all set to revive with
the formation of new government
better policy initiatives
moderating inflation leading to easing of tight monetary stance and
mild recovery of global growth.
According to World Bank estimates, GDP growth forecasts for FY15 and FY16 are
5.5% and 6.3%, respectively, which will correspondingly reflect in revenue growth of
ACE.
With the new government according top priority to the infrastructure sector, we
believe the infrastructure sector is on the cusp of a turn-around. The government
has already taken many steps (making funding easier for infrastructure sector,
ACE business highly dependent on economy ACE business fluctuates with economy
-40.0%
-20.0%
0.0%
20.0%
40.0%
60.0%
80.0%
100.0%
0.0%
2.0%
4.0%
6.0%
8.0%
10.0%
12.0%
FY
06
FY
07
FY
08
FY
09
FY
10
FY
11
FY
12
FY
13
FY
14
FY
15E
FY
16E
Real GDP growth Sales growth
-60.0%
-40.0%
-20.0%
0.0%
20.0%
40.0%
60.0%
80.0%
100.0%
0.0%
2.0%
4.0%
6.0%
8.0%
10.0%
12.0%
Q2F
Y08
Q4F
Y08
Q2F
Y09
Q4F
Y09
Q2F
Y10
Q4F
Y10
Q2F
Y11
Q4F
Y11
Q2F
Y12
Q4F
Y12
Q2F
Y13
Q4F
Y13
Q2F
Y14
Q4F
Y14
Real GDP growth Sales growth YoY
Source: ACE, Ventura Research
Source: ACE, Ventura Research
- 10 of 16 - Monday 18th August, 2014
This document is for private circulation, and must be read in conjunction with the disclaimer on the last page.
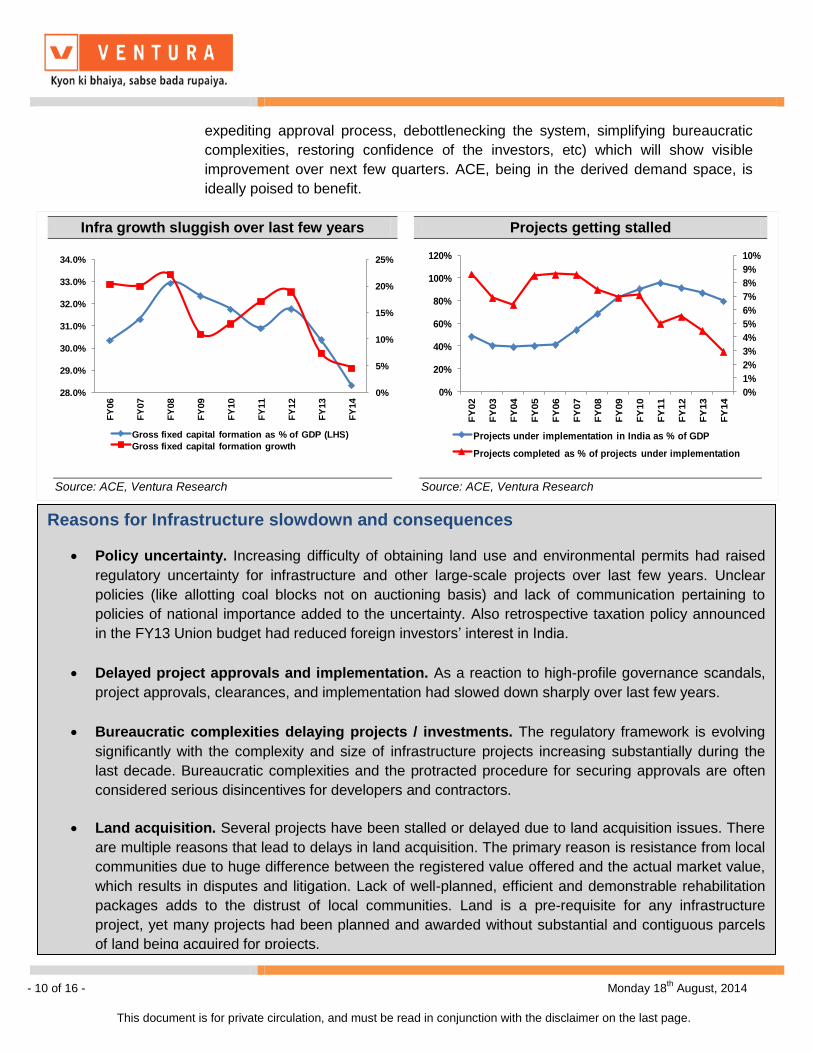
expediting approval process, debottlenecking the system, simplifying bureaucratic
complexities, restoring confidence of the investors, etc) which will show visible
improvement over next few quarters. ACE, being in the derived demand space, is
ideally poised to benefit.
Infra growth sluggish over last few years Projects getting stalled
0%
5%
10%
15%
20%
25%
28.0%
29.0%
30.0%
31.0%
32.0%
33.0%
34.0%
FY
06
FY
07
FY
08
FY
09
FY
10
FY
11
FY
12
FY
13
FY
14
Gross fixed capital formation as % of GDP (LHS)
Gross fixed capital formation growth
0%
1%
2%
3%
4%
5%
6%
7%
8%
9%
10%
0%
20%
40%
60%
80%
100%
120%
FY
02
FY
03
FY
04
FY
05
FY
06
FY
07
FY
08
FY
09
FY
10
FY
11
FY
12
FY
13
FY
14
Projects under implementation in India as % of GDP
Projects completed as % of projects under implementation
Source: ACE, Ventura Research
Source: ACE, Ventura Research
Reasons for Infrastructure slowdown and consequences
Policy uncertainty. Increasing difficulty of obtaining land use and environmental permits had raised
regulatory uncertainty for infrastructure and other large-scale projects over last few years. Unclear
policies (like allotting coal blocks not on auctioning basis) and lack of communication pertaining to
policies of national importance added to the uncertainty. Also retrospective taxation policy announced
in the FY13 Union budget had reduced foreign investors’ interest in India.
Delayed project approvals and implementation. As a reaction to high-profile governance scandals,
project approvals, clearances, and implementation had slowed down sharply over last few years.
Bureaucratic complexities delaying projects / investments. The regulatory framework is evolving
significantly with the complexity and size of infrastructure projects increasing substantially during the
last decade. Bureaucratic complexities and the protracted procedure for securing approvals are often
considered serious disincentives for developers and contractors.
Land acquisition. Several projects have been stalled or delayed due to land acquisition issues. There
are multiple reasons that lead to delays in land acquisition. The primary reason is resistance from local
communities due to huge difference between the registered value offered and the actual market value,
which results in disputes and litigation. Lack of well-planned, efficient and demonstrable rehabilitation
packages adds to the distrust of local communities. Land is a pre-requisite for any infrastructure
project, yet many projects had been planned and awarded without substantial and contiguous parcels
of land being acquired for projects.
- 11 of 16 - Monday 18th August, 2014
This document is for private circulation, and must be read in conjunction with the disclaimer on the last page.
Supply bottlenecks. Particularly pronounced in mining and power, with attendant consequences for the
broader economy, especially manufacturing.
Funding Constraint. Once a slowdown began, other negative factors, including corruption and scams,
also kicked in. As it became clear to banks that regulatory hurdles were holding up the infrastructure
projects they had initially financed, they became wary of lending to fresh projects. There is increasing
reliance on the private sector for developing and maintaining infrastructure. Infrastructure projects are
mostly capital intensive and have a high gestation period. During last few years, most large developers
or EPC contractors have over-leveraged their balance sheets to raise debt and their cash flow did not
permit them raise fresh debt to fund new projects. Therefore, the projects awarded were witnessing
delay in achieving financial closure.
Some of the consequences faced by Indian economy
More than 50% of infrastructure projects were stuck due to regulatory hurdles like lack of approvals and
delays in land acquisition.
In 2006, the government had announced SEZs to boost industrial activity and exports. However, out of
576 SEZs that have received formal approval, only 172 are operational.
Against a target of awarding road projects aggregating 50,621 km during five years to March 2013,
approximately less than 1/3rd had been awarded. Also many of the projects awarded didn’t see
commencement of work due to problems in achieving financial closure, delays in land acquisition and
obtaining environmental clearances.
Out of 16 Ultra Mega Power Projects (UMPP) planned; contracts for only 4 had been awarded. Out of
this, only one had become operational. Lack of clarity on coal import, forest clearances and land
acquisition delays were the main hurdles.
Steps taken by the new government to revive Infrastructure growth
Government has cleared 100% FDI in railways except for operations.
Banks permitted to raise long term funds for lending to infrastructure sector with minimum regulatory
preemption such as CRR, SLR and PSL. Long term funding will be readily available as banks are in a
much better position to mobilize resources.
Proposal to create Infrastructure Investment Trusts with pass through benefits, which will make easier
monetization of investments in existing projects and raising resources for new projects.
Investment in NHAI and State Roads to the tune of `37,880 cr and target for NH construction set at
8500 km (23 km /day) for FY15.
- 12 of 16 - Monday 18th August, 2014
This document is for private circulation, and must be read in conjunction with the disclaimer on the last page.
Key Risks and Concerns
ACE business performance is highly sensitive to the economy and infrastructure
outlook, which is cyclical in nature. A fall in the demand and / or prices would
adversely impact the financial performance of the company.
The crane industry is a technical intensive industry and thus faced with a
constant demand for new designs, knowledge of nascent technology to meet
market requirements.
Raw material cost represents the largest expense and ACE’s profitability and
cost effectiveness may be affected due to change in the prices of raw materials
and other inputs.
Agri business runs the risk of a demand drop in case of significant variation in
monsoon.
Sixteen new port projects proposed with a focus on port connectivity. An amount of `11,635 crore will be
allocated for the development of Outer Harbour Project in Tuticorin. Effective steps will be taken to
operationalize the SEZ Zones. The government has also announced SEZs in Kandla and JNPT.
Development of new airports in Tier I and Tier II cities through Airport Authority of India or PPPs.
Development of inland waterways. ‘Jal Marg Vikas’ (National Waterways-I) will be developed between
Allahabad and Haldia to cover a distance of 1620 kms at cost of `4200 crore in 6 years.
Incentives for REITs which will have pass through for the purpose of taxation. REITs would attract long
term finance from foreign and domestic sources and reduce the pressure on the banking system while
also making available fresh equity.
To encourage development of Smart Cities, requirement of the built up area and capital conditions for
FDI is being reduced from 50,000 Sqm to 20,000 Sqm and from $10 mn to $5 mn respectively with a
three year post completion lock in.
Mission on Low Cost Affordable Housing in urban areas with `4,000 cr allocated to NHB to increase flow
of cheaper credit for affordable housing to the urban poor/EWS/LIG segment.
Measures for enhancing domestic coal production are being put in place including supply of crushed
coal and setting up of washeries. Exercise to rationalize coal linkages which will optimize transport of
coal and reduce cost of power is underway. Government will work also towards encouraging
investments in mining and resolving the issues in iron ore mining.
The government will allow online submission of applications for environmental clearances and forest
clearances.
The government is also attempting to move towards a single-window clearance mechanism for core
sector projects such as those in the steel industry.

- 13 of 16 - Monday 18th August, 2014
This document is for private circulation, and must be read in conjunction with the disclaimer on the last page.
Financial Performance
During Q1FY15, ACE reported profit dropped sharply by 12.3% to `0.9 crore from
`1.03 crore in the same quarter previous year owing to subdued demand across
construction equipment / material handling space. The company’s top-line declined
6.9% to `131.7 crore, compared with `141.6 crore for the prior year period while its
PAT declined 10.1% to `0.9 crore as compared to its PAT of `1.1 crore in Q1FY14.
ACE has moderate debt on its balance sheet and its current debt to equity is around
0.49. The company is currently operating at TTM interest coverage ratio of 0.9,
which could be a matter of concern for mid-term.
Financial Outlook
Due to the slowdown in the economy and sluggish growth in the infrastructure sector
during last few years, ACE’s revenue has declined at a CAGR 3.9% over FY11-14
while its PAT declined at a CAGR of 53.7% over the same period. However, with
new government is place which has accorded infrastructure sector its top priority, we
expect the prospects for the company to improve significantly going forward (signs of
improvement will be visible from H2FY15). We expect revenue to grow at a CAGR of
~23.2% over FY14-16E to `933.4 cr with EBITDA margins improving to 5.0% in
Quarterly Financial Performance (` in crore)
Particulars Q1FY15 Q1FY14 FY14 FY13
Net Sales 131.8 141.6 614.9 667.9
Growth % -7.0 -7.9
Total Expenditure 125.8 135.8 590.8 638.1
EBIDTA 5.9 5.9 24.1 29.7
EBDITA Margin % 4.5 4.1 3.9 4.5
Depreciation 2.6 3.6 15.3 13.6
EBIT (EX OI) 3.4 2.2 8.9 16.1
Other Income 1.2 1.1 6.7 5.4
EBIT 4.5 3.3 15.5 21.5
Margin % 3.4 2.4 2.5 3.2
Interest 3.0 2.0 10.4 10.5
Exceptional items 0 0 0.0 0.0
PBT 1.5 1.3 5.1 11.1
Margin % 1.2 0.9 0.8 1.7
Provision for Tax 0.6 0.3 1.1 3.8
PAT 0.9 1.1 4.0 7.2
PAT Margin (%) 0.7 0.7 0.7 1.1
Source: ACE, Ventura Research
- 14 of 16 - Monday 18th August, 2014
This document is for private circulation, and must be read in conjunction with the disclaimer on the last page.
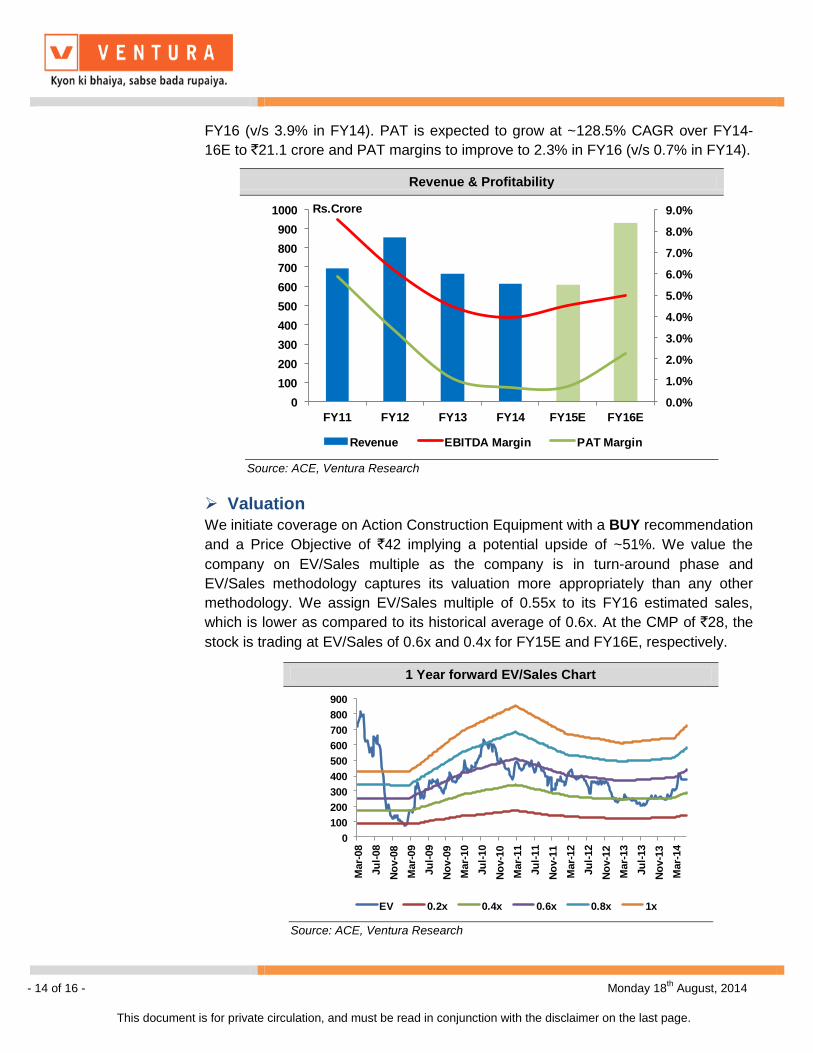
FY16 (v/s 3.9% in FY14). PAT is expected to grow at ~128.5% CAGR over FY14-
16E to `21.1 crore and PAT margins to improve to 2.3% in FY16 (v/s 0.7% in FY14).
Valuation
We initiate coverage on Action Construction Equipment with a BUY recommendation
and a Price Objective of `42 implying a potential upside of ~51%. We value the
company on EV/Sales multiple as the company is in turn-around phase and
EV/Sales methodology captures its valuation more appropriately than any other
methodology. We assign EV/Sales multiple of 0.55x to its FY16 estimated sales,
which is lower as compared to its historical average of 0.6x. At the CMP of `28, the
stock is trading at EV/Sales of 0.6x and 0.4x for FY15E and FY16E, respectively.
Revenue & Profitability
0.0%
1.0%
2.0%
3.0%
4.0%
5.0%
6.0%
7.0%
8.0%
9.0%
0
100
200
300
400
500
600
700
800
900
1000
FY11 FY12 FY13 FY14 FY15E FY16E
Rs.Crore
Revenue EBITDA Margin PAT Margin
Source: ACE, Ventura Research
1 Year forward EV/Sales Chart
0
100
200
300
400
500
600
700
800
900
Mar-
08
Ju
l-08
No
v-0
8
Mar-
09
Ju
l-09
No
v-0
9
Mar-
10
Ju
l-10
No
v-1
0
Mar-
11
Ju
l-11
No
v-1
1
Mar-
12
Ju
l-12
No
v-1
2
Mar-
13
Ju
l-13
No
v-1
3
Mar-
14
EV 0.2x 0.4x 0.6x 0.8x 1x
Source: ACE, Ventura Research

- 15 of 16 - Monday 18th August, 2014
This document is for private circulation, and must be read in conjunction with the disclaimer on the last page.
1 Year forward P/BV chart
0
10
20
30
40
50
60
70
80
90
100
Mar-
08
Ju
l-08
No
v-0
8
Mar-
09
Ju
l-09
No
v-0
9
Mar-
10
Ju
l-10
No
v-1
0
Mar-
11
Ju
l-11
No
v-1
1
Mar-
12
Ju
l-12
No
v-1
2
Mar-
13
Ju
l-13
No
v-1
3
Mar-
14
ACE 0.5x 0.75x 1x 1.25x 1.5x
Source: ACE, Ventura Research
1 Year forward P/E Chart
0
20
40
60
80
100
120
Mar-
08
Ju
l-08
No
v-0
8
Mar-
09
Ju
l-09
No
v-0
9
Mar-
10
Ju
l-10
No
v-1
0
Mar-
11
Ju
l-11
No
v-1
1
Mar-
12
Ju
l-12
No
v-1
2
Mar-
13
Ju
l-13
No
v-1
3
Mar-
14
ACE 5x 10x 15x 20x 25x
Source: ACE, Ventura Research
1 Year forward EV/EBITDA chart
0
100
200
300
400
500
600
700
800
900
Mar-
08
Ju
l-08
No
v-0
8
Mar-
09
Ju
l-09
No
v-0
9
Mar-
10
Ju
l-10
No
v-1
0
Mar-
11
Ju
l-11
No
v-1
1
Mar-
12
Ju
l-12
No
v-1
2
Mar-
13
Ju
l-13
No
v-1
3
Mar-
14
EV 6x 8x 10x 12x 14x
Source: ACE, Ventura Research

- 16 of 16 - Monday 18th August, 2014
This document is for private circulation, and must be read in conjunction with the disclaimer on the last page.
Financials and Projections
Y/E March, Fig in Rs. Cr FY 2013 FY 2014 FY 2015e FY 2016e Y/E March, Fig in Rs. Cr FY 2013 FY 2014 FY 2015e FY 2016e
Profit & Loss Statement Per Share Data (Rs)
Net Sales 667.8 614.9 608.9 933.4 EPS (adj) 0.7 0.4 0.4 2.1
% Chg. (21.9) (7.9) (1.0) 53.3 Cash EPS 2.1 2.0 2.2 4.0
Total Expenditure 638.1 590.8 581.5 886.7 DPS 0.2 0.1 0.1 0.2
% Chg. (20.5) (7.4) (1.6) 52.5 BVPS 30.7 31.1 31.4 33.3
EBITDA 29.7 24.2 27.4 46.7 Capital, Liquidity, Returns Ratio
EBITDA Margin % 4.5 3.9 4.5 5.0 Debt / Equity (x) 0.5 0.5 0.4 0.4
Depreciation 13.6 15.3 17.3 18.5 Current Ratio (x) 1.0 1.1 1.1 1.1
EBIT 16.1 8.9 10.1 28.1 ROE (%) 2.4 1.3 1.3 6.4
EBIT Margin % 2.4 1.4 1.7 3.0 ROCE (%) 3.6 2.0 2.3 6.2
Other Income 5.4 6.7 6.1 9.3 Dividend Yield (%) 0.7 0.4 0.4 0.7
Interest 10.5 10.4 10.9 10.1 Valuation Ratio (x)
PBT 11.0 5.1 5.3 27.3 P/E 39.1 70.0 69.5 13.4
PBT Margin % 1.7 0.8 0.9 2.9 P/BV 0.9 0.9 0.9 0.9
Tax Provisions 3.8 1.1 1.2 6.3 EV/Sales 0.6 0.7 0.6 0.4
Reported PAT 7.2 4.0 4.1 21.0 EV/EBIDTA 14.0 17.0 14.3 8.1
PAT Margin (%) 1.1 0.7 0.7 2.3 Efficiency Ratio (x)
RM cost / Sales (%) 71.1 75.7 75.0 74.5 Inventory (days) 108.4 131.7 100.0 80.0
Employee cost / Sales (%) 6.6 6.8 6.0 6.0 Debtors (days) 45.5 40.5 40.0 40.0
SGA Exp / Sales (%) 9.2 9.1 7.5 7.5 Creditors (days) 75.3 93.6 75.0 75.0
Balance Sheet Cash Flow statement
Share Capital 19.8 19.8 19.8 19.8 Profit before Tax 11.0 5.1 5.3 27.3
Reserves & Surplus 283.6 288.2 291.1 309.9 Adjustment 21.7 24.2 21.0 19.3
Long Term Borrowings 23.2 39.5 39.5 39.5 Changes in WC 14.5 8.9 24.3 3.0
Deferred Tax Liabilities 4.5 4.5 4.5 4.5 Direct Taxes Paid and Others (4.9) (1.4) (1.2) (6.3)
Other Non Current Liabilities 3.7 4.4 4.4 4.4 Operating Cash Flow 42.3 36.9 49.4 43.4
Current Liabilities 286.5 265.5 233.5 288.1 Capital Expenditure (42.3) (24.9) (25.0) (25.0)
Total Liabilities 621.3 621.9 592.8 666.2 Change in Investment (5.9) 1.7 0.0 0.0
Gross Block 297.3 333.4 358.4 383.4 Other Investing Activities 3.2 3.2 5.1 8.2
Less: Acc Depreciation 46.2 65.2 82.5 101.1 Cash Flow from Investing (45.0) (19.9) (19.9) (16.8)
Net Block 251.1 268.2 275.9 282.3 Interest (10.5) (10.4) (10.9) (10.1)
Capital Work in Progress 9.5 2.1 2.1 2.1 Increase/(Decrease) in Loans 11.1 (6.6) 0.0 0.0
Other Non-Current Assets 74.8 71.2 67.7 62.8 Dividend and DDT (2.3) (2.3) (1.2) (1.2)
Currents Investments 13.4 8.8 8.8 8.8 Cash Flow from Financing (1.6) (19.3) (22.1) (21.3)
Other Current Assets 272.4 271.5 238.3 310.1 Net Change in Cash (4.3) (2.4) 7.4 5.3
Misc Exp not written off 0.0 0.0 0.0 0.0 Opening Cash Balance 21.3 17.1 14.7 22.1
Total Assets 621.3 621.9 592.8 666.2 Closing Cash Balance 17.1 14.7 22.1 27.4
Ventura Securities Limited Corporate Office: C-112/116, Bldg No. 1, Kailash Industrial Complex, Park Site, Vikhroli (W), Mumbai – 400079 This report is neither an offer nor a solicitation to purchase or sell securities. The information and views expressed herein are believed to be reliable, but no responsibility (or liability) is accepted for errors of fact or opinion. Writers and contributors may be trading in or have positions in the securities mentioned in their articles. Neither Ventura Securities Limited nor any of the contributors accepts any liability arising out of the above information/articles. Reproduction in whole or in part without written permission is prohibited. This report is for private circulation.