Embed Size (px)
Citation preview
------------------- Serving as fiduciaries since 2000 --------------------
E. Rick Adams & R. Brook Hansen are Investment Advisor Representatives offering Advisory Services through
Creative Wealth Strategies, Inc. dba Adams-Hansen & Associates, a Registered Investment Advisor.
13911 Ridgedale Drive, Suite 170 l Minnetonka, MN 55305 l www.adamshansen.com (P) 952.224.9085 (F) 952.224.9088 (E) [email protected]
AHA MANAGED
PORTFOLIO PERFORMANCE Portfolios: Annualized Returns As of 09-30-2016
Risk 2016 1 Year 3 Year 5 Year Since
Inception
Fund Fees Management
Fees
Conservative
AHA13 9.66 12.27 7.31 11.79 13.79 .30% Portfolio
management
fees are
charged per
year, hour, or
as a percentage
of assets.
Moderate
AHA16 12.31 14.35 7.59 13.22 15.83 .19%
Aggressive
AHA19 10.87 13.29 7.11 12.71 15.86 .20%
Inception February 2009 – Tracking via Morningstar – Gross of non-fund fees
Additional fees may be assessed based on services required for the type of account or plan. Past performance does not guarantee future results. Current performance may be lower or higher than the performance data quoted. Investing
in securities involves risk of loss that clients should be prepared to bear.
Document not complete without three attached fact sheets with integrated disclosures, provided with this composite page.
If composite page has detached from fact sheets, for full disclosures visit www.adamshansen.com & choose "View our Portfolios".
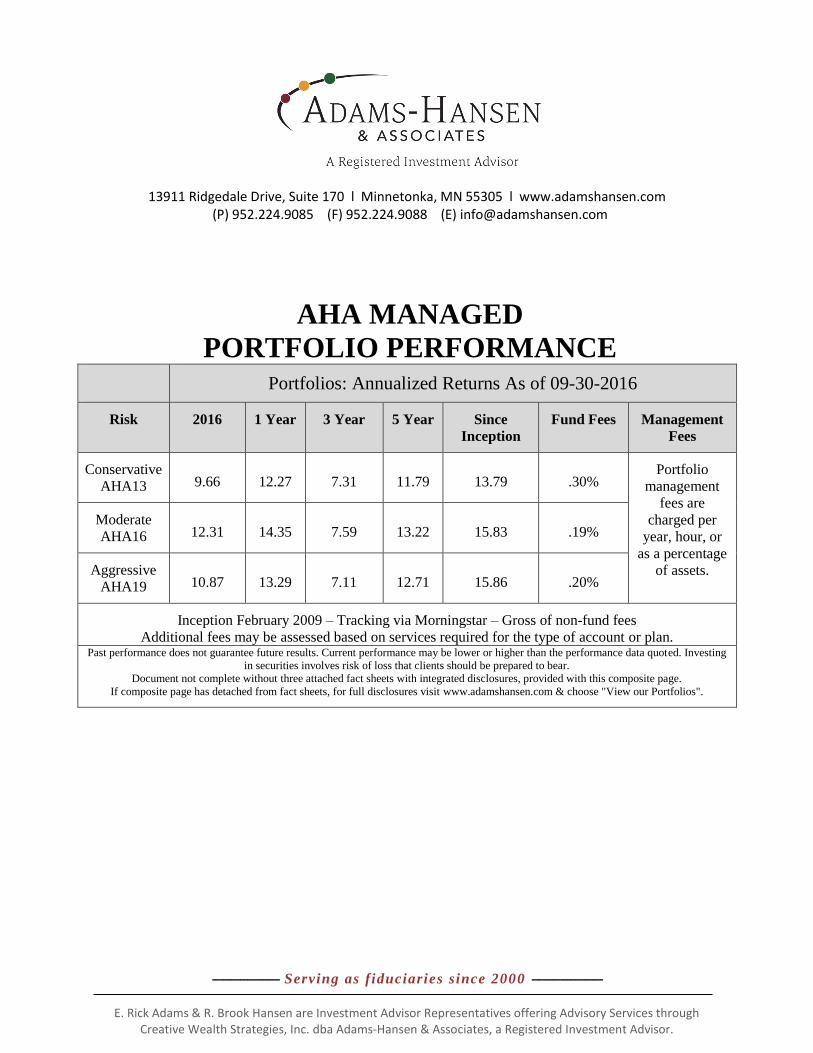
Investment ObjectiveMaximize capital appreciation based on measured risk.
Investment Strategy
Portfolio Analysis
Asset Allocation Equity Style Box % Fixed Income Style Box %
+ Management Fees
Annual Performance
From inception 2009 2010 2011 2012 2013 2014 2015 2016
AHA13 45.23% 16.33% -0.73% 14.64% 18.74% 9.28% -2.65% 9.66%
DJUS MCons 27.28% 11.22% 2.82% 8.40% 8.13% 4.78% -1.11% 8.17%
Trailing Returns
3 Month 1 Year 3 Year 5 Year Inception
Conservative AHA13 3.16% 12.27% 7.31% 11.79% 13.79%
DJ US Mod. Conservative 2.32% 9.48% 4.74% 6.38% 8.92%
+/- Benchmark Returns 0.84% 2.79% 2.56% 5.40% 4.87%
Investment Growth
Initial Market Value: $10,000 Final Market Value: $26,658
As of 09/30/2016
Conservative Portfolio - AHA13
As a core holding, the AHA Conservative Portfolio owns most major asset classes and proportions them to the efficient frontier, using Modern
Portfolio Theory, the practice of building a portfolio whose blend of asset classes have historically earned the highest rate of return based on the risk
taken. The AHA Conservative Portfolio contains several investment funds carefully selected to achieve the consistent standard deviation of value
needed to maximize the returns for the client. By reallocating the funds on a consistent basis, gains are harvested and the original risk is maintained.
The performance data given
represents past performance and
should not be considered indicative
of future results. Principal value and
investment return of underlying
mutual funds will fluctuate, and an
investor's shares/units when
redeemed will be worth more or less
than the original investment. An
investment in the fund is not insured
or guaranteed by the FDIC or any
other government agency. Investing
in securities involves risk of loss that
clients should be prepared to bear.
Standardized Returns assume
reinvestment of dividends and capital
gains. It depicts performance without
adjusting for the effects of taxation,
but are adjusted to reflect ongoing
fund expenses. The charges and
expenses used in the standardized
returns are obtained from the most
recent prospectus and/or
shareholder report available to
Morningstar. Benchmark returns may
or may not be adjusted to reflect
ongoing expenses. An investment's
portfolio may differ significantly from
the securities in the benchmark. The
investment(s) returns do not
necessarily reflect the deduction of
all investment advisory fees. Client
investment returns will be reduced
due to custodial and transaction fees.
The investment growth graph
compares the growth of $10,000
simultaneously invested in the
AHA13 Conservative Portfolio and
that of the benchmark, Dow Jones
Moderately Conservative TR USD.
The benchmark is an unmanaged
portfolio of specified securities and
cannot be invested in directly. The
portfolio may differ significantly from
the securities in the benchmark. E. Rick Adams & R. Brook Hansen are Investment Advisor Representatives offering Advisory Services through Creative
Wealth Strategies, Inc. dba Adams-Hansen & Associates, a Registered Investment Advisor.
LTD MOD EXT
HIG
HM
EDL
OW
CurrentStock Holdings: 4,350 Bond Holdings: 1,692
Expected Return: 9.28Risk: 13.41
Yield: 3.25Fund Expenses: .30%
0-10 10-25 25-50 >50
LA
RG
EM
IDS
MA
LL
VALUE CORE GROWTH
BOND
CASH
US STOCK
NON US STOCK
OTHER
NOT CLASSIFIED
TOTAL
33.63
7.80
46.48
10.97
1.13
0.00
100.00
0.00
0.00
10.78
3.91
85.32
0.00
100.00
PORTFOLIO % BMARK %
0-10 10-25 25-50 >50
A Registered Investment Advisor
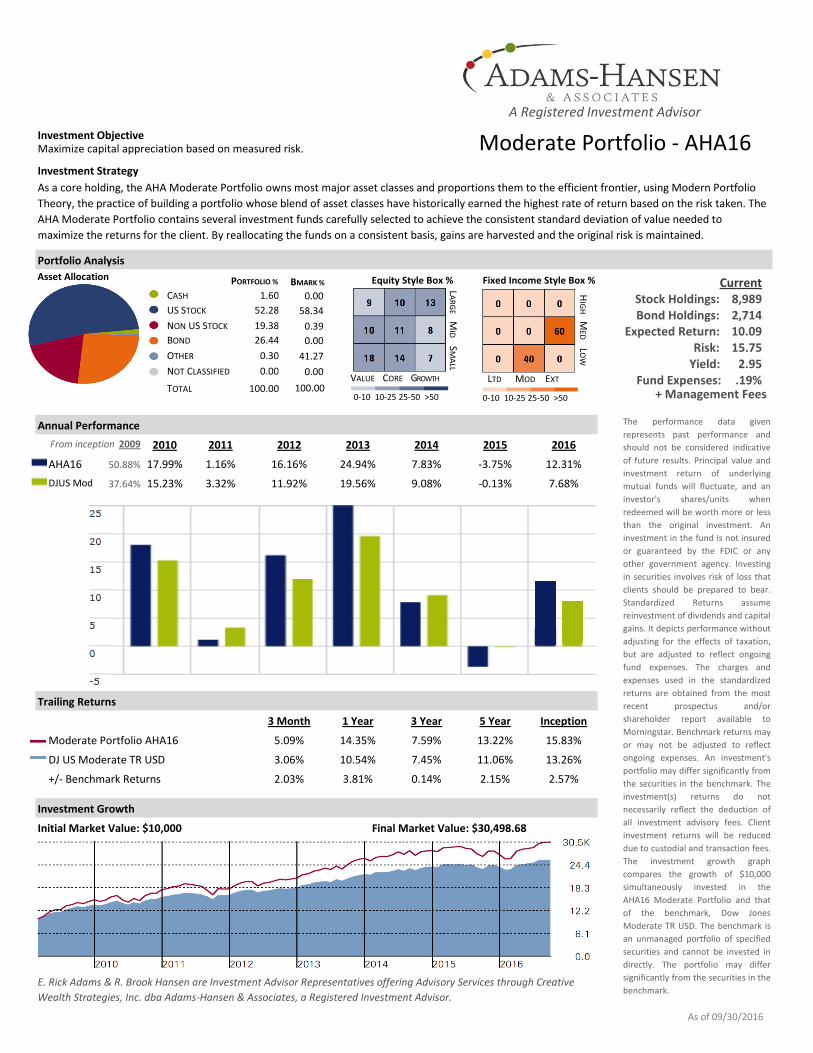
Investment ObjectiveMaximize capital appreciation based on measured risk.
Investment Strategy
Portfolio Analysis
Asset Allocation Equity Style Box % Fixed Income Style Box %
+ Management Fees
Annual Performance
From inception 2009 2010 2011 2012 2013 2014 2015 2016
AHA16 50.88% 17.99% 1.16% 16.16% 24.94% 7.83% -3.75% 12.31%
DJUS Mod 37.64% 15.23% 3.32% 11.92% 19.56% 9.08% -0.13% 7.68%
Trailing Returns
3 Month 1 Year 3 Year 5 Year Inception
Moderate Portfolio AHA16 5.09% 14.35% 7.59% 13.22% 15.83%
DJ US Moderate TR USD 3.06% 10.54% 7.45% 11.06% 13.26%
+/- Benchmark Returns 2.03% 3.81% 0.14% 2.15% 2.57%
Investment Growth
Initial Market Value: $10,000 Final Market Value: $30,498.68
As of 09/30/2016
Moderate Portfolio - AHA16
As a core holding, the AHA Moderate Portfolio owns most major asset classes and proportions them to the efficient frontier, using Modern Portfolio
Theory, the practice of building a portfolio whose blend of asset classes have historically earned the highest rate of return based on the risk taken. The
AHA Moderate Portfolio contains several investment funds carefully selected to achieve the consistent standard deviation of value needed to
maximize the returns for the client. By reallocating the funds on a consistent basis, gains are harvested and the original risk is maintained.
The performance data given
represents past performance and
should not be considered indicative
of future results. Principal value and
investment return of underlying
mutual funds will fluctuate, and an
investor's shares/units when
redeemed will be worth more or less
than the original investment. An
investment in the fund is not insured
or guaranteed by the FDIC or any
other government agency. Investing
in securities involves risk of loss that
clients should be prepared to bear.
Standardized Returns assume
reinvestment of dividends and capital
gains. It depicts performance without
adjusting for the effects of taxation,
but are adjusted to reflect ongoing
fund expenses. The charges and
expenses used in the standardized
returns are obtained from the most
recent prospectus and/or
shareholder report available to
Morningstar. Benchmark returns may
or may not be adjusted to reflect
ongoing expenses. An investment's
portfolio may differ significantly from
the securities in the benchmark. The
investment(s) returns do not
necessarily reflect the deduction of
all investment advisory fees. Client
investment returns will be reduced
due to custodial and transaction fees.
The investment growth graph
compares the growth of $10,000
simultaneously invested in the
AHA16 Moderate Portfolio and that
of the benchmark, Dow Jones
Moderate TR USD. The benchmark is
an unmanaged portfolio of specified
securities and cannot be invested in
directly. The portfolio may differ
significantly from the securities in the
benchmark. E. Rick Adams & R. Brook Hansen are Investment Advisor Representatives offering Advisory Services through Creative
Wealth Strategies, Inc. dba Adams-Hansen & Associates, a Registered Investment Advisor.
CurrentStock Holdings: 8,989 Bond Holdings: 2,714
Expected Return: 10.09Risk: 15.75
Yield: 2.95Fund Expenses: .19%
BOND
CASH
US STOCK
NON US STOCK
OTHER
NOT CLASSIFIED
TOTAL
26.44
1.60
52.28
19.38
0.30
0.00
100.00
0.00
0.00
58.34
0.39
41.27
0.00
100.00
PORTFOLIO % BMARK %
LTD MOD EXT
HIG
HM
EDL
OW
0-10 10-25 25-50 >50
LA
RG
EM
IDS
MA
LL
VALUE CORE GROWTH
0-10 10-25 25-50 >50
A Registered Investment Advisor
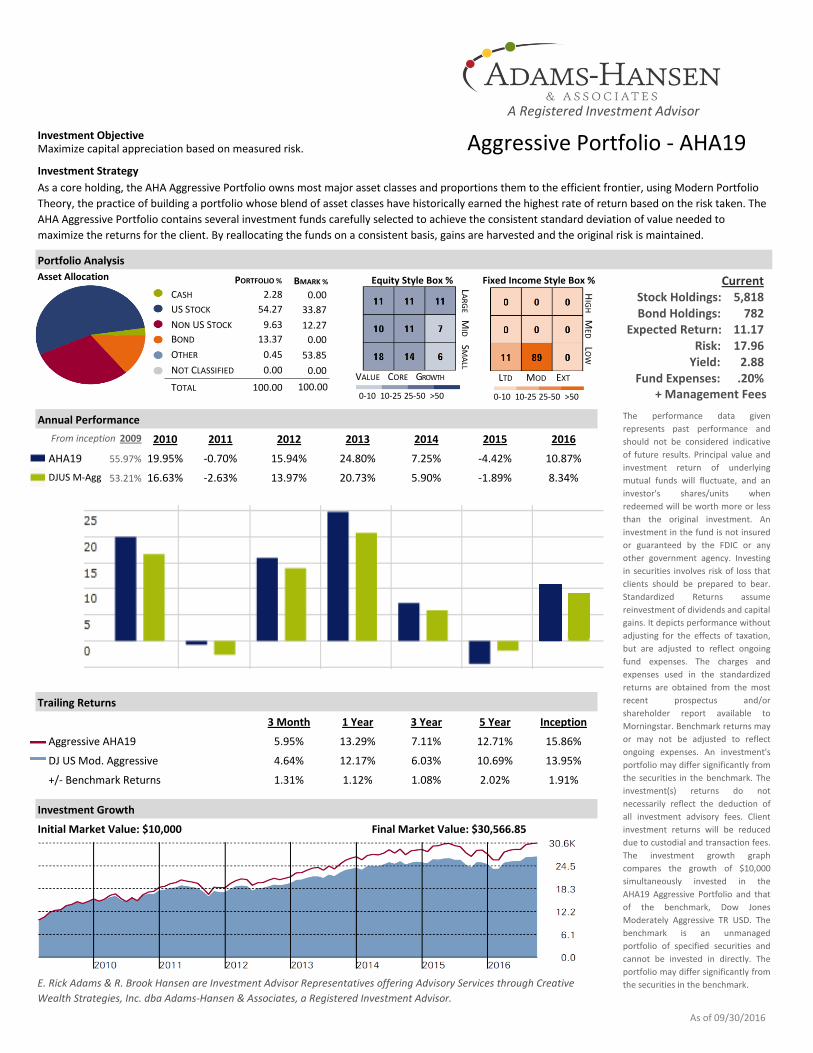
Investment ObjectiveMaximize capital appreciation based on measured risk.
Investment Strategy
Portfolio Analysis
Asset Allocation Equity Style Box % Fixed Income Style Box %
+ Management Fees
Annual Performance
From inception 2009 2010 2011 2012 2013 2014 2015 2016
AHA19 55.97% 19.95% -0.70% 15.94% 24.80% 7.25% -4.42% 10.87%
DJUS M-Agg 53.21% 16.63% -2.63% 13.97% 20.73% 5.90% -1.89% 8.34%
Trailing Returns
3 Month 1 Year 3 Year 5 Year Inception
Aggressive AHA19 5.95% 13.29% 7.11% 12.71% 15.86%
DJ US Mod. Aggressive 4.64% 12.17% 6.03% 10.69% 13.95%
+/- Benchmark Returns 1.31% 1.12% 1.08% 2.02% 1.91%
Investment Growth
Initial Market Value: $10,000 Final Market Value: $30,566.85
As of 09/30/2016
Aggressive Portfolio - AHA19
As a core holding, the AHA Aggressive Portfolio owns most major asset classes and proportions them to the efficient frontier, using Modern Portfolio
Theory, the practice of building a portfolio whose blend of asset classes have historically earned the highest rate of return based on the risk taken. The
AHA Aggressive Portfolio contains several investment funds carefully selected to achieve the consistent standard deviation of value needed to
maximize the returns for the client. By reallocating the funds on a consistent basis, gains are harvested and the original risk is maintained.
The performance data given
represents past performance and
should not be considered indicative
of future results. Principal value and
investment return of underlying
mutual funds will fluctuate, and an
investor's shares/units when
redeemed will be worth more or less
than the original investment. An
investment in the fund is not insured
or guaranteed by the FDIC or any
other government agency. Investing
in securities involves risk of loss that
clients should be prepared to bear.
Standardized Returns assume
reinvestment of dividends and capital
gains. It depicts performance without
adjusting for the effects of taxation,
but are adjusted to reflect ongoing
fund expenses. The charges and
expenses used in the standardized
returns are obtained from the most
recent prospectus and/or
shareholder report available to
Morningstar. Benchmark returns may
or may not be adjusted to reflect
ongoing expenses. An investment's
portfolio may differ significantly from
the securities in the benchmark. The
investment(s) returns do not
necessarily reflect the deduction of
all investment advisory fees. Client
investment returns will be reduced
due to custodial and transaction fees.
The investment growth graph
compares the growth of $10,000
simultaneously invested in the
AHA19 Aggressive Portfolio and that
of the benchmark, Dow Jones
Moderately Aggressive TR USD. The
benchmark is an unmanaged
portfolio of specified securities and
cannot be invested in directly. The
portfolio may differ significantly from
the securities in the benchmark. E. Rick Adams & R. Brook Hansen are Investment Advisor Representatives offering Advisory Services through Creative
Wealth Strategies, Inc. dba Adams-Hansen & Associates, a Registered Investment Advisor.
LTD MOD EXT
HIG
HM
EDL
OW
CurrentStock Holdings: 5,818 Bond Holdings: 782
Expected Return: 11.17Risk: 17.96
Yield: 2.88Fund Expenses: .20%
0-10 10-25 25-50 >50
LA
RG
EM
IDS
MA
LL
VALUE CORE GROWTH
BOND
CASH
US STOCK
NON US STOCK
OTHER
NOT CLASSIFIED
TOTAL
13.37
2.28
54.27
9.63
0.45
0.00
100.00
0.00
0.00
33.87
12.27
53.85
0.00
100.00
PORTFOLIO % BMARK %
0-10 10-25 25-50 >50
A Registered Investment Advisor
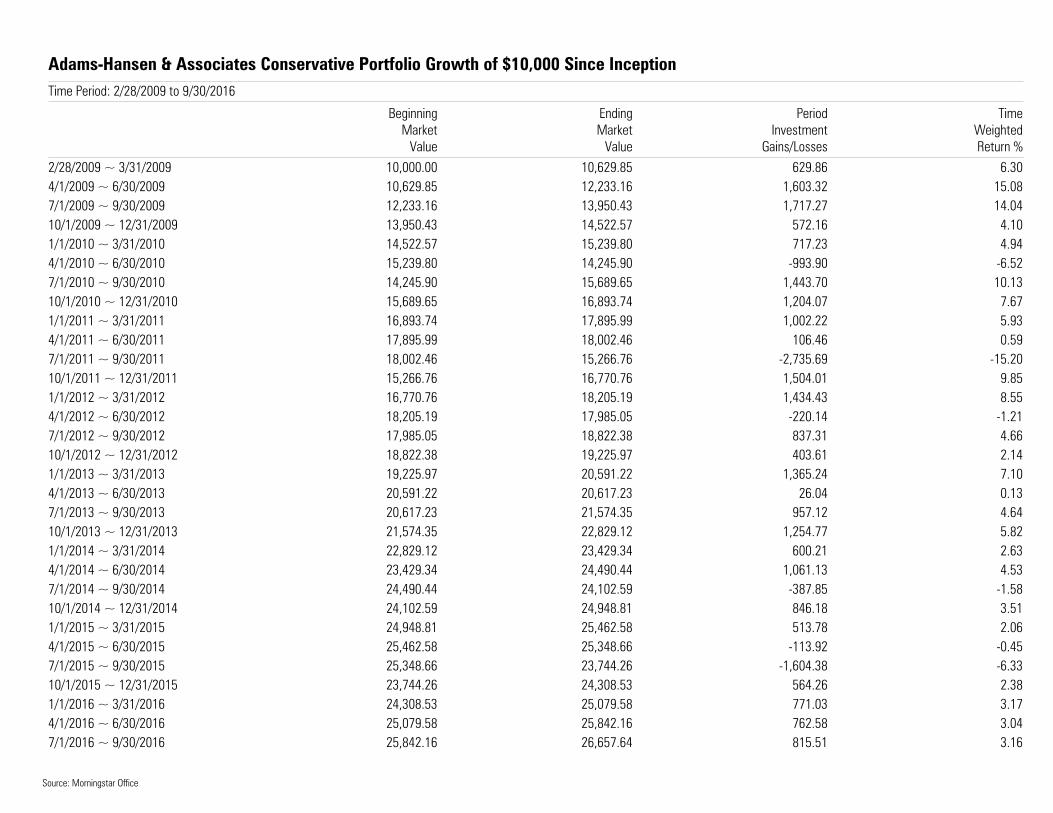
Adams-Hansen & Associates Conservative Portfolio Growth of $10,000 Since InceptionTime Period: 2/28/2009 to 9/30/2016
BeginningMarket
Value
EndingMarket
Value
PeriodInvestment
Gains/Losses
TimeWeightedReturn %
2/28/2009 ~ 3/31/20094/1/2009 ~ 6/30/20097/1/2009 ~ 9/30/200910/1/2009 ~ 12/31/20091/1/2010 ~ 3/31/20104/1/2010 ~ 6/30/20107/1/2010 ~ 9/30/201010/1/2010 ~ 12/31/20101/1/2011 ~ 3/31/20114/1/2011 ~ 6/30/20117/1/2011 ~ 9/30/201110/1/2011 ~ 12/31/20111/1/2012 ~ 3/31/20124/1/2012 ~ 6/30/20127/1/2012 ~ 9/30/201210/1/2012 ~ 12/31/20121/1/2013 ~ 3/31/20134/1/2013 ~ 6/30/20137/1/2013 ~ 9/30/201310/1/2013 ~ 12/31/20131/1/2014 ~ 3/31/20144/1/2014 ~ 6/30/20147/1/2014 ~ 9/30/201410/1/2014 ~ 12/31/20141/1/2015 ~ 3/31/20154/1/2015 ~ 6/30/20157/1/2015 ~ 9/30/201510/1/2015 ~ 12/31/20151/1/2016 ~ 3/31/20164/1/2016 ~ 6/30/20167/1/2016 ~ 9/30/2016
10,000.00 10,629.85 629.86 6.3010,629.85 12,233.16 1,603.32 15.0812,233.16 13,950.43 1,717.27 14.0413,950.43 14,522.57 572.16 4.1014,522.57 15,239.80 717.23 4.9415,239.80 14,245.90 -993.90 -6.5214,245.90 15,689.65 1,443.70 10.1315,689.65 16,893.74 1,204.07 7.6716,893.74 17,895.99 1,002.22 5.9317,895.99 18,002.46 106.46 0.5918,002.46 15,266.76 -2,735.69 -15.2015,266.76 16,770.76 1,504.01 9.8516,770.76 18,205.19 1,434.43 8.5518,205.19 17,985.05 -220.14 -1.2117,985.05 18,822.38 837.31 4.6618,822.38 19,225.97 403.61 2.1419,225.97 20,591.22 1,365.24 7.1020,591.22 20,617.23 26.04 0.1320,617.23 21,574.35 957.12 4.6421,574.35 22,829.12 1,254.77 5.8222,829.12 23,429.34 600.21 2.6323,429.34 24,490.44 1,061.13 4.5324,490.44 24,102.59 -387.85 -1.5824,102.59 24,948.81 846.18 3.5124,948.81 25,462.58 513.78 2.0625,462.58 25,348.66 -113.92 -0.4525,348.66 23,744.26 -1,604.38 -6.3323,744.26 24,308.53 564.26 2.3824,308.53 25,079.58 771.03 3.1725,079.58 25,842.16 762.58 3.0425,842.16 26,657.64 815.51 3.16
Source: Morningstar Office
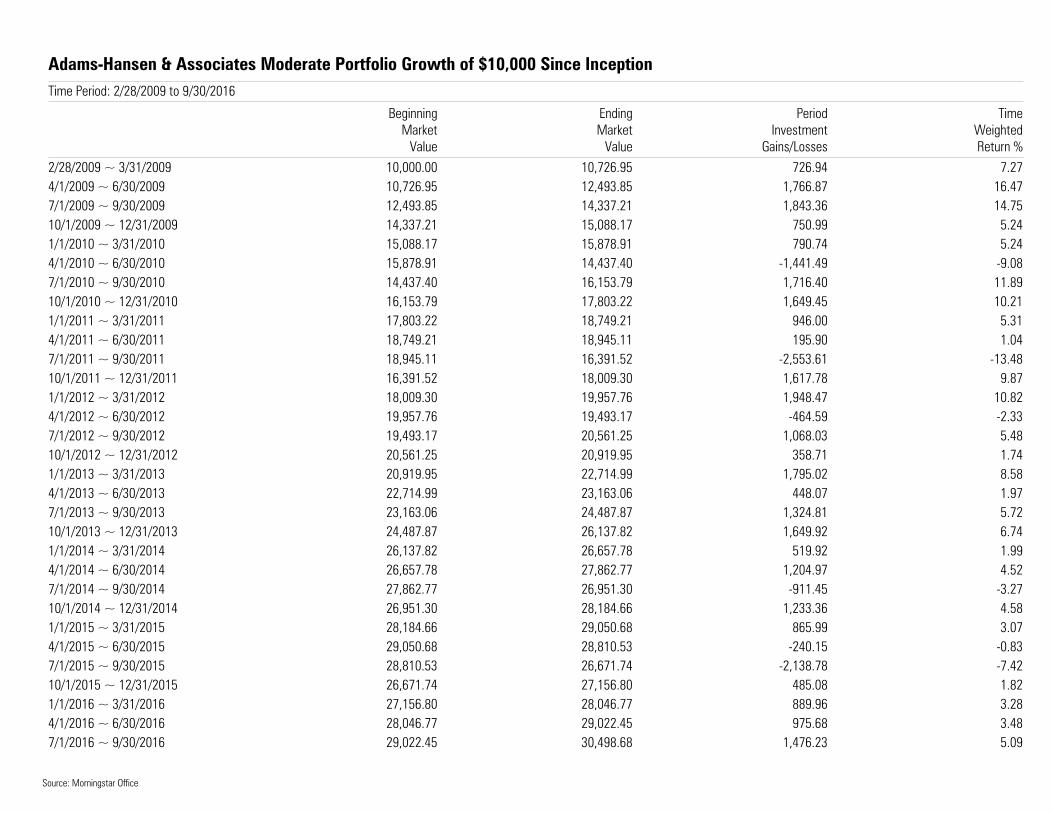
Adams-Hansen & Associates Moderate Portfolio Growth of $10,000 Since InceptionTime Period: 2/28/2009 to 9/30/2016
BeginningMarket
Value
EndingMarket
Value
PeriodInvestment
Gains/Losses
TimeWeightedReturn %
2/28/2009 ~ 3/31/20094/1/2009 ~ 6/30/20097/1/2009 ~ 9/30/200910/1/2009 ~ 12/31/20091/1/2010 ~ 3/31/20104/1/2010 ~ 6/30/20107/1/2010 ~ 9/30/201010/1/2010 ~ 12/31/20101/1/2011 ~ 3/31/20114/1/2011 ~ 6/30/20117/1/2011 ~ 9/30/201110/1/2011 ~ 12/31/20111/1/2012 ~ 3/31/20124/1/2012 ~ 6/30/20127/1/2012 ~ 9/30/201210/1/2012 ~ 12/31/20121/1/2013 ~ 3/31/20134/1/2013 ~ 6/30/20137/1/2013 ~ 9/30/201310/1/2013 ~ 12/31/20131/1/2014 ~ 3/31/20144/1/2014 ~ 6/30/20147/1/2014 ~ 9/30/201410/1/2014 ~ 12/31/20141/1/2015 ~ 3/31/20154/1/2015 ~ 6/30/20157/1/2015 ~ 9/30/201510/1/2015 ~ 12/31/20151/1/2016 ~ 3/31/20164/1/2016 ~ 6/30/20167/1/2016 ~ 9/30/2016
10,000.00 10,726.95 726.94 7.2710,726.95 12,493.85 1,766.87 16.4712,493.85 14,337.21 1,843.36 14.7514,337.21 15,088.17 750.99 5.2415,088.17 15,878.91 790.74 5.2415,878.91 14,437.40 -1,441.49 -9.0814,437.40 16,153.79 1,716.40 11.8916,153.79 17,803.22 1,649.45 10.2117,803.22 18,749.21 946.00 5.3118,749.21 18,945.11 195.90 1.0418,945.11 16,391.52 -2,553.61 -13.4816,391.52 18,009.30 1,617.78 9.8718,009.30 19,957.76 1,948.47 10.8219,957.76 19,493.17 -464.59 -2.3319,493.17 20,561.25 1,068.03 5.4820,561.25 20,919.95 358.71 1.7420,919.95 22,714.99 1,795.02 8.5822,714.99 23,163.06 448.07 1.9723,163.06 24,487.87 1,324.81 5.7224,487.87 26,137.82 1,649.92 6.7426,137.82 26,657.78 519.92 1.9926,657.78 27,862.77 1,204.97 4.5227,862.77 26,951.30 -911.45 -3.2726,951.30 28,184.66 1,233.36 4.5828,184.66 29,050.68 865.99 3.0729,050.68 28,810.53 -240.15 -0.8328,810.53 26,671.74 -2,138.78 -7.4226,671.74 27,156.80 485.08 1.8227,156.80 28,046.77 889.96 3.2828,046.77 29,022.45 975.68 3.4829,022.45 30,498.68 1,476.23 5.09
Source: Morningstar Office
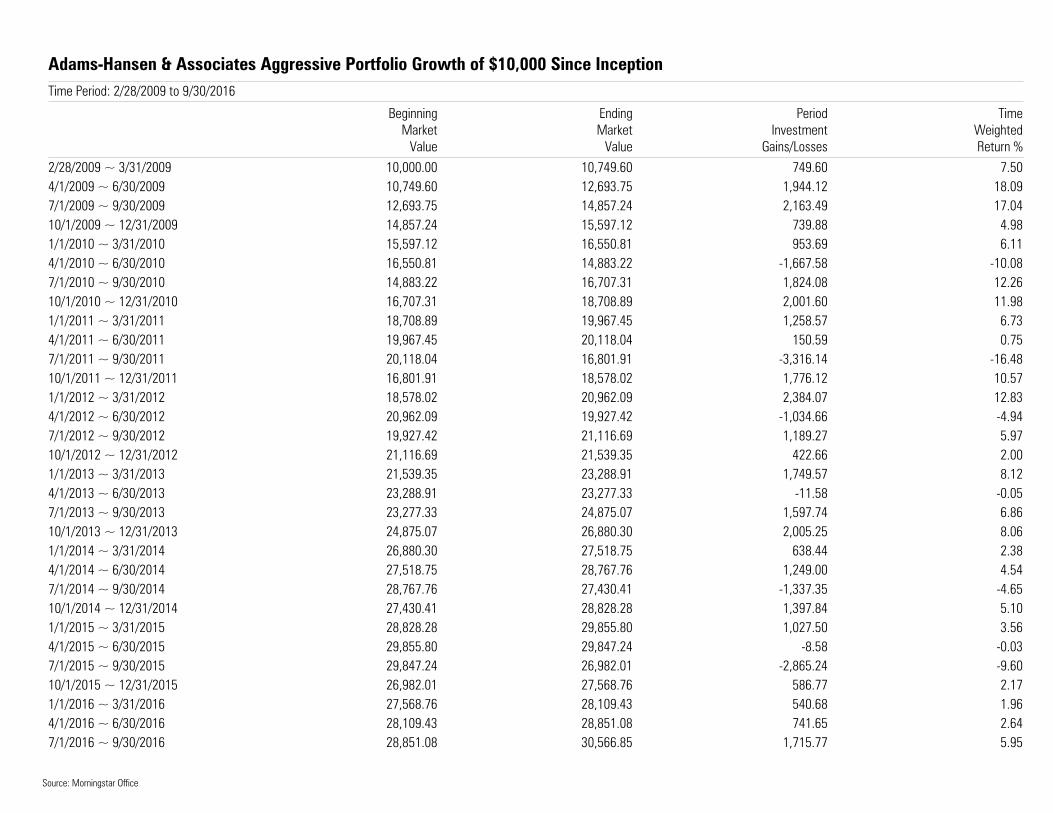
Adams-Hansen & Associates Aggressive Portfolio Growth of $10,000 Since InceptionTime Period: 2/28/2009 to 9/30/2016
BeginningMarket
Value
EndingMarket
Value
PeriodInvestment
Gains/Losses
TimeWeightedReturn %
2/28/2009 ~ 3/31/20094/1/2009 ~ 6/30/20097/1/2009 ~ 9/30/200910/1/2009 ~ 12/31/20091/1/2010 ~ 3/31/20104/1/2010 ~ 6/30/20107/1/2010 ~ 9/30/201010/1/2010 ~ 12/31/20101/1/2011 ~ 3/31/20114/1/2011 ~ 6/30/20117/1/2011 ~ 9/30/201110/1/2011 ~ 12/31/20111/1/2012 ~ 3/31/20124/1/2012 ~ 6/30/20127/1/2012 ~ 9/30/201210/1/2012 ~ 12/31/20121/1/2013 ~ 3/31/20134/1/2013 ~ 6/30/20137/1/2013 ~ 9/30/201310/1/2013 ~ 12/31/20131/1/2014 ~ 3/31/20144/1/2014 ~ 6/30/20147/1/2014 ~ 9/30/201410/1/2014 ~ 12/31/20141/1/2015 ~ 3/31/20154/1/2015 ~ 6/30/20157/1/2015 ~ 9/30/201510/1/2015 ~ 12/31/20151/1/2016 ~ 3/31/20164/1/2016 ~ 6/30/20167/1/2016 ~ 9/30/2016
10,000.00 10,749.60 749.60 7.5010,749.60 12,693.75 1,944.12 18.0912,693.75 14,857.24 2,163.49 17.0414,857.24 15,597.12 739.88 4.9815,597.12 16,550.81 953.69 6.1116,550.81 14,883.22 -1,667.58 -10.0814,883.22 16,707.31 1,824.08 12.2616,707.31 18,708.89 2,001.60 11.9818,708.89 19,967.45 1,258.57 6.7319,967.45 20,118.04 150.59 0.7520,118.04 16,801.91 -3,316.14 -16.4816,801.91 18,578.02 1,776.12 10.5718,578.02 20,962.09 2,384.07 12.8320,962.09 19,927.42 -1,034.66 -4.9419,927.42 21,116.69 1,189.27 5.9721,116.69 21,539.35 422.66 2.0021,539.35 23,288.91 1,749.57 8.1223,288.91 23,277.33 -11.58 -0.0523,277.33 24,875.07 1,597.74 6.8624,875.07 26,880.30 2,005.25 8.0626,880.30 27,518.75 638.44 2.3827,518.75 28,767.76 1,249.00 4.5428,767.76 27,430.41 -1,337.35 -4.6527,430.41 28,828.28 1,397.84 5.1028,828.28 29,855.80 1,027.50 3.5629,855.80 29,847.24 -8.58 -0.0329,847.24 26,982.01 -2,865.24 -9.6026,982.01 27,568.76 586.77 2.1727,568.76 28,109.43 540.68 1.9628,109.43 28,851.08 741.65 2.6428,851.08 30,566.85 1,715.77 5.95
Source: Morningstar Office


![[XLS] · Web viewSheet1 Number of returns Number of exemptions Franklin County Jefferson County Madison County Washington County Adams County Clark County ILLINOIS Alexander County](https://img.pdfslide.net/doc/110x75/5aafbcbe7f8b9a07498db3a0/xls-viewsheet1-number-of-returns-number-of-exemptions-franklin-county-jefferson.jpg)

![[XLS] · Web viewSheet1 Number of returns Number of exemptions Jefferson County Washington County Adams County PENNSYLVANIA Allegheny County Armstrong County Beaver County Bedford](https://img.pdfslide.net/doc/110x75/5aafbcbe7f8b9a07498db394/xls-viewsheet1-number-of-returns-number-of-exemptions-jefferson-county-washington.jpg)