Embed Size (px)
Citation preview
1
News Release
Ameriprise Financial Reports Third Quarter 2006 Results
Net income per diluted share $0.71 for the quarter, including $0.23 of non-recurring
separation costs
Adjusted earnings per diluted share for the quarter $0.94 MINNEAPOLIS – October 24, 2006 – Ameriprise Financial, Inc. (NYSE: AMP) today reported net income of $174 million for the quarter ended September 30, 2006 versus net income of $125 million and income before discontinued operations of $123 million for the year-ago quarter. Adjusted earnings increased 29 percent to $231 million in the third quarter of 2006 compared to the third quarter of 2005. Adjusted earnings exclude income from discontinued operations, after-tax non-recurring separation costs and after-tax earnings in the 2005 period of AMEX Assurance, which remained with American Express.(1) Net income per diluted share for the third quarter of 2006 was $0.71. Adjusted earnings per diluted share for the third quarter of 2006 were $0.94, up 29 percent from the year-ago period. Both per share amounts are based on an average diluted share count of 246 million. Revenues grew 6 percent to $2.0 billion in the third quarter of 2006. Adjusted revenues, which exclude the impact of AMEX Assurance in the 2005 period, grew 5 percent and include the impact of the sale of the Company’s defined contribution recordkeeping business, which reduced revenues by 1 percent. Growth reflected fundamental improvement in asset-based fees and premiums, partially offset by declines in net investment income. Return on equity for the 12 months ended September 30, 2006 was 7.6 percent. Adjusted return on equity increased to 11.2 percent compared to 10.4 percent for the comparable period last year. During the quarter, the Company repurchased more than 2.3 million shares of its common stock for approximately $106 million. "After our first year as an independent, public company, our business continues to show strong, positive momentum," said Jim Cracchiolo, chairman and chief executive officer. “We successfully maintained our focus on executing against our strategic objectives, while effectively managing our separation. We continued to build the Ameriprise Financial brand, grew our mass affluent client base and improved the productivity of the advisor force. This focus led to growth in cash sales and increased client assets primarily driven by strong net inflows into wrap accounts and variable annuities. Importantly, we’ve invested in our infrastructure and strengthened our platform for growth.” (1) See definitions and reconciliations throughout the release.
2
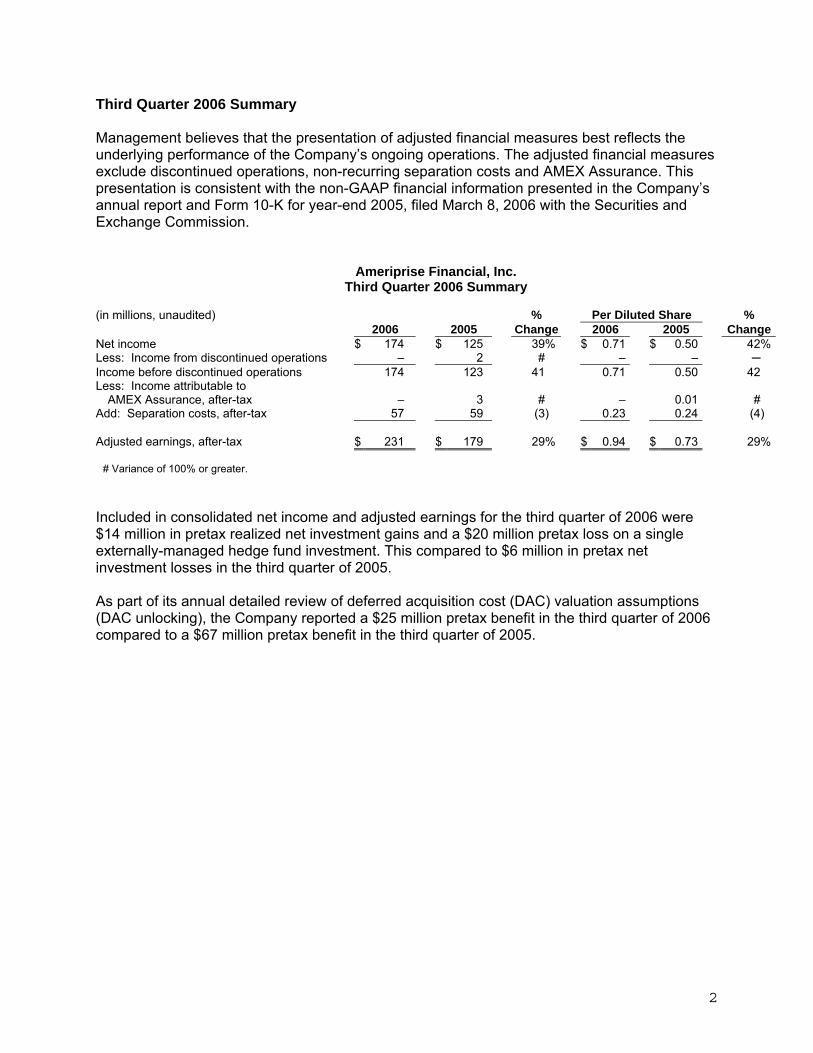
Third Quarter 2006 Summary Management believes that the presentation of adjusted financial measures best reflects the underlying performance of the Company’s ongoing operations. The adjusted financial measures exclude discontinued operations, non-recurring separation costs and AMEX Assurance. This presentation is consistent with the non-GAAP financial information presented in the Company’s annual report and Form 10-K for year-end 2005, filed March 8, 2006 with the Securities and Exchange Commission.
Ameriprise Financial, Inc. Third Quarter 2006 Summary
(in millions, unaudited) % Per Diluted Share %
2006 2005 Change 2006 2005 ChangeNet income $ 174 $ 125 39% $ 0.71 $ 0.50 42%Less: Income from discontinued operations – 2 # – – ─ Income before discontinued operations 174 123 41 0.71 0.50 42 Less: Income attributable to
AMEX Assurance, after-tax – 3 # – 0.01 # Add: Separation costs, after-tax 57 59 (3) 0.23 0.24 (4) Adjusted earnings, after-tax $ 231 $ 179 29% $ 0.94 $ 0.73 29%
# Variance of 100% or greater.
Included in consolidated net income and adjusted earnings for the third quarter of 2006 were $14 million in pretax realized net investment gains and a $20 million pretax loss on a single externally-managed hedge fund investment. This compared to $6 million in pretax net investment losses in the third quarter of 2005. As part of its annual detailed review of deferred acquisition cost (DAC) valuation assumptions (DAC unlocking), the Company reported a $25 million pretax benefit in the third quarter of 2006 compared to a $67 million pretax benefit in the third quarter of 2005.
3
Third Quarter 2006 Consolidated Operating Highlights The Company continues to successfully execute its strategy of acquiring mass affluent
clients, with the number of mass affluent client groups increasing 7 percent from the year-ago period. This increase helped drive average client assets for all branded advisor client groups to $91,600 compared to $83,300 in the year-ago period.
Financial planning penetration of newly acquired mass affluent client groups was 59 percent
year-to-date. Overall, client financial plan penetration ended the period at 44 percent compared to 43 percent in the prior year.
Strong advisor productivity increases drove 14 percent growth in total Gross Dealer
Concession (GDC) from the year-ago period, primarily driven by a 31 percent increase in wrap account balances.
During the quarter, the number of branded advisors increased by 79 to 10,634, up 1 percent
year-over-year, with total advisors up 2 percent year-over-year to 12,427. This change to positive quarterly net gain in the branded advisor channel was primarily driven by improving employee and franchisee advisor retention, with franchisee advisor retention reaching pre-separation levels of 93 percent.
Owned, managed and administered assets were $440 billion at September 30, 2006 with
year-over-year growth of 5 percent. This reflected the sale of the defined contribution recordkeeping business in the second quarter of 2006, which resulted in the transfer of $17 billion in administered assets and lowered year-over-year reported growth by 4 percent.
Strong net inflows in wrap accounts and variable annuities continued with $1.8 billion in
wrap net inflows and $1.4 billion in RiverSource annuity variable account net inflows. RiverSource mutual fund net outflows narrowed, declining to $0.8 billion compared to net
outflows of $2.7 billion in the prior-year period. This improvement was driven by both increased sales and lower redemption rates in the branded advisor channel.
Certificate and annuity fixed account net outflows of $1.3 billion reflected the Company’s
strategy to focus on products that both meet client needs and offer a more attractive return on capital. This decline in account balances lowered related capital requirements in the quarter.
The Company launched Ameriprise Bank, FSB and new home lending products establishing
a new capability for serving clients’ borrowing, cash management and personal trust needs. Life insurance in-force was up 9 percent year-over-year to $171 billion.
The Company continues to achieve targeted reengineering savings with a substantial
portion applied to fund a significant investment agenda for growth. The Company delivered strong operating results while simultaneously accomplishing its
separation objectives. With the majority of these objectives completed, the separation process continues to be well executed and on track.
4
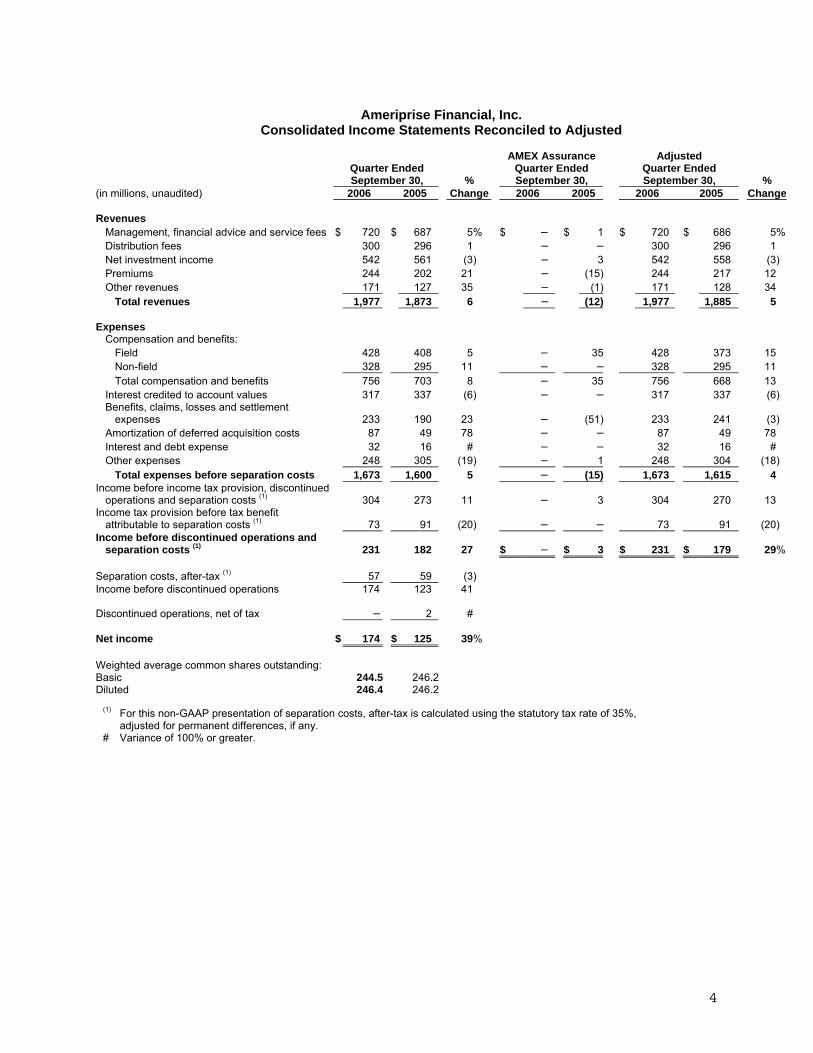
Ameriprise Financial, Inc.
Consolidated Income Statements Reconciled to Adjusted
Quarter Ended September 30, %
AMEX Assurance Quarter Ended September 30,
Adjusted Quarter Ended September 30, %
(in millions, unaudited) 2006 2005 Change 2006 2005 2006 2005 Change Revenues
Management, financial advice and service fees $ 720 $ 687 5% $ – $ 1 $ 720 $ 686 5%Distribution fees 300 296 1 – – 300 296 1 Net investment income 542 561 (3) – 3 542 558 (3) Premiums 244 202 21 – (15) 244 217 12 Other revenues 171 127 35 – (1) 171 128 34
Total revenues 1,977 1,873 6 – (12) 1,977 1,885 5 Expenses
Compensation and benefits: Field 428 408 5 – 35 428 373 15 Non-field 328 295 11 – – 328 295 11 Total compensation and benefits 756 703 8 – 35 756 668 13
Interest credited to account values 317 337 (6) – – 317 337 (6) Benefits, claims, losses and settlement
expenses 233 190 23 – (51) 233 241 (3) Amortization of deferred acquisition costs 87 49 78 – – 87 49 78 Interest and debt expense 32 16 # – – 32 16 # Other expenses 248 305 (19) – 1 248 304 (18)
Total expenses before separation costs 1,673 1,600 5 – (15) 1,673 1,615 4 Income before income tax provision, discontinued
operations and separation costs (1) 304 273 11 – 3 304 270 13 Income tax provision before tax benefit
attributable to separation costs (1) 73 91 (20) – – 73 91 (20) Income before discontinued operations and
separation costs (1) 231 182 27 $ – $ 3 $ 231 $ 179 29% Separation costs, after-tax (1) 57 59 (3) Income before discontinued operations 174 123 41 Discontinued operations, net of tax – 2 # Net income $ 174 $ 125 39% Weighted average common shares outstanding: Basic 244.5 246.2 Diluted 246.4 246.2
(1) For this non-GAAP presentation of separation costs, after-tax is calculated using the statutory tax rate of 35%, adjusted for permanent differences, if any.
# Variance of 100% or greater.
5
Third Quarter 2006 Consolidated Results Income before discontinued operations grew 41 percent to $174 million. Adjusted earnings grew 29 percent to $231 million, with adjusted pretax income up 13 percent compared to the year-ago quarter. The pretax benefit from DAC unlocking in the third quarter of 2006 was $25 million, compared to a benefit of $67 million in the prior-year period. Profits in the quarter were positively impacted by the Company’s efforts to gather assets and grow revenues from higher margin, less capital-intensive products, reflected in strong net inflows in wrap accounts and variable annuities. Market appreciation also favorably impacted results. These positives were partially offset by the impact of lower account balances and spread compression in the fixed annuity and certificate businesses in the Asset Accumulation and Income (AA&I) segment, increased accruals for management incentives in recognition of year-to-date performance, primarily in the AA&I segment, and increased interest expense from establishing an independent capital structure, reflected in the Corporate and Other segment. Revenues Consolidated revenues rose 6 percent to $2.0 billion. Adjusted revenues grew 5 percent. This growth reflected continued strong flows in wrap accounts and variable annuities, as well as market appreciation. These positives were offset by lower management fees due to the impact of the sale of the defined contribution recordkeeping business in the second quarter of 2006 and lower net investment income due to lower account balances in the fixed annuity and certificate businesses. In addition, revenues were impacted by lower distribution fees due to a shift from sales of loaded mutual funds to sales of load-waived mutual funds within wrap accounts. This shift is driven by clients migrating from transaction-based fee arrangements to asset-based fee arrangements, where the asset-based fees are paid over time. Management, financial advice and service fees grew 5 percent to $720 million. Underlying year-over-year growth was driven by 31 percent growth in wrap assets and 24 percent growth in annuity variable account assets. These increases were partially offset by $16 million in lower fees due to the sale of the defined contribution recordkeeping business. In addition, the third quarter of 2005 included $28 million in Threadneedle hedge fund performance fees. Combined, these two items lowered the growth rate by more than 6 percent. The Company will recognize Threadneedle annual hedge fund performance fees earned in the fourth quarter of 2006. Distribution fees grew 1 percent to $300 million. Underlying business activity was strong, with total cash sales up 9 percent. This was offset by the impact of a mix shift from sales of loaded mutual funds to sales of load-waived mutual funds within wrap accounts. Net investment income declined 3 percent to $542 million. This reflected the ongoing trend of declining assets supporting the fixed annuity and certificate businesses. In total, changes in realized net investment gains, investment income from hedges related to stock market certificates, equity index annuities, Guaranteed Minimum Withdrawal Benefit (GMWB) annuities, and other investment income had no impact on the year-over-year decline. In addition, in accordance with EITF 04-5 beginning in 2006, the current quarter included a benefit from the consolidation of certain hedge funds managed by RiverSource Investments. Premiums grew 21 percent to $244 million. Adjusted premiums grew 12 percent. The increase was favorably impacted by a $15 million adjustment in premiums resulting from a review of the long term care (LTC) reinsurance arrangement during the third quarter of 2006. In addition to
6
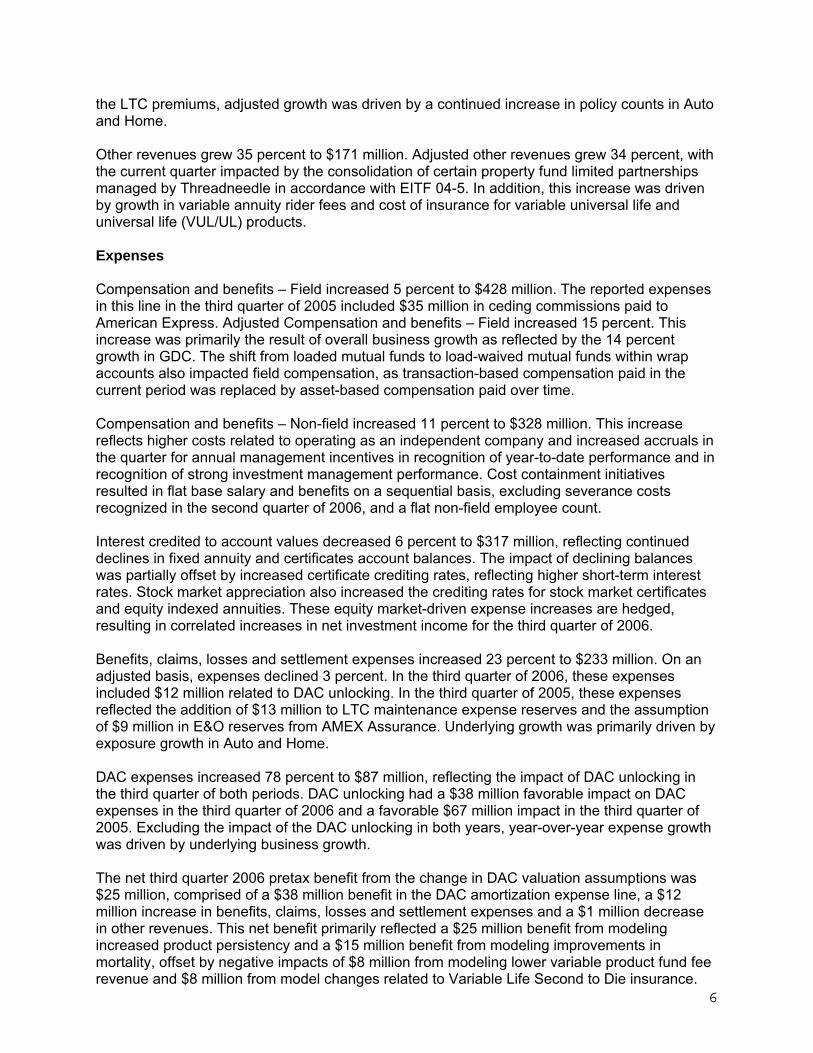
the LTC premiums, adjusted growth was driven by a continued increase in policy counts in Auto and Home. Other revenues grew 35 percent to $171 million. Adjusted other revenues grew 34 percent, with the current quarter impacted by the consolidation of certain property fund limited partnerships managed by Threadneedle in accordance with EITF 04-5. In addition, this increase was driven by growth in variable annuity rider fees and cost of insurance for variable universal life and universal life (VUL/UL) products. Expenses Compensation and benefits – Field increased 5 percent to $428 million. The reported expenses in this line in the third quarter of 2005 included $35 million in ceding commissions paid to American Express. Adjusted Compensation and benefits – Field increased 15 percent. This increase was primarily the result of overall business growth as reflected by the 14 percent growth in GDC. The shift from loaded mutual funds to load-waived mutual funds within wrap accounts also impacted field compensation, as transaction-based compensation paid in the current period was replaced by asset-based compensation paid over time. Compensation and benefits – Non-field increased 11 percent to $328 million. This increase reflects higher costs related to operating as an independent company and increased accruals in the quarter for annual management incentives in recognition of year-to-date performance and in recognition of strong investment management performance. Cost containment initiatives resulted in flat base salary and benefits on a sequential basis, excluding severance costs recognized in the second quarter of 2006, and a flat non-field employee count. Interest credited to account values decreased 6 percent to $317 million, reflecting continued declines in fixed annuity and certificates account balances. The impact of declining balances was partially offset by increased certificate crediting rates, reflecting higher short-term interest rates. Stock market appreciation also increased the crediting rates for stock market certificates and equity indexed annuities. These equity market-driven expense increases are hedged, resulting in correlated increases in net investment income for the third quarter of 2006. Benefits, claims, losses and settlement expenses increased 23 percent to $233 million. On an adjusted basis, expenses declined 3 percent. In the third quarter of 2006, these expenses included $12 million related to DAC unlocking. In the third quarter of 2005, these expenses reflected the addition of $13 million to LTC maintenance expense reserves and the assumption of $9 million in E&O reserves from AMEX Assurance. Underlying growth was primarily driven by exposure growth in Auto and Home. DAC expenses increased 78 percent to $87 million, reflecting the impact of DAC unlocking in the third quarter of both periods. DAC unlocking had a $38 million favorable impact on DAC expenses in the third quarter of 2006 and a favorable $67 million impact in the third quarter of 2005. Excluding the impact of the DAC unlocking in both years, year-over-year expense growth was driven by underlying business growth. The net third quarter 2006 pretax benefit from the change in DAC valuation assumptions was $25 million, comprised of a $38 million benefit in the DAC amortization expense line, a $12 million increase in benefits, claims, losses and settlement expenses and a $1 million decrease in other revenues. This net benefit primarily reflected a $25 million benefit from modeling increased product persistency and a $15 million benefit from modeling improvements in mortality, offset by negative impacts of $8 million from modeling lower variable product fund fee revenue and $8 million from model changes related to Variable Life Second to Die insurance.

7
Interest and debt expense increased from $16 million to $32 million, as the Company established its long-term independent corporate capital structure. The Company replaced short-term debt with fixed rate, medium-term debt in the fourth quarter of 2005 and issued junior subordinated notes (hybrid securities) in the second quarter of 2006. Other expenses were down 19 percent to $248 million. Adjusted other expenses declined 18 percent. This decrease was primarily due to higher legal costs in the third quarter of 2005. In 2006, other expenses included expenses consolidated under EITF 04-5 related to certain property fund limited partnerships managed by Threadneedle and certain hedge funds managed by RiverSource. The remaining components of this expense line were down 10 percent, reflecting management’s continuing commitment to tightly manage costs. Taxes The effective tax rate on net income before discontinued operations was 19.8 percent, down from 32.0 percent in the third quarter of 2005. The effective tax rate on adjusted earnings was 24.0 percent, down from 33.7 percent in the third quarter of 2005. Included in the third quarter of 2006 was a $13 million tax benefit related to the finalization of prior-period tax returns. Included in the third quarter of 2005 was a $13 million increase in tax expense related to the finalization of prior-period tax returns. Balance Sheet and Capital During the third quarter of 2006, the Company repurchased 2.3 million shares for approximately $106 million. The quarter-end basic share count was 243.5 million and the ending diluted share count was 245.8 million. The average diluted share count for the quarter was 246.4 million. Shareholders’ equity as of third quarter 2006 was $7.8 billion, essentially flat compared to the prior-year period as retained earnings were offset by $422 million in share repurchases and a $206 million decline in accumulated other comprehensive income primarily related to the impact of rising interest rates on the Company’s fixed income investment portfolio. Book value per outstanding share was $32.02 as of September 30, 2006. The Company remains committed to maintaining the safety and soundness of its balance sheet, continuing to maintain substantial liquidity and a high quality investment portfolio, and continuing to actively manage and mitigate risk exposures.
Cash and cash equivalents increased $1.2 billion in the quarter to $3.3 billion, primarily as a result of establishing Ameriprise Bank, FSB. Liabilities related to these bank assets are now reported in the customer deposits liability line along with certificate reserves.
The quality of the investment portfolio remained high with 7 percent of the fixed
income portfolio in below investment grade securities. As part of its capital optimization program, the Company has been strategically liquidating externally managed hedge funds, with the September 30, 2006 market value of approximately $130 million, down 67 percent since separation.
Unrealized net investment losses in the Available-for-Sale investment portfolio
were $0.4 billion at quarter end.
8
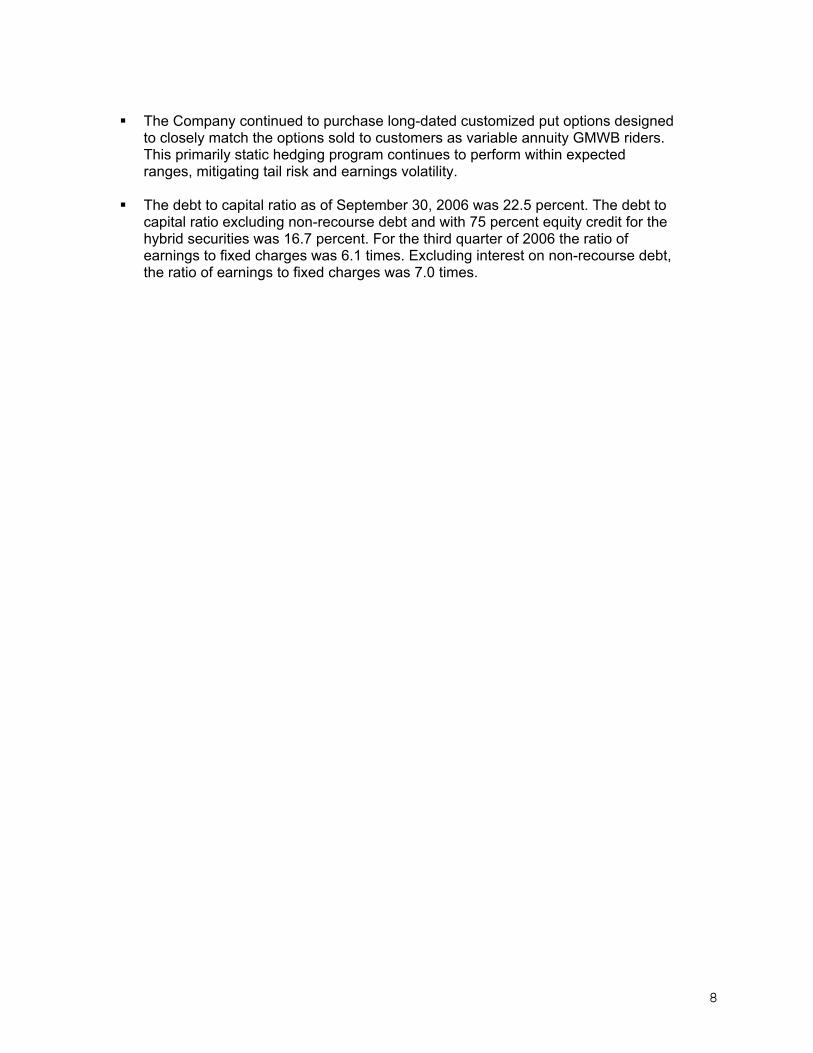
The Company continued to purchase long-dated customized put options designed
to closely match the options sold to customers as variable annuity GMWB riders. This primarily static hedging program continues to perform within expected ranges, mitigating tail risk and earnings volatility.
The debt to capital ratio as of September 30, 2006 was 22.5 percent. The debt to
capital ratio excluding non-recourse debt and with 75 percent equity credit for the hybrid securities was 16.7 percent. For the third quarter of 2006 the ratio of earnings to fixed charges was 6.1 times. Excluding interest on non-recourse debt, the ratio of earnings to fixed charges was 7.0 times.

9
Asset Accumulation and Income Segment
Income Statements
Quarter Ended September 30, %
(in millions, unaudited) 2006 2005 Change
Revenues Management, financial advice and service fees $ 657 $ 623 5% Distribution fees 272 269 1 Net investment income 443 480 (8) Other revenues 51 12 #
Total revenues 1,423 1,384 3
Expenses Compensation and benefits - field 370 331 12 Interest credited to account values 281 300 (6) Benefits, claims, losses and settlement expenses 3 7 (57) Amortization of deferred acquisition costs 98 69 42 Interest and debt expense 4 – – Other expenses 475 493 (4)
Total expenses 1,231 1,200 3 Pretax segment income $ 192 $ 184 4% # Variance of 100% or greater.
Asset Accumulation and Income Segment – Third Quarter 2006 Results Pretax segment income increased $8 million, or 4 percent, to $192 million for the third quarter. Strong underlying growth was driven primarily by broker-dealer activities, offset by significant declines in income generated by fixed annuity and certificate products. Total revenues increased $39 million, or 3 percent, to $1.4 billion, reflecting strong broker-dealer activity, continued growth in fee-based assets related to wrap account and variable annuity inflows, as well as market appreciation. Revenue growth was negatively impacted by the sale of the defined contribution recordkeeping business in the second quarter of 2006. Growth was also impacted by a $37 million year-over-year decline in net investment income, reflecting lower annuity related investment income, primarily as a result of declining account balances and the allocation to this segment of $15 million of the previously mentioned externally-managed hedge fund loss. In addition, net investment income included $12 million in income from the consolidation of certain hedge funds managed by RiverSource in accordance with EITF 04-5. Total expenses increased $31 million, or 3 percent, to $1.2 billion, primarily due to a $39 million increase in field compensation related to business growth and an increase of $29 million in DAC amortization expenses including the impact of DAC unlocking in the third quarter of both periods. A substantial decline in year-over-year legal and regulatory expenses was partially offset by increased accruals in the quarter for higher estimated performance-based compensation in recognition of year-to-date performance and in recognition of strong investment management performance, as well as the year-over-year impact of DAC unlocking.
10
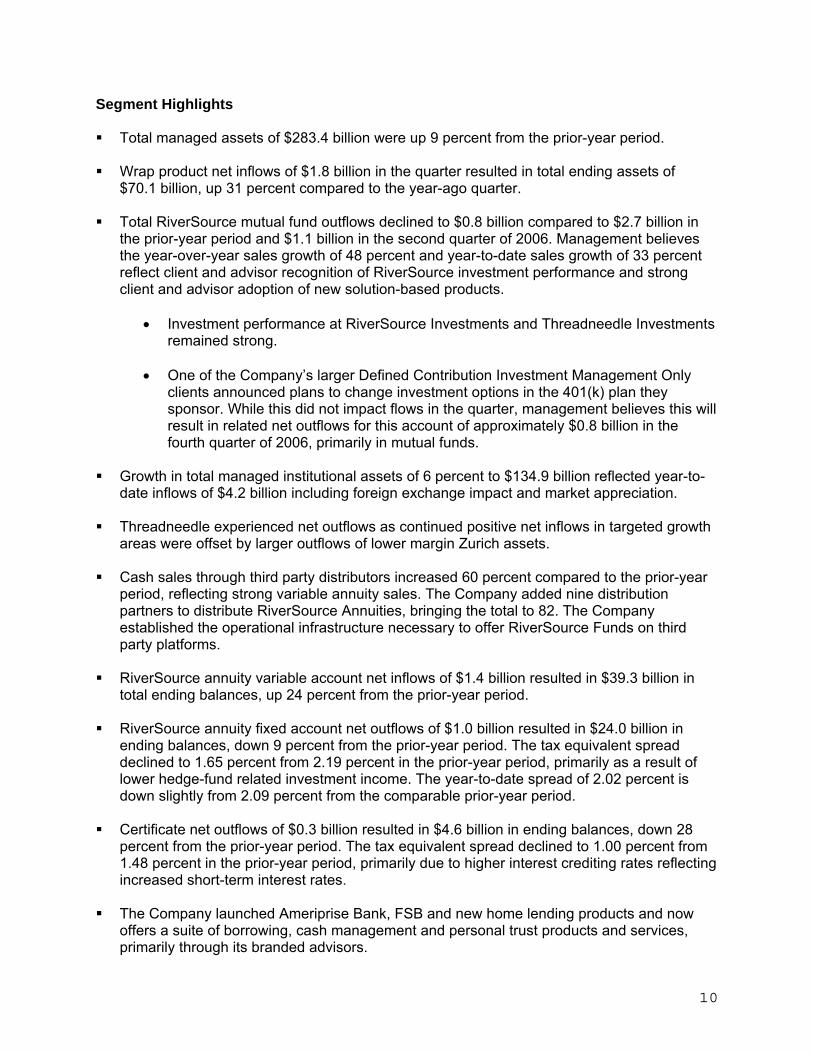
Segment Highlights Total managed assets of $283.4 billion were up 9 percent from the prior-year period.
Wrap product net inflows of $1.8 billion in the quarter resulted in total ending assets of
$70.1 billion, up 31 percent compared to the year-ago quarter. Total RiverSource mutual fund outflows declined to $0.8 billion compared to $2.7 billion in
the prior-year period and $1.1 billion in the second quarter of 2006. Management believes the year-over-year sales growth of 48 percent and year-to-date sales growth of 33 percent reflect client and advisor recognition of RiverSource investment performance and strong client and advisor adoption of new solution-based products.
• Investment performance at RiverSource Investments and Threadneedle Investments
remained strong. • One of the Company’s larger Defined Contribution Investment Management Only
clients announced plans to change investment options in the 401(k) plan they sponsor. While this did not impact flows in the quarter, management believes this will result in related net outflows for this account of approximately $0.8 billion in the fourth quarter of 2006, primarily in mutual funds.
Growth in total managed institutional assets of 6 percent to $134.9 billion reflected year-to-
date inflows of $4.2 billion including foreign exchange impact and market appreciation. Threadneedle experienced net outflows as continued positive net inflows in targeted growth
areas were offset by larger outflows of lower margin Zurich assets. Cash sales through third party distributors increased 60 percent compared to the prior-year
period, reflecting strong variable annuity sales. The Company added nine distribution partners to distribute RiverSource Annuities, bringing the total to 82. The Company established the operational infrastructure necessary to offer RiverSource Funds on third party platforms.
RiverSource annuity variable account net inflows of $1.4 billion resulted in $39.3 billion in
total ending balances, up 24 percent from the prior-year period. RiverSource annuity fixed account net outflows of $1.0 billion resulted in $24.0 billion in
ending balances, down 9 percent from the prior-year period. The tax equivalent spread declined to 1.65 percent from 2.19 percent in the prior-year period, primarily as a result of lower hedge-fund related investment income. The year-to-date spread of 2.02 percent is down slightly from 2.09 percent from the comparable prior-year period.
Certificate net outflows of $0.3 billion resulted in $4.6 billion in ending balances, down 28
percent from the prior-year period. The tax equivalent spread declined to 1.00 percent from 1.48 percent in the prior-year period, primarily due to higher interest crediting rates reflecting increased short-term interest rates.
The Company launched Ameriprise Bank, FSB and new home lending products and now
offers a suite of borrowing, cash management and personal trust products and services, primarily through its branded advisors.

11
Protection Segment
Income Statements Reconciled to Adjusted
Quarter Ended September 30, %
AMEX Assurance Quarter Ended September 30,
Adjusted Quarter Ended September 30, %
(in millions, unaudited) 2006 2005 Change 2006 2005 2006 2005 Change
Revenues Management, financial advice and
service fees $ 20 $ 17 18% $ – $ 1 $ 20 $ 16 25% Distribution fees 27 27 – – – 27 27 – Net investment income 87 87 – – 3 87 84 4 Premiums 249 207 20 – (15) 249 222 12 Other revenues 115 108 6 – (1) 115 109 6
Total revenues 498 446 12 – (12) 498 458 9
Expenses Compensation and benefits – field 22 47 (53) – 35 22 12 83 Interest credited to account values 36 37 (3) – – 36 37 (3) Benefits, claims, losses and settlement
expenses 230 183 26 – (51) 230 234 (2) Amortization of deferred acquisition
costs (11) (20) 45 – – (11) (20) 45 Other expenses 70 67 4 – 1 70 66 6
Total expenses 347 314 11 – (15) 347 329 5 Pretax segment income $ 151 $ 132 14% $ – $ 3 $ 151 $ 129 17% Protection Segment – Third Quarter 2006 Results Adjusted financial information excludes AMEX Assurance from prior periods. Pretax segment income was up 14 percent to $151 million for the third quarter of 2006. Adjusted pretax segment income rose 17 percent driven by profitability improvements across all product lines. Revenues grew 12 percent to $498 million. Adjusted revenues grew 9 percent, or $40 million. This increase included a $15 million adjustment in premiums resulting from a review of the LTC reinsurance arrangement during the third quarter of 2006. The remaining growth was primarily driven by a 12 percent increase in revenues from Auto and Home. Expenses grew 11 percent to $347 million. Adjusted expenses grew 5 percent, or $18 million, reflecting underlying business growth. While adjusted expenses in the third quarters of both 2006 and 2005 reflected a number of disclosed items, in total these items were substantially equal in amount and direction for each period. As a result, these items did not materially impact adjusted expense trends or adjusted pretax income trends for this segment.
12
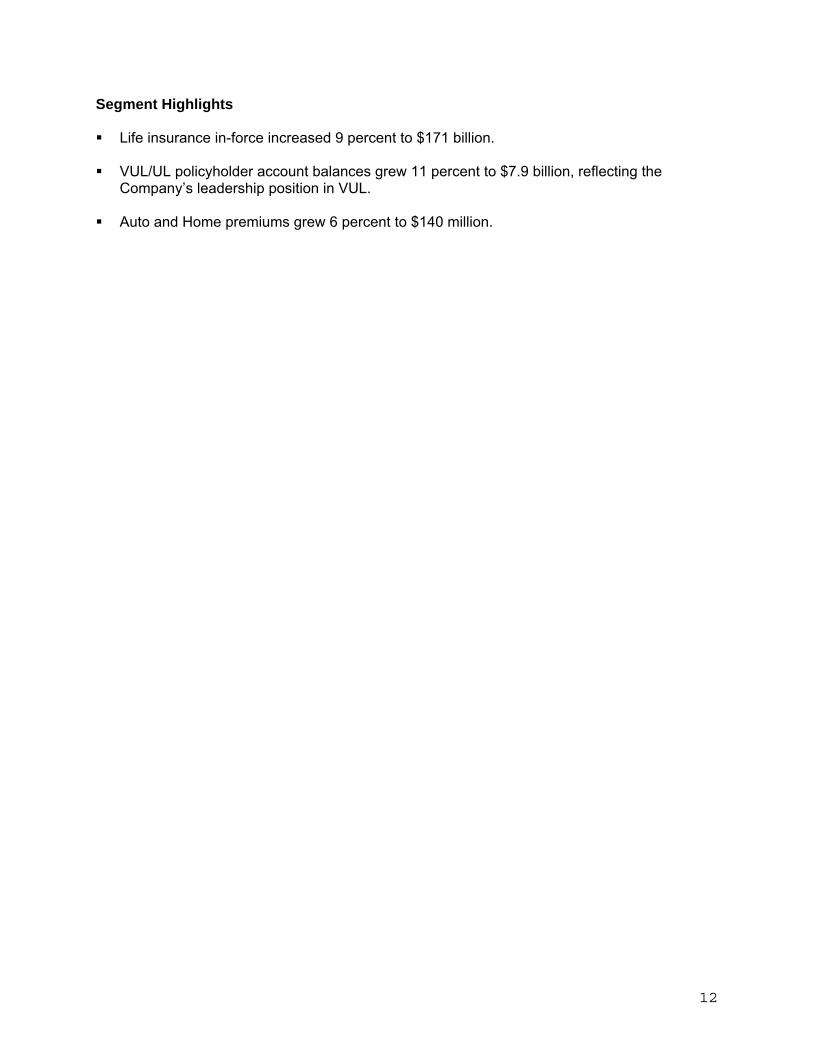
Segment Highlights Life insurance in-force increased 9 percent to $171 billion.
VUL/UL policyholder account balances grew 11 percent to $7.9 billion, reflecting the
Company’s leadership position in VUL. Auto and Home premiums grew 6 percent to $140 million.
13
Corporate and Other and Eliminations Segment
Income Statements
Quarter Ended September 30, %
(in millions, unaudited) 2006 2005 Change Revenues
Management, financial advice and service fees $ 43 $ 47 (9)% Distribution fees 1 – – Net investment income (loss) 12 (6) # Premiums (5) (5) – Other revenues 5 7 (29)
Total revenues 56 43 30 Expenses
Compensation and benefits – field 36 30 20 Interest and debt expense 28 16 75 Other expenses 31 40 (23)
Total expenses before separation costs 95 86 10 Pre-tax segment loss before separation costs (39) (43) (9) Separation costs, pre-tax 87 92 (5) Pretax segment loss $ (126) $ (135) (7)% # Variance of 100% or greater.
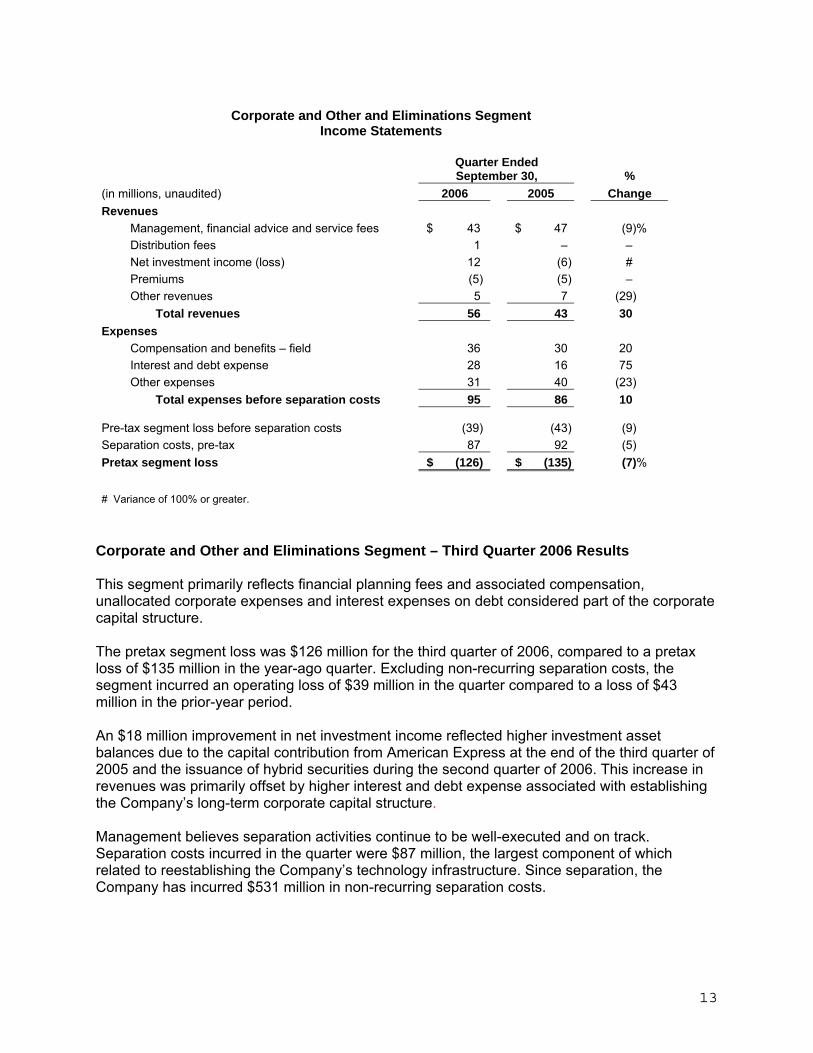
Corporate and Other and Eliminations Segment – Third Quarter 2006 Results This segment primarily reflects financial planning fees and associated compensation, unallocated corporate expenses and interest expenses on debt considered part of the corporate capital structure. The pretax segment loss was $126 million for the third quarter of 2006, compared to a pretax loss of $135 million in the year-ago quarter. Excluding non-recurring separation costs, the segment incurred an operating loss of $39 million in the quarter compared to a loss of $43 million in the prior-year period. An $18 million improvement in net investment income reflected higher investment asset balances due to the capital contribution from American Express at the end of the third quarter of 2005 and the issuance of hybrid securities during the second quarter of 2006. This increase in revenues was primarily offset by higher interest and debt expense associated with establishing the Company’s long-term corporate capital structure. Management believes separation activities continue to be well-executed and on track. Separation costs incurred in the quarter were $87 million, the largest component of which related to reestablishing the Company’s technology infrastructure. Since separation, the Company has incurred $531 million in non-recurring separation costs.
14
Definitions Allocated Equity - The internal allocation of consolidated shareholders’ equity, excluding accumulated other comprehensive income (loss), to the Company’s operating segments for purposes of measuring segment return on allocated equity. Allocated equity does not represent insurance company risk-based capital or other regulatory capital requirements applicable to the Company and certain of its subsidiaries. AMEX Assurance Company - A legal entity owned by IDS Property Casualty Insurance Company that offers travel and other card insurance to American Express Company (American Express) customers. This business had historically been reported in the Travel Related Services segment of American Express. Under the separation agreement with American Express, 100 percent of this business was ceded to an American Express subsidiary in return for an arm’s length ceding fee. Ameriprise Financial expects to sell the legal entity of AMEX Assurance to American Express within two years after September 30, 2005 for a fixed price equal to the net book value of AMEX Assurance. Asset Management Net Flows - A calculation of sales less redemptions plus other. Other includes reinvested dividends. Client Group - In general, a client group consists of accounts for an individual, spouse or domestic partner and any accounts owned for, by or with the individual’s unmarried children under the age of 21. Clients With a Financial Plan Percentage - The period-end number of current clients who have received a financial plan or have entered into an agreement to receive and have paid for a financial plan, divided by the number of active retail client groups, serviced by branded employees, franchise advisors and the Company’s customer service organization. Contribution Margin - Total revenues less compensation and benefits - field, interest credited to account values and benefits, claims, losses and settlement expenses as a percentage of total revenues. Debt to Capital Ratio - A ratio comprised of total debt divided by total capital. This ratio is also presented excluding non-recourse debt of a collateralized debt obligation (CDO) consolidated in accordance with FIN 46(R) and non-recourse debt of property fund limited partnerships managed by Threadneedle consolidated in accordance with EITF 04-5. In addition, we provide debt to capital ratio information, excluding non-recourse debt that reflects an equity credit on our junior subordinated notes we issued on May 26, 2006. These junior subordinated notes receive at least a 75 percent equity credit by the majority of the rating agencies. Deferred Acquisition Costs (DAC) - This represents the costs of acquiring new protection, annuity and certain mutual fund business, principally direct sales commissions and other distribution and underwriting costs that have been deferred on the sale of annuity, life, disability income and long term care insurance and, to a lesser extent, deferred marketing and promotion expenses on auto and home insurance and deferred distribution costs on certain mutual fund products. These costs are deferred to the extent they are recoverable from future profits. Gross Dealer Concession (GDC) - An internal measure, commonly used in the financial services industry, of the sales production of the advisor channel.
15
Life Insurance in-Force - The total amount of all life insurance death benefits currently insured by the Company. Mass Affluent - Individuals with $100,000 to $1 million in investable assets. Mass Affluent Client Groups - Client groups with over $100,000 in invested assets or comparable product values with the Company. Non-Recurring Separation Costs - The Company has incurred significant non-recurring separation costs as a result of the separation from American Express. Separation costs generally consist of costs associated with separating and reestablishing the Company’s technology platforms, establishing the Ameriprise Financial brand and advisor and employee retention programs. Ratio of Earnings to Fixed Charges - A ratio comprised of earnings divided by fixed charges. Earnings are defined as income before income tax provision, discontinued operations and accounting change plus interest and debt expense, the interest portion of rental expense, amortization of capitalized interest and adjustments related to equity investments and minority interests in consolidated entities. Fixed charges are defined as interest and debt expense, the interest portion of rental expense and capitalized interest. The ratio is also presented excluding the effect of interest on non-recourse debt of a CDO consolidated in accordance with FIN 46(R) and the Threadneedle managed property fund limited partnerships consolidated in accordance with EITF 04-5. Segments:
Asset Accumulation and Income Segment - This segment offers products and services, both the Company’s and other companies’, to help the Company’s retail clients address identified financial objectives related to asset accumulation and income management. Products and services in this segment are related to financial advice services, asset management, brokerage and banking and include mutual funds, wrap accounts, variable and fixed annuities, brokerage accounts, financial advice services and investment certificates. This operating segment also serves institutional clients by providing investment management services in separately managed accounts, sub-advisory, alternative investments and 401(k) markets. The Company earns revenues in this segment primarily through fees we receive based on managed assets and annuity separate account assets. These fees are impacted by both market movements and net asset flows. The Company also earns net investment income on owned assets, principally supporting the fixed annuity business and distribution fees on sales of mutual funds and other products. This segment includes the results of Securities America Financial Corporation (SAFC) which through its operating subsidiary, Securities America, Inc., operates its own separately branded distribution network. Protection Segment - This segment offers a variety of protection products, both the Company’s and other companies’, including life, disability income, long term care and auto and home insurance to address the identified protection and risk management needs of the Company’s retail clients. The Company earns revenues in this operating segment primarily through premiums, fees and charges that the Company receives to assume insurance-related risk, fees the Company receives from insurance separate account assets and net investment income the Company earns on general account owned assets on the Company’s consolidated balance sheets related to this segment.
16
Corporate and Other and Eliminations Segment - This segment consists of income derived from financial planning fees, corporate level assets and unallocated corporate expenses. This segment also includes non-recurring costs associated with the Company’s separation from American Express. For purposes of presentation in this earnings release and statistical supplement, this segment also includes eliminations.
Total Clients - The sum of all clients, individual, business and institutional, that receive investment management and/or other services, excluding those clients serviced by SAFC and Threadneedle. Ameriprise Financial, Inc. is a leading financial planning and services company with more than 12,000 financial advisors and registered representatives that provides solutions for clients’ asset accumulation, income management and insurance protection needs. The Company’s financial advisors deliver tailored solutions to clients through a comprehensive and personalized financial planning approach built on a long-term relationship with a knowledgeable advisor. The Company specializes in meeting the retirement-related financial needs of the mass affluent. Financial advisory services and investments are available through Ameriprise Financial Services, Inc. Member NASD and SIPC. For more information, visit www.ameriprise.com. Forward Looking Statements This news release contains forward-looking statements that reflect the Company’s plans, estimates and beliefs. Actual results could differ materially from those described in these forward-looking statements. The Company has made various forward-looking statements in this news release. Examples of such forward-looking statements include:
statements of plans, intentions, expectations, objectives or goals, including those relating to the establishment of the Company’s new brands, mass affluent client acquisition strategy, asset flows and competitive environment;
statements about future economic performance, the performance of equity markets and interest rate variations and the economic performance of the United States; and
statements of assumptions underlying such statements. The words “believe,” “expect,” “anticipate,” “optimistic,” “intend,” “plan,” “aim,” “will,” “may,” “should,” “could,” “would,” “likely” and similar expressions are intended to identify forward-looking statements but are not the exclusive means of identifying such statements. Forward-looking statements are subject to risks and uncertainties, which could cause actual results to differ materially from such statements. Such factors include, but are not limited to:
the impact of the separation from American Express; ability to establish the Company’s new brands; the Company’s capital structure as a stand-alone company, including ratings and
indebtedness, and limitations on subsidiaries to pay dividends; changes in the interest rate and equity market environments; changes in the regulatory environment, including ongoing legal proceedings and
regulatory actions; investment management performance; effects of competition in the financial services industry and changes in product
distribution mix and distribution channels; risks of default by issuers of investments the Company owns or by counterparties to
derivative or reinsurance arrangements;
17
experience deviations from assumptions regarding morbidity, mortality and persistency in certain annuity and insurance products; and
general economic and political factors, including consumer confidence in the economy. Readers are cautioned that the foregoing list of factors is not exhaustive. There may also be other risks that the Company is unable to predict at this time that may cause actual results to differ materially from those in forward-looking statements. Readers are cautioned not to place undue reliance on these forward-looking statements, which speak only as of the date on which they are made. The Company undertakes no obligation to update publicly or revise any forward-looking statements. The foregoing list of factors should be read in conjunction with the “Risk Factors” discussion included as Part 1, Item 1A of the Company’s Annual Report on Form 10-K filed with the SEC on March 8, 2006. Contacts Investor Relations: Media Relations: Laura Gagnon Paul Johnson Ameriprise Financial Ameriprise Financial 612.671.2080 612.671.0625 [email protected] [email protected] Mary Baranowski Ameriprise Financial 212.437.8624 [email protected] Additional Tables Nine months Ended September 30, 2006:
- Summary - Consolidated Income Statements Reconciled to Adjusted - Asset Accumulation and Income Segment – Income Statements - Protection Segment – Income Statements - Corporate and Other and Eliminations – Income Statements
Reconciliation Tables:
- Selected Adjusted Consolidated Income Data to GAAP – Three Months Ended September 2006
- Selected Adjusted Consolidated Income Data to GAAP – Three Months Ended September 2005
- Selected Adjusted Consolidated Income Data to GAAP – Nine Months Ended September 2006
- Selected Adjusted Consolidated Income Data to GAAP – Nine Months Ended September 2005
- Debt to Total Capital at September 30, 2006 Return on Equity Calculations:
- Twelve months ended September 30, 2006 - Twelve months ended June 30, 2006 - Twelve months ended December 31, 2005
18
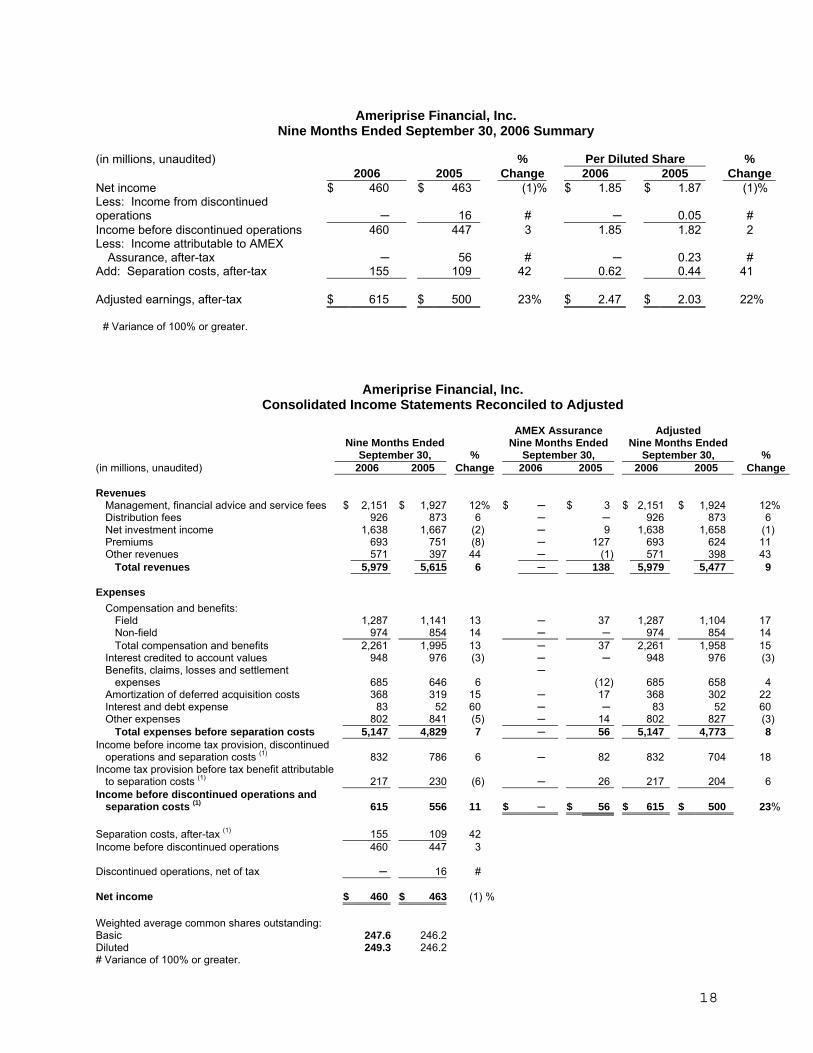
Ameriprise Financial, Inc.
Nine Months Ended September 30, 2006 Summary
(in millions, unaudited) % Per Diluted Share %
2006 2005 Change 2006 2005 ChangeNet income $ 460 $ 463 (1)% $ 1.85 $ 1.87 (1)% Less: Income from discontinued operations ─ 16 # ─ 0.05 # Income before discontinued operations 460 447 3 1.85 1.82 2 Less: Income attributable to AMEX
Assurance, after-tax ─ 56 # ─ 0.23 # Add: Separation costs, after-tax 155 109 42 0.62 0.44 41 Adjusted earnings, after-tax $ 615 $ 500 23% $ 2.47 $ 2.03 22%
# Variance of 100% or greater.
Ameriprise Financial, Inc. Consolidated Income Statements Reconciled to Adjusted
Nine Months Ended September 30, %
AMEX Assurance Nine Months Ended
September 30,
Adjusted Nine Months Ended
September 30, % (in millions, unaudited) 2006 2005 Change 2006 2005 2006 2005 Change Revenues
Management, financial advice and service fees $ 2,151 $ 1,927 12% $ ─ $ 3 $ 2,151 $ 1,924 12% Distribution fees 926 873 6 ─ ─ 926 873 6 Net investment income 1,638 1,667 (2) ─ 9 1,638 1,658 (1) Premiums 693 751 (8) ─ 127 693 624 11 Other revenues 571 397 44 ─ (1) 571 398 43
Total revenues 5,979 5,615 6 ─ 138 5,979 5,477 9 Expenses
Compensation and benefits: Field 1,287 1,141 13 ─ 37 1,287 1,104 17 Non-field 974 854 14 ─ ─ 974 854 14 Total compensation and benefits 2,261 1,995 13 ─ 37 2,261 1,958 15
Interest credited to account values 948 976 (3) ─ ─ 948 976 (3) Benefits, claims, losses and settlement
expenses 685 646 6 ─
(12) 685 658 4 Amortization of deferred acquisition costs 368 319 15 ─ 17 368 302 22 Interest and debt expense 83 52 60 ─ ─ 83 52 60 Other expenses 802 841 (5) ─ 14 802 827 (3)
Total expenses before separation costs 5,147 4,829 7 ─ 56 5,147 4,773 8 Income before income tax provision, discontinued
operations and separation costs (1) 832 786 6 ─ 82 832 704 18 Income tax provision before tax benefit attributable
to separation costs (1) 217 230 (6) ─ 26 217 204 6 Income before discontinued operations and
separation costs (1) 615 556 11 $ ─ $ 56 $ 615 $ 500 23% Separation costs, after-tax (1) 155 109 42 Income before discontinued operations 460 447 3 Discontinued operations, net of tax ─ 16 # Net income $ 460 $ 463 (1) % Weighted average common shares outstanding: Basic 247.6 246.2 Diluted 249.3 246.2 # Variance of 100% or greater.
19
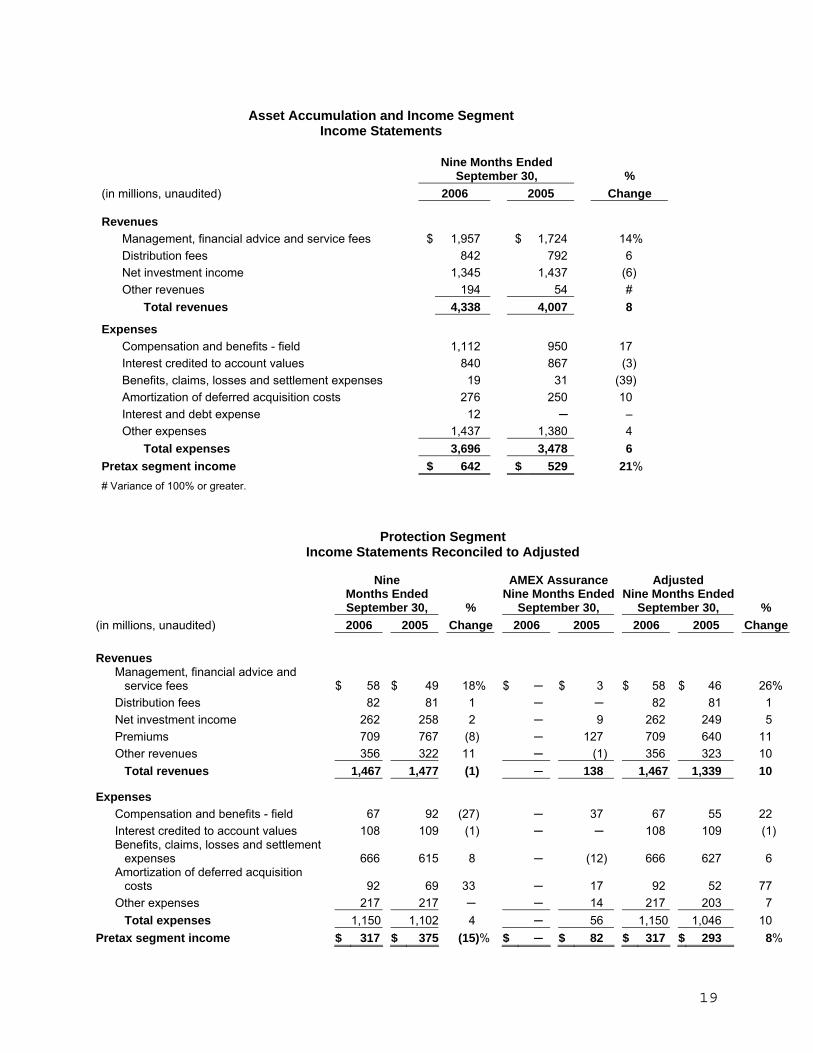
Asset Accumulation and Income Segment
Income Statements
Nine Months Ended
September 30, % (in millions, unaudited) 2006 2005 Change
Revenues Management, financial advice and service fees $ 1,957 $ 1,724 14% Distribution fees 842 792 6 Net investment income 1,345 1,437 (6) Other revenues 194 54 #
Total revenues 4,338 4,007 8
Expenses Compensation and benefits - field 1,112 950 17 Interest credited to account values 840 867 (3) Benefits, claims, losses and settlement expenses 19 31 (39) Amortization of deferred acquisition costs 276 250 10 Interest and debt expense 12 ─ – Other expenses 1,437 1,380 4
Total expenses 3,696 3,478 6 Pretax segment income $ 642 $ 529 21% # Variance of 100% or greater.
Protection Segment Income Statements Reconciled to Adjusted
Nine Months Ended September 30, %
AMEX Assurance Nine Months Ended
September 30,
Adjusted Nine Months Ended
September 30, % (in millions, unaudited) 2006 2005 Change 2006 2005 2006 2005 Change
Revenues Management, financial advice and
service fees $ 58 $ 49 18% $ ─ $ 3 $ 58 $ 46 26% Distribution fees 82 81 1 ─ ─ 82 81 1 Net investment income 262 258 2 ─ 9 262 249 5 Premiums 709 767 (8) ─ 127 709 640 11 Other revenues 356 322 11 ─ (1) 356 323 10
Total revenues 1,467 1,477 (1) ─ 138 1,467 1,339 10
Expenses Compensation and benefits - field 67 92 (27) ─ 37 67 55 22 Interest credited to account values 108 109 (1) ─ ─ 108 109 (1) Benefits, claims, losses and settlement
expenses 666 615 8 ─ (12) 666 627 6 Amortization of deferred acquisition
costs 92 69 33 ─ 17 92 52 77 Other expenses 217 217 ─ ─ 14 217 203 7
Total expenses 1,150 1,102 4 ─ 56 1,150 1,046 10 Pretax segment income $ 317 $ 375 (15)% $ ─ $ 82 $ 317 $ 293 8%
20
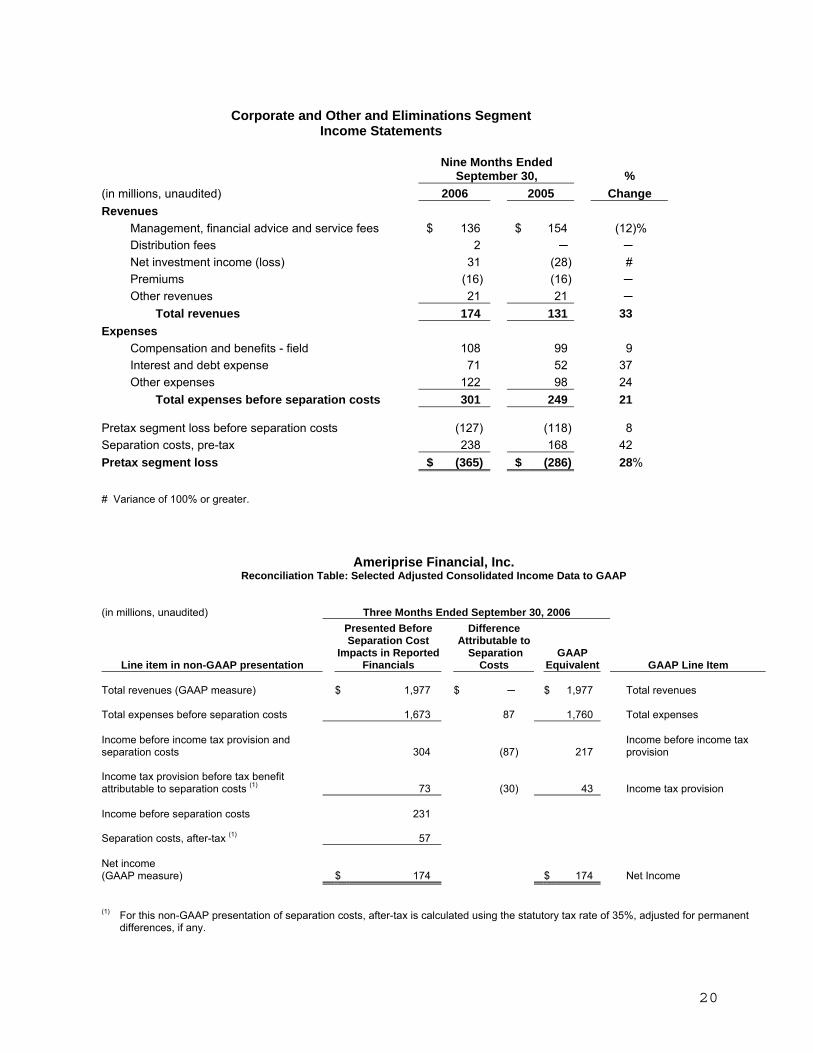
Corporate and Other and Eliminations Segment
Income Statements
Nine Months Ended
September 30, % (in millions, unaudited) 2006 2005 Change Revenues
Management, financial advice and service fees $ 136 $ 154 (12)% Distribution fees 2 ─ ─ Net investment income (loss) 31 (28) # Premiums (16) (16) ─ Other revenues 21 21 ─
Total revenues 174 131 33 Expenses
Compensation and benefits - field 108 99 9 Interest and debt expense 71 52 37 Other expenses 122 98 24
Total expenses before separation costs 301 249 21 Pretax segment loss before separation costs (127) (118) 8 Separation costs, pre-tax 238 168 42 Pretax segment loss $ (365) $ (286) 28% # Variance of 100% or greater.
Ameriprise Financial, Inc. Reconciliation Table: Selected Adjusted Consolidated Income Data to GAAP
(in millions, unaudited)
Three Months Ended September 30, 2006
Line item in non-GAAP presentation
Presented Before Separation Cost
Impacts in Reported Financials
Difference Attributable to
Separation Costs
GAAP Equivalent GAAP Line Item
Total revenues (GAAP measure) $ 1,977 $ ─ $ 1,977 Total revenues Total expenses before separation costs 1,673 87 1,760 Total expenses Income before income tax provision and separation costs
304 (87) 217
Income before income tax provision
Income tax provision before tax benefit attributable to separation costs (1)
73 (30) 43 Income tax provision
Income before separation costs 231 Separation costs, after-tax (1) 57 Net income (GAAP measure)
$ 174 $ 174 Net Income
(1) For this non-GAAP presentation of separation costs, after-tax is calculated using the statutory tax rate of 35%, adjusted for permanent
differences, if any.
21
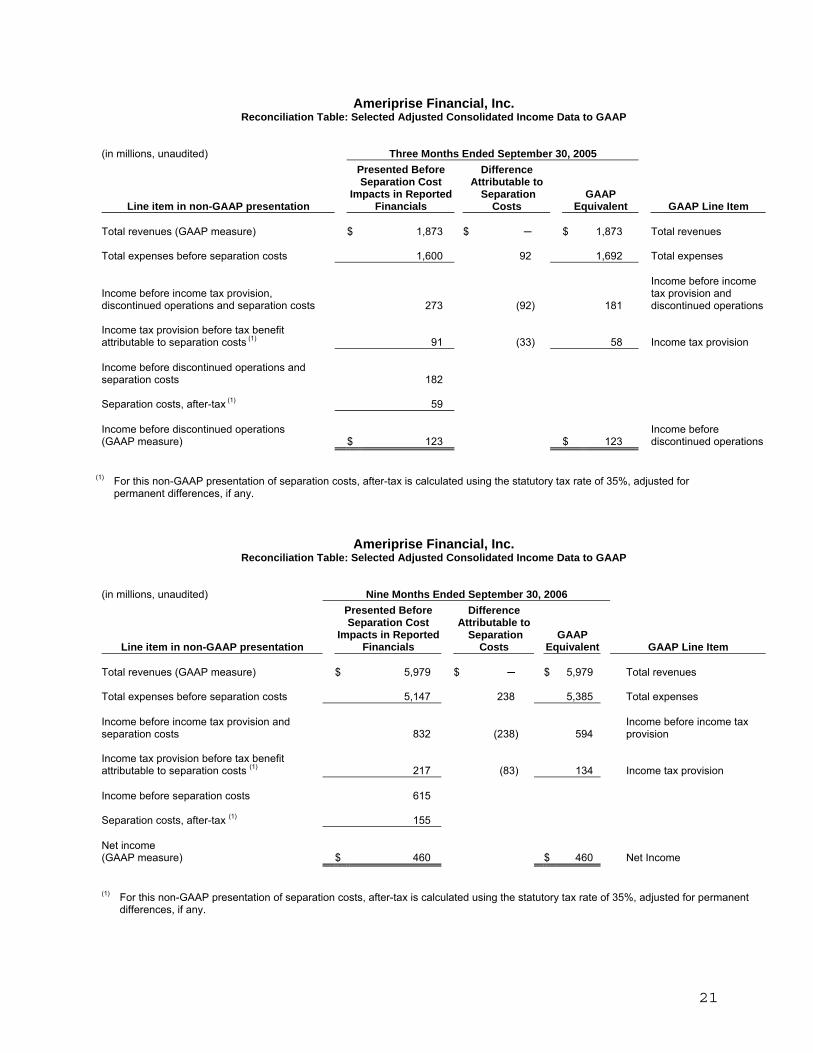
Ameriprise Financial, Inc. Reconciliation Table: Selected Adjusted Consolidated Income Data to GAAP
(in millions, unaudited)
Three Months Ended September 30, 2005
Line item in non-GAAP presentation
Presented Before Separation Cost
Impacts in Reported Financials
Difference Attributable to
Separation Costs
GAAP Equivalent GAAP Line Item
Total revenues (GAAP measure) $ 1,873 $ ─ $ 1,873 Total revenues Total expenses before separation costs 1,600 92 1,692 Total expenses
Income before income tax provision, discontinued operations and separation costs
273 (92) 181
Income before income tax provision and discontinued operations
Income tax provision before tax benefit attributable to separation costs (1)
91 (33) 58
Income tax provision
Income before discontinued operations and separation costs
182
Separation costs, after-tax (1) 59 Income before discontinued operations (GAAP measure)
$ 123 $ 123
Income before discontinued operations
(1) For this non-GAAP presentation of separation costs, after-tax is calculated using the statutory tax rate of 35%, adjusted for permanent differences, if any.
Ameriprise Financial, Inc. Reconciliation Table: Selected Adjusted Consolidated Income Data to GAAP
(in millions, unaudited)
Nine Months Ended September 30, 2006
Line item in non-GAAP presentation
Presented Before Separation Cost
Impacts in Reported Financials
Difference Attributable to
Separation Costs
GAAP Equivalent GAAP Line Item
Total revenues (GAAP measure) $ 5,979 $ ─ $ 5,979 Total revenues Total expenses before separation costs 5,147 238 5,385 Total expenses Income before income tax provision and separation costs
832 (238) 594
Income before income tax provision
Income tax provision before tax benefit attributable to separation costs (1)
217 (83) 134 Income tax provision
Income before separation costs 615 Separation costs, after-tax (1) 155 Net income (GAAP measure)
$ 460 $ 460 Net Income
(1) For this non-GAAP presentation of separation costs, after-tax is calculated using the statutory tax rate of 35%, adjusted for permanent
differences, if any.
22
Ameriprise Financial, Inc.
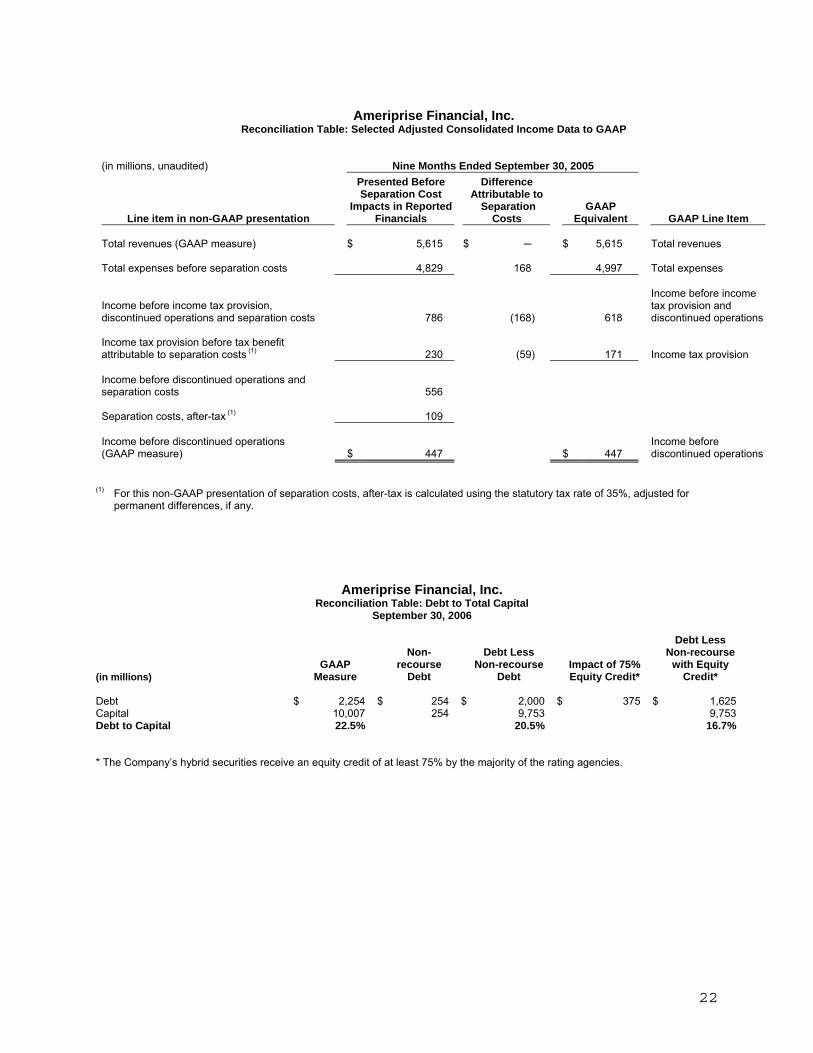
Reconciliation Table: Selected Adjusted Consolidated Income Data to GAAP
(in millions, unaudited)
Nine Months Ended September 30, 2005
Line item in non-GAAP presentation
Presented Before Separation Cost
Impacts in Reported Financials
Difference Attributable to
Separation Costs
GAAP Equivalent GAAP Line Item
Total revenues (GAAP measure) $ 5,615 $ ─ $ 5,615 Total revenues Total expenses before separation costs 4,829 168 4,997 Total expenses
Income before income tax provision, discontinued operations and separation costs
786 (168) 618
Income before income tax provision and discontinued operations
Income tax provision before tax benefit attributable to separation costs (1)
230 (59) 171
Income tax provision
Income before discontinued operations and separation costs
556
Separation costs, after-tax (1) 109 Income before discontinued operations (GAAP measure)
$ 447 $ 447
Income before discontinued operations
(1) For this non-GAAP presentation of separation costs, after-tax is calculated using the statutory tax rate of 35%, adjusted for permanent differences, if any.
* The Company’s hybrid securities receive an equity credit of at least 75% by the majority of the rating agencies.
Ameriprise Financial, Inc. Reconciliation Table: Debt to Total Capital
September 30, 2006
(in millions)
GAAP Measure
Non-
recourse Debt
Debt Less
Non-recourse Debt
Impact of 75% Equity Credit*
Debt Less Non-recourse
with Equity Credit*
Debt $ 2,254 $ 254 $ 2,000 $ 375 $ 1,625 Capital 10,007 254 9,753 9,753 Debt to Capital 22.5% 20.5% 16.7%
23
Ameriprise Financial, Inc.
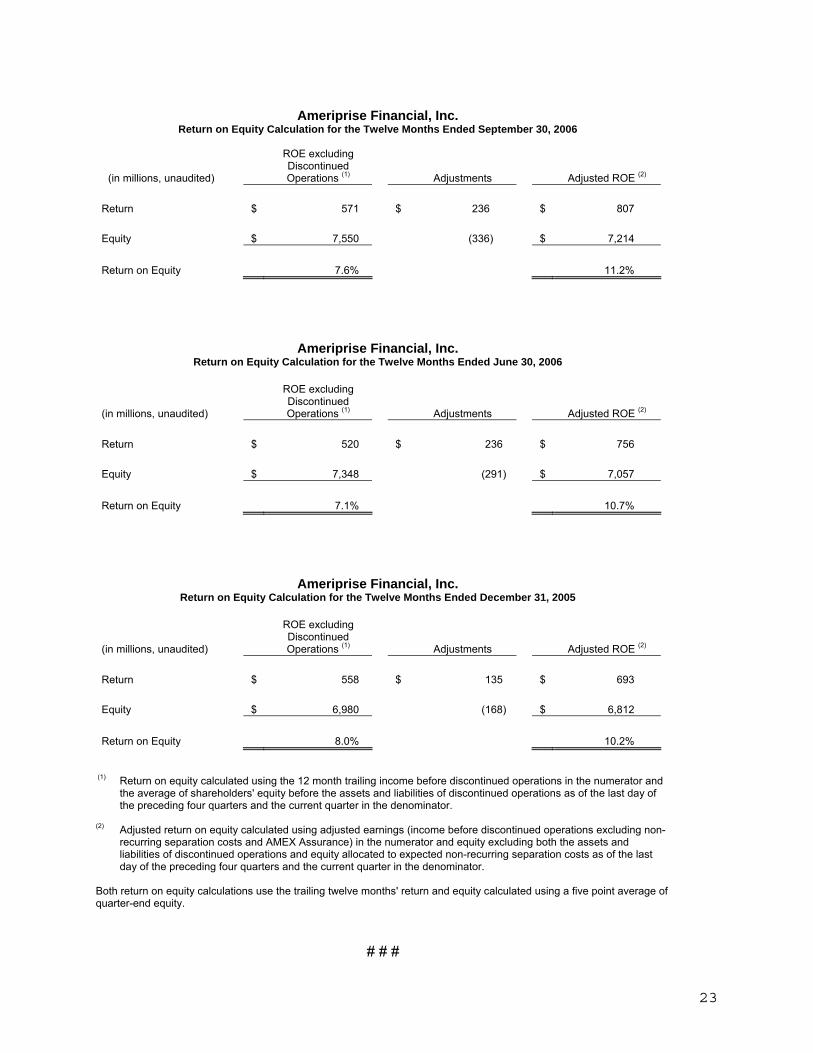
Return on Equity Calculation for the Twelve Months Ended September 30, 2006 ROE excluding Discontinued
(in millions, unaudited) Operations (1) Adjustments Adjusted ROE (2) Return $ 571 $ 236 $ 807 Equity $ 7,550 (336) $ 7,214 Return on Equity 7.6% 11.2%
Ameriprise Financial, Inc. Return on Equity Calculation for the Twelve Months Ended June 30, 2006
ROE excluding Discontinued (in millions, unaudited) Operations (1) Adjustments Adjusted ROE (2) Return $ 520 $ 236 $ 756 Equity $ 7,348 (291) $ 7,057 Return on Equity 7.1% 10.7%
Ameriprise Financial, Inc. Return on Equity Calculation for the Twelve Months Ended December 31, 2005
ROE excluding Discontinued (in millions, unaudited) Operations (1) Adjustments Adjusted ROE (2) Return $ 558 $ 135 $ 693 Equity $ 6,980 (168) $ 6,812 Return on Equity 8.0% 10.2%
(1) Return on equity calculated using the 12 month trailing income before discontinued operations in the numerator and the average of shareholders' equity before the assets and liabilities of discontinued operations as of the last day of the preceding four quarters and the current quarter in the denominator.
(2) Adjusted return on equity calculated using adjusted earnings (income before discontinued operations excluding non-
recurring separation costs and AMEX Assurance) in the numerator and equity excluding both the assets and liabilities of discontinued operations and equity allocated to expected non-recurring separation costs as of the last day of the preceding four quarters and the current quarter in the denominator.
Both return on equity calculations use the trailing twelve months' return and equity calculated using a five point average of quarter-end equity.
# # #


![CHKSUM Content: CLEAN Merrill Corp - Ameriprise Financial ... · Merrill Corp - Ameriprise Financial [MCS] SCTPP Tuition Prepayment Program Annual Report [Funds] 06-30-2016 ED](https://img.pdfslide.net/doc/110x75/5f7fd34463dc0418df707254/chksum-content-clean-merrill-corp-ameriprise-financial-merrill-corp-ameriprise.jpg)


![CHKSUM Content: Merrill Corp - Ameriprise Financial [MCS ... · Merrill Corp - Ameriprise Financial [MCS] SCTPP Tuition Prepatment Program Annual Report [Funds] 06-30-2014 ED](https://img.pdfslide.net/doc/110x75/5f7fd34463dc0418df707253/chksum-content-merrill-corp-ameriprise-financial-mcs-merrill-corp-ameriprise.jpg)