Embed Size (px)
Citation preview

UNITED STATES SECURITIES AND EXCHANGE COMMISSION
Washington, D.C. 20549
Form 10-K (Mark One)
ANNUAL REPORT PURSUANT TO SECTION 13 OR 15(d) OF THE SECURITIES EXCHANGE ACT OF 1934
For the fiscal year ended September 24, 2005or
TRANSITION REPORT PURSUANT TO SECTION 13 OR 15(d) OF THE SECURITIES EXCHANGE ACT OF 1934
For the transition period from to Commission file number 0-10030
APPLE COMPUTER, INC. (Exact name of registrant as specified in its charter)
CALIFORNIA 942404110(State or other jurisdiction
of incorporation or organization) (I.R.S. Employer
Identification No.) 1 Infinite Loop
Cupertino, California 95014(Address of principal executive offices) (Zip Code)
Registrant’s telephone number, including area code: (408) 996-1010Securities registered pursuant to Section 12(b) of the Act: None
Securities registered pursuant to Section 12(g) of the Act:Common Stock, no par value
(Titles of classes)
Indicate by check mark whether the registrant (1) has filed all reports required to be filed by Section 13 or15(d) of the Securities Exchange Act of 1934 during the preceding 12 months (or for such shorter period that theregistrant was required to file such reports), and (2) has been subject to such filing requirements for the past 90 days. Yes No
Indicate by check mark if disclosure of delinquent filers pursuant to Item 405 of Regulation S-K(section 229.405 of this chapter) is not contained herein, and will not be contained, to the best of the registrant’sknowledge, in definitive proxy or information statements incorporated by reference in Part III of this Form 10-Kor any amendment to this Form 10-K. Indicate by check mark whether the registrant is an accelerated filer (as defined in Rule 12b-2 of the Act). Yes No Indicate by check mark whether the registrant is a shell company (as defined in Rule 12b-2 of the Act). Yes No The aggregate market value of the voting and non-voting stock held by non-affiliates of the registrant, as of March 26, 2005, was approximately $29,434,521,480 based upon the closing price reported for such date on the NASDAQ National Market. For purposes of this disclosure, shares of Common Stock held by persons who hold more than 5% of the outstanding shares of Common Stock and shares held by executive officers and directors of the registrant have been excluded because such persons may be deemed to be affiliates. This determination ofexecutive officer or affiliate status is not necessarily a conclusive determination for other purposes.
842,767,948 shares of Common Stock Issued and Outstanding as of November 18, 2005

1
PART I
The Business section and other parts of this Annual Report on Form 10-K (“Form 10-K”) contain forward-looking statements that involve risks and uncertainties. Many of the forward-looking statements are located in “Management’s Discussion and Analysis of Financial Condition and Results of Operations.” Forward-looking statements can also be identified by words such as “anticipates,” “expects,” “believes,” “plans,” “predicts,” and similar terms. Forward-looking statements are not guarantees of future performance and the Company’s actual results may differ significantly from the results discussed in the forward-looking statements. Factors that might cause such differences include, but are not limited to, those discussed in the subsection entitled “Factors That May Affect Future Results and Financial Condition” under Part II, Item 7 of this Form 10-K. The Company assumes no obligation to revise or update any forward-looking statements for any reason, except as required by law.
Item 1. Business
Company Background Apple Computer, Inc. (“Apple” or the “Company”) was incorporated under the laws of the State of California on January 3, 1977. The Company designs, manufactures, and markets personal computers and related software, services, peripherals, and networking solutions. The Company also designs, develops, and markets a line of portable digital music players along with related accessories and services including theonline distribution of third-party music, audio books, music videos, short films, and television shows. The Company’s products and services include the Macintosh line of desktop and notebook computers, the iPod digital music player, the Xserve G5 server and Xserve RAID storage products, a portfolio of consumer and professional software applications, the Mac OS X operating system, the iTunes Music Store, a portfolio of peripherals that support and enhance the Macintosh and iPod product lines, and a variety of other service and support offerings. The Company sells its products worldwide through its online stores, its own retail stores, its direct sales force, and third-party wholesalers, resellers, and value added resellers. The Companyalso sells a variety of third-party products that are compatible with the Company’s Macintosh and iPodproduct lines, including computer printers and printing supplies, storage devices, computer memory, digitalcamcorders and still cameras, personal digital assistants, iPod accessories, and various other computingproducts and supplies through its online and retail stores. The Company’s fiscal year ends on the last Saturday of September. Unless otherwise stated, all information presented in this Form 10-K is based onthe Company’s fiscal calendar.
Business Strategy The Company is committed to bringing the best personal computing and music experience to students, educators, creative professionals, businesses, government agencies, and consumers through its innovativehardware, software, peripherals, services, and Internet offerings. The Company’s business strategy leverages its unique ability, through the design and development of its own operating system, hardware, and many software applications and technologies, to bring to its customers new products and solutions with superior ease-of-use, seamless integration, and innovative industrial design. The Company believes continual investment in research and development is critical to facilitate innovation of new and improved products and technologies. Besides updates to its existing line of personal computers and related software, services, peripherals, and networking solutions, the Company continues to capitalize on the convergence of digital consumer electronics and the computer by creating innovations like the iPod and iTunes MusicStore. The Company’s strategy also includes expanding its distribution network to effectively reach more of its targeted customers and provide them a high-quality sales and after-sales support experience.
Digital Hub The Company believes personal computing is in an era in which the personal computer functions for both professionals and consumers as the digital hub for advanced new digital devices such as the Company’s

2
iPod digital music players, personal digital assistants, cellular phones, digital camcorders and still cameras,CD and DVD players, televisions, and other consumer electronic devices. The attributes of the personalcomputer include a high quality user interface, relatively inexpensive data storage, and the ability to runcomplex applications and easily connect to the Internet. Apple is the only company in the personal computer industry that controls the design and development of the entire personal computer—from thehardware and operating system to sophisticated applications. Additionally, the Company’s products provide innovative industrial design, intuitive ease-of-use, and built-in networking, graphics and multimedia capabilities. Thus, the Company is uniquely positioned to offer integrated digital hub products and solutions.
The Company develops products and technologies that adhere to many industry standards in order to provide an optimized user experience through interoperability with peripherals and devices from other companies. The Company has played a role in the development, enhancement, promotion, and/or use of numerous of these industry standards.
Expanded Distribution The Company believes that a high quality buying experience with knowledgeable salespersons who can convey the value of the Company’s products and services is critical to attracting and retaining customers. The Company sells many of its products and resells certain third-party products in most of its major markets directly to consumers, education customers, and businesses through its retail and online stores in the U.S. and internationally. The Company has also invested in programs to enhance reseller sales,including the Apple Sales Consultant Program, which consists of the deployment of Apple employees and contractors to selected third-party reseller locations. The Company believes providing direct contact withits targeted customers is an efficient way to demonstrate the advantages of its Macintosh computer andother products over those of its competitors. The Company has significantly increased the points of distribution for the iPod product family in order to make its products available at locations where its customers shop.
From inception of the retail initiative in 2001 through 2005, the Company had opened 116 retail stores in the U.S. and 8 international stores in Canada, Japan, and the U.K. The Company opened 2 additional stores in October 2005. The Company has typically located its stores at high traffic locations in qualityshopping malls and urban shopping districts.
One of the goals of the retail initiative is to bring new customers to the Company and expand its installedbase through sales to computer users who currently do not own a Macintosh computer and first time personal computer buyers. By operating its own stores and building them in desirable high traffic locations, the Company is able to better control the customer retail experience and attract new customers. The storesare designed to simplify and enhance the presentation and marketing of personal computing products. To that end, retail store configurations have evolved into various sizes in order to accommodate marketdemands. The stores employ experienced and knowledgeable personnel who provide product advice andcertain hardware support services. The stores offer a wide selection of third-party hardware, software, and various other computing products and supplies selected to complement the Company’s own products. Additionally, the stores provide a forum in which the Company is able to present computing solutions to users in areas such as digital photography, digital video, music, children’s software, and home and small business computing.
Education For more than 25 years, the Company has focused on the use of technology in education and has been committed to delivering tools to help educators teach and students learn. The Company believes effectiveintegration of technology into classroom instruction can result in higher levels of student achievement, especially when used to support collaboration, information access, and the expression and representation

3
of student thought and ideas. The Company creates solutions that enable new modes of curriculum delivery, better ways of conducting research, and opportunities for professional development of faculty,students, and staff. The Company has designed a range of products and services to help schools maximizetheir investments in technology. This is manifested in many of the Company’s products and services thatare designed to meet the needs of education customers. These products and services include the eMac™,iMac™, and the iBook®, video creation and editing solutions, wireless networking, student information systems, high-quality curriculum and professional development solutions, and one-to-one (1:1) learningsolutions (primarily in K-12). 1:1 learning solutions typically consist of iBook portable computers for every student and teacher along with a wireless network connected to a central server.
Creative Professionals Creative professionals constitute one of the Company’s most important markets for both hardware and software products. This market is also important to many third-party developers who provide Macintosh-compatible hardware and software solutions. Creative customers utilize the Company’s products for a variety of creative activities including digital video and film production and editing; digital video and film special effects, compositing, and titling; digital still photography and workflow management; graphic design, publishing, and print production; music creation and production; audio production and sound design; and web design, development, and administration.
The Company designs its high-end hardware solutions, including servers, desktops, and portable Macintosh systems, to incorporate the power, expandability, and features desired by creative professionals.The Company’s operating system, Mac OS X, incorporates powerful graphics and audio technologies and features developer tools to optimize system and application performance when running powerful creativesolutions provided by the Company or third-party developers. The Company also offers various software solutions to meet the needs of its creative customers.
Business Organization The Company manages its business primarily on a geographic basis. The Company’s reportable operating segments are comprised of the Americas, Europe, Japan, and Retail. The Americas, Europe, and Japanreportable segments do not include activities related to the Retail segment. The Americas segmentincludes both North and South America. The Europe segment includes European countries as well as theMiddle East and Africa. The Retail segment currently operates Apple-owned retail stores in the U.S., Canada, Japan, and the U.K. Other operating segments include Asia-Pacific, which includes Australia and Asia except for Japan, and the Company’s subsidiary, FileMaker, Inc. Each reportable geographic operating segment provides similar hardware and software products and similar services. Further information regarding the Company’s operating segments may be found in Part II, Item 7 of thisForm 10-K under the heading “Segment Operating Performance,” and in Part II, Item 8 of this Form 10-Kin the Notes to Consolidated Financial Statements at Note 11, “Segment Information and GeographicData.”
Hardware Products The Company offers a range of personal computing products including desktop and notebook computers,server and storage products, related devices and peripherals, and various third-party hardware products. The Company’s entire line of Macintosh® systems, excluding servers and storage systems, features the Company’s Mac OS® X Version 10.4 Tiger™ and iLife® suite of software for digital photography, music, movies, and music creation.
Macintosh® Computers In June 2005, the Company announced its plan to begin using Intel microprocessors in its Macintosh computers. The Company plans to begin shipping certain models with Intel microprocessors by June 2006

4
and to complete the transition of all of its Macintosh computers to Intel microprocessors by the end of calendar year 2007. The Company also announced its new translation technology, Rosetta™, which willallow most PowerPC-based Macintosh applications to run on new Intel-based Macintosh computers. There are potential risks and uncertainties associated with this transition, which are further discussed in Part II, Item 7 of this 10-K under the heading “Factors That May Affect Future Results and Financial Condition.”
Power Mac® The Power Mac line of desktop personal computers is targeted at business and professional users and isdesigned to meet the speed, expansion, and networking needs of the most demanding Macintosh user. Powered by the PowerPC G5 processor, the Power Mac G5 utilizes 64-bit processing technology for memory expansion up to 16GB and advanced 64-bit computation while also running existing 32-bit applications natively. In October 2005, the Company updated the Power Mac G5 product line, which now comes in three processor configurations—dual 2.0GHz, dual 2.3GHz, and a quad 2.5GHz that features two 2.5GHz dual processors. All Power Mac G5 desktops feature a SuperDrive™ and a NVIDIA GeForce 6600 graphics card. In addition, all Power Mac G5 desktops deliver connectivity and high-performanceinput/output (I/O), including dual Gigabit Ethernet, FireWire® 800 and FireWire 400 ports, USB 2.0 ports, optical digital I/O, PCI Express expansion, and optional AirPort® Extreme wireless networking and Bluetooth connectivity. The new Power Mac G5 product line also includes Mighty Mouse, the Company’s next generation mouse, featuring up to four programmable buttons and a Scroll Ball that lets users scroll vertically, horizontally, and diagonally.
Xserve® and Xserve RAID Storage System Xserve is a rack-mount server product designed for simple setup and remote management of intensive I/Oapplications such as digital video, high-resolution digital imagery, and large databases. In January 2005, theCompany upgraded Xserve G5, which is now available with either a single 2.0GHz or dual 2.3GHzPowerPC G5 processor. Xserve G5 includes a system controller with up to 16GB of PC3200 error correcting code memory; three hot-plug Serial ATA drive modules that deliver up to 1.5TB of storage; anddual on-board Gigabit Ethernet for high-performance networking. The Company’s Xserve RAID storagesystem was updated in September 2005 to deliver up to 7 terabytes of storage capacity and also expandedsupport for heterogeneous environments. The dual independent RAID controllers with 512MB cache per controller offer sustained throughput of over 385 Mbps—high enough to support media productionenvironments using protected RAID level 5.
iMac® The iMac line of desktop computers is targeted at consumer and education markets. In October 2005, the Company introduced the new iMac G5, featuring the PowerPC G5 processor, a built-in iSight™ video camera, and a design that integrates the entire computer into either a 17-inch or 20-inch widescreen LCD flat-panel display. The 17-inch and 20-inch models come with 1.9GHz and 2.1GHz PowerPC G5Processors, respectively. The iMac G5 offers 512MB of 533MHz DDR2 memory expandable to 2.5GB and7200 rpm Serial ATA drives expandable up to 500GB. The iMac G5 comes standard with ATI Radeon X600 Pro or XT graphics, video memory, a SuperDrive, built-in Airport Extreme wireless networking, aninternal Bluetooth module, built-in stereo speakers and microphone, and Mighty Mouse. The iMac G5 also offers built-in Ethernet (10/100/1000BASE-T), three USB 2.0 and two FireWire 400 ports. The iMac G5 also features Front Row media experience with the Apple Remote, which allows users to play music and view photos and videos via a remote control.
eMac™ The eMac, a desktop personal computer targeted at the Company’s education customers, features a PowerPC G4 processor, a high resolution 17-inch flat cathode ray tube display, and preserves the all-in-one

5
compact design of the original iMac. The eMac offers PowerPC G4 processors running at up to 1.42GHz, 333MHz DDR memory, an optional SuperDrive, built-in modem and Ethernet (10/100BASE-T), ATI Radeon graphics, AirPort Extreme-ready, and USB 2.0 and 1.1 ports for connectivity to peripherals.
Mac® mini In January 2005, the Company introduced Mac mini, a desktop personal computer with a starting price of$499 and weighing as little as 2.9 pounds. In July 2005, the Company updated its Mac mini lineup, expanding to three models and increasing memory to 512MB. The first model includes a 1.25GHzPowerPC G4 processor, a 40GB hard drive, and a Combo drive. The second model includes a 1.42GHz PowerPC G4 processor, an 80GB hard drive, and a Combo drive. The third model includes a 1.42GHzPowerPC G4 processor, an 80GB hard drive, and a SuperDrive. All models include ATI Radeon 9200graphics with 32MB of dedicated DDR memory, built-in Ethernet (10/100 BASE-T), one FireWire 400and two USB 2.0 ports, and a DVI interface that also supports VGA so consumers can connect to LCD or CRT displays. The 1.42GHz models of the Mac mini also include built-in AirPort Extreme for 54 Mbps 802.11g wireless networking along with an internal Bluetooth module.
PowerBook® The PowerBook family of portable computers is designed to meet the mobile computing needs ofprofessionals and advanced consumer users. In October 2005, the Company updated its PowerBook G4 notebooks with extended battery life as well as higher resolution displays, including 1440 by 960 pixels inthe 15-inch model and 1680 by 1050 pixels in the 17-inch model. Both the 15-inch and 17-inch PowerBookG4 offer a 1.67GHz PowerPC G4 processor and the ATI Mobility Radeon 9700 graphics processor. The 12-inch PowerBook G4 features a 1.5GHz PowerPC processor, and the NVIDIA GeForce FX Go5200graphics processor. Every PowerBook G4 notebook comes with a SuperDrive, 512MB of DDR memory, built-in AirPort Extreme wireless networking, an internal Bluetooth module for wireless connectivity, as well as a full complement of I/O ports including FireWire 400, USB 2.0, and a built-in 56K V.92 modem and Ethernet (10/100BASE-T), for connectivity to a wide range of peripherals. The 15-inch and 17-inchPowerBook G4 models also include built-in Gigabit Ethernet and FireWire 800.
iBook® The iBook is designed to meet the portable computing needs of education and consumer users. InJuly 2005, the Company upgraded its iBook® G4 line to include faster PowerPC G4 processors running upto 1.42GHz, built-in AirPort Extreme 54 Mpbs 802.11g wireless networking and an available slot-loadSuperDrive. The 12-inch model features a 1.33GHz PowerPC G4 processor and a slot-load Combo drive, while the 14-inch model includes a 1.42GHz G4 processor and a SuperDrive. All iBook G4 models offer afull complement of I/O ports including FireWire 400, USB 2.0, a built-in 56K V.92 modem and Ethernet(10/100BASE-T), as well as a built-in internal wireless Bluetooth module, for connectivity to a wide range of peripherals.
Music Products and ServicesThe Company offers its iPod® line of digital music players and related accessories to Macintosh andWindows users. The Company also provides an online service to distribute third-party music, audio books, music videos, short films, and television shows through its iTunes Music Store®.
iPod® The iPod is the Company’s portable digital music player, featuring the Company’s patent pending Click Wheel, which combines a touch-sensitive wheel with five push buttons for one-handed navigation. InOctober 2005, the Company introduced the new iPod containing a 2.5-inch color screen that can displayalbum artwork and photos and play video including music videos, video podcasts, home movies, short films,and television shows. The iPod lineup includes a 30GB model holding up to 7,500 songs, 25,000 photos, or

6
75 hours of video, and a 60GB model holding up to 15,000 songs, 25,000 photos, or 150 hours of video. TheiPod features the Company’s patent pending Auto-Sync technology that automatically downloads digitalmusic, podcasts, photos, audio books, home movies, music videos, short films, and television shows ontothe iPod and keeps it up-to-date whenever it is plugged into a Macintosh or Windows computer using USB. The iPod also features Shuffle Songs, which randomly plays songs in a selected playlist or across the entire library. All iPods work with the Company’s iTunes® digital music management software on either aMacintosh or Windows computer.
The iPod’s functionality extends beyond playing music, listening to audio books, and watching music videos, short films, home movies, and television shows. Other key capabilities include data storage, calendar and contact information utility, and a selection of games. With the addition of third-party iPodperipherals, the capabilities of certain iPods can be enhanced to include photo downloading directly fromcertain digital cameras. The Company has also entered into alliances with many automobile manufacturers to offer seamless integration of the iPod in certain automobiles. Along with the iPod, the Company has developed the iTunes software and the iTunes Music Store, a service that consumers may use to purchasethird-party music, audio books, music videos, short films, and television shows over the Internet.
iPod® nano In September 2005, the Company introduced iPod nano, a flash-memory based digital music player. TheiPod nano is available in either a 2GB model holding up to 500 songs or 25,000 photos, or a 4GB modelholding up to 1,000 songs or 25,000 photos. The iPod nano, which weighs as little as 1.5 ounces and is .27 inches thin, features a color screen and the Company’s patent pending Click Wheel.
iPod® shuffle In January 2005, the Company introduced iPod shuffle, a flash-memory based digital music player, which isbased on iPod’s shuffle feature that randomly selects songs from the user’s music library or playlists. iPodshuffle works with iTunes and its patent-pending AutoFill feature that automatically selects songs to fill iPod shuffle from a user’s music library on their computer. iPod shuffle can also be used as a portable USB flash drive with up to 1GB of storage space. It is available in a 512MB model holding up to 120 songs and a 1GB model holding up to 240 songs.
iTunes Music Store®The Company’s iTunes Music Store, available for both Windows-based and Macintosh computers, is a service that allows customers to find, purchase, and download third-party digital music, audio books, music videos, short films, and television shows. The iTunes Music Store also offers Podcast Directory that allows users to search for and download audio programs to their computer and automatically receive new episodes over the Internet. Users can search the contents of the store catalog to locate works by title, artist,or album, or browse the entire contents of the store by genre and artist. Users can also listen to a free30-second preview of content available through the store. The iTunes Music Store was originally introduced in the U.S. in April 2003 and now serves customers in 21 countries.
The iTunes Music Store is fully integrated directly into the iTunes software allowing customers to preview,purchase, download, organize, share, and transfer digital content to an iPod using a single software application. Further discussion on the iTunes software may be found below under the heading “Software Products and Computer Technologies.” The iTunes Music Store offers customers a broad range ofpersonal rights to the third-party content they have purchased. Content purchased through the store may also be used in certain applications such as iPhoto®, iMovie®, and iDVD®. Additional features of theiTunes Music Store include gift certificates that can be sent via e-mail; prepaid gift cards; an “allowance” feature that enables users to automatically deposit funds into an iTunes Music Store account every month;online gift options that let customers give specific songs, albums, music videos, or their own playlists to anyone with an email address; parental controls; and album reviews.

7
Peripheral ProductsThe Company sells various Apple-branded computer hardware peripherals, including iSight™ digital video cameras and a range of high quality flat panel TFT active-matrix digital color displays. The Company also sells a variety of third-party Macintosh compatible hardware products directly to end users through both its retail and online stores, including computer printers and printing supplies, storage devices, computermemory, digital video and still cameras, personal digital assistants, and various other computing products and supplies.
iSight™ The Company’s iSight digital video camera enables video conferencing over broadband connections. iSightis a small, portable aluminum alloy camera with all audio, video, and power provided by a single FireWirecable. iSight is designed to be center-mounted on the top of a computer screen and uses its integrated tiltand rotate mechanism to easily position the camera for natural, face-to-face video conferencing. iSightfeatures an auto focusing auto exposure F/2.8 lens that captures high-quality pictures and full-motionvideo. With its on-board processor, iSight automatically adjusts color, white balance, sharpness andcontrast to provide high-quality images with accurate color reproduction in most lighting conditions. iSight also includes a dual-element microphone that suppresses ambient noise for clear digital audio.
Displays The Company offers a family of widescreen flat panel displays featuring the 30-inch Apple Cinema HD Display™, a widescreen active-matrix LCD with 2560-by-1600 pixel resolution, a 23-inch widescreen AppleCinema Display with 1920-by-1200 pixel resolution and a 20-inch widescreen Apple Cinema Display® with1680-by-1050 pixel resolution. The displays feature dual FireWire and dual USB 2.0 ports built into the display and use the industry standard DVI interface for a pure digital connection with the Company’s latestPower Mac and PowerBook systems. The Cinema Displays feature an aluminum design with a very thin bezel, suspended by an aluminum stand that allows viewing angle adjustment.
Software Products and Computer Technologies The Company offers a range of software products for education, creative, consumer and business customers, including Mac OS X, the Company’s proprietary operating system software for the Macintosh;server software and related solutions; professional application software; and consumer, education andbusiness oriented application software.
Operating System Software In April 2005, the Company began shipping Mac OS X Tiger, the Company’s fifth major version of Mac OS X. Tiger incorporates more than 200 new features and innovations including Spotlight™, a desktopsearch technology that lets users find items stored on their Macintosh computers, including documents, emails, contacts and images; and Dashboard, a new way to instantly access information such as weather forecasts and stock quotes, using a new class of mini-applications called widgets. The server version of the Mac OS operating system, Mac OS X Server version 10.4, also began shipping in April 2005.
Server Software and Server Solutions Apple Remote Desktop™ 2 is the second generation of the Company’s asset management, softwaredistribution, and help desk support software. Apple Remote Desktop 2 includes more than 50 features for centrally managing Mac OS X systems. Apple Remote Desktop 2 can perform a wide range of desktopmanagement tasks such as installing operating system and application software, running hardware and software inventory reports, and executing commands on one or more remote Mac OS X systems on thenetwork. Remote software installation tools allow IT professionals to install single or multiple software packages immediately or at specific dates and times. Comprehensive hardware and software reports based on more than 200 system information attributes allow administrators to keep track of their Mac OS X

8
systems. In addition, built-in real-time screen sharing enables help desk professionals to provide online assistance by observing and controlling the desktops of any remote Macintosh or Virtual Network Computing-enabled computer, including Windows and Linux systems.
Xsan®, the Company’s enterprise-class Storage Area Network (SAN) file system, began shipping inJanuary 2005. Xsan is a 64-bit cluster file system for Mac OS X that enables organizations to consolidate storage resources and provide multiple computers with concurrent file-level read/write access to sharedvolumes over Fibre Channel. Advanced features such as metadata controller failover and Fibre Channelmultipathing ensure high availability; file-level locking allows multiple systems to read and writeconcurrently to the same volume which is ideal for complex workflows; bandwidth reservation provides foreffective ingestion of bandwidth-intensive data streams, such as high resolution video; and flexible volumemanagement results in more efficient use of storage resources. Since Xsan is interoperable with ADIC’sStorNext File System, it can be used in heterogeneous environments that include Windows, UNIX, andLinux server operating system platforms.
Professional Application Software In April 2005, the Company announced Final Cut Studio™, a High Definition (HD) video production suitethat features Final Cut Pro® 5, the Company’s editing software for Digital Video (DV), Standard Definition (SD), HD, and film. Final Cut Studio also includes tools that complement Final Cut Pro 5 suchas Soundtrack® Pro, a new application that gives audio and video professionals a way to create, controland repair audio; Motion 2, an application that allows real-time motion graphics design; and DVD Studio Pro® 4, DVD authoring software that burns DVDs, including high definition DVDs to the latest HD DVD specification. These components of Final Cut Studio are also sold separately.
Final Cut Pro® 5, the latest version of the Company’s video editing software, which began shipping inApril 2005, includes editing tools that work with most formats, from DV and native High Definition Video (HDV) to fully uncompressed HD. Final Cut Pro 5 acquires HDV media via FireWire and keeps it in the original format, transferring it into the system without any generation loss. With a real-time multi-stream effects architecture, multicam editing tools, and advanced color correction, Final Cut Pro 5 enables users to view and cut from multiple sources in real time, group up to 128 sources together into multi-clips, thenadd or subtract cameras at any time. Final Cut Pro 5 allows users to use external audio control surfaces to mix and record multiple fader automations simultaneously.
Soundtrack® Pro is a new audio editing and sound design application that gives audio and video professionals a way to create, control, and repair audio. Soundtrack Pro features a waveform editor withflexible Action Layers that allow users to re-order, bypass, or change any edit, effect, or process. Find-and-Fix features identify and repair common audio problems such as background noise, pops, clicks, and hum.An integrated multitrack mixer allows editors to apply common effects to multiple tracks and group common tracks using busses. Soundtrack Pro also features over 50 professional plug-ins for creating sounds, over 5,000 loops, an integrated mixer, and integration with Final Cut Studio.
Motion 2 is a real-time motion graphics software that enables Final Cut Pro editors to add motion graphics to their projects. Motion 2 features interactive animation of text and graphics for DVD motion menus,video or film in real time, and quick output rendering by built-in GPU acceleration at 8-bit, 16-bit, or 32-bit float film quality. With Motion 2’s new design tool, Replicator, users can automatically generate andanimate multiple copies of a graphic, shape, or movie.
DVD Studio Pro® 4 is the latest version of the Company’s professional DVD authoring application. WithDVD Studio Pro 4 and its integrated, scalable H.264 encoding, users can author SD or HD DVDs. DVDStudio Pro 4 allows users to preview HD content in real time with a second Digital Cinema Desktop and audition surround sound using S/PDIF (digital audio) out to an external DTS or Dolby Digital (AC-3) decoder. Its interactive graphical view also enables users to edit/display menus, tracks, slideshows, scripts,

9
and stories of a DVD project in a storyboard layout. DVD Studio Pro 4 includes Compressor 2, a full-featured video and audio compression application. Compressor gives users control over encoding, including the ability to encode several clips in one batch operation to a wide variety of formats andperform advanced format conversions at the same time.
In April 2005, the Company announced Shake® 4, an upgrade to the Company’s compositing software, which began shipping in June 2005. Used to create visual effects for film and television, Shake 4 features 3D multi-plane compositing, optical flow image processing and integration with Final Cut Pro 5. Users can composite live action and 3D CGI layers with added realism using OpenGL accelerated 3D multi-plane compositing node. Other features include advanced optical flow technology that uses pixel-by-pixel imageanalysis to create smooth retiming and automatic stabilization. Shake 4 also integrates Truelight monitorcalibration to maintain color consistency between the computer screen and the final look on film.
Logic® Pro 7 is used by musicians around the world and by professionals in music production and filmscoring. It combines digital music composition, notation, and audio production facilities in onecomprehensive product and includes software instruments such as Sculpture, a component-modeling basedsynthesizer; UltraBeat™, a drum synthesizer with built-in step sequencer; and digital signal processing(DSP) plug-ins including Guitar Amp Pro, a full-featured guitar amplifier simulator. Along with workflowenhancements, mastering plug-ins, and support for Apple Loops, Logic Pro 7 adds distributed audioprocessing, a technology that allows professionals to utilize multiple Macintosh systems to expand availableDSP power via an Ethernet network.
In October 2005, the Company announced Aperture™, began shipping in November 2005. Aperture is anapplication designed to provide professional photographers with post-production tools to manage, edit, and publish digital pictures. Features include compare and select tools, nondestructive image processing, color managed printing, and custom web and book publishing. Compare and select tools in Aperture allowphotographers to sift through photo projects and identify their final selections. RAW images are maintained natively throughout Aperture without any intermediate conversion process, and can be retouched using a suite of adjustment tools designed especially for photographers. Print options includecustomizable contact sheets, high-quality local printing, and color-managed online prints. Aperture also provides a layout environment where photographers can create and order custom books and publish web galleries.
Consumer, Education and Business Oriented Application SoftwareiLife® ‘05 In January 2005, the Company introduced iLife ‘05, an upgrade to its digital lifestyle suite, which features iPhoto®, iMovie®, iDVD®, GarageBand™, and iTunes®.
iPhoto® 5 is the Company’s consumer-oriented digital photo software application. iPhoto 5 includes advanced editing tools, adds support for uncompressed RAW photos, and includes a slideshow builder allowing users to apply effects, transitions and durations to each individual slide. iPhoto 5 allows usersto create and order hardcover and softcover photo books using a variety of book layouts with double-sided printing, directly within the application.
iMovie® HD, a consumer-oriented digital video editing software application, enables users to import HDV from HDV camcorders and edit digital videos on their Macintosh computers. iMovie HD alsoincludes Magic iMovie, which automatically imports video into separate clips and adds titles, transitions and music. iMovie HD imports video from HDV and standard DV camcorders, and from video cameras that generate MPEG-4 video.

10
iDVD® is a consumer-oriented software application that enables users to turn iMovie files,QuickTime® files, and digital pictures into DVDs that can be played on most consumer DVD players.iDVD 5 includes 15 new themes featuring moving drop zones that can display video clips or photos in motion across DVD menus. iDVD 5 also features OneStep DVD, which automatically creates a DVD from footage directly from a user’s camcorder. With a compatible SuperDrive™, iDVD 5 supports all recordable single-layer and double-layer DVD format standards.
GarageBand™ is a consumer-oriented music creation software application. GarageBand 2 adds 8-track recording so that users can record multiple digital audio tracks at once. GarageBand 2 canimprove out-of-tune notes and timing in both vocal and real-instrument recordings. GarageBand 2 displays and edits musical notation in real time for software instrument tracks for people who knowhow to read and write music or want to learn. With GarageBand Jam Packs, including the latest, JamPack 4: Symphony Orchestra, GarageBand users can create music in their favorite genres.
iLife ‘05 also includes iTunes, the Company’s digital music jukebox software application that allows usersto purchase a variety of digital content available through the Company’s iTunes Music Store. iTunes organizes content using searching, browsing, and playlists, and also includes features such as iMix playlist sharing and provides integration with the complete family of iPods. In October 2005, the Companyintroduced iTunes 6, the latest version of its iTunes software. iTunes 6 allows users to purchase and download music videos, short films, and television shows from the iTunes Music Store, watch them on their computers, and Auto-Sync them onto their iPod.
In September 2005, the Company, Motorola Inc., and Cingular Wireless LLC announced the availability ofa mobile phone with iTunes software (Motorola ROKR), enabling users to transfer up to 100 songs fromthe iTunes library on their Macintosh or Windows-based computers to their Motorola ROKR mobile phones.
iWork™ ‘05 In January 2005, the Company introduced iWork ‘05, productivity software designed to take advantage of both Mac OS X and iLife ‘05 to help users create, present, and publish documents and presentations.iWork ‘05 introduced Pages™, a word processor, and also features Keynote™ 2, an updated version of theCompany’s presentation software.
Pages™ gives users the tools to create letters, newsletters, reports, brochures and resumes with advanced typography, multiple columns, footnotes, tables of content and styles. With features likedynamic text wrapping and alignment guides, Pages lets users create free-form arrangements of text, graphics, photos, tables, and charts. An integrated iLife media browser lets users drag and dropphotos from the iPhoto library directly into documents.
Keynote™ 2 is the Company’s presentation software that gives users the ability to createpresentations, portfolios, interactive slideshows, and storyboards. Keynote 2 contains slide animationsto synchronize the movement of multiple objects and cinematic real-time animated text. The iLife media browser within Keynote allows users to insert photos, movies, and music directly intopresentations, and with image masking, users can frame the exact part of the photo they want to display. Keynote 2 can also work with a second monitor to display upcoming slides, notes, and a timer.
In January 2005, the Company announced Final Cut® Express HD, an update to Final Cut Express, whichbegan shipping in February 2005. Final Cut Express HD enables users to capture, edit, and output HDV over a single FireWire cable, and supports Digital Cinema Desktop with multiple displays. Final CutExpress HD features sound editing tools including 99 audio tracks, real-time volume and audio filteradjustment, a voice-over tool, and Soundtrack music creation software that allows users to composemusical scores for their videos. Final Cut Express HD includes LiveType™, which can add HD-quality

11
animated text and motion graphics to videos. In addition, iMovie projects can be imported directly intoFinal Cut Express HD with all of their effects, transitions, and audio levels intact.
Logic® Express 7 is a streamlined version of Logic Pro 7 that provides a basic set of professional tools tocompose and produce music for students, educators, and advanced hobbyists. Its high-resolution audio of up to 24-bit/96kHz, the adaptive self-configuring track mixer, and 32-bit floating-point math provideprofessional sound quality. Logic Express 7 comes with support for projects from GarageBand offeringusers a smooth migration path to high-end audio production.
FileMaker, Inc., a wholly owned subsidiary of the Company, develops, publishes, and distributes desktop-based database management application software for either a Macintosh or Windows-based computer. The FileMaker® Pro database software and related products offer relational databases and desktop-to-web publishing capabilities. FileMaker Pro 8, the newest version of the desktop database introduced in August 2005, features new ways to share and manage information of various types. FileMaker Pro 8 allows users to convert graphic-rich reports of their data into alternative file formats, which can be emailed forsharing with non-FileMaker users.
Internet Software and Services The Company is focused on delivering seamless integration with and access to the Internet throughout theCompany’s products and services. The Company’s Internet solutions adhere to many industry standards inorder to provide an optimized user experience through interoperability.
Safari™ Safari, the Company’s Mac OS X compatible web browser, uses the advanced interface technologies underlying Mac OS X and includes built-in Google search; SnapBack™ to instantly return to search results; a way to name, organize and present bookmarks; tabbed browsing; and automatic “pop-up” ad blocking.
QuickTime® QuickTime, the Company’s multimedia software for Macintosh or Windows-based computers, featuresstreaming of live and stored video and audio over the Internet and playback of high-quality audio andvideo on computers. QuickTime 7 features a new video codec called H.264, which delivers high videoquality at low data rates. QuickTime 7 automatically determines a user’s connection speed to ensure theyare getting the highest-quality content stream possible. QuickTime 7 also delivers multi-channel audio andsupports audio formats, including AIFF, WAV, MOV, MP4 (AAC only), CAF, and AAC/ADTS.
The Company offers several other QuickTime products. QuickTime 7 Pro, a suite of software tools, allowscreation and editing of Internet-ready audio and video files. QuickTime 7 Pro allows users to create H.264video, capture audio and video, create multi-channel audio, and export multiple files while playing back orediting video. QuickTime Streaming Server facilitates the broadcasting of streaming digital video. QuickTime Broadcaster allows users to produce professional-quality live events for online delivery.
.Mac™ The Company’s .Mac offering is a suite of Internet services that for an annual fee provides Macintosh userswith a powerful set of Internet tools. .Mac services include: HomePage, for personal web sites; iDisk, avirtual hard drive accessible anywhere with Internet access; .Mac Sync, which keeps Safari bookmarks,iCal® calendars, Address Book information, Keychain® (passwords), and Mac OS X Mail preferences up-to-date across multiple Macintosh computers and available via web browser when users are away from their Mac; .Mac Mail, an ad-free email service; and Learning Center, featuring tutorials for certain software applications. The current version of .Mac includes .Mac Groups, a service that helps memberscommunicate, coordinate schedules, and stay in sync with private groups of friends or colleagues; an

12
updated version of .Mac Backup software that allows members to archive the content of their iLife Homefolder; and a four-fold increase in combined iDisk and email storage to 1GB for individuals and 2GB for families.
Wireless Connectivity and Networking
AirPort Extreme® AirPort Extreme is the Company’s next generation Wi-Fi wireless networking technology. AirPort Extreme is based on the 802.11g standard, which supports speeds up to 54 Mbps, and is fully compatible with mostWi-Fi devices that use the 802.11b standard. AirPort Extreme Base Stations can serve up to 50 Macintosh and Windows users simultaneously, provide wireless bridging to extend the range beyond just one basestation, and support USB printer sharing to allow multiple users to wirelessly share USB printersconnected directly to the base station.
AirPort® Express AirPort® Express is the first 802.11g mobile base station that can be plugged directly into the wall for wireless Internet connections and USB printing. Airport Express also features analog and digital audiooutputs that can be connected to a stereo and AirTunes™ music networking software which works withiTunes, giving users a way to wirelessly stream iTunes music from their Macintosh or Windows-basedcomputer to any room in the house. AirPort Express features a single piece design weighing 6.7 ounces.
Other Connectivity and Networking Solutions Mac OS X includes capabilities for Bluetooth technology. Bluetooth is an industry standard for wirelessly connecting computers and peripherals that supports transmission of data at up to 3 Mbps within a range of approximately 30 feet. The Company’s Bluetooth technology for Mac OS X lets customers wirelessly share files between Macintosh systems, synchronize and share contact information with Palm-OS based PDAs, and access the Internet through Bluetooth-enabled cell phones. A Bluetooth USB adaptor can Bluetooth-enable any USB-based Macintosh computer running in Mac OS X version 10.1.4 or higher.
Bonjour™, the Company’s zero configuration networking technology, is based on open InternetEngineering Task Force (IETF) Standard Protocols such as IP, ARP, and DNS and is built into Mac OS X.This technology uses industry standard networking protocols and zero configuration technology including Ethernet or 802.11-based wireless networks like the Company’s AirPort products. The source code for this technology also includes software to support UNIX, Linux, and Windows-based systems and devices.
The Company developed FireWire technology, also referred to as IEEE 1394, which is a high-speed serialI/O technology for connecting digital devices such as digital camcorders and cameras to desktop andportable computers. With its high data-transfer speed and “hot plug-and-play” capability, FireWire has become an established cross-platform industry standard for both consumers and professionals. FireWire iscurrently integrated in all Macintosh systems.
Product Support and Services AppleCare® offers a range of support options for the Company’s customers. These options include assistance that is built into software products, printed and electronic product manuals, online support including comprehensive product information as well as technical assistance, and the AppleCare Protection Plan. The AppleCare Protection Plan is a fee-based service that typically includes three years ofphone support and hardware repairs, dedicated web-based support resources, and user diagnostic tools.
Markets and DistributionThe Company’s customers are primarily in the education, creative, consumer, and business markets. The Company distributes its products through wholesalers, resellers, national and regional retailers and
13
cataloguers. No individual customer accounted for more than 10% of net sales in 2005, 2004, or 2003. TheCompany also sells many of its products and resells certain third-party products in most of its major markets directly to consumers, education customers, and businesses through its retail and online stores in the U.S. and internationally. Over 12% of the Company’s net sales in 2005 were through its U.S. education channel, including sales to elementary and secondary schools, higher education institutions, and individualcustomers.
Competition The Company is confronted by aggressive competition in all areas of its business. The market for personalcomputers and related software and peripheral products is highly competitive. This market continues to becharacterized by rapid technological advances in both hardware and software that have substantiallyincreased the capabilities and use of personal computers and have resulted in the frequent introduction of new products with competitive price, feature, and performance characteristics. Over the past several years, price competition in the market for personal computers has been particularly intense. The Company’scompetitors who sell personal computers based on other operating systems have aggressively cut prices and lowered their product margins to gain or maintain market share. The Company’s results of operations and financial condition can be adversely affected by these and other industry-wide downward pressures on gross margins.
The principal competitive factors in the market for personal computers include price, relative price/performance, product quality and reliability, design innovation, availability of software, product features, marketing and distribution capability, service and support, availability of hardware peripherals, and corporate reputation. Further, as the personal computer industry and its customers place more reliance on the Internet, an increasing number of Internet devices that are smaller, simpler, and lessexpensive than traditional personal computers may compete for market share with the Company’s existingproducts.
The Company is currently taking and will continue to take steps to respond to the competitive pressuresbeing placed on its personal computer sales as a result of innovations from competing platforms. TheCompany’s future operating results and financial condition are substantially dependent on its ability tocontinue to develop improvements to the Macintosh platform in order to maintain perceived functionaland design advantages over competing platforms.
The Company’s services and products relating to music and other creative content have already encouraged significant competition from other companies, many of whom have greater financial,marketing, and manufacturing resources than those of the Company. The Company faces increasingcompetition from other companies promoting their own digital music products and distribution services, subscription services, and free peer-to-peer music services. The Company anticipates that competition will intensify as hardware, software, and content providers work more collaboratively to offer integratedproducts competing with the Company’s offerings. However, the Company believes it currently maintains a competitive advantage by more effectively integrating an entire solution, including the hardware (iPod), software (iTunes), and distribution of third-party digital content (iTunes Music Store).
Raw Materials Although most components essential to the Company’s business are generally available from multiplesources, certain key components (including microprocessors and application-specific integrated circuits (“ASICs”)) are currently obtained by the Company from single or limited sources. Some other key components, while currently available to the Company from multiple sources, are at times subject toindustry-wide availability constraints and pricing pressures. In addition, the Company uses somecomponents that are not common to the rest of the personal computer and consumer electronics industries, and new products introduced by the Company often initially utilize custom components

14
obtained from only one source until the Company has evaluated whether there is a need for, andsubsequently qualifies, additional suppliers. If the supply of a key or single-sourced component to theCompany were to be delayed or curtailed or in the event a key manufacturing vendor delays shipments of completed products to the Company, the Company’s ability to ship related products in desired quantities and in a timely manner could be adversely affected. The Company did experience such delays during 2004 and 2005 related to PowerPC G5 processors, which resulted in the constrained availability of certain products. The Company’s business and financial performance could also be adversely affected depending on the time required to obtain sufficient quantities from the original source, or to identify and obtainsufficient quantities from an alternative source. Continued availability of these components may be affected if producers were to decide to concentrate on the production of common components instead of components customized to meet the Company’s requirements. In June 2005, the Company announced its intention to transition its Macintosh computers using the PowerPC G5 and G4 microprocessors, which are currently single-sourced, to Intel microprocessors by the end of calendar year 2007. The announcement ofthis transition may impact the continued availability on acceptable terms of certain components and services, including PowerPC G5 and G4 microprocessors. The Company attempts to mitigate thesepotential risks by working closely with these and other key suppliers on product introduction plans, strategic inventories, coordinated product introductions, and internal and external manufacturingschedules and levels. Consistent with industry practice, the Company acquires components through a combination of formal purchase orders, supplier contracts, and open orders based on projected demandinformation. The Company’s purchase commitments typically cover its requirements for periods ranging from 30 to 150 days.
The Company believes there are several component suppliers and manufacturing vendors whose loss to theCompany could have a material adverse effect upon the Company’s business and financial position. At thistime, such vendors include Agere Systems, Inc., Ambit Microsystems Corporation, ASUSTeK Corporation, ATI Technologies, Inc., Broadcom Corporation, Cypress Semiconductor Corporation, Freescale Semiconductor, Inc., Hitachi Global Storage Technologies, Hon Hai Precision Industry Co.,Ltd., IBM Corporation, Intel Corporation, International Display Technology, Inventec Appliances Corporation, LG. Phillips Co., Ltd., Matsushita, Mitsubishi Electric Corporation, NVIDIA Corp.,PortalPlayer, Inc., Quanta Computer, Inc., Samsung Electronics, Synaptics, Inc., and Toshiba Corporation.
Research and Development Because the personal computer and consumer electronics industries are characterized by rapid technological advances, the Company’s ability to compete successfully is heavily dependent upon its ability to ensure a continuing and timely flow of competitive products and technology to the marketplace. The Company continues to develop new products and technologies and to enhance existing products in the areas of hardware and peripherals, consumer electronic products, system software, applications software, networking and communications software and solutions, and the Internet. The Company may expand the range of its product offerings and intellectual property through licensing and/or acquisition of third-party business and technology. The Company’s research and development expenditures totaled $534 million, $489 million, and $471 million in 2005, 2004, and 2003, respectively.
Patents, Trademarks, Copyrights and Licenses The Company currently holds rights to patents and copyrights relating to certain aspects of its computersystems, iPods, peripherals and software. In addition, the Company has registered, and/or has applied toregister, trademarks and service marks in the U.S. and a number of foreign countries for “Apple,” the Apple logo, “Macintosh,” “iPod,” “iTunes,” “iTunes Music Store,” and numerous other trademarks andservice marks. Although the Company believes the ownership of such patents, copyrights, trademarks and service marks is an important factor in its business and that its success does depend in part on the

15
ownership thereof, the Company relies primarily on the innovative skills, technical competence, and marketing abilities of its personnel.
Many of the Company’s products are designed to include intellectual property obtained from third-parties. While it may be necessary in the future to seek or renew licenses relating to various aspects of its products and business methods, the Company believes that, based upon past experience and industry practice, suchlicenses generally could be obtained on commercially reasonable terms; however, there is no guarantee that such licenses could be obtained at all. Because of technological changes in the computer industry, current extensive patent coverage, and the rapid rate of issuance of new patents, it is possible certain components of the Company’s products and business methods may unknowingly infringe existing patentsof others. From time to time, the Company has been notified that it may be infringing certain patents orother intellectual property rights of third-parties.
Foreign and Domestic Operations and Geographic Data The U.S. represents the Company’s largest geographic marketplace. Approximately 60% of the Company’s net sales in 2005 came from sales to customers inside the U.S. Final assembly of products sold by the Company is conducted in the Company’s manufacturing facility in Cork, Ireland, and by external vendors in Fremont, California, Fullerton, California, Taiwan, Korea, the People’s Republic of China, and theCzech Republic. Currently, manufacture of many of the components used in the Company’s products andfinal assembly of substantially all of the Company’s portable products including PowerBooks, iBooks, and iPods are performed by third-party vendors in China. Margins on sales of the Company’s products inforeign countries, and on sales of products that include components obtained from foreign suppliers, can be adversely affected by foreign currency exchange rate fluctuations and by international trade regulations, including tariffs and antidumping penalties.
Information regarding financial data by geographic segment is set forth in Part II, Item 8 of this Form 10-Kin the Notes to Consolidated Financial Statements at Note 11, “Segment Information and GeographicData.”
Seasonal BusinessThe Company has historically experienced increased net sales in its first and fourth fiscal quarterscompared to other quarters in its fiscal year due to seasonal demand related to the holiday season and the beginning of the school year. This historical pattern should not be considered a reliable indicator of theCompany’s future net sales or financial performance.
Warranty The Company offers a basic limited parts and labor warranty on its hardware products. The basic warrantyperiod for hardware products is typically one year from the date of purchase by the end-user. TheCompany also offers a 90-day basic warranty for its service parts used to repair the Company’s hardwareproducts. In addition, consumers may purchase extended service coverage on most of the Company’s hardware products in all of its major markets.
Backlog In the Company’s experience, the actual amount of product backlog at any particular time is not a meaningful indication of its future business prospects. In particular, backlog often increases in anticipation of or immediately following new product introductions because of over-ordering by dealers anticipatingshortages. Backlog often is reduced once dealers and customers believe they can obtain sufficient supply.Because of the foregoing, backlog should not be considered a reliable indicator of the Company’s ability to achieve any particular level of revenue or financial performance.

16
Environmental Laws Compliance with federal, state, local, and foreign laws enacted for the protection of the environment has todate had no material effect on the Company’s capital expenditures, earnings, or competitive position. In the future, these laws could have a material adverse effect on the Company.
Production and marketing of products in certain states and countries may subject the Company toenvironmental and other regulations including, in some instances, the requirement that the Companyprovide consumers with the ability to return to the Company product at the end of its useful life, and place responsibility for environmentally safe disposal or recycling with the Company. Such laws and regulations have recently been passed in several jurisdictions in which the Company operates, including various European Union member states, Japan, and California. In the future, these laws could have a materialadverse effect on the Company.
Employees As of September 24, 2005, the Company had approximately 14,800 full-time equivalent employees and anadditional 2,020 temporary employees and contractors.
Available Information The Company’s Annual Report on Form 10-K, Quarterly Reports on Form 10-Q, Current Reports on Form 8-K, and amendments to reports filed pursuant to Sections 13(a) and 15(d) of the Securities Exchange Act of 1934, as amended, are available on its website at http://www.apple.com/investor whensuch reports are available on the U.S. Securities and Exchange Commission (SEC) website. The public may read and copy any materials filed by the Company with the SEC at the SEC’s Public Reference Room at 100 F Street, NE, Room 1580, Washington, DC 20549. The public may obtain information on theoperation of the Public Reference Room by calling the SEC at 1-800-SEC-0330. The SEC maintains anInternet site that contains reports, proxy and information statements and other information regardingissuers that file electronically with the SEC at http://www.sec.gov. The contents of these websites are not incorporated into this filing. Further, the Company’s references to the URLs for these websites areintended to be inactive textual references only.
Item 2. Properties
The Company’s headquarters are located in Cupertino, California. The Company has manufacturing facilities in Cork, Ireland. As of September 24, 2005, the Company leased approximately 3.6 million squarefeet of space, primarily in the U.S., and to a lesser extent, in Europe, Japan, Canada, and the Asia Pacificregion. The major facility leases are for terms of 5 to 15 years and generally provide renewal options for terms of 3 to 5 additional years. Leased space includes approximately 902,000 square feet of retail space, a majority of which is in the U.S. Lease terms for retail space range from 5 to 20 years, the majority of whichare for 10 years, and often contain multi-year renewal options.
The Company owns a 352,000 square-foot manufacturing facility in Cork, Ireland that also houses acustomer support call center. The Company also owns a 752,000 square-foot facility in Sacramento, California that houses warehousing and distribution operations as well as a customer support call center. In addition, the Company owns approximately 942,000 square feet of facilities located in Cupertino, California, used for research and development and corporate functions. Outside the U.S., the Company owns additional facilities totaling approximately 169,000 square feet.
The Company believes its existing facilities and equipment are well maintained and in good operating condition. The Company has invested in internal capacity and strategic relationships with outsidemanufacturing vendors, and therefore believes it has adequate manufacturing capacity for the foreseeablefuture. The Company continues to make investments in capital equipment as needed to meet anticipated demand for its products.

17
Item 3. Legal Proceedings
The Company is subject to various legal proceedings and claims that are discussed below. The Company is also subject to certain other legal proceedings and claims that have arisen in the ordinary course of business and which have not been fully adjudicated. In the opinion of management, the Company does nothave a potential liability related to any current legal proceedings and claims that would individually or inthe aggregate have a material adverse effect on its financial condition, liquidity or results of operations. However, the results of legal proceedings cannot be predicted with certainty. Should the Company fail to prevail in any of these legal matters or should several of these legal matters be resolved against the Company in the same reporting period, the operating results of a particular reporting period could be materially adversely affected. The Company settled certain matters during 2005 that did not individually or in the aggregate have a material impact on the Company’s results of operations.
Advanced Audio Devices LLC v. Apple Computer, Inc. Plaintiff Advanced Audio Devices (AAD) filed this action on March 3, 2005 in the United States District Court for the Northern District of Illinois, Eastern Division, alleging infringement by the Company of U.S. Patent 6,587,403 entitled “Music Jukebox.” The complaint sought unspecified damages and other relief. The Company filed an answer on May 4, 2005 denying all material allegations and asserting numerousaffirmative defenses. The parties have reached a settlement. Settlement of this matter did not have a material effect on the Company’s financial position or results of operation.
Apple Corps Ltd. v. Apple Computer, Inc.; Apple Computer, Inc. v. Apple Corps Ltd. Plaintiff Apple Corps filed this action on July 4, 2003 in the High Court of Justice, Chancery Division, in London alleging that the Company has breached a 1991 agreement that resolved earlier trademarklitigation between the parties regarding use of certain Apple marks. Plaintiff seeks an injunction, unspecified damages, and other relief. The Company filed a motion on October 13, 2003, challenging jurisdiction in the U.K. The Court denied this motion on April 7, 2004. The Company filed an appeal of the Court’s decision but subsequently withdrew the appeal. In November 2004, Plaintiff served theCompany with an Amended Bill of Particulars and on December 23, 2004 the Company filed a Defence.Plaintiff has indicated its intention to file a Re-Amended Bill of Particulars. The Company’s Defence tothe Re-Amended Bill of Particulars is not yet due. Trial is set for the week of March 27, 2006.
On October 8, 2003, the Company filed a lawsuit against Apple Corps in the United States District Court for the Northern District of California requesting a declaratory judgment that the Company has not breached the 1991 agreement. Apple Corps challenged jurisdiction in the California case but the Courtdenied that challenge on March 25, 2004. Apple Corps subsequently prevailed on a motion to stay the California case during the pendency of the U.K. action. The Company has dismissed the California lawsuitwithout prejudice.
Bader v. Anderson; Bader v. Apple Computer, Inc. et. al. Plaintiff filed this purported shareholder derivative action against the Company and each of its current executive officers and members of its Board of Directors on May 19, 2005 in Santa Clara County Superior Court asserting claims for breach of fiduciary duty, material misstatements and omissions, and violations ofCalifornia Businesses and Professions Code §17200 (unfair competition). Plaintiff alleges that theCompany’s March 14, 2005 proxy statement was false and misleading for failure to disclose certain information relating to the Apple Computer, Inc. Performance Bonus Plan which was approved by shareholders at the annual meeting held on April 21, 2005. Plaintiff, who ostensibly brings suit on theCompany’s behalf, has made no demand on the Board of Directors and alleges that such demand isexcused. Plaintiff seeks injunctive and other relief for purported injury to the Company. On July 27, 2005, Plaintiff filed an amended complaint alleging that, in addition to the purported derivative claims, adoption of the bonus plan and distribution of the proxy statement describing that plan also inflicted injury on her
18
directly as an individual shareholder. Defendants filed a demurrer which is scheduled to be heard on December 6, 2005.
Baghdasarian, et al. v. Apple Computer, Inc.Plaintiffs filed this action in Los Angeles County Superior Court on October 31, 2005, on behalf of a purported nationwide class of all purchasers of all Apple wireless products (router, modem, or adaptor)sold at any time. The complaint alleges that the Company misrepresented the transmission rates of theseproducts. The complaint alleges causes of action for breach of express warranty and for violations of theConsumer Legal Remedies Act, California Business & Professions Code §17200 (unfair competition) and California Business & Professions Code §17500 (false advertising). The complaint seeks damages andequitable remedies. The Company’s response to the complaint is not yet due.
Branning et al. v. Apple Computer, Inc. Plaintiffs filed this purported class action in San Francisco County Superior Court on February 17, 2005. The complaint alleges violations of California Business & Professions Code §17200 (unfair competition)and violation of the Consumer Legal Remedies Act (CLRA) regarding a variety of purportedly unfair andunlawful conduct including, but not limited to, allegedly selling used computers as new and failing to honor warranties. Plantiffs also bring causes of action for misappropriation of trade secrets, breach of contract, and violation of the Song Beverly Act. Plaintiffs request unspecified damages and other relief. The Company received service of the complaint on March 12, 2005, and on March 13, 2005 the Company fileda motion to transfer the case to Santa Clara County Superior Court. On May 9, 2005, the Court grantedthe motion and transferred the case to Santa Clara County Superior Court. On May 2, 2005, Plaintiffs filedan amended complaint adding two new named Plaintiffs and three new causes of action including a claimfor treble damages under the Cartwright Act (California Business and Professions Code §16700 et seq.) and a claim for false advertising. The Company filed a demurrer to the amended complaint which theCourt sustained in its entirety on November 10, 2005. The Court granted Plaintiffs leave to amend their complaint.
Burrow v. Apple Computer, Inc. Plaintiff filed this purported class action in Orange County Superior Court on February 17, 2005 allegingfalse advertising regarding the copy protection capabilities of DVD Studio Pro. The Complaint alleged violations of California Business & Professions Code §17200 (unfair competition), California Business & Professions Code §17500 (false advertising) and negligent misrepresentation. Plaintiff requestedunspecified damages and other relief. The Company filed an answer on April 7, 2005 denying allallegations and asserting numerous affirmative defenses. The parties have reached a settlement. Settlement of this matter did not have a material effect on the Company’s financial position or results ofoperation.
Butzer, et al., v. Apple Computer, Inc. Plaintiffs filed this action on August 23, 2005, in the United States District Court for the Northern District of California, San Jose Division, on behalf of a purported nationwide class of all purchasers of the Company’s PowerBook G4 portable computers. The complaint alleges defects in the memory of thecomputers. The complaint alleges that this purported defect extends to other series of the Company’s portables and states that plaintiffs reserve the right to amend the complaint to include these other series.Plaintiffs assert claims for alleged violations of California Business & Professions Code §17200 (unfair competition), California Business & Professions Code §17500 (false advertising), the Consumer LegalRemedies Act and the Song-Beverly Consumer Warranty Act. The complaint seeks remedies includingrestitution and/or damages and injunctive relief. The Company filed an answer on October 19, 2005 denying the material allegations and asserting numerous affirmative defenses.

19
Cagney v. Apple Computer, Inc. Plaintiff filed this purported class action on January 9, 2004 in Los Angeles County Superior Court, alleging improper collection of sales tax in transactions involving mail-in rebates. The complaint allegesviolations of California Business and Professions Code §17200 (unfair competition) and seeks restitution and other relief. The Company filed an answer on February 20, 2004, denying all allegations and assertingnumerous affirmative defenses. The Company filed a motion to disqualify Plaintiff’s counsel, which theCourt denied. The Company filed a petition for a writ of mandate with respect to this ruling and the Court of Appeal issued an order to show cause as to why the writ should not issue. Plaintiff’s lead counsel subsequently withdrew. On February 17, 2005 the Court of Appeal ruled that the trial court abused itsdiscretion in failing to grant the Company’s motion to disqualify and ordered the trial court to disqualifyboth of Plaintiff’s law firms upon remand. The trial court issued the disqualification order on May 12, 2005. On May 9, 2005 Plaintiff substituted new counsel. The Company has obtained an opinion on the tax issuefrom the State Board of Equalization. Discovery is stayed.
Clark v. Apple Computer, Inc.Plaintiff filed this purported class action on February 2, 2005 in Santa Clara County Superior Court alleging defects in the Company’s “yo-yo” power adapters. Plaintiffs request unspecified damages and other relief. The parties reached a tentative settlement in this matter. The Court granted preliminaryapproval of the settlement on April 19, 2005. On November 29, 2005, the Court continued the hearing on final settlement approval until January 10, 2006, when all claims will have been received and completelyprocessed and relevant claim information has been reported to the Court. Settlement of this matter on the terms preliminarily approved by the Court will not have a material effect on the Company’s financial position or results of operation.
Compression Labs, Inc. v. Apple Computer, Inc., et al.; Apple v. Compression Labs, Inc., et al. Plaintiff Compression Labs, Inc. filed this patent infringement action on April 22, 2004 against theCompany and twenty-seven other defendants in the United States District Court for the Eastern District of Texas, Marshall Division, alleging infringement of U.S. patent 4,698,672 (the ‘672 patent). Plaintiff alleges that the Company infringes the patent by complying with the JPEG standard as defined by CCITT Recommendation T.81 entitled “Information Technology—Digital Compression and Coding of Continuous Tone Still Images—Requirements and Guidelines.” Plaintiff seeks unspecified damages andother relief.
On July 2, 2004, the Company and several other defendants in the Texas action filed a lawsuit in the United States District Court in Delaware against Compression Labs, Inc. and two other companies,requesting a declaratory judgment of noninfringement, invalidity, implied license, and unenforceability with respect to the ‘672 patent. Additional actions regarding this patent have been filed in other jurisdictions. On February 16, 2005, the Panel on Multi-District Litigation (MDL) granted a petition filed by certain defendants, seeking coordination and transfer of all of these cases to one court for pre-trialproceedings. The MDL Panel has transferred all of the cases to the Northern District of California. The defendants in the Texas and Delaware actions had filed motions to dismiss prior to the transfer and bothmotions are still pending. A Markman hearing is set for February 13, 2006.
Contois Music Technology LLC v. Apple Computer, Inc. Plaintiff Contois Music Technology (“Contois”) filed this action on June 13, 2005 in the United StatesDistrict Court for Vermont, alleging infringement by the Company of U.S. Patent No. 5,864,868, entitled “Computer Control System and User Interface for Media Playing Devices.” The complaint, which wasserved on October 4, 2005, seeks unspecified damages and other relief. The Company filed an answer on November 23, 2005 denying all material allegations and asserting numerous affirmative defenses.

20
Craft v. Apple Computer, Inc. (filed December 23, 2003, Santa Clara County Superior Court); Chin v. Apple Computer, Inc. (filed December 23, 2003, San Mateo County Superior Court); Hughes v. AppleComputer, Inc. (filed December 23, 2003, Santa Clara County Superior Court); Westley v. Apple Computer, Inc. (filed December 26, 2003, San Francisco County Superior Court); Keegan v. Apple Computer, Inc. (filed December 30, 2003, Alameda County Superior Court); Wagya v. Apple Computer, Inc.(filed February 19, 2004, Alameda County Superior Court); Yamin v. Apple Computer, Inc. (filed February 24, 2004, Los Angeles County Superior Court); Kieta v. Apple Computer, Inc. (filed July 8, 2004,Alameda County Superior Court) Eight separate plaintiffs filed purported class action cases in various California courts allegingmisrepresentations by the Company relative to iPod battery life. The complaints include causes of actionfor violation of California Business and Professions Code §17200 (unfair competition), the Consumer Legal Remedies Action and claims for false advertising, fraudulent concealment, and breach of warranty. The complaints seek unspecified damages and other relief. The cases were consolidated in San Mateo County and Plaintiffs thereafter filed a consolidated complaint. On August 25, 2004, the Company filed an answer denying all allegations and asserting numerous affirmative defenses. The parties reached atentative settlement and the Court granted preliminary approval of the settlement on May 20, 2005. The trial court entered an order granting final approval to the settlement on August 25, 2005. An appealchallenging the trial court’s approval of the settlement was filed on October 24, 2005; the appeal is pending. Settlement of this matter on the terms approved by the Court will not have a material effect onthe Company’s financial position or results of operations.
A similar complaint relative to iPod battery life, Mosley v. Apple Computer, Inc. was filed in Westchester County, New York on June 23, 2004 alleging violations of New York General Business Law Sections 349(unfair competition) and 350 (false advertising). The Company removed the case to Federal Court and Plaintiff filed a motion for remand, which the Court has not yet decided. This case is stayed and is part of the settlement, now on appeal, referred to above.
A similar complaint related to the iPod battery life, Lenzi v. Apple Canada, Inc., was filed in Montreal, Quebec, Canada, on June 7, 2005, seeking authorization to institute a class action on behalf of Generations 1, 2 and 3 iPod owners in Quebec. A class certification hearing has been scheduled for January 12, 2006.
Two similar complaints relative to iPod battery life, Wolfe v. Apple and Hirst v. Apple, were filed in Toronto,Ontario, Canada on August 15, 2005 and September 12, 2005, respectively. Both actions define the class as a national class consisting of all persons in Canada who have purchased or who own an iPod. A motion forcertification of the class proceeding has been scheduled for the Spring of 2006.
Davis v. Apple Computer, Inc. Plaintiff filed this purported class action in San Francisco County Superior Court on December 5, 2002, alleging that the Company engaged in unfair and deceptive business practices relating to its AppleCareExtended Service and Warranty Plan. Plaintiff asserts causes of action for violation of the California Business and Professions Code §17200 (unfair competition) and §17500 (false advertising), breach of the Song-Beverly Warranty Act, intentional misrepresentation and concealment. Plaintiff requests unspecified damages and other relief. The Company filed a demurrer and motion to strike which were granted, in part,and Plaintiff filed an amended complaint. The Company filed an answer on April 17, 2003 denying allallegations and asserting numerous affirmative defenses. Plaintiff subsequently amended its complaint. On October 29, 2003, the Company filed a motion to disqualify Plaintiff’s counsel in his role as counsel to the purported class and to the general public. The Court granted the motion but allowed Plaintiff to retainsubstitute counsel. Plaintiff did engage new counsel for the general public, but not for the class. TheCompany moved to disqualify Plaintiff’s new counsel and to have the Court dismiss the general public claims for equitable relief. The Court declined to disqualify Plaintiff’s new counsel or to dismiss the equitable claims, but did confirm that the class action claims are dismissed. The Company appealed the ruling and the case was stayed pending the outcome of the appeal. The Court of Appeal denied the appeal

21
on August 17, 2005, affirming the trial court’s decision. The Company filed a Petition for review with theCalifornia Supreme Court which was denied on November 23, 2005.
European Commission Investigation The European Commission has notified the Company that it is investigating certain matters relating to theiTunes Music Store in the European Union (EU). The European Commission is investigating claims madeby Which?, a United Kingdom (UK) consumer association, that the Company is violating EU competition law by charging more for online music in the UK than in Eurozone countries and preventing UKconsumers from purchasing online music from the iTunes Music Store for Eurozone countries. The Which? claims were originally lodged with the UK Office of Fair Trading, which subsequently referredthem to the European Commission. The European Commission is investigating the charges under Articles 81 and 82 of the European Commission Treaty.
Gobeli Research Ltd. v. Apple Computer, Inc., et al. Plaintiff Gobeli Research Ltd. filed this patent infringement action against the Company and SunMicrosystems, Inc. on April 15, 2004 in the United States District Court for the Eastern District of Texas,Marshall Division, alleging infringement of U.S. patent 5,418,968 related to a “System and Method of Controlling Interrupt Processing.” Plaintiff alleges that the Company’s Mac OS 9 and Mac OS X operating systems infringe Plaintiff’s patent. Plaintiff seeks unspecified damages and other relief. The Company filedan answer on June 9, 2004, denying all material allegations and asserting numerous affirmative defenses. The Company also asserted counterclaims requesting declaratory judgment of non-infringement andinvalidity. A Markman hearing took place August 9, 2005, and the Court issued a ruling on August 26, 2005 invalidating one of Plantiff’s two claims. On October 18, 2005, a Stipulation entered into by theparties was filed removing Mac OS 9 from the case. The trial is scheduled for February 6, 2006.
Goldberg, et al. v. Apple Computer, Inc., et al. (f.k.a. “Dan v. Apple Computer, Inc.”)Plaintiffs filed this purported class action on September 22, 2003 in Los Angeles County Superior Courtagainst the Company and other members of the computer industry on behalf of an alleged nationwide classof purchasers of certain computer hard drives. The case alleges violations of California Business andProfessions Code §17200 (unfair competition), the Consumer Legal Remedies Act and false advertising related to the size of the drives. Plaintiffs allege that calculation of hard drive size using the decimalmethod misrepresents the actual size of the drive. The complaint seeks restitution and other relief. Plaintiff filed an amended complaint on March 30, 2004 and the Company filed an answer on September 23, 2004, denying all allegations and asserting numerous affirmative defenses. Defendants filed a motion to strikeportions of the complaint based on sales by resellers and filed a motion for judgment on the pleadings based upon Proposition 64. The Court granted both motions at a hearing on April 6, 2005. Plaintiff filed an amended complaint on May 6, 2005. The Defendants filed a demurrer on June 6, 2005, which was heard onAugust 22, 2005. The Court granted the demurrer in part and denied it in part. Plaintiff filed an amended complaint. The Company’s response is not yet due.
Honeywell International, Inc., et al. v. Apple Computer, Inc., et al. Plaintiffs Honeywell International, Inc. and Honeywell Intellectual Properties, Inc. filed this action onOctober 6, 2004 in the United States District Court in Delaware alleging infringement by the Company andother defendants of U.S. patent 5,280,371 entitled “Directional Diffuser for a Liquid Crystal Display.”Plaintiffs seek unspecified damages and other relief. The Company filed an answer on December 21, 2004denying all material allegations and asserting numerous affirmative defenses. The Company has tenderedthe case to several suppliers. On May 18, 2005 the Court stayed the case against the Company and theother supplier defendants. Plantiffs filed an amended complaint on November 7, 2005 adding additionaldefendants and expanding the scope of the accused products. Given the stay, the Company’s response tothe amended complaint is not yet due.

22
MacTech Systems v. Apple Computer, Inc.; Macadam v. Apple Computer, Inc.; Computer International, Inc. v. Apple Computer, Inc.; Elite Computers and Software, Inc. v. Apple Computer, Inc.; The Neighborhood Computer Store v. Apple Computer, Inc. MacAccessory Center, Inc. v. Apple Computer, Inc.; MacAccessory Center, Inc. v. Apple Computer, Inc. (all in Santa Clara County Superior Court)Six resellers have filed similar lawsuits against the Company for various causes of action including breach of contract, fraud, negligent and intentional interference with economic relationship, negligentmisrepresentation, trade libel, unfair competition and false advertising. Plaintiffs request unspecified damages and other relief. The Company answered the Computer International complaint onNovember 12, 2003, denying all allegations and asserting numerous affirmative defenses. The Company filed an answer in the Macadam case on December 3, 2004 denying all allegations and asserting numerous defenses. Three of the other plaintiffs filed amended complaints on February 7, 2005, and on March 16, 2005 the Company filed answers to these claims denying all allegations and asserting numerous affirmativedefenses. A sixth Plaintiff, MacAccessory Center, filed a complaint on February 23, 2005. The Companyfiled an answer to this complaint on April 20, 2005 denying all allegations and asserting numerous affirmative defenses. These cases are in discovery.
On October 1, 2003, one of the reseller Plaintiffs, Macadam, was deauthorized as an Apple reseller.Macadam filed a motion for a temporary order to reinstate it as a reseller, which the Court denied. The Court denied Macadam’s motion for a preliminary injunction on December 19, 2003. On December 6,2004 Macadam filed for Chapter 11 Bankruptcy in the Northern District of California, which placed a stayon the litigation as to Macadam only. The Company filed a claim in the bankruptcy proceedings on February 16, 2005. The Company took Macadam’s debtor examination in April 2005. The Company, joined by another creditor of Macadam, filed a motion to convert the bankruptcy to Chapter 7(liquidation) on April 29, 2005 and that motion was granted. Plantiffs’ counsel in four of the six otherreseller cases, was recently appointed litigation counsel for the Macadam Estate by the bankruptcy court.The Company has moved for reconsideration of that decision.
Premier International Associates LLC v. Apple Computer, Inc. Plaintiff Premier International Associates LLC (Premier) filed this action on November 3, 2005 in theUnited States District Court for the Eastern District of Texas, Marshall Division, alleging infringement by the Company of U.S. Patents 6,243,725 and 6,763,345 both entitled “List Building System.” The complaint seeks unspecified damages and other relief. The Company’s response is not yet due.
Slattery v. Apple Computer, Inc. Plaintiff filed this purported class action on January 3, 2005 in the United States District Court for theNorthern District of California alleging various claims including alleged unlawful tying of music purchasedon the iTunes Music Store with the purchase of iPods and vice versa and unlawful acquisition or maintenance of monopoly market power. Plaintiff’s complaint alleged violations of §§1 and 2 of the Sherman Act (15 U.S.C. §§1 and 2), California Business and Professions Code §16700 et seq. (theCartwright Act), California Business and Professions Code §17200 (unfair competition), common lawunjust enrichment and common law monopolization. Plaintiff seeks unspecified damages and other relief.The Company filed a motion to dismiss on February 10, 2005. On September 9, 2005, the Court denied the motion in part and granted it in part. Plaintiff filed an amended complaint on September 23, 2005 and theCompany filed an answer on October 11, 2005. The case is in discovery.
Stamm v. Apple Computer, Inc./Allen v. Apple Computer, Inc. Plaintiff Stamm filed a purported class action on November 12, 2004 in Circuit Court, Cook County, Illinois alleging that a defect in Apple’s 17-inch Studio Display monitors results in dimming of half of thescreen and constant blinking of the power light. The Company removed the case to Federal Court onDecember 22, 2004. The Court remanded it to State Court on March 22, 2005 on Plaintiff’s motion. The Company had filed a motion to dismiss on January 27, 2005 which was taken off calendar due to the
23
remand. On January 28, 2005 a second plaintiff, Allen, filed a purported nationwide class action in Los Angeles Superior Court alleging identical claims. Plaintiff Stamm dismissed the Stamm case on September 2, 2005. An amended complaint in the Allen case was filed on October 24, 2005, addingadditional named plaintiffs and expanding the alleged class to include purchasers of the 20-inch AppleCinema Display and the 23-inch Apple Cinema HD Display. The amended complaint alleges that the displays have a purported defect that causes dimming of one-half of the screen, and that the Company misrepresented the quality of the displays and/or concealed the purported defect. Plaintiffs assert claimsunder California Business & Professions Code §17200 (unfair competition); California Business & Professions Code §17500 (false advertising) and the Consumer Legal Remedies Act. The amendedcomplaint seeks remedies including damages and equitable relief. On November 14, 2005, the Company filed an answer to the amended complaint as to the allegations regarding the 17-inch display and ademurrer/motion to strike as to the allegations regarding the 20-inch and 23-inch displays on the groundthat plaintiffs failed to allege that they purchased those displays. At a status conference on November 21, 2005, the Court ordered Plantiffs to amend their complaint. The Company’s demurrer is off calendar pending this amendment.
St-Germain v. Apple Canada, Inc. Plaintiff filed this case in Montreal, Quebec, Canada, on August 5, 2005, seeking authorization to institutea class action for the refund by the Company of the Canadian Private Copying Levy that was applied to theiPod purchase price in Quebec between December 12, 2003 and December 14, 2004 but later declaredinvalid by the Canadian Court. A class certification hearing is scheduled for January 13, 2006. The Company has already begun a refund program for this levy.
Teleshuttle Technologies, LLC and BTG International Inc. v. Microsoft and Apple Computer, Inc. Plaintiffs filed this case on July 20, 2004 in United States District Court for the Northern District of California alleging infringement of U.S. patent 6,557,054, entitled “Method and System for DistributingUpdates by Presenting Directory of Software Available for User Installation That is Not Already Installedon User Station.” Plaintiffs filed an amended complaint on September 7, 2004, adding a second patent, U.S. patent 6,769,009 entitled “Method and System for Selecting a Personalized Set of Information Channels.” Plaintiffs seek unspecified damages and other relief. The Company filed an answer on October 18, 2004, denying all material allegations and asserting numerous affirmative defenses. On August 22, 2005, the Company filed an amended answer to add charges of inequitable conduct. The case is in discovery. Markman briefing is completed. A technology tutorial and Markman hearing are tentativelyscheduled for January 13, 20, and 27, 2006.
Tiger Direct, Inc. v. Apple Computer, Inc. Plaintiff Tiger Direct, Inc. filed this trademark infringement action in the United States District Court forthe Southern District of Florida on April 26, 2005 alleging infringement of the word mark TIGER. Plaintiff claims to have a valid registration in the mark TIGER and alleges that the Company’s use of TIGER in reference to the latest version of Mac OS X infringes the mark allegedly owned by Plaintiff. Plaintiffattempted to obtain an ex parte preliminary injunction barring the Company’s use of the TIGER mark on April 27, 2005 but the motion was denied. Plaintiff served the Company on April 27, 2005 and again moved for a preliminary injunction. Plaintiff’s motion was heard on May 3, 2005. On May 11, 2005, the Courtdenied Plaintiff’s motion. The Company filed a response to the complaint on May 17, 2005, denying allmaterial allegations and asserting counterclaims for cancellation of certain marks registered to Tiger Direct. On June 10, 2005, Plaintiff filed an appeal, but subsequently withdrew it. Plaintiff filed a responseto the Company’s counterclaims. The parties have reached a settlement. Settlement of this matter did nothave a material effect on the Company’s financial position or results of operation.

24
Tse v. Apple Computer, Inc. et al. Plaintiff Ho Keung Tse filed this action against the Company and other defendants on August 5, 2005 inthe United States District Court for the District of Maryland alleging infringement by the Company of U.S. Patent 6,665,797 entitled “Protection of Software Again [sic] Against Unauthorized Use.” The complaintseeks unspecified damages and other relief. The Company filed an answer on October 31, 2005 denying all material allegations and asserting numerous affirmative defenses. On October 28, 2005, the Company andthe other defendants filed a motion to transfer the case to the Northern District of California.
Wimmer v. Apple Computer, Inc. (originally filed as Tomczak v. Apple Computer, Inc. on October 19, 2005 in the United States District Court for the Northern District of California, San Jose Division; amended complaint filed October 26, 2005); Moschella, et al., v. Apple Computer, Inc. (filed October 26, 2005 UnitedStates District Court for the Northern District of California, San Jose Division); Calado, et al. v. Apple Computer, Inc. (filed October 26, 2005, Los Angeles County Superior Court); Kahan, et al., v. AppleComputer, Inc. (filed October 31, 2005, United States District Court for the Southern District of NewYork); Jennings, et al., v. Apple Computer, Inc. (filed November 4, 2005, United States District Court forthe Northern District of California, San Jose Division).These federal and state court complaints allege that the Company’s iPod nano was defectively designed sothat it scratches excessively during normal use which renders the screen unreadable. The Wimmer and Moschella actions were brought on behalf of purported nationwide classes of iPod nano purchasers, withthe exception of California purchasers, and allege violations of the consumer protection, express and implied warranty statutes of each state covered by the putative class definition, as well as negligentmisrepresentation and unjust enrichment under the common laws of these jurisdictions. The Calado actionwas brought on behalf of a purported California class of iPod nano purchasers and asserts claims for alleged violation of California Business & Professions Code §17200 (unfair competition), CaliforniaBusiness & Professions Code §17500 (false advertising), the Consumer Legal Remedies Act, breaches of express and implied warranties, negligent misrepresentation and unjust enrichment. The Jennings actionwas filed on behalf of a purported class of all iPod nano purchasers outside of the United States, based upon alleged violations of the same California statutes as in the Calado complaint. The Kahan action was brought on behalf of a purported New York class of iPod nano purchasers and alleges claims under theNew York unfair competition law, breach of express warranty and unjust enrichment. The complaints seekdamages and various other remedies. The Company’s responses to these complaints are not yet due.
Two similar complaints, Carpentier v. Apple Canada, Inc., and Royer- Brennan v. Apple Computer, Inc. and Apple Canada, Inc. were filed in Montreal, Quebec, Canada, on October 27, 2005 and November 9, 2005, respectively, seeking authorization to institute a class action on behalf of iPod nano purchasers in Quebec.
Union Federale des Consummateurs—Que Choisir v. Apple Computer France S.A.R.L. and iTunes S.A.R.L.Plaintiff, a consumer association in France, filed this complaint on February 9, 2005 alleging that the entities above are violating consumer law by 1) omitting to mention that the iPod is allegedly not compatible with music from online music services other than the iTunes Music Store and that the music from the iTunes Music Store is only compatible with the iPod and 2) allegedly tying the sales of iPods to the iTunes Music Store and vice versa. Plaintiff seeks damages, injunctive relief and other relief. The first hearing on the case took place on May 24, 2005. The Company’s response to the complaint was served on November 8, 2005.
Item 4. Submission of Matters to a Vote of Security Holders
No matters were submitted to a vote of security holders during the fourth quarter of the Company’s fiscalyear ended September 24, 2005.

25
PART II
Item 5. Market for the Registrant’s Common Equity, Related Shareholder Matters and Issuer Purchases of Equity Securities
(a) Stock Market Information
The Company’s common stock is traded on the over-the-counter market and is quoted on the NASDAQNational Market under the symbol AAPL and on the Frankfurt Stock Exchange under the symbol APCD. In December 2004, the Company delisted its shares from trading on the Tokyo Stock Exchange. As of November 18, 2005, there were 28,333 shareholders of record.
The Company did not pay cash dividends in either 2005 or 2004. The Company anticipates that, for theforeseeable future, it will retain any earnings for use in the operation of its business. The price range pershare of common stock presented below represents the highest and lowest closing prices for the Company’s common stock on the NASDAQ National Market during each quarter.
On February 28, 2005, the Company effected a two-for-one stock split to shareholders of record as of February 18, 2005. All share and per share information has been retroactively adjusted to reflect the stocksplit.
Fourth Quarter Third Quarter Second Quarter First Quarter Fiscal 2005 price range per common
share . . . . . . . . . . . . . . . . . . . . . . . . . . . . . . $ 53.20-$36.37 $ 43.74-$34.13 $ 45.06-$31.58 $ 34.22-$18.65
Fiscal 2004 price range per commonshare . . . . . . . . . . . . . . . . . . . . . . . . . . . . . . $ 19.00-$14.57 $ 16.85-$12.89 $ 13.84-$10.57 $ 12.41-$ 9.85
(b) Related Shareholder Matters
None.
(c) Issuer Purchases of Equity Securities
None.

26
Item 6. Selected Financial Data
The following selected financial information has been derived from the audited consolidated financialstatements. The information set forth below is not necessarily indicative of results of future operations, andshould be read in conjunction with Item 7, “Management’s Discussion and Analysis of Financial Conditionand Results of Operations” and the consolidated financial statements and related notes thereto included inItem 8 of this Form 10-K in order to fully understand factors that may affect the comparability of the information presented below.
Five fiscal years ended September 24, 2005(In millions, except share and per share amounts) 2005 2004 2003 2002 2001Net sales . . . . . . . . . . . . . . . . . . . . . . . . . . . . . . . . . . . $ 13,931 $ 8,279 $ 6,207 $ 5,742 $ 5,363Net income (loss) . . . . . . . . . . . . . . . . . . . . . . . . . . . $ 1,335 $ 276 $ 69 $ 65 $ (25)Earnings (loss) per common share:
Basic . . . . . . . . . . . . . . . . . . . . . . . . . . . . . . . . . . . . $ 1.65 $ 0.37 $ 0.10 $ 0.09 $ (0.04)Diluted . . . . . . . . . . . . . . . . . . . . . . . . . . . . . . . . . . $ 1.56 $ 0.36 $ 0.09 $ 0.09 $ (0.04)
Cash dividends declared per common share . . . . $ — $ — $ — $ — $ —Shares used in computing earnings (loss) per
share (in thousands): Basic . . . . . . . . . . . . . . . . . . . . . . . . . . . . . . . . . . . . 808,439 743,180 721,262 710,044 691,226Diluted . . . . . . . . . . . . . . . . . . . . . . . . . . . . . . . . . . 856,780 774,622 726,932 723,570 691,226
Cash, cash equivalents, and short-term investments. . . . . . . . . . . . . . . . . . . . . . . . . . . . . . . $ 8,261 $ 5,464 $ 4,566 $ 4,337 $ 4,336
Total assets . . . . . . . . . . . . . . . . . . . . . . . . . . . . . . . . . $ 11,551 $ 8,050 $ 6,815 $ 6,298 $ 6,021Long-term debt (including current maturities) . . $ — $ — $ 304 $ 316 $ 317Total liabilities . . . . . . . . . . . . . . . . . . . . . . . . . . . . . . $ 4,085 $ 2,974 $ 2,592 $ 2,203 $ 2,101Shareholders’ equity . . . . . . . . . . . . . . . . . . . . . . . . . $ 7,466 $ 5,076 $ 4,223 $ 4,095 $ 3,920
Net gains before taxes related to the Company’s non-current debt and equity investments of $4 million,$10 million, and $75 million were recognized in 2004, 2003, and 2001, respectively. A net loss before taxes related to the Company’s non-current debt and equity investments of $42 million was recognized in 2002. In 2002, the Company acquired Emagic resulting in a charge of approximately $1 million for acquiredin-process technologies with no alternative future use. The Company recognized a similar charge of $11 million in 2001 related to its acquisition of PowerSchool. Net charges related to Company restructuring actions of $23 million, $26 million, and $30 million were recognized in 2004, 2003, and 2002, respectively. In 2003, settlement of the Company’s forward stock purchase agreement resulted in a gain of$6 million. Net income during 2005 benefited by $81 million from the reversal of certain tax contingencyreserves and adjustments to net deferred tax assets, including reductions to valuation allowances. Favorable cumulative-effect type adjustments from the adoption of new accounting standards, net of taxes,of $1 million and $12 million were recognized in 2003 and 2001, respectively.
Item 7. Management’s Discussion and Analysis of Financial Condition and Results of Operations
This section and other parts of this Form 10-K contain forward-looking statements that involve risks and uncertainties. Forward-looking statements can also be identified by words such as “anticipates,” “expects,”“believes,” “plans,” “predicts,” and similar terms. Forward-looking statements are not guarantees of future performance and the Company’s actual results may differ significantly from the results discussed in the forward-looking statements. Factors that might cause such differences include, but are not limited to, thosediscussed in the subsection entitled “Factors That May Affect Future Results and Financial Condition” below.The following discussion should be read in conjunction with the consolidated financial statements and notes thereto included in Item 8 of this Form 10-K. All information presented herein is based on the Company’s fiscal

27
calendar. The Company assumes no obligation to revise or update any forward-looking statements for any reason, except as required by law.
Executive OverviewThe Company designs, manufactures, and markets personal computers and related software, services, peripherals, and networking solutions. The Company also designs, develops, and markets a line of portable digital music players along with related accessories and services including the online distribution ofthird-party music, audio books, music videos, short films, and television shows. The Company’s products and services include the Macintosh line of desktop and notebook computers, the iPod digital music player,the Xserve G5 server and Xserve RAID storage products, a portfolio of consumer and professional software applications, the Mac OS X operating system, the iTunes Music Store, a portfolio of peripherals that support and enhance the Macintosh and iPod product lines, and a variety of other service and supportofferings. The Company sells its products worldwide through its online stores, its own retail stores, its direct sales force, and third-party wholesalers, resellers, and value added resellers. In addition, theCompany sells a variety of third-party Macintosh compatible products, including computer printers and printing supplies, storage devices, computer memory, digital camcorders and still cameras, personal digital assistants, and various other computing products and supplies through its online and retail stores. The Company sells to education, consumer, creative professional, business, and government customers. Afurther description of the Company’s products may be found in Part I, Item 1 of this document under theheading “Business.”
The Company’s business strategy leverages its ability, through the design and development of its ownoperating system, hardware, and many software applications and technologies, to bring to its customers around the world compelling new products and solutions with superior ease-of-use, seamless integration,and innovative industrial design.
The Company participates in several highly competitive markets, including personal computers with its Macintosh line of computers, consumer electronics with its iPod line of digital music players, and distribution of third-party digital content through its online iTunes Music Store. While the Company is widely recognized as an innovator in the personal computer and consumer electronic markets as well as aleader in the emerging market for distribution of digital content, these are all highly competitive markets that are subject to aggressive pricing and increased competition. To remain competitive, the Company believes that increased investment in research and development (R&D) and marketing and advertising is necessary to maintain and extend its position in the markets where it competes. The Company’s R&D spending is focused on delivering timely updates and enhancements to its existing line of personal computers, displays, operating systems, software applications, and portable music players; developing new digital lifestyle consumer and professional software applications; and investing in new product areas such as rack-mount servers, RAID storage systems, and wireless technologies. The Company also believesinvestment in marketing and advertising programs is critical to increasing product and brand awareness.
In June 2005, the Company announced its plan to begin using Intel microprocessors in its Macintosh computers. The Company plans to begin shipping certain models with Intel microprocessors by June 2006 and to complete the transition of all of its Macintosh computers to Intel microprocessors by the end of calendar year 2007. There are potential risks and uncertainties that may occur during this transition, which are further discussed under the heading “Factors That May Affect Future Results and Financial Condition.”
The Company utilizes a variety of direct and indirect distribution channels. The Company believes thatsales of its innovative and differentiated products are enhanced by knowledgeable salespersons who can convey the value of the hardware, software, and peripheral integration, demonstrate the unique digitallifestyle solutions that are available only on Macintosh computers, and demonstrate the compatibility of the Macintosh with the Windows platform and networks. The Company further believes that providing a

28
high-quality sales and after-sales support experience is critical to attracting and retaining customers. To ensure a high-quality buying experience for its products in which service and education are emphasized, the Company has expanded and improved its distribution capabilities by opening its own retail stores in the U.S. and internationally. The Company had 124 stores open as of September 24, 2005.
The Company also staffs selected third-party stores with the Company’s own employees to improve thebuying experience through reseller channels. The Company has deployed Apple employees and contractors in reseller locations around the world including the U.S., Europe, Japan, and Australia. The Company also sells to customers directly through its online stores around the world.
To improve access to the iPod product line, the Company has significantly expanded the number ofdistribution points where iPods are sold. The iPod product line can be purchased in certain departmentstores, member-only warehouse stores, large retail chains, and specialty retail stores, as well as through the channels listed above.
Critical Accounting Policies and Estimates The preparation of financial statements and related disclosures in conformity with U.S. generally acceptedaccounting principles and the Company’s discussion and analysis of its financial condition and results of operations require the Company’s management to make judgments, assumptions, and estimates that affect the amounts reported in its consolidated financial statements and accompanying notes. Note 1 of the Notesto Consolidated Financial Statements of this Form 10-K describes the significant accounting policies and methods used in the preparation of the Company’s consolidated financial statements. Management bases its estimates on historical experience and on various other assumptions it believes to be reasonable underthe circumstances, the results of which form the basis for making judgments about the carrying values ofassets and liabilities. Actual results may differ from these estimates and such differences may be material.
Management believes the Company’s critical accounting policies and estimates are those related to revenue recognition, allowance for doubtful accounts, inventory valuation and inventory purchasecommitments, warranty costs, and income taxes. Management believes these policies to be critical because they are both important to the portrayal of the Company’s financial condition and results, and they requiremanagement to make judgments and estimates about matters that are inherently uncertain. TheCompany’s senior management has reviewed these critical accounting policies and related disclosures withthe Audit and Finance Committee of the Company’s Board of Directors.
Revenue Recognition Net sales consist primarily of revenue from the sale of hardware, software, peripherals, digital content, and service and support contracts. The Company recognizes revenue pursuant to applicable accountingstandards, including Statement of Position (SOP) No. 97-2, Software Revenue Recognition, as amended, and Securities and Exchange Commission (SEC) Staff Accounting Bulletin (SAB) No. 104, RevenueRecognition.
The Company recognizes revenue when persuasive evidence of an arrangement exists, delivery has occurred, the sales price is fixed or determinable, and collection is probable. Product is considereddelivered to the customer once it has been shipped, and title and risk of loss have been transferred. For most of the Company’s product sales, these criteria are met at the time the product is shipped. For onlinesales to individuals, for some sales to education customers in the U.S., and for certain other sales, the Company defers revenue until the customer receives the product because the Company legally retains aportion of the risk of loss on these sales during transit. If at the outset of an arrangement the Companydetermines the arrangement fee is not, or is presumed not to be, fixed or determinable, revenue is deferred and subsequently recognized as amounts become due and payable.

29
The Company records reductions to revenue for estimated commitments related to price protection and for customer incentive programs, including reseller and end-user rebates, and other sales programs and volume-based incentives. The estimated cost of these programs is accrued as a reduction to revenue in the period the Company has sold the product and committed to the relevant program. The Company also records reductions to revenue for expected future product returns based on the Company’s historicalexperience. Future market conditions and product transitions may require the Company to increasecustomer incentive programs and incur incremental price protection obligations that could result inadditional reductions to revenue at the time such programs are offered. Additionally, certain customer incentive programs require management to estimate the number of customers who will actually redeem theincentive based on historical experience and the specific terms and conditions of particular incentive programs. If a greater than estimated proportion of customers redeem such incentives, the Companywould be required to record additional reductions to revenue, which could have a material adverse impacton the Company’s results of operations.
Allowance for Doubtful Accounts The Company distributes its products through third-party resellers and directly to certain education, consumer, and commercial customers. The Company generally does not require collateral from its customers. However, when possible the Company does attempt to limit credit risk on trade receivables with credit insurance for certain customers in Latin America, Europe, and Asia and by arranging withthird-party financing companies to provide flooring arrangements and other loan and lease programs tothe Company’s direct customers. These credit-financing arrangements are directly between the third-partyfinancing company and the end customer. As such, the Company generally does not assume any recourseor credit risk sharing related to any of these arrangements. However, considerable trade receivables thatare not covered by collateral, third-party flooring arrangements, or credit insurance are outstanding withthe Company’s distribution and retail channel partners.
The allowance for doubtful accounts is based on management’s assessment of the collectibility of specificcustomer accounts and includes consideration of the credit worthiness and financial condition of thosespecific customers. The Company records an allowance to reduce the specific receivables to the amountthat is reasonably believed to be collectible. The Company also records an allowance for all other trade receivables based on multiple factors including historical experience with bad debts, the general economicenvironment, the financial condition of the Company’s distribution channels, and the aging of suchreceivables. If there is a deterioration of a major customer’s financial condition, if the Company becomes aware of additional information related to the credit worthiness of a major customer, or if future actual default rates on trade receivables in general differ from those currently anticipated, the Company mayhave to adjust its allowance for doubtful accounts, which would affect earnings in the period theadjustments are made.
Inventory Valuation and Inventory Purchase CommitmentsThe Company must order components for its products and build inventory in advance of product shipments. The Company records a write-down for inventories of components and products, including third-party products held for resale, which have become obsolete or are in excess of anticipated demand or net realizable value. The Company performs a detailed review of inventory each fiscal quarter thatconsiders multiple factors including demand forecasts, product life cycle status, product development plans, current sales levels, and component cost trends. The personal computer and consumer electronicindustries are subject to a rapid and unpredictable pace of product and component obsolescence and demand changes. If future demand or market conditions for the Company’s products are less favorable than forecasted or if unforeseen technological changes negatively impact the utility of component inventory, the Company may be required to record additional write-downs which would negatively affectgross margins in the period when the write-downs are recorded.
30
The Company accrues necessary reserves for cancellation fees related to component orders that have beencancelled. Consistent with industry practice, the Company acquires components through a combination ofpurchase orders, supplier contracts, and open orders based on projected demand information. Thesecommitments typically cover the Company’s requirements for periods ranging from 30 to 150 days. If there is an abrupt and substantial decline in demand for one or more of the Company’s products or an unanticipatedchange in technological requirements for any of the Company’s products, the Company may be required torecord additional reserves for cancellation fees that would negatively affect gross margins in the period when the cancellation fees are identified.
Warranty Costs The Company provides currently for the estimated cost for product warranties at the time the relatedrevenue is recognized based on historical and projected warranty claim rates, historical and projectedcost-per-claim, and knowledge of specific product failures that are outside of the Company’s typicalexperience. Each quarter, the Company reevaluates its estimates to assess the adequacy of its recordedwarranty liabilities considering the size of the installed base of products subject to warranty protection, andadjusts the amounts as necessary. If actual product failure rates or repair costs differ from estimates,revisions to the estimated warranty liability would be required and could negatively affect the Company’s results of operations.
Income Taxes The Company records a tax provision for the anticipated tax consequences of the reported results of operations. In accordance with Statement of Financial Accounting Standards (SFAS) No. 109, Accounting for Income Taxes, the provision for income taxes is computed using the asset and liability method, under which deferred tax assets and liabilities are recognized for the expected future tax consequences of temporary differences between the financial reporting and tax bases of assets and liabilities, and foroperating losses and tax credit carryforwards. Deferred tax assets and liabilities are measured using thecurrently enacted tax rates that apply to taxable income in effect for the years in which those tax assets areexpected to be realized or settled. The Company records a valuation allowance to reduce deferred tax assets to the amount that is believed more likely than not to be realized. The Company is currently evaluating the repatriation provisions of the American Jobs Creation Act of 2004, which, if implementedby the Company, would affect the Company’s tax provision and deferred tax assets and liabilities.
Management believes it is more likely than not that forecasted income, including income that may be generated as a result of certain tax planning strategies, together with the tax effects of the deferred tax liabilities, will be sufficient to fully recover the remaining deferred tax assets. In the event that all or part of the net deferred tax assets are determined not to be realizable in the future, an adjustment to the valuation allowance would be charged to earnings in the period such determination is made. Similarly, if theCompany subsequently realizes deferred tax assets that were previously determined to be unrealizable, therespective valuation allowance would be reversed, resulting in a positive adjustment to earnings or adecrease in goodwill in the period such determination is made. In addition, the calculation of tax liabilitiesinvolves significant judgment in estimating the impact of uncertainties in the application of complex taxlaws. Resolution of these uncertainties in a manner inconsistent with management’s expectations couldhave a material impact on the Company’s results of operations and financial position.

31
Net Sales Net sales and Macintosh unit sales by operating segment and net sales and unit sales by product follow (net sales in millions and unit sales in thousands):
September 24,2005 Change
September 25,2004 Change
September 27,2003
Net Sales by Operating Segment:Americas net sales . . . . . . . . . . . . . . . . . . . . . . . $ 6,590 64 % $ 4,019 26 % $ 3,181Europe net sales . . . . . . . . . . . . . . . . . . . . . . . . . 3,073 71 % 1,799 37 % 1,309Japan net sales . . . . . . . . . . . . . . . . . . . . . . . . . . 920 36 % 677 (3)% 698Retail net sales . . . . . . . . . . . . . . . . . . . . . . . . . . 2,350 98 % 1,185 91 % 621Other Segments net sales (a) . . . . . . . . . . . . . . . 998 67 % 599 51 % 398
Total net sales . . . . . . . . . . . . . . . . . . . . . . . . $ 13,931 68 % $ 8,279 33 % $ 6,207
Unit Sales by Operating Segment:Americas Macintosh unit sales . . . . . . . . . . . . . . 2,184 30 % 1,682 4 % 1,620Europe Macintosh unit sales . . . . . . . . . . . . . . . 1,138 47 % 773 13 % 684Japan Macintosh unit sales . . . . . . . . . . . . . . . . . 313 8 % 291 (14)% 339Retail Macintosh unit sales . . . . . . . . . . . . . . . . 609 94 % 314 68 % 187Other Segments Macintosh unit sales (a). . . . . . 290 26 % 230 26 % 182
Total Macintosh unit sales . . . . . . . . . . . . . . . 4,534 38 % 3,290 9 % 3,012
Net Sales by Product:Desktops (b) . . . . . . . . . . . . . . . . . . . . . . . . . . . . $ 3,436 45 % $ 2,373 (4)% $ 2,475Portables (c) . . . . . . . . . . . . . . . . . . . . . . . . . . . . 2,839 11 % 2,550 26 % 2,016
Total Macintosh net sales . . . . . . . . . . . . . . . 6,275 27 % 4,923 10 % 4,491
iPod. . . . . . . . . . . . . . . . . . . . . . . . . . . . . . . . . . . 4,540 248 % 1,306 279 % 345Other music related products and services (d) . . 899 223 % 278 672 % 36 Peripherals and other hardware (e) . . . . . . . . . . 1,126 18 % 951 38 % 691Software, service, and other sales (f) . . . . . . . . . 1,091 33 % 821 27 % 644
Total net sales . . . . . . . . . . . . . . . . . . . . . . . . $ 13,931 68 % $ 8,279 33 % $ 6,207
Unit Sales by Product:Desktops (b) . . . . . . . . . . . . . . . . . . . . . . . . . . . . 2,520 55 % 1,625 (8)% 1,761Portables (c) . . . . . . . . . . . . . . . . . . . . . . . . . . . . 2,014 21 % 1,665 33 % 1,251
Total Macintosh unit sales . . . . . . . . . . . . . . . 4,534 38 % 3,290 9 % 3,012
Net sales per Macintosh unit sold (g) . . . . . . . . . $ 1,384 (7)% $1,496 0 % $1,491
iPod unit sales. . . . . . . . . . . . . . . . . . . . . . . . . . . 22,497 409 % 4,416 370 % 939
Net sales per iPod unit sold (h) . . . . . . . . . . . . . $ 202 (32)% $ 296 (19)% $ 367
Notes:(a) Other Segments include Asia Pacific and FileMaker.
(b) Includes iMac, eMac, Mac mini, Power Mac and Xserve product lines.
(c) Includes iBook and PowerBook product lines.
(d) Consists of iTunes Music Store sales, iPod services, and Apple-branded and third-party iPod accessories.
(e) Includes sales of Apple-branded and third-party displays, wireless connectivity and networking solutions, and other hardwareaccessories.
(f) Includes sales of Apple-branded operating system, application software, third-party software, AppleCare, and Internet services.
(g) Derived by dividing total Macintosh net sales by total Macintosh unit sales.
(h) Derived by dividing total iPod net sales by total iPod unit sales.

32
Fiscal Year 2005 versus 2004 During 2005, net sales increased 68% or $5.7 billion from 2004. Several factors contributed favorably to netsales during 2005:
• Net sales of iPods rose $3.2 billion or 248% during 2005 compared to 2004. Unit sales of iPodstotaled 22.5 million in 2005, which represents an increase of 409% from the 4.4 million iPod units sold in 2004. Strong sales of iPods during 2005 continued to be experienced in all of the Company’s operating segments and was driven by strong demand for the iPod shuffle introduced inJanuary 2005, the release of an updated version of the iPod mini in February 2005, the release of theiPod nano in September 2005, and expansion of the iPod’s distribution network. Net sales per iPodunit sold decreased 32% primarily due to the introduction of the lower priced iPod shuffle inJanuary 2005 and iPod mini pricing reductions in February 2005. From the introduction of the iPod in 2002 through 2005, the Company has sold approximately 28 million iPods.
• Other music related products and services consists of sales associated with the iTunes Music Storeand iPod services and accessories. Net sales of other music related products and services increased$621 million or 223% during 2005 compared to 2004. The Company has experienced strong growthin sales of iPod services and accessories consistent with the increase in overall iPod unit sales for2005. The increased sales from the iTunes Music Store is primarily due to substantial growth of net sales in the U.S. and expansion in Europe, Canada, and Japan.
• Total Macintosh net sales increased $1.4 billion or 27% during 2005 compared to 2004. Unit salesof Macintosh systems increased 1.2 million units or 38% during 2005 compared to 2004. Theincreases in Macintosh net sales and unit sales relate primarily to strong demand for the Company’s desktop products, which was experienced in all of the Company’s operating segments. The Company believes that the success of the iPod is having a positive impact on Macintosh net sales by introducing new customers to the Company’s other products. Desktop demand was stimulated in 2005 due to the new iMac G5 and the introduction of the Mac mini in January 2005. Net sales and unit sales of desktop products increased 45% and 55%, respectively, during 2005 compared to 2004.Macintosh net sales and unit sales also include sales of the Company’s portable products, which increased 11% and 21%, respectively, compared to 2004.
Net sales per Macintosh unit sold decreased 7% on a year-over-year basis. The decrease was theresult of changes in the overall unit mix towards relatively lower-priced consumer products, specifically the impact of the Mac mini product, and desktop and portable price reductions. This decrease was partially offset by an increase in the proportion of direct sales.
• The Retail segment’s net sales grew 98% to $2.4 billion during 2005 compared to 2004. This increase is largely attributable to the increase in total stores from 86 at the end of 2004 to 124 at the end of 2005, as well as 44% year-over-year increase in average revenue per store. While the Company’s customers in areas where the Retail segment has opened stores may elect to purchasefrom the Retail segment stores rather than the Company’s preexisting sales channels in the U.S., Canada, Japan, and the U.K., the Company believes that a substantial portion of the Retailsegment’s net sales is incremental to the Company’s total net sales. See additional comments belowrelated to the Retail segment under the heading “Segment Operating Performance.”
• Net sales of peripherals and other hardware rose by 18% during 2005 compared to 2004 primarilydue to an increase in net sales of displays and other computer accessories. Net sales of other hardware include AirPort cards and base stations, Xserve RAID storage, iSight digital video cameras, and third-party hardware products.
• The Company’s U.S. education channel experienced year-over-year growth in both net sales and unit sales of approximately 21% for 2005. The increase in U.S. education net sales for 2005 relates

33
primarily to a 32% year-over-year increase in higher education net sales due to increased iMac shipments, portable system shipments, and online sales. The Company also experienced 11% growth in K-12 net sales due to increased iBook sales and education 1:1 sales. While net sales to theK-12 market were slightly higher during 2005 than 2004, the Company believes this marketcontinues to be subject to budget constraints and competitive pressures.
• Net sales of software, service and other sales rose $270 million or 33% during 2005 compared to2004. This growth was primarily attributable to increased net sales in AppleCare Protection Plan(APP) extended service and support contracts, driven primarily by higher associated Macintosh computer sales. Additionally, the Company experienced increases in net sales of .Mac Internetservice, professional and consumer applications, third-party software, and Mac OS X that wasprimarily attributable to the release of version 10.4 Tiger in April 2005.
Fiscal Year 2004 versus 2003 During 2004, net sales increased 33% or $2.1 billion from 2003. Several factors contributed favorably to netsales during 2004:
• Net sales of Macintosh systems increased $432 million or 10% during 2004 compared to 2003 while net sales per Macintosh unit sold remained relatively flat on a year-over-year basis. Unit sales ofMacintosh systems increased 278,000 units or 9% during 2004 compared to 2003. These increases innet sales and unit sales were a result of strong demand for all of the Company’s Macintosh systems, except the iMac. The Company’s portable systems, consisting of the PowerBook and iBook, produced the strongest revenue and unit growth during 2004 compared to 2003 of approximately26% and 33%, respectively. Unit sales of portable systems accounted for 51% of all Macintoshsystems sold during 2004 compared to only 42% during 2003. The Company believes that theseresults reflected an overall trend in the industry towards portable systems. Performance of the Company’s Power Macintosh systems also yielded positive results in 2004 over 2003, including a 15% and 6% increase in net sales and unit sales, respectively. The increase in Power Macintoshsales in 2004 was due primarily to the introduction of the Power Mac G5, which began shipping at the end of 2003. Although Power Macintosh sales increased from 2003, sales of this product were constrained in the second half of 2004 as a result of manufacturing problems at IBM, the Company’s sole supplier of the PowerPC G5 processor.
• Net sales of iPods rose $961 million or 279% during 2004 compared to 2003. Unit sales of iPodstotaled 4.4 million in 2004, which represents an increase of 370% from the 939,000 iPod units soldin 2003. Strong demand for the iPods during 2004 were experienced in all of the Company’soperating segments and was driven by enhancements to the iPod, the introduction of the iPod mini, increased expansion of the Company’s iPod distribution network, and continued success of theiTunes Music Store due largely to making it available to both Macintosh and Windows users in the U.S., U.K., France, and Germany.
• The Retail segment’s net sales grew 91% to $1.2 billion during 2004 compared to 2003. This increase was largely attributable to the increase in total stores from 65 at the end of 2003 to 86 at the end of 2004, as well as a 36% year-over-year increase in average revenue per store. While the Company’s customers in areas where the Retail segment has opened stores may have elected topurchase from the Retail segment stores rather than the Company’s preexisting sales channels in the U.S. and Japan, the Company believes that a substantial portion of the Retail segment’s netsales is incremental to the Company’s total net sales. See additional comments below related to theRetail segment under the heading “Segment Operating Performance.”
• Net sales of peripherals and other hardware rose by 38% during 2004 compared to 2003 primarilydue to an increase in net sales of displays and other computer accessories. Net sales of other

34
computer accessories include AirPort cards and base stations, iSight digital video cameras, and third-party hardware products. The increase in total net sales of peripherals and other hardware was related to the overall increase in Macintosh unit sales and the introduction of new and updated peripheral products and was experienced predominantly by the Company’s Americas, Europe, and Retail segments.
• Net sales of other music related products and services increased $242 million or 672% during 2004compared to 2003. The Company experienced strong growth in sales of iPod services andaccessories consistent with the increase in overall iPod unit sales for 2004. The increased sales from the iTunes Music Store, which was originally introduced in April 2003, was primarily due to makingthe service available for Windows in October 2003 and the introduction of the service in the U.K., France, and Germany in June 2004.
• Net sales of software rose $140 million or 39% during 2004 compared to 2003 due primarily tohigher net sales of the Company’s Apple-branded software and in particular, higher net sales of the Company’s operating system software, including Mac OS X version 10.3 “Panther,” which wasreleased in October 2003. Net sales of Panther accounted for approximately $74 million or over50% of the increase in software net sales for 2004 compared to 2003.
• The Company’s U.S. education channel experienced year-over-year growth in net sales ofapproximately 19% for 2004 compared to 2003. Unit sales also increased by 10% during 2004compared to 2003. The increase in U.S. education net sales for 2004 related primarily to a 40% year-over-year increase in higher education net sales and to a lesser extent the Company’s 3%growth in K-12 net sales.
• Service and other sales increased $37 million or 13% during 2004 compared to 2003. Theseincreases were the result of significant year-over-year increases in net sales associated with APPextended maintenance and support services, as well as increased net sales associated with the Company’s .Mac Internet service. Increased net sales associated with APP were primarily the result of higher Macintosh unit sales and higher attach rates on APP over the last several years.
Offsetting the favorable factors discussed above, the Company’s net sales during 2004 were negativelyimpacted by the following:
• Net sales and unit sales of iMac systems were down 23% and 16%, respectively, during 2004 versus2003. The decrease in iMac net sales and unit sales was largely due to the delay in the introductionof the new iMac, based on the PowerPC G5 processor, primarily as a result of manufacturingproblems experienced by IBM. The delays in the new iMac resulted in the depletion of inventory of the old iMac flat panel prior to availability of the new iMac G5. The old flat panel iMac form factor, which was available during most of 2004, was nearly 3 years old by the time the new iMac G5 beganshipping in September 2004 and had experienced declines in sales as a result of the age of this product. The Company believes that sales of iMac systems have also declined due to a shift in consumer preference to portable systems and desktop models from competitors with price points below $1,000.
• Net sales and unit sales in the Company’s Japan segment decreased 3% and 14%, respectively,during 2004 versus 2003. The Company believes these declines related to a shift in sales from the Japan segment to the Retail segment as a result of the Tokyo and Osaka store openings in 2004. Declines in net sales in Japan may have also related to delays in computer upgrades by certainprofessional and creative customers pending release in Japan of certain Mac OS X native applications, such as Quark Xpress 6, which did not become available until September 2004. Whensales from the Japan retail stores are included in the results for the Japan segment, the combinedrevenue in Japan resulted in a 3% year-over-year increase in 2004 as compared to 2003. See

35
additional comments below related to the Japan segment under the heading “Segment OperatingPerformance.”
Segment Operating PerformanceThe Company manages its business primarily on a geographic basis. The Company’s reportable operating segments are comprised of the Americas, Europe, Japan, and Retail. The Americas, Europe, and Japanreportable segments do not include activities related to the Retail segment. The Americas segmentincludes both North and South America. The Europe segment includes European countries as well as theMiddle East and Africa. The Retail segment operated Apple-owned retail stores in the U.S., Canada, Japan, and the U.K. during 2005. Each reportable geographic operating segment provides similar hardware and software products and similar services. Further information regarding the Company’s operating segments may be found in Item 8 of this Form 10-K in the Notes to Consolidated FinancialStatements at Note 11, “Segment Information and Geographic Data.”
Americas During 2005, net sales in the Americas segment grew 64% or $2.6 billion compared to 2004. The increase in net sales during 2005 was primarily attributable to the significant year-over-year increase in iPod sales,sales of other music related products and services, and strong sales of desktop and portable Macintosh systems. This increase was partially offset by a shift in sales to the Retail segment, which had 117 stores inthe U.S. and Canada as of the end of 2005. Macintosh unit sales also increased by 30% in 2005 comparedto 2004, driven primarily by strong sales of desktop systems largely attributable to strong sales from the new iMac, which began shipping in September 2004, and the Mac mini, which was introduced in January 2005. During 2005 and 2004, the Americas segment represented approximately 47% and 49%,respectively, of the Company’s total net sales and represented approximately 48% and 51%, respectively,of total Macintosh unit sales. As noted above, the Company experienced an increase in both U.S. education channel net sales and unit sales of 21% for 2005 compared to 2004. Strength in higher education sales related primarily to strong iMac shipments, portable system shipments, and online sales. This strength drove year-over-year growth in net sales of 32% for the higher education channel during 2005. Despite challenges in the K-12 market from continued budget constraints and competitive pressures, the Company’s K-12 net sales grew year-over-year by 11% during 2005 due to increased iBook sales and 1:1education sales.
During 2004, net sales in the Americas segment grew 26% or $838 million compared to 2003. The increase in net sales during 2004 was primarily attributable to the significant year-over-year increase in iPod sales aswell as strong sales of peripherals, software, and services. This increase was partially offset by a shift insales to the Retail segment, which had 84 stores in the U.S. as of the end of 2004. Macintosh unit sales also increased by 4% in 2004 compared to 2003, driven primarily by strong sales of portable and Power Macintosh systems, partially offset by weakness in iMac sales. During 2004 and 2003, the Americassegment represented approximately 49% and 51%, respectively, of the Company’s total net sales and represented approximately 51% and 54%, respectively, of total Macintosh unit sales. The Companyexperienced an increase in U.S. education channel net sales of 19% for 2004 compared to 2003. StrongU.S. education net sales for 2004 related primarily to strength in higher education net sales that resulted from a successful back-to-school selling season with strong demand for the Company’s portables. This strength drove year-over-year growth in net sales of 40% for the higher education channel during 2004. The Company’s K-12 net sales grew year-over-year by 3% during 2004, despite the challenges in the K-12 market from continued budget constraints and increased competition.
Europe During 2005, net sales in the Europe segment grew $1.3 billion or 71% from 2004. Total Macintosh unitsales in Europe also experienced growth during the current year by increasing 47% in 2005 compared to

36
2004. Consistent with the Americas segment, Europe experienced strong net sales of desktop products, iPod, other music related products and services, and software and service sales. Demand in Europe during 2005 was particularly strong for the Company’s desktop computers, which experienced a year-over-year increase of 56%. Similar to the results of the Company’s other segments, net sales of iPods, peripheralsand software were strong in 2005.
Net sales in Europe rebounded in 2004 increasing $490 million or 37% from 2003. Total Macintosh unit sales in Europe also experienced growth in 2004 by increasing 13% compared to 2003. Consistent with theAmericas segment, Europe experienced strong net sales across all product lines, except the iMac systems.Demand in Europe during 2004 was particularly strong for the Company’s Power Macintosh systems and portable Macintosh systems, which experienced year-over-year increases of 29% and 42%, respectively. Similar to the results of the Company’s other segments, net sales of iPods, peripherals and software were strong in 2004 over 2003.
Japan Japan’s net sales and Macintosh unit sales were up 36% and 8%, respectively, during 2005 compared to2004. Japan experienced increased net sales in desktop products, iPod, and other music related products and services. Desktop net sales and unit sales increased by 31% and 41%, respectively, and iPod sales increased by 220% during 2005 compared to 2004. The overall increase in net sales was partially offset by adecline in portable system net sales during 2005 compared to 2004, which the Company believes might be attributable to a shift in sales from portables to the new iMac G5 and Mac mini, and a shift to the Retailsegment as a result of opening two additional stores in Japan during 2005.
Japan’s net sales and Macintosh unit sales were down 3% and 14%, respectively, during 2004 compared to 2003, which lagged behind all of the Company’s other operating segments. These decreases in net sales and unit sales were believed to be attributable in part to a shift in sales from the Japan segment to the Retailsegment as a result of the opening of two stores in Japan in 2004. In addition, such decreases may have been related to delayed computer system upgrades by some professional and creative customers who were awaiting the release of Quark XPress 6 for Mac OS X, which did not occur until September 2004. The decrease in net sales was partially offset by strong iPod and iBook sales during 2004 compared to 2003.
Retail The Company opened 38 new retail stores during 2005, including 6 international stores in the U.K, Japan,and Canada, bringing the total number of open stores to 124 as of September 24, 2005. This compares to86 open stores as of September 25, 2004 and 65 open stores as of September 27, 2003.
Net sales of the Retail segment grew to $2.4 billion during 2005 from $1.2 billion and $621 million in 2004and 2003, respectively. The increases in net sales during both 2005 and 2004 reflect the impact of new storeopenings for each year, including the opening of 38 new stores in 2005 and 21 new stores in 2004. An increase in average revenue per store also contributed to the segment’s strong sales in 2005. With anaverage of 105 stores open during 2005, the Retail segment achieved annualized revenue per store of approximately $22.4 million, as compared to $15.6 million in 2004 with a 76 store average, and $11.5million in 2003 with a 54 store average.
As measured by the Company’s operating segment reporting, the Retail segment reported operating income of $151 million during 2005 as compared to operating income of $39 million during 2004 and an operating loss of $5 million during 2003. This improvement is primarily attributable to the segment’s year-over-year increase in average revenue per store, the impact of opening new stores, and the segment’s year-over-year increase in net sales, which resulted in higher leverage on occupancy, depreciation, and other fixed costs.

37
Expansion of the Retail segment has required and will continue to require a substantial investment in fixed assets and related infrastructure, operating lease commitments, personnel, and other operating expenses. Capital expenditures associated with the Retail segment were $132 million in 2005, bringing the totalcapital expenditures since inception of the Retail segment to approximately $529 million. As of September 24, 2005, the Retail segment had approximately 3,673 employees and had outstanding operating lease commitments associated with retail store space and related facilities of approximately $606 million. The Company would incur substantial costs should it choose to terminate its Retail segment orclose individual stores. Such costs could adversely affect the Company’s results of operations and financial condition.
Gross Margin Gross margin for each of the last three fiscal years are as follows (in millions, except gross marginpercentages):
September 24,2005
September 25, 2004
September 27,2003
Net sales . . . . . . . . . . . . . . . . . . . . . . . . . . . . . . . . . . . . $ 13,931 $ 8,279 $ 6,207 Cost of sales . . . . . . . . . . . . . . . . . . . . . . . . . . . . . . . . . 9,888 6,020 4,499Gross margin . . . . . . . . . . . . . . . . . . . . . . . . . . . . . . . . $ 4,043 $2,259 $ 1,708 Gross margin percentage. . . . . . . . . . . . . . . . . . . . . . 29.0% 27.3% 27.5%
Gross margin increased in 2005 to 29.0% of net sales from 27.3% of net sales in 2004. The Company’s gross margin during 2005 increased due to more favorable pricing on certain commodity componentsincluding LCD flat-panel displays and DRAM memory; an increase in higher margin software sales; a favorable shift in direct sales related primarily to the Company’s Retail and online stores; and higher overall revenue that provided for more leverage on fixed production costs. These increases to gross margin were partially offset by an increase in lower margin iPod sales.
The Company anticipates that its gross margin and the gross margin of the overall personal computer and consumer electronics industries will remain under pressure in light of price competition, especially for theiPod product line. The Company expects gross margin percentage to decline in the first quarter of 2006 primarily as a result of a shift in the mix of revenue toward lower margin products such as the iPod andcontent from the iTunes Music Store.
The foregoing statements regarding the Company’s expected gross margin are forward-looking. There canbe no assurance that current gross margins will be maintained or targeted gross margin levels will be achieved. In general, gross margins and margins on individual products, including iPods, will remain under significant downward pressure due to a variety of factors, including continued industry wide global pricing pressures, increased competition, compressed product life cycles, potential increases in the cost and availability of raw material and outside manufacturing services, and potential changes to the Company’s product mix, including higher unit sales of consumer products with lower average selling prices and lowergross margins. In response to these downward pressures, the Company expects it will continue to take pricing actions with respect to its products. Gross margins could also be affected by the Company’s ability to effectively manage product quality and warranty costs and to stimulate demand for certain of its products. Due to the Company’s significant international operations, financial results can be significantlyaffected in the short-term by fluctuations in exchange rates.

38
The Company orders components for its products and builds inventory in advance of product shipments. Because the Company’s markets are volatile and subject to rapid technology and price changes, there is arisk the Company will forecast incorrectly and produce or order from third-parties excess or insufficientinventories of particular products or components. The Company’s operating results and financial condition in the past have been and may in the future be materially adversely affected by the Company’s ability tomanage its inventory levels and outstanding purchase commitments and to respond to short-term shifts incustomer demand patterns.
Gross margin declined in 2004 to 27.3% of net sales from 27.5% of net sales in 2003. The Company’s gross margin during 2004 declined due to an increase in mix towards lower margin iPod and iBook sales, pricingactions on certain Power Macintosh G5 models that were transitioned during the beginning of 2004, higher warranty costs on certain portable Macintosh products, and higher freight and duty costs during 2004. These unfavorable factors were partially offset by an increase in direct sales and a 39% year-over-year increase in higher margin software sales.
Operating Expenses Operating expenses for each of the last three fiscal years are as follows (in millions, except for percentages):
September 24, September 25, September 27, 2005 2004 2003
Research and development . . . . . . . . . . . . . . . . . . . . $ 534 $ 489 $ 471Percentage of net sales. . . . . . . . . . . . . . . . . . . . . . 4% 6% 8%
Selling, general, and administrative expenses . . . . $1,859 $1,421 $1,212Percentage of net sales. . . . . . . . . . . . . . . . . . . . . . 13% 17% 20%
Restructuring costs . . . . . . . . . . . . . . . . . . . . . . . . . . . $ — $ 23 $ 26
Research and Development (R&D) The Company recognizes that focused investments in R&D are critical to its future growth and competitiveposition in the marketplace and are directly related to timely development of new and enhanced productsthat are central to the Company’s core business strategy. The Company has historically relied uponinnovation to remain competitive. R&D expense amounted to approximately 4% of total net sales during2005 down from 6% and 8% of total net sales in 2004 and 2003, respectively. This decrease is due to the significant increase of 68% in total net sales of the Company for 2005. Although R&D expense decreased as a percentage of total net sales in 2005, actual expense for R&D in 2005 increased $45 million or 9%from 2004, which follows an $18 million or 4% increase in 2004 compared to 2003. The overall increase inR&D expense relates primarily to increased headcount and support for new product developmentactivities and the impact of employee salary increases in 2005. R&D expense does not include capitalizedsoftware development costs of approximately $29.7 million related to the development of Mac OS X Tigerduring 2005; $4.5 million related to the development of Mac OS X Tiger and $2.3 million related to the development of FileMaker Pro 7 in 2004; and $14.7 million related to the development of Mac OS XPanther in 2003. Further information related to the Company’s capitalization of software development costs may be found in Part II, Item 8 of this Form 10-K at Note 1 of Notes to Consolidated FinancialStatements.
Selling, General, and Administrative Expense (SG&A) Expenditures for SG&A increased $438 million or 31% during 2005 compared to 2004. These increases aredue primarily to the Company’s continued expansion of its Retail segment in both domestic and international markets, a current year increase in discretionary spending on marketing and advertising, andhigher direct and channel selling expenses resulting from the increase in net sales and employee salary

39
merit increases. SG&A as a percentage of total net sales in 2005 was 13%, down from 17% in 2004, whichis due to the increase in total net sales of 68% for the Company during 2005.
Expenditures for SG&A increased $209 million or 17% during 2004 compared to 2003. These increases were due primarily to the Company’s continued expansion of its Retail segment in both domestic and international markets, an increase in discretionary spending on marketing and advertising, an increase inamortization costs associated with restricted stock compensation, and higher direct and channel sellingexpenses resulting from the increase in net sales and employee salary merit increases. SG&A as a percentage of total net sales in 2004 was 17%, down from 20% in 2003 due to the increase in total net sales for the Company of 33% during 2004.
Fiscal 2004 Restructuring Actions The Company recorded total restructuring charges of approximately $23 million during 2004, including approximately $14 million in severance costs, $5.5 million in asset impairments, and a $3.5 million charge for lease cancellations in conjunction with the vacating of a leased sales facility in Europe during the fourthquarter of 2004 related to a European workforce reduction. Of the $23 million charge, $19.7 million hadbeen utilized by the end of 2005, with the remaining $3.3 million consisting of $0.7 million for employeeseverance benefits and $2.6 million for lease cancellations. These actions will result in the termination of 461 employees, 448 of which had been terminated prior to the end of 2005.
Fiscal 2003 Restructuring Actions The Company recorded total restructuring charges of approximately $26.8 million during 2003, includingapproximately $7.4 million in severance costs, a $5.0 million charge to write-off deferred compensation, $7.1 million in asset impairments, and a $7.3 million charge for lease cancellations primarily related to theclosure of the Company’s Singapore manufacturing operations during the first quarter of 2003. Of the$26.8 million charge, all had been utilized by the end of 2005, except for approximately $1.7 million relatedto operating lease costs on abandoned facilities. These actions resulted in the termination of 353 employees.
Other Income and ExpenseOther income and expense for each of the last three fiscal years are as follows (in millions):
September 24, September 25, September 27,2005 2004 2003
Gains on non-current investments, net . . . . . . . . . . . . $ — $ 4 $10
Interest income . . . . . . . . . . . . . . . . . . . . . . . . . . . . . . . . $183 $ 64 $ 69Interest expense . . . . . . . . . . . . . . . . . . . . . . . . . . . . . . . — (3) (8)Gains on sales of short term investments, net . . . . . . — 1 21Other income (expense), net. . . . . . . . . . . . . . . . . . . . . (18) (9) 1Interest and Other Income, net . . . . . . . . . . . . . . . . . . $165 $53 $83
Total other income and expense . . . . . . . . . . . . . . . . . $165 $57 $93
Gains and Losses on Non-current Investments The Company previously held significant investments in ARM Holdings plc (ARM), AkamaiTechnologies, Inc. (Akamai), and EarthLink Network, Inc. (EarthLink). The Company sold all of theremaining holdings in these non-current investments in 2004 and 2003. Pretax gains recorded upon the sale of these non-current investments were $4 million and $10 million in 2004 and 2003, respectively.

40
Interest and Other Income, Net Total interest and other income, net increased $112 million or 211% to $165 million during 2005 comparedto $53 million in 2004 and $83 million in 2003. These increases are attributable primarily to increasinginvestment yields on the Company’s cash and short-term investments and higher invested balances. The weighted average interest rate earned by the Company on its cash, cash equivalents, and short-term investments increased to 2.70% in 2005 compared to the 1.38% and 1.89% rates earned during 2004 and 2003, respectively. The Company occasionally sells short-term investments prior to their stated maturities. As a result of such sales, the Company recognized net losses of $137,000 in 2005 and net gains of $1 million and $21 million during 2004 and 2003, respectively. Partially offsetting the increase in other income were higher foreign currency hedging expenses.
Interest expense consisted primarily of interest on the Company’s $300 million aggregate principal amountunsecured notes, which were repaid upon their maturity in February 2004. The unsecured notes were sold at 99.925% of par for an effective yield to maturity of 6.51%. Total deferred gain resulting from the closureof debt swaps of approximately $23 million was fully amortized as of the notes’ maturity in February 2004.
Provision for Income Taxes The Company’s effective tax rate for the year ended September 24, 2005 was approximately 26%. The Company’s effective rate differs from the statutory federal income tax rate of 35% due primarily to certainundistributed foreign earnings for which no U.S. taxes are provided because such earnings are intended tobe indefinitely reinvested outside the U.S., research and development tax credits, and a reduction of certain tax contingency reserves and adjustments to net deferred tax assets. The benefit from adjustments to tax contingency reserves and net deferred tax assets was $67 million. In addition, the Company recordeda $25 million reduction of the valuation allowance associated with deferred tax assets that, in management’s opinion, are now more likely than not to be realized in the future. $14 million of the valuation allowance reduction was recorded as a credit to income tax expense, and the remainder was recorded as a credit to goodwill.
As of September 24, 2005, the Company had deferred tax assets arising from deductible temporary differences, tax losses, and tax credits of $767 million before being offset against certain deferred taxliabilities and a valuation allowance for presentation on the Company’s balance sheet. Management believes it is more likely than not that forecasted income, including income that may be generated as a result of certain tax planning strategies, will be sufficient to fully recover the remaining net deferred tax assets. As of September 24, 2005 and September 25, 2004, a valuation allowance of $5 million and$30 million, respectively, was recorded against the deferred tax asset for the benefits of tax loss carryforwards that may not be realized. The remaining valuation allowance at September 24, 2005 relatesprincipally to certain state operating loss carryforwards. The Company will continue to evaluate therealizability of the deferred tax assets quarterly by assessing the need for and amount of the valuation allowance.
The Internal Revenue Service (IRS) has completed its field audit of the Company’s federal income tax returns for all years prior to 2002 and proposed certain adjustments. Certain of these adjustments arebeing contested through the IRS Appeals Office. Substantially all IRS audit issues for these years havebeen resolved. In addition, the Company is also subject to audits by state, local, and foreign tax authorities. Management believes that adequate provision has been made for any adjustments that may result from tax examinations. However, the outcome of tax audits cannot be predicted with certainty. Should any issues addressed in the Company’s tax audits be resolved in a manner not consistent with management’s expectations, the Company could be required to adjust its provision for income tax in the period suchresolution occurs.
On October 22, 2004, the American Jobs Creation Act (AJCA) was signed into law. The AJCA includes a provision for the deduction of 85% of certain foreign earnings that are repatriated, as defined in the
41
AJCA. The legislation provided the Company with the option to apply this provision to repatriations of qualifying earnings in either 2005 or 2006. The Company is continuing to evaluate the effects of therepatriation provision and expects to complete the evaluation in 2006. A maximum of $755 million may beeligible for repatriation under the reduced tax rate provided by AJCA. However, given the uncertaintiesand complexities of the repatriation provision and the Company’s continuing evaluation, the Company has not yet determined the amount that may be repatriated or the related potential income tax effects of such repatriation.
Recent Accounting Pronouncements In November 2005, the FASB issued FASB Staff Position (FSP) Nos. FAS 115-1 and FAS 124-1, The Meaning of Other-Than-Temporary Impairment and its Application to Certain Investments. FSP Nos. FAS 115-1 and FAS 124-1 amend SFAS No. 115, Accounting for Certain Investments in Debt and EquitySecurities, SFAS No. 124, Accounting for Certain Investments Held by Not-for-Profit Organizations, as well as APB Opinion No. 18, The Equity Method of Accounting for Investments in Common Stock. This guidance nullifies certain requirements of EITF 03-1, The Meaning of Other-Than-Temporary Impairment and itsApplication to Certain Investments. FSP Nos. FAS 115-1 and FAS 124-1 include guidance for evaluating andrecording impairment losses on debt and equity investments, as well as new disclosure requirements forinvestments that are deemed to be temporarily impaired. FSP Nos. FAS 115-1 and FAS 124-1 also require other-than-temporary impaired debt securities to be written down to its impaired value, which becomes thenew cost basis. FSP Nos. FAS 115-1 and FAS 124-1 are effective for fiscal years beginning after December 15, 2005. Although the Company will continue to evaluate the application of FSP Nos. FAS 115-1 and FAS 124-1, management does not currently believe adoption will have a material impact on the Company’s results of operations or financial position.
In November 2004, the FASB issued SFAS No. 151, Inventory Costs, which amends the guidance in Accounting Research Bulletin (ARB) No. 43, Chapter 4, Inventory Pricing, to clarify the accounting for abnormal amounts of facility expense, freight, handling costs, and wasted material (spoilage). ARB 43, Chapter 4, previously stated that “under some circumstances, items such as idle facility expense, excessivespoilage, double freight, and rehandling costs may be so abnormal as to require treatment as currentperiod charges.” SFAS 151 requires that those items be recognized as current-period charges regardless ofwhether they meet the criterion of “so abnormal.” In addition, SFAS 151 requires that allocation of fixedproduction overhead to the costs of conversion be based on the normal capacity of the productionfacilities. SFAS 151 is effective for fiscal years beginning after June 15, 2005. Although the Company willcontinue to evaluate the application of SFAS 151, management does not currently believe adoption will have a material impact on the Company’s results of operations or financial position.
In December 2004, the FASB issued FSP 109-2, Accounting and Disclosure Guidance for the Foreign Earnings Repatriation Provision within the American Jobs Creation Act of 2004. FSP 109-2 provides additional time to companies beyond the financial reporting period of enactment to evaluate the effects of the AJCA on their plans for repatriation of foreign earnings for purposes of applying SFAS 109,Accounting for Income Taxes. The Company is currently evaluating the repatriation provisions of AJCA, which if implemented by the Company would affect the Company’s tax provision and deferred tax assets and liabilities. However, given the uncertainties and complexities of the repatriation provision and theCompany’s continuing evaluation, it is not possible at this time to determine the amount, if any, that will be repatriated or the related potential income tax effects of such repatriation. The Company expects to complete the evaluation in 2006.
In December 2004, the FASB issued SFAS No. 123 (revised 2004) (SFAS No. 123R), Share-Based Payment, that addresses the accounting for share-based payment transactions in which an enterprisereceives employee services in exchange for (a) equity instruments of the enterprise or (b) liabilities that are based on the fair value of the enterprise’s equity instruments or that may be settled by the issuance of such
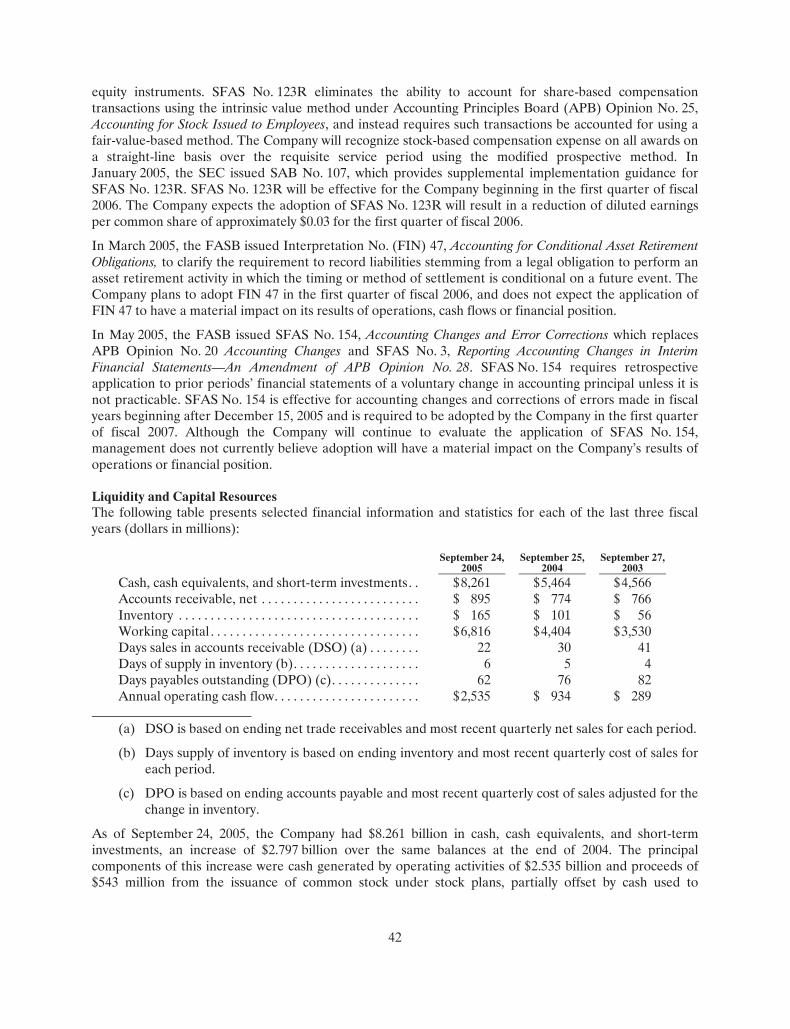
42
equity instruments. SFAS No. 123R eliminates the ability to account for share-based compensation transactions using the intrinsic value method under Accounting Principles Board (APB) Opinion No. 25,Accounting for Stock Issued to Employees, and instead requires such transactions be accounted for using a fair-value-based method. The Company will recognize stock-based compensation expense on all awards ona straight-line basis over the requisite service period using the modified prospective method. InJanuary 2005, the SEC issued SAB No. 107, which provides supplemental implementation guidance for SFAS No. 123R. SFAS No. 123R will be effective for the Company beginning in the first quarter of fiscal 2006. The Company expects the adoption of SFAS No. 123R will result in a reduction of diluted earnings per common share of approximately $0.03 for the first quarter of fiscal 2006.
In March 2005, the FASB issued Interpretation No. (FIN) 47, Accounting for Conditional Asset RetirementObligations, to clarify the requirement to record liabilities stemming from a legal obligation to perform an asset retirement activity in which the timing or method of settlement is conditional on a future event. The Company plans to adopt FIN 47 in the first quarter of fiscal 2006, and does not expect the application of FIN 47 to have a material impact on its results of operations, cash flows or financial position.
In May 2005, the FASB issued SFAS No. 154, Accounting Changes and Error Corrections which replacesAPB Opinion No. 20 Accounting Changes and SFAS No. 3, Reporting Accounting Changes in Interim Financial Statements—An Amendment of APB Opinion No. 28. SFAS No. 154 requires retrospective application to prior periods’ financial statements of a voluntary change in accounting principal unless it is not practicable. SFAS No. 154 is effective for accounting changes and corrections of errors made in fiscal years beginning after December 15, 2005 and is required to be adopted by the Company in the first quarter of fiscal 2007. Although the Company will continue to evaluate the application of SFAS No. 154, management does not currently believe adoption will have a material impact on the Company’s results ofoperations or financial position.
Liquidity and Capital Resources The following table presents selected financial information and statistics for each of the last three fiscalyears (dollars in millions):
September 24, September 25, September 27, 2005 2004 2003
Cash, cash equivalents, and short-term investments. . $ 8,261 $ 5,464 $ 4,566 Accounts receivable, net . . . . . . . . . . . . . . . . . . . . . . . . . $ 895 $ 774 $ 766Inventory . . . . . . . . . . . . . . . . . . . . . . . . . . . . . . . . . . . . . . $ 165 $ 101 $ 56Working capital . . . . . . . . . . . . . . . . . . . . . . . . . . . . . . . . . $ 6,816 $ 4,404 $ 3,530Days sales in accounts receivable (DSO) (a) . . . . . . . . 22 30 41Days of supply in inventory (b). . . . . . . . . . . . . . . . . . . . 6 5 4Days payables outstanding (DPO) (c). . . . . . . . . . . . . . 62 76 82Annual operating cash flow. . . . . . . . . . . . . . . . . . . . . . . $2,535 $ 934 $ 289
(a) DSO is based on ending net trade receivables and most recent quarterly net sales for each period.
(b) Days supply of inventory is based on ending inventory and most recent quarterly cost of sales for each period.
(c) DPO is based on ending accounts payable and most recent quarterly cost of sales adjusted for the change in inventory.
As of September 24, 2005, the Company had $8.261 billion in cash, cash equivalents, and short-term investments, an increase of $2.797 billion over the same balances at the end of 2004. The principalcomponents of this increase were cash generated by operating activities of $2.535 billion and proceeds of $543 million from the issuance of common stock under stock plans, partially offset by cash used to

43
purchase property, plant, and equipment of $260 million. The Company’s short-term investment portfoliois primarily invested in high credit quality, liquid investments. As of September 24, 2005, approximately $4.3 billion of the Company’s cash, cash equivalents, and short-term investments were held by foreign subsidiaries and are generally based in U.S. dollar-denominated holdings. Amounts held by foreignsubsidiaries are generally subject to U.S. income taxation on repatriation to the U.S. The Company is currently assessing the impact of the one-time favorable foreign dividend provisions recently enacted as part of the American Jobs Creation Act of 2004, and may decide to repatriate earnings from some of itsforeign subsidiaries.
The Company believes its existing balances of cash, cash equivalents, and short-term investments will besufficient to satisfy its working capital needs, capital expenditures, stock repurchase activity, outstandingcommitments, and other liquidity requirements associated with its existing operations over the next 12 months.
Capital Expenditures The Company’s total capital expenditures were $260 million during 2005, $132 million of which were for retail store facilities and equipment related to the Company’s Retail segment and $128 million of whichwere primarily for corporate infrastructure, including information systems enhancements and operatingfacilities enhancements and expansions. The Company currently anticipates it will utilize approximately $390 million for capital expenditures during 2006, approximately $210 million of which is expected to be utilized for further expansion of the Company’s Retail segment and the remainder utilized to support normalreplacement of existing capital assets and enhancements to general information technology infrastructure.
Stock Repurchase PlanIn July 1999, the Company’s Board of Directors authorized a plan for the Company to repurchase up to $500 million of its common stock. This repurchase plan does not obligate the Company to acquire any specific number of shares or acquire shares over any specified period of time. Since inception of the stockrepurchase plan, the Company had repurchased a total of 13.1 million shares at a cost of $217 million. TheCompany has not engaged in any transactions to repurchase its common stock during 2005 or 2004. TheCompany was authorized to repurchase up to an additional $283 million of its common stock as of September 24, 2005.
On February 28, 2005, the Company effected a two-for-one stock split to shareholders of record as of February 18, 2005. All share and per share information has been retroactively adjusted to reflect the stocksplit.
Off-Balance Sheet Arrangements and Contractual Obligations The Company has not entered into any transactions with unconsolidated entities whereby the Company has financial guarantees, subordinated retained interests, derivative instruments, or other contingentarrangements that expose the Company to material continuing risks, contingent liabilities, or any other obligation under a variable interest in an unconsolidated entity that provides financing, liquidity, marketrisk, or credit risk support to the Company.

44
The following table presents certain payments due by the Company under contractual obligations withminimum firm commitments as of September 24, 2005 and excludes amounts already recorded on the Company’s balance sheet as current liabilities (in millions):
Total
PaymentsDue in Less
Than 1 year
PaymentsDue in
1-3 years
Payments Due in
4-5 years
PaymentsDue in More
Than 5 years
Operating Leases. . . . . . . . . . . . . . . . . . . . . . . . . . . $ 865 $ 108 $211 $192 $ 354 Purchase Obligations . . . . . . . . . . . . . . . . . . . . . . . 1,994 1,994 — — — Asset Retirement Obligations. . . . . . . . . . . . . . . . 14 — 2 2 10Other Obligations . . . . . . . . . . . . . . . . . . . . . . . . . . 4 4 — — — Total . . . . . . . . . . . . . . . . . . . . . . . . . . . . . . . . . . . . . $ 2,877 $ 2,106 $ 213 $ 194 $ 364
Lease Commitments As of September 24, 2005, the Company had total outstanding commitments on noncancelable operatingleases of approximately $865 million, $606 million of which related to the lease of retail space and relatedfacilities. Lease terms on the Company’s existing major facility operating leases range from 5 to 20 years.
Purchase Commitments with Contract Manufacturers and Component SuppliersThe Company utilizes several contract manufacturers to manufacture sub-assemblies for the Company’sproducts and to perform final assembly and test of finished products. These contract manufacturers acquire components and build product based on demand information supplied by the Company, which typically covers periods ranging from 30 to 150 days. The Company also obtains individual components for its products from a wide variety of individual suppliers. Consistent with industry practice, the Companyacquires components through a combination of purchase orders, supplier contracts, and open orders basedon projected demand information. Such purchase commitments typically cover the Company’s forecasted component and manufacturing requirements for periods ranging from 30 to 150 days. As of September 24, 2005, the Company had outstanding third-party manufacturing commitments and component purchasecommitments of approximately $2.0 billion.
Subsequent to September 24, 2005, the Company entered into long-term supply agreements with Hynix Semiconductor, Inc., Intel Corporation, Micron Technology, Inc., Samsung Electronics Co., Ltd., andToshiba Corporation to secure supply of NAND flash memory through calendar year 2010. As part of these agreements, the Company intends to prepay a total of $1.25 billion for flash memory components bythe end of the second quarter of 2006.
Asset Retirement Obligations The Company’s asset retirement obligations are associated with commitments to return property subject to operating leases to original condition upon lease termination. As of September 24, 2005, the Companyestimates that gross expected future cash flows of approximately $14 million will be required to fulfill theseobligations.
Other Obligations The Company’s other obligations of approximately $4 million are primarily related to Internet and telecommunications services.
Indemnifications The Company generally does not indemnify end-users of its operating system and application software against legal claims that the software infringes third-party intellectual property rights. Other agreementsentered into by the Company sometimes include indemnification provisions under which the Company

45
could be subject to costs and/or damages in the event of an infringement claim against the Company or an indemnified third-party. However, the Company has not been required to make any significant payments resulting from such an infringement claim asserted against itself or an indemnified third-party and, in theopinion of management, does not have a liability related to unresolved infringement claims subject to indemnification that would have a material adverse effect on its financial condition, liquidity or results ofoperations.
Factors That May Affect Future Results and Financial Condition Because of the following factors, as well as other factors affecting the Company’s operating results andfinancial condition, past financial performance should not be considered to be a reliable indicator of future performance, and investors should not use historical trends to anticipate results or trends in future periods.
General economic conditions and current economic and political uncertainty could adversely affect the demand for the Company’s products and the financial health of its suppliers, distributors, and resellers. The Company’s operating performance depends significantly on general economic conditions in the U.S.and abroad. At times in the past, demand for the Company’s products has been negatively impacted bydifficult global economic conditions. Additionally, some of the Company’s education customers appeared to be delaying technology purchases due to concerns about the overall impact of the weaker economy and state budget deficits on their available funding. Although recent macroeconomic trends seem to indicatean economic recovery, continued uncertainty about future economic conditions makes it difficult toforecast future demand for the Company’s products and related operating results. Should global and/or regional economic conditions deteriorate, demand for the Company’s products could be adversely affected, as could the financial health of its suppliers, distributors, and resellers.
War, terrorism, public health issues or other business interruptions could disrupt supply, delivery or demand ofproducts, which could negatively affect the Company’s operations and performance.War, terrorism, public health issues and other business interruptions whether in the U.S. or abroad, have caused and could cause damage or disruption to international commerce by creating economic and politicaluncertainties that may have a strong negative impact on the global economy, the Company, and theCompany’s suppliers or customers. The Company’s major business operations are subject to interruptionby earthquake, other natural disasters, fire, power shortages, terrorist attacks and other hostile acts, labor disputes, public health issues, and other events beyond its control. The majority of the Company’s research and development activities, its corporate headquarters, information technology systems, and other critical business operations, including certain component suppliers and manufacturing vendors, are located near major seismic faults. Because the Company does not carry earthquake insurance for direct quake-related losses, the Company’s operating results and financial condition could be materially adversely affected in the event of a major earthquake or other natural or manmade disaster.
Although it is impossible to predict the occurrences or consequences of any such events, such events couldresult in a decrease in demand for the Company’s products, make it difficult or impossible for the Company to deliver products to its customers or to receive components from its suppliers, and could createdelays and inefficiencies in the Company’s supply chain. In addition, should major public health issues,including pandemics, arise, the Company could be negatively impacted by the need for more stringent employee travel restrictions, additional limitations in the availability of freight services, governmental actions limiting the movement of products between various regions, delays in production ramps of newproducts, and disruptions in the operations of the Company’s manufacturing vendors and componentsuppliers. The Company’s operating results and financial condition have been, and in the future may be,adversely affected by these events.

46
The market for personal computers and related peripherals and services, as well as digital music devices andrelated services, is highly competitive. If the Company is unable to effectively compete in these markets, its results of operations could be adversely affected. The personal computer industry is highly competitive and is characterized by aggressive pricing practices,downward pressure on gross margins, frequent introduction of new products, short product life cycles, evolving industry standards, continual improvement in product price/performance characteristics, rapid adoption of technological and product advancements by competitors, price sensitivity on the part ofconsumers, and a large number of competitors. Over the past several years, price competition in the market for personal computers and related peripherals has been particularly intense as competitors who sell Windows and Linux based personal computers have aggressively cut prices and lowered their productmargins for personal computing products. The Company’s results of operations and financial conditionhave been, and in the future may continue to be, adversely affected by these and other industry-widepricing pressures and downward pressures on gross margins.
The personal computer industry has also been characterized by rapid technological advances in software functionality, hardware performance, and features based on existing or emerging industry standards. Further, as the personal computer industry and its customers place more reliance on the Internet, anincreasing number of Internet devices that are smaller and simpler than traditional personal computersmay compete for market share with the Company’s existing products. Several competitors of the Company have either targeted or announced their intention to target certain of the Company’s key market segments, including consumer, education, professional and consumer digital video editing, and design and publishing. Several of the Company’s competitors have introduced or announced plans to introduce digital music products and/or online stores offering digital music distribution that mimic many of the unique design, technical features, and solutions of the Company’s products. The Company has a significant number ofcompetitors, many of whom have greater financial, marketing, manufacturing, and technological resources, as well as broader product lines and larger installed customer bases than those of the Company.Additionally, there has been a trend towards consolidation in the personal computer industry that hasresulted in larger and potentially stronger competitors in the Company’s markets.
The Company is currently the only maker of hardware using the Mac OS. The Mac OS has a minoritymarket share in the personal computer market, which is dominated by makers of computers utilizing othercompeting operating systems, including Windows and Linux. The Company’s future operating results andfinancial condition are substantially dependent on its ability to continue to develop improvements to theMacintosh platform in order to maintain perceived design and functional advantages over competing platforms. Additionally, if unauthorized copies of the Mac OS are used on other companies’ hardwareproducts and result in decreased demand for the Company’s hardware products, the Company’s results ofoperations may be adversely affected.
The Company is currently focused on market opportunities related to digital music distribution and related consumer electronic devices, including iPods. The Company faces increasing competition from other companies promoting their own digital music products, including music enabled cell phones, distributionservices, and free peer-to-peer music services. These competitors include both new entrants with differentmarket approaches, such as subscription services models, and also larger companies that may have greatertechnical, marketing, distribution, and other resources than those of the Company, as well as established hardware, software, and digital content supplier relationships. Failure to effectively compete couldnegatively affect the Company’s operating results and financial position. There can be no assurance thatthe Company will be able to continue to provide products and services that effectively compete in thesemarkets or successfully distribute and sell digital music outside the U.S. The Company may also have to respond to price competition by lowering prices and/or increasing features which could adversely affect theCompany’s music product gross margins as well as overall Company gross margins.

47
The Company also faces increased competition in the U.S. education market. U.S. elementary and secondary schools, as well as college and university customers, remain a core market for the Company. Uncertainty in this channel remains as several competitors of the Company have either targeted or announced their intention to target the education market for personal computers, which could negatively affect the Company’s market share. In an effort to regain market share and remain competitive, theCompany has been and will continue to pursue one-to-one (1:1) learning solutions in education. 1:1 learning solutions typically consist of iBook portable systems for every student and teacher along with a wireless network connected to a central server. These 1:1 learning solutions and other strategic sales are generally priced more aggressively and could result in significantly less profitability or even in financiallosses, particularly for larger deals. Although the Company believes it has taken certain steps to strengthenits position in the education market, there can be no assurance that the Company will be able to increase or maintain its share of the education market or execute profitably on large strategic arrangements. Failure to do so may have an adverse impact on the Company’s operating results and financial condition.
The Company’s transition from PowerPC microprocessors used by Macintosh computers to microprocessorsbuilt by Intel is subject to numerous risks. In June 2005, the Company announced its intention to transition from the use of PowerPC microprocessors to the use of Intel microprocessors in all of its Macintosh computers by the end of calendar year 2007. This transition is subject to numerous risks and uncertainties, including the Company’s ability to timely develop and deliver new products using Intel microprocessors, the timely innovation anddelivery of related hardware and software products, including the Company’s applications, to support Intel microprocessors, market acceptance of Intel-based Macintosh computers, the development and availability on acceptable terms of components and services essential to enable the Company to timely deliverIntel-based Macintosh computers, and the effective management of inventory levels in line withanticipated product demand for both PowerPC and Intel-based Macintosh computers. In addition, the Company is dependent on third-party software developers such as Microsoft and Adobe continuing tosupport current applications that run on PowerPC-based computers and timely developing versions of current and future applications that run on Intel and PowerPC-based Macintosh computers. TheCompany’s inability to timely deliver new Intel-based products or obtain developer commitment both tocontinue supporting applications that run on PowerPC microprocessors and timely transition their applications to run natively on Intel-based products may have an adverse impact on the Company’s resultsof operations. The Company’s announcement of its intention to transition to Intel microprocessors may negatively impact sales of current and future Macintosh products containing PowerPC microprocessors, ascustomers may elect to delay purchases until the Intel-based products are available. Additionally, there canbe no assurance that the Company will be able to maintain its historical gross margin percentages on its products, including Intel-based Macintosh computers, which may adversely impact the Company’s resultsof operations.
Future operating results are dependent upon the Company’s ability to obtain a sufficient supply of components, including microprocessors, some of which are in short supply or available only from limited sources. Although most components essential to the Company’s business are generally available from multiplesources, certain key components including microprocessors and ASICs are currently obtained by the Company from single or limited sources. Some key components (including without limitation DRAM, NAND flash-memory, and TFT-LCD flat-panel displays), while currently available to the Company from multiple sources, are at times subject to industry-wide availability and pricing pressures. In addition, new products introduced by the Company often initially utilize custom components obtained from only one source until the Company has evaluated whether there is a need for, and subsequently qualifies, additionalsuppliers. In situations where a component or product utilizes new technologies, initial capacity constraints may exist until such time as the suppliers’ yields have matured. The Company and other producers in the personal computer industry also compete for various components with other industries that have

48
experienced increased demand for their products. The Company uses some components that are notcommon to the rest of the personal computer industry including certain microprocessors and ASICs. Continued availability of these components may be affected if producers were to decide to concentrate onthe production of components other than those customized to meet the Company’s requirements. If thesupply of a key component were to be delayed or constrained on a new or existing product, the Company’sresults of operations and financial condition could be adversely affected.
The Company’s ability to produce and market competitive products is dependent on the ability and desire of IBM and Freescale Semiconductor, Inc. (Freescale) to supply PowerPC microprocessors and Intel tosupply its microprocessors for the Company’s Macintosh computers and to provide the Company with a sufficient supply of microprocessors with price/performance features that compare favorably to thosesupplied to the Company’s competitors. While the Company has supply agreements with IBM and Freescale, the Company’s recent announcement of plans to transition to Intel microprocessors may impactthe continued availability on acceptable terms of certain components and services, including PowerPC G4 and G5 microprocessors, which are essential to the Company’s business and are currently obtained by theCompany from sole or limited sources. Additionally, there have been instances in recent years where the inability of the Company’s suppliers to provide advanced PowerPC microprocessors in sufficient quantity has had significant adverse effects on the Company’s results of operations. In addition, IBM is currently the Company’s sole supplier of the PowerPC G5 processor, which is used in the Company’s current PowerMac, Xserve, and iMac G5 products. Freescale is the sole supplier of the G4 processor, which is used in theCompany’s eMac, Mac mini, and portable products. IBM experienced manufacturing problems with thePowerPC G5 processor, which resulted in the Company delaying the shipment of various products and constrained certain product shipments during the second half of 2004 and the first quarter of 2005.Manufacturing problems experienced by any of the Company’s suppliers in the future or failure by them to deliver components to the Company in sufficient quantities with competitive price/performance features could adversely affect the Company’s results of operations and financial condition.
The Company must successfully manage frequent product introductions and transitions to remain competitive and effectively stimulate customer demand. Due to the highly volatile and competitive nature of the personal computer and consumer electronics industries, which are characterized by dynamic customer demand patterns and rapid technological advances, the Company must continually introduce new products and technologies, enhance existingproducts in order to remain competitive, and effectively stimulate customer demand for new products andupgraded versions of the Company’s existing products. The success of new product introductions isdependent on a number of factors, including market acceptance; the Company’s ability to manage the risksassociated with product transitions, including the transition to Intel-based Macintosh computers, and production ramp issues; the availability of application software for new products; the effective management of inventory levels in line with anticipated product demand, including anticipated demand forPowerPC-based and Intel-based Macintosh computers; the availability of products in appropriate quantities to meet anticipated demand; and the risk that new products may have quality or other defects in the early stages of introduction. Accordingly, the Company cannot determine in advance the ultimateeffect that new products will have on its sales or results of operations.
The Company’s products from time to time experience quality problems that can result in decreased net sales and operating profits. The Company sells highly complex hardware and software products that can contain defects in design andmanufacture. Sophisticated operating system software and applications, such as those sold by the Company, often contain “bugs” that can unexpectedly interfere with the operation of the software. Defects may also occur in components and products the Company purchases from third-parties. There can be noassurance that the Company will be able to detect and fix all defects in the hardware and software it sells.

49
Failure to do so could result in lost revenue, loss of reputation, and significant warranty and other expense to remedy.
Because orders for components, and in some cases commitments to purchase components, must be placed in advance of customer orders, the Company faces substantial inventory risk. The Company records a write-down for inventories of components and products that have becomeobsolete or are in excess of anticipated demand or net realizable value and accrues necessary reserves for cancellation fees of orders for inventories that have been cancelled. Although the Company believes itsinventory and related provisions are currently adequate, given the rapid and unpredictable pace of productobsolescence in the computer and consumer electronics industries and the transition to Intel-basedMacintosh computers, no assurance can be given that the Company will not incur additional inventory and related charges. In addition, such charges have had, and may have, a material effect on the Company’s financial position and results of operations.
The Company must order components for its products and build inventory in advance of product shipments. Because the Company’s markets are volatile and subject to rapid technology and price changes, and because of the transition to Intel-based Macintosh computers, there is a risk the Company will forecastincorrectly and produce or order from third parties excess or insufficient inventories of particular products. Consistent with industry practice, components are normally acquired through a combination of purchaseorders, supplier contracts, and open orders based on projected demand information. Such purchasecommitments typically cover the Company’s forecasted component and manufacturing requirements for periods ranging from 30 to 150 days. The Company’s operating results and financial condition have been in the past and may in the future be materially adversely affected by the Company’s ability to manage itsinventory levels and respond to short-term shifts in customer demand patterns.
The Company is dependent on manufacturing and logistics services provided by third parties, many of whom are located outside of the U.S. Most of the Company’s products are manufactured in whole or in part by third-party manufacturers. In addition, the Company has outsourced much of its transportation and logistics management. While outsourcing arrangements may lower the cost of operations, they also reduce the Company’s direct control over production and distribution. It is uncertain what effect such diminished control will have on thequality or quantity of the products manufactured or services rendered, or the flexibility of the Company to respond to changing market conditions. Moreover, although arrangements with such manufacturers maycontain provisions for warranty expense reimbursement, the Company may remain at least initially responsible to the consumer for warranty service in the event of product defects. Any unanticipatedproduct defect or warranty liability, whether pursuant to arrangements with contract manufacturers or otherwise, could adversely affect the Company’s future operating results and financial condition.
Final assembly of products sold by the Company is currently performed in the Company’s manufacturing facility in Cork, Ireland, and by external vendors in Fremont, California, Fullerton, California, Taiwan,Korea, the People’s Republic of China, and the Czech Republic. Currently, manufacturing of many of the components used in the Company’s products is performed by third-party vendors in Taiwan, China, Japan,Korea, and Singapore. Final assembly of substantially all of the Company’s portable products including PowerBooks, iBooks, and iPods is performed by third-party vendors in China. If for any reason manufacturing or logistics in any of these locations is disrupted by regional economic, business, labor,environmental, public health, or political issues, as well as information technology system failures ormilitary actions, the Company’s results of operations and financial condition could be adversely affected.
50
The Company’s future operating performance is dependent on the performance of distributors and other resellers of the Company’s products. The Company distributes its products through wholesalers, resellers, national and regional retailers, andcataloguers, many of whom distribute products from competing manufacturers. In addition, the Company sells many of its products and resells certain third-party products in most of its major markets directly toend users, certain education customers, and certain resellers through its online stores around the worldand its retail stores. Many of the Company’s resellers operate on narrow product margins and have beennegatively affected by weak economic conditions over the last several years. Considerable trade receivables that are not covered by collateral or credit insurance are outstanding with the Company’s distribution andretail channel partners. The Company’s business and financial results could be adversely affected if the financial condition of these resellers weakens, if resellers within consumer channels were to cease distribution of the Company’s products, or if uncertainty regarding demand for the Company’s products caused resellers to reduce their ordering and marketing of the Company’s products. The Company has invested and will continue to invest in various programs to enhance reseller sales, including staffingselected resellers’ stores with Company employees and contractors. These programs could require a substantial investment from the Company, while providing no assurance of return or incremental revenueto offset this investment.
Over the past several years, an increasing proportion of the Company’s net sales has been made by the Company directly to end-users through its online stores around the world and through its retail stores inthe U.S., Canada, Japan, and the U.K. Some of the Company’s resellers have perceived this expansion ofthe Company’s direct sales as conflicting with their own businesses and economic interests as distributors and resellers of the Company’s products. Perception of such a conflict could discourage the Company’s resellers from investing additional resources in the distribution and sale of the Company’s products or lead them to limit or cease distribution of the Company’s products. The Company’s business and financialresults could be adversely affected if expansion of its direct sales to end-users causes some or all of its resellers to cease or limit distribution of the Company’s products.
Further information regarding risks associated with Marketing and Distribution may be found in Part I,Item 1 of this Form 10-K under the heading “Markets and Distribution.”
The Company relies on third-party digital content, which may not be available to the Company on commercially reasonable terms or at all. The Company contracts with third parties to offer their digital content to customers through theCompany’s iTunes Music Store. The Company pays substantial fees to obtain the rights to offer to its customers this third-party digital content. The Company’s licensing arrangements with these third-party content providers are short-term in nature and do not guarantee the future renewal of these arrangements at commercially reasonable terms, if at all. Certain parties in the music industry have consolidated and formed alliances, which could limit the availability and increase the fees required to offer digital content to customers through the iTunes Music Store. Further, some third-party content providers currently, or may in the future, offer music products and services that compete with the Company’s music products and services, and could take action to make it more difficult or impossible for the Company to license their digital content in the future. If the Company is unable to continue to offer a wide variety of digital contentat reasonable prices with acceptable usage rules, or continue to expand its geographic reach outside theU.S., then sales and gross margins of the Company’s iTunes Music Store as well as related hardware andperipherals, including iPods, may be adversely affected.
Third-party content providers and artists require that the Company provide certain digital rights management solutions and other security mechanisms. If the requirements from content providers or artists change, then the Company may be required to further develop or license technology to address suchnew rights and requirements. There is no assurance that the Company will be able to develop or license

51
such solutions at a reasonable cost and in a timely manner, if at all, which could have a materially adverse effect on the Company’s operating results and financial position.
The Company’s future performance is dependent upon support from third-party software developers. If third-party software applications cease to be developed or available for the Company’s hardware products, then customers may choose not to buy the Company’s products. The Company believes that decisions by customers to purchase the Company’s personal computers, as opposed to Windows-based systems, are often based on the availability of third-party software for particular applications such as Microsoft Office. The Company also believes the availability of third-partyapplication software for the Company’s hardware products depends in part on third-party developers’ perception and analysis of the relative benefits of developing, maintaining, and upgrading such softwarefor the Company’s products versus software for the larger Windows market or growing Linux market. Thisanalysis may be based on factors such as the perceived strength of the Company and its products, the anticipated potential revenue that may be generated, continued acceptance by customers of Mac OS X,and the costs of developing such software products. To the extent the minority market share held by the Company in the personal computer market has caused software developers to question the Company’s prospects in the personal computer market, developers could be less inclined to develop new application software or upgrade existing software for the Company’s products and more inclined to devote their resources to developing and upgrading software for the larger Windows market or growing Linux market.Moreover, there can be no assurance software developers will continue to develop software for Mac OS X,the Company’s operating system, on a timely basis or at all.
In June 2005, the Company announced its plan to begin using Intel microprocessors in its Macintosh computers. The Company plans to begin shipping certain models with Intel microprocessors by June 2006 and to complete this transition to Intel microprocessors for all of its Macintosh computers by the end ofcalendar year 2007. The Company depends on third-party software developers to timely develop currentand future applications that run on Intel and PowerPC microprocessors. The Company’s inability to timelydeliver new Intel-based products, or a decline in available applications that run on the Company’sPowerPC products or the lack of applications that run on Intel-based Macintosh systems could have a materially adverse effect on the Company’s operating results and financial position.
In addition, past and future development by the Company of its own software applications and solutionsmay negatively impact the decision of software developers, such as Microsoft and Adobe, to develop,maintain, and upgrade similar or competitive software for the Company’s products. The Company currently markets and sells a variety of software applications for use by professionals, consumers, andeducation customers that could influence the decisions of third-party software developers to develop or upgrade Macintosh-compatible software products. Software applications currently marketed by the Company include software for professional film and video editing, professional compositing and visual effects for large format film and video productions, professional music production and music postproduction, professional and consumer DVD encoding and authoring, professional digital photo editing and workflow management, consumer digital video and digital photo editing and management, digital music management, desktop-based database management, word processing, and high-qualitypresentations. The Company also markets an integrated productivity application that incorporates word processing, page layout, image manipulation, spreadsheets, databases, and presentations in a single application. Discontinuance of third-party products for the Macintosh platform, including Microsoft Office could have an adverse effect on the Company’s net sales and results of operations.

52
The Company’s business relies on access to patents and intellectual property obtained from third parties, and the Company’s future results could be adversely affected if it is alleged or found to have infringed on the intellectual property rights of others. Many of the Company’s products are designed to include intellectual property obtained from third parties.While it may be necessary in the future to seek or renew licenses relating to various aspects of its products and business methods, the Company believes that based upon past experience and industry practice, suchlicenses generally could be obtained on commercially reasonable terms. However, there can be no assurance that the necessary licenses would be available or available on acceptable terms.
Because of technological changes in the computer and consumer electronics industries, current extensive patent coverage, and the rapid rate of issuance of new patents, it is possible certain components of the Company’s products and business methods may unknowingly infringe existing patents of others. The Company has from time to time been notified that it may be infringing certain patents or other intellectual property rights of others. Responding to such claims, regardless of their merit, can be time-consuming, result in significant expenses, and cause the diversion of management and technical personnel. Several pending claims are in various stages of evaluation. The Company may consider the desirability of enteringinto licensing agreements in certain of these cases. However, no assurance can be given that such licensescan be obtained on acceptable terms or that litigation will not occur. In the event there is a temporary orpermanent injunction entered prohibiting the Company from marketing or selling certain of its products ora successful claim of infringement against the Company requiring it to pay royalties to a third-party, theCompany’s future operating results and financial condition could be adversely affected. Informationregarding certain claims and litigation involving the Company related to alleged patent infringement and other matters is set forth in Part I, Item 3 of this Form 10-K. In the opinion of management, the Companydoes not have a potential liability for damages or royalties from any current legal proceedings or claimsrelated to the infringement of patent or other intellectual property rights of others that would individuallyor in the aggregate have a material adverse effect on its results of operations, or financial condition. However, the results of such legal proceedings cannot be predicted with certainty. Should the Company failto prevail in any of the matters related to infringement of patent or other intellectual property rights ofothers described in Part I, Item 3 of this Form 10-K or should several of these matters be resolved againstthe Company in the same reporting period, the operating results of a particular reporting period could be materially adversely affected.
The Company’s retail initiative has required and will continue to require a substantial investment andcommitment of resources and is subject to numerous risks and uncertainties. Through October 2005, the Company had opened 126 retail stores. The Company’s retail initiative has required substantial investment in equipment and leasehold improvements, information systems, inventory, and personnel. The Company has also entered into substantial operating lease commitments for retail space with lease terms ranging from 5 to 20 years, the majority of which are for 10 years. TheCompany could incur substantial costs should it choose to terminate this initiative or close individualstores. Such costs could adversely affect the Company’s results of operations and financial condition.Additionally, a relatively high proportion of the Retail segment’s costs are fixed because of depreciation onstore construction costs and lease expense. As a result, significant losses would result should the Retail segment experience a significant decline in sales for any reason.
Certain of the Company’s stores have been designed and built to serve as high profile venues that function asvehicles for general corporate marketing, corporate events, and brand awareness. Because of their unique design elements, locations and size, these stores require substantially more investment in equipment andleasehold improvements than the Company’s more typical retail stores. The Company has opened seven suchstores through October 2005. Because of their location and size, these high profile stores also require the Company to enter into substantially larger operating lease commitments compared to those required for itsmore typical stores. Current leases on such locations have terms ranging from 10 to 14 years with total

53
remaining commitments per location ranging from $4 million to $46 million. Closure or poor performance of one of these high profile stores could have a particularly significant negative impact on the Company’s resultsof operations and financial condition.
Many of the general risks and uncertainties the Company faces could also have an adverse impact on itsRetail segment. Also, many factors unique to retail operations present risks and uncertainties, some ofwhich are beyond the Company’s control, that could adversely affect the Retail segment’s future results, cause its actual results to differ from those currently expected, and/or have an adverse effect on the Company’s consolidated results of operations. Potential risks and uncertainties unique to retail operationsthat could have an adverse impact on the Retail segment include, among other things, macro-economicfactors that have a negative impact on general retail activity; inability to manage costs associated with store construction and operation; failure to attract new users to the Macintosh platform; inability to sell third-party hardware and software products at adequate margins; failure to manage relationships withexisting retail channel partners; lack of experience in managing retail operations outside the U.S.; costs associated with unanticipated fluctuations in the value of Apple-branded and third-party retail inventory; and inability to obtain quality retail locations at reasonable cost.
Investment in new business strategies and initiatives could disrupt the Company’s ongoing business and may present risks not originally contemplated. The Company has and may in the future invest in new business strategies or engage in acquisitions thatcomplement the Company’s strategic direction and product roadmap. Such endeavors may involvesignificant risks and uncertainties, including distraction of management’s attention away from normalbusiness operations; insufficient revenue generation to offset liabilities assumed and expenses associatedwith the strategy; and unidentified issues not discovered in the Company’s due diligence process. Becausethese new ventures are inherently risky, no assurance can be given that such strategies and initiatives willbe successful and will not materially adversely affect the Company’s business, operating results or financial condition.
Declines in the sales of the Company’s professional products, software, accessories, or service and support contracts, or increases in sales of consumer products, including iPods, may negatively impact the Company’sgross margin and operating margin percentages. The Company’s professional products, including Power Macintosh and PowerBook systems, software,accessories, and service and support contracts, generally have higher gross margins than the Company’s consumer products, including iMacs, iBooks, iPods, and content from the iTunes Music Store. A shift insales mix away from higher margin professional products towards lower margin consumer products couldadversely affect the Company’s future gross margin and operating margin percentages. The Company’s traditional professional customers may choose to buy consumer products, specifically the iMac G5 andiBook, instead of professional products. Professional users may choose to buy the iMac G5 due to itsrelative price performance, use of the same PowerPC G5 processor used in the Company’s Power Macs, and unique design featuring a flat panel screen. Potential PowerBook customers may also choose to purchase iBooks instead due to their price performance and screen size. Additionally, significant future growth in iPod sales without corresponding growth in higher margin product sales could also reduce gross margin and operating margin percentages.
It is likely that some of the Company’s current and potential professional, creative, and small businesscustomers, who are most likely to utilize professional systems, believe that the relatively slower MHz ratingor clock speed of the microprocessors the Company utilizes in its Macintosh systems compares unfavorably to those utilized by other computer manufacturers and translates to slower overall system performance. These factors may result in an adverse impact to sales of the Company’s professional products as well as togross margin and operating margin percentages.

54
The Company expects its quarterly revenue and operating results to fluctuate for a variety of reasons.The Company’s profit margins vary among its products and its distribution channels. The Company’s direct sales, primarily through its retail and online stores, generally have higher associated profitability than itsindirect sales. Additionally, the Company’s direct channels have traditionally had more sales of softwareand higher priced hardware products, which generally have higher gross margins, than its indirect channels. As a result, the Company’s gross margin and operating margin percentages as well as overall profitability may be adversely impacted as a result of a shift in product, geographic, or channel mix, or new productannouncements, including the transition to Intel-based Macintosh computers. In addition, the Company generally sells more products during the third month of each quarter than it does during either of the firsttwo months, a pattern typical in the personal computer industry. This sales pattern can produce pressure on the Company’s internal infrastructure during the third month of a quarter and may adversely impact the Company’s ability to predict its financial results accurately. Developments late in a quarter, such as lower-than-anticipated demand for the Company’s products, an internal systems failure, or failure of oneof the Company’s key logistics, components suppliers, or manufacturing partners, can have significant adverse impacts on the Company and its results of operations and financial condition.
The Company has higher research and development and selling, general and administrative costs, as apercentage of revenue, than many of its competitors. The Company’s ability to compete successfully and maintain attractive gross margins and revenue growth is heavily dependent upon its ability to ensure a continuing and timely flow of innovative and competitiveproducts and technologies to the marketplace. As a result, the Company incurs higher research and development costs as a percentage of revenue than its competitors who sell personal computers based on other operating systems. Many of these competitors seek to compete aggressively on price and maintain very low cost structures. Further, as a result of the expansion of the Company’s Retail segment and costs associated with marketing the Company’s brand including its unique operating system, the Company incurs higher selling costs as a percentage of revenue than many of its competitors. If the Company is unable tocontinue to develop and sell innovative new products with attractive gross margins, its results of operations may be materially adversely affected by its operating cost structure.
The Company is exposed to credit risk on its accounts receivable and prepayments related to long-term supplyagreements. This risk is heightened during periods when economic conditions worsen. The Company distributes its products through third-party computer resellers and retailers and directly tocertain educational institutions and commercial customers. A substantial majority of the Company’s outstanding trade receivables are not covered by collateral or credit insurance. The Company also has unsecured non-trade receivables from certain of its manufacturing vendors resulting from the sale by theCompany of raw material components to these manufacturing vendors who manufacture sub-assemblies orassemble final products for the Company. In addition, the Company has entered into long-term supply agreements to secure supply of NAND flash-memory and intends to prepay a total of $1.25 billion underthese agreements. While the Company has procedures in place to monitor and limit exposure to credit risk on its trade and non-trade receivables as well as long-term prepayments, there can be no assurance thatsuch procedures will be effective in limiting its credit risk and avoiding losses. Additionally, if the global economy and regional economies fail to improve or continue to deteriorate, it becomes more likely thatthe Company will incur a material loss or losses as a result of the weakening financial condition of one or more of its customers or manufacturing vendors.
The Company’s success depends largely on its ability to attract and retain key personnel. Much of the future success of the Company depends on the continued service and availability of skilledpersonnel, including its Chief Executive Officer, members of its executive team, and those in technical, marketing and staff positions. Experienced personnel in the information technology industry are in highdemand and competition for their talents is intense, especially in the Silicon Valley, where the majority of
55
the Company’s key employees are located. The Company has relied on its ability to grant stock options as one mechanism for recruiting and retaining this highly skilled talent. Recent accounting regulations requiring the expensing of stock options will impair the Company’s future ability to provide these incentives without incurring significant compensation costs. There can be no assurance that the Companywill continue to successfully attract and retain key personnel.
The Company is subject to risks associated with the selection, availability, and cost of insurance. The Company has observed rapidly changing conditions in the insurance markets relating to nearly all areas of traditional commercial insurance. Such conditions have and may continue to result in higherpremium costs, higher policy deductibles, lower coverage limits and may also yield possible policy form exclusions. For some risks, because of cost and/or availability, the Company does not have insurance coverage. Because the Company retains some portion of its insurable risks, and in some cases self insurescompletely, unforeseen or catastrophic losses in excess of insured limits may have a material adverse effect on the Company’s results of operations and financial position.
Failure of information technology systems and breaches in the security of data upon which the Company relies could adversely affect the Company’s future operating results. Information technology system failures and breaches of data security could disrupt the Company’s abilityto function in the normal course of business by potentially causing delays or cancellation of customerorders, impeding the manufacture or shipment of products, or resulting in the unintentional disclosure of customer or Company information. Management has taken steps to address these concerns for its own systems by implementing sophisticated network security and internal control measures. However, there canbe no assurance that a system failure or data security breach of the Company or a third-party vendor willnot have a material adverse effect on the Company’s results of operations.
The Company’s business is subject to the risks of international operations. A large portion of the Company’s revenue is derived from its international operations. As a result, the Company’s operating results and financial condition could be significantly affected by risks associated with international activities, including economic and labor conditions, political instability, tax laws (includingU.S. taxes on foreign subsidiaries), and changes in the value of the U.S. dollar versus the local currency inwhich the products are sold and goods and services are purchased. The Company’s primary exposure to movements in foreign currency exchange rates relate to non-dollar denominated sales in Europe, Japan, Australia, Canada, and certain parts of Asia and non-dollar denominated operating expenses incurred throughout the world. Weaknesses in foreign currencies, particularly the Japanese Yen and the Euro, can adversely impact consumer demand for the Company’s products and the U.S. dollar value of theCompany’s foreign currency denominated sales. Conversely, a strengthening in these and other foreigncurrencies can cause the Company to modify international pricing and affect the value of the Company’s foreign denominated sales, and in some cases, may also increase the cost to the Company of some productcomponents.
Margins on sales of the Company’s products in foreign countries, and on sales of products that include components obtained from foreign suppliers, can be adversely affected by foreign currency exchange ratefluctuations and by international trade regulations, including tariffs and antidumping penalties.
Derivative instruments, such as foreign exchange forward and option positions have been utilized by theCompany to hedge exposures to fluctuations in foreign currency exchange rates. The use of such hedging activities may not offset more than a portion of the adverse financial impact resulting from unfavorable movements in foreign exchange rates.

56
Further information related to the Company’s global market risks may be found in Part II, Item 7A of thisForm 10-K under the subheading “Foreign Currency Risk” and may be found in Part II, Item 8 of this Form 10-K at Notes 1 and 2 of Notes to Consolidated Financial Statements.
The Company is subject to risks associated with environmental regulations. Production and marketing of products in certain states and countries may subject the Company toenvironmental and other regulations including, in some instances, the requirement to provide customers the ability to return product at the end of its useful life, and place responsibility for environmentally safedisposal or recycling with the Company. Such laws and regulations have recently been passed in severaljurisdictions in which the Company operates, including various European Union member countries, Japan, and certain states within the U.S. In the future, these laws could have a material adverse effect on the Company’s results of operations.
Changes in accounting rules could affect the Company’s future operating results. Financial statements are prepared in accordance with U.S. generally accepted accounting principles. These principles are subject to interpretation by various governing bodies, including the FASB and the SEC, who create and interpret appropriate accounting standards. A change from current accounting standards couldhave a significant effect on the Company’s results of operations. In December 2004, the FASB issued new guidance that addresses the accounting for share-based payments, SFAS No. 123R. In April 2005, the SEC deferred the effective date of SFAS No. 123R to years beginning after June 15, 2005. Therefore, SFAS No. 123R will be effective for the Company beginning in its first quarter of fiscal 2006. TheCompany expects the adoption of SFAS No. 123R will result in a reduction of diluted earnings percommon share of approximately $0.03 for the first quarter of fiscal 2006. Although the effect from theadoption of SFAS No. 123R is expected to have a material impact on the Company’s results of operations, future changes to various assumptions used to determine the fair-value of awards issued or the amount andtype of equity awards granted create uncertainty as to the amount of future stock-based compensationexpense.
Changes in the Company’s tax rates could affect its future results. The Company’s future effective tax rates could be favorably or unfavorably affected by changes in the mix of earnings in countries with differing statutory tax rates, changes in the valuation of the Company’s deferred tax assets and liabilities, or by changes in tax laws or their interpretation. In addition, theCompany is subject to the continuous examination of its income tax returns by the Internal RevenueService and other tax authorities. The Company regularly assesses the likelihood of adverse outcomesresulting from these examinations to determine the adequacy of its provision for income taxes. There canbe no assurance that the outcomes from these continuous examinations will not have an adverse affect on the Company’s net income and financial condition.
The Company’s stock price may be volatile. The Company’s stock has at times experienced substantial price volatility as a result of variations betweenits actual and anticipated financial results and as a result of announcements by the Company and itscompetitors. The stock market has experienced extreme price and volume fluctuations that have affected the market price of many technology companies in ways that may have been unrelated to the operatingperformance of these companies. These factors, including lack of positive general economic and political conditions and investors’ concerns regarding the credibility of corporate financial reporting and integrity of financial markets, may materially adversely affect the market price of the Company’s stock in the future. Inaddition, increases in the Company’s stock price may result in greater dilution of earnings per share.

57
Item 7A. Quantitative and Qualitative Disclosures About Market Risk
Interest Rate and Foreign Currency Risk Management The Company regularly reviews its foreign exchange forward and option positions and its interest rate swap and option positions, both on a stand-alone basis and in conjunction with its underlying foreign currency and interest rate related exposures. However, given the effective horizons of the Company’s risk management activities and the anticipatory nature of the exposures, there can be no assurance the hedgeswill offset more than a portion of the financial impact resulting from movements in either foreign exchange or interest rates. In addition, the timing of the accounting for recognition of gains and losses related to mark-to-market instruments for any given period may not coincide with the timing of gains and losses related to the underlying economic exposures and, therefore, may adversely affect the Company’s operating results and financial position.
Interest Rate Risk While the Company is exposed to interest rate fluctuations in many of the world’s leading industrializedcountries, the Company’s interest income and expense is most sensitive to fluctuations in the general levelof U.S. interest rates. In this regard, changes in U.S. interest rates affect the interest earned on theCompany’s cash, cash equivalents, and short-term investments as well as costs associated with foreign currency hedges.
The Company’s short-term investment policy and strategy is to ensure the preservation of capital, meet liquidity requirements, and optimize return in light of the current credit and interest rate environment.The Company benchmarks its performance by utilizing external money managers to manage a smallportion of the aggregate investment portfolio. The external managers adhere to the Company’s investmentpolicies and also provide occasional research and market information that supplements internal researchused to make credit decisions in the investment process.
The Company’s exposure to market risk for changes in interest rates relates primarily to the Company’s investment portfolio. The Company places its short-term investments in highly liquid securities issued byhigh credit quality issuers and, by policy, limits the amount of credit exposure to any one issuer. TheCompany’s general policy is to limit the risk of principal loss and ensure the safety of invested funds by limiting market and credit risk. All highly liquid investments with maturities of three months or less are classified as cash equivalents; highly liquid investments with maturities greater than three months areclassified as short-term investments. As of September 24, 2005, approximately $287 million of theCompany’s short-term investments had underlying maturities ranging from 1 to 5 years. As of September 25, 2004, $180 million of the Company’s investment portfolio classified as short-terminvestments had maturities ranging from 1 to 5 years. The remainder all had underlying maturities between 3 and 12 months. The Company may sell its investments prior to their stated maturities, due to liquidityneeds, in anticipation of credit deterioration, or for duration management. The Company recognized a net loss before taxes of $137,000 in 2005, and net gains before taxes of $1 million and $21 million in 2004, and 2003, respectively as a result of such sales.
In order to provide a meaningful assessment of the interest rate risk associated with the Company’sinvestment portfolio, the Company performed a sensitivity analysis to determine the impact that a change in interest rates would have on the value of the investment portfolio assuming a 100 basis point parallel shift in the yield curve. Based on investment positions as of September 24, 2005, a hypothetical 100 basis point increase in interest rates across all maturities would result in a $19.9 million decline in the fair market value of the portfolio. As of September 25, 2004, a similar 100 basis point shift in the yield curve would have resulted in a $14.4 million decline in fair value. Such losses would only be realized if theCompany sold the investments prior to maturity. Except in instances noted above, the Company’s policy is to hold investments to maturity.

58
From time to time, the Company has entered into interest rate derivative transactions with financialinstitutions in order to better match the Company’s floating-rate interest income on its cash equivalents and short-term investments with its fixed-rate interest expense on its debt, and/or to diversify a portion of the Company’s exposure away from fluctuations in short-term U.S. interest rates. The Company did not enter into any interest rate derivatives during 2005 or 2004 and had no open interest rate derivatives at September 24, 2005.
Foreign Currency Risk In general, the Company is a net receiver of currencies other than the U.S. dollar. Accordingly, changes in exchange rates, and in particular a strengthening of the U.S. dollar, may negatively affect the Company’s net sales and gross margins as expressed in U.S. dollars. There is also a risk that the Company will have toadjust local currency product pricing due to competitive pressures when there has been significant volatility in foreign currency exchange rates.
The Company may enter into foreign currency forward and option contracts with financial institutions toprotect against foreign exchange risks associated with existing assets and liabilities, certain firmlycommitted transactions, forecasted future cash flows, and net investments in foreign subsidiaries. Generally, the Company’s practice is to hedge a majority of its existing material foreign exchangetransaction exposures. However, the Company may not hedge certain foreign exchange transactionexposures due to immateriality, prohibitive economic cost of hedging particular exposures, and limitedavailability of appropriate hedging instruments.
In order to provide a meaningful assessment of the foreign currency risk associated with certain of the Company’s foreign currency derivative positions, the Company performed a sensitivity analysis using a value-at-risk (VAR) model to assess the potential impact of fluctuations in exchange rates. The VAR model consisted of using a Monte Carlo simulation to generate 3000 random market price paths. The VAR is the maximum expected loss in fair value, for a given confidence interval, to the Company’s foreign exchange portfolio due to adverse movements in rates. The VAR model is not intended to represent actuallosses but is used as a risk estimation and management tool. The model assumes normal market conditions. Forecasted transactions, firm commitments, and assets and liabilities denominated in foreigncurrencies were excluded from the model. Based on the results of the model, the Company estimates with 95% confidence a maximum one-day loss in fair value of $10.0 million as of September 24, 2005 comparedto a maximum one-day loss of $3.2 million as of September 25, 2004. Because the Company uses foreign currency instruments for hedging purposes, losses incurred on those instruments are generally offset byincreases in the fair value of the underlying exposures.
Actual future gains and losses associated with the Company’s investment portfolio and derivative positions may differ materially from the sensitivity analyses performed as of September 24, 2005 due to the inherentlimitations associated with predicting the changes in the timing and amount of interest rates, foreign currency exchanges rates, and the Company’s actual exposures and positions.

59
Item 8. Financial Statements and Supplementary Data
Index to Consolidated Financial Statements PageFinancial Statements:
Consolidated Balance Sheets as of September 24, 2005 and September 25, 2004. . . . . . . . . . . . . . . . 60Consolidated Statements of Operations for the three fiscal years ended September 24, 2005 . . . . . 61Consolidated Statements of Shareholders’ Equity for the three fiscal years ended
September 24, 2005 . . . . . . . . . . . . . . . . . . . . . . . . . . . . . . . . . . . . . . . . . . . . . . . . . . . . . . . . . . . . . . . . . . 62Consolidated Statements of Cash Flows for the three fiscal years ended September 24, 2005 . . . . . 63Notes to Consolidated Financial Statements . . . . . . . . . . . . . . . . . . . . . . . . . . . . . . . . . . . . . . . . . . . . . . . 64Selected Quarterly Financial Information (Unaudited). . . . . . . . . . . . . . . . . . . . . . . . . . . . . . . . . . . . . . 97Reports of Independent Registered Public Accounting Firm, KPMG LLP. . . . . . . . . . . . . . . . . . . . . 98
All financial statement schedules have been omitted, since the required information is not applicable or is not present in amounts sufficient to require submission of the schedule, or because the information required is included in the Consolidated Financial Statements and Notes thereto.

60
CONSOLIDATED BALANCE SHEETS
(In millions, except share amounts)
September 24, 2005 September 25, 2004ASSETS:
Current assets: Cash and cash equivalents . . . . . . . . . . . . . . . . . . . . . . . . . . . . . . . . . . . $ 3,491 $2,969Short-term investments . . . . . . . . . . . . . . . . . . . . . . . . . . . . . . . . . . . . . 4,770 2,495Accounts receivable, less allowances of $46 and $47, respectively . 895 774Inventories . . . . . . . . . . . . . . . . . . . . . . . . . . . . . . . . . . . . . . . . . . . . . . . . 165 101Deferred tax assets . . . . . . . . . . . . . . . . . . . . . . . . . . . . . . . . . . . . . . . . . 331 231Other current assets . . . . . . . . . . . . . . . . . . . . . . . . . . . . . . . . . . . . . . . . 648 485
Total current assets. . . . . . . . . . . . . . . . . . . . . . . . . . . . . . . . . . . . . . . 10,300 7,055Property, plant, and equipment, net . . . . . . . . . . . . . . . . . . . . . . . . . . 817 707Goodwill . . . . . . . . . . . . . . . . . . . . . . . . . . . . . . . . . . . . . . . . . . . . . . . . . . 69 80Acquired intangible assets, net . . . . . . . . . . . . . . . . . . . . . . . . . . . . . . . 27 17Other assets . . . . . . . . . . . . . . . . . . . . . . . . . . . . . . . . . . . . . . . . . . . . . . . 338 191
Total assets. . . . . . . . . . . . . . . . . . . . . . . . . . . . . . . . . . . . . . . . . . . . . . $11,551 $8,050
LIABILITIES AND SHAREHOLDERS’ EQUITY:
Current liabilities: Accounts payable . . . . . . . . . . . . . . . . . . . . . . . . . . . . . . . . . . . . . . . . . . $ 1,779 $1,451Accrued expenses . . . . . . . . . . . . . . . . . . . . . . . . . . . . . . . . . . . . . . . . . . 1,705 1,200
Total current liabilities. . . . . . . . . . . . . . . . . . . . . . . . . . . . . . . . . . . . 3,484 2,651Non-current liabilities . . . . . . . . . . . . . . . . . . . . . . . . . . . . . . . . . . . . . . . . 601 323
Total liabilities. . . . . . . . . . . . . . . . . . . . . . . . . . . . . . . . . . . . . . . . . . . 4,085 2,974
Commitments and contingencies
Shareholders’ equity: Common stock, no par value; 1,800,000,000 shares authorized;
835,019,364 and 782,887,234 shares issued and outstanding, respectively. . . . . . . . . . . . . . . . . . . . . . . . . . . . . . . . . . . . . . . . . . . . . . 3,521 2,514
Deferred stock compensation . . . . . . . . . . . . . . . . . . . . . . . . . . . . . . . . (60) (93)Retained earnings . . . . . . . . . . . . . . . . . . . . . . . . . . . . . . . . . . . . . . . . . . 4,005 2,670Accumulated other comprehensive income (loss). . . . . . . . . . . . . . . — (15)
Total shareholders’ equity . . . . . . . . . . . . . . . . . . . . . . . . . . . . . . . . . 7,466 5,076Total liabilities and shareholders’ equity . . . . . . . . . . . . . . . . . . . . $11,551 $8,050
See accompanying notes to consolidated financial statements.

61
CONSOLIDATED STATEMENTS OF OPERATIONS
(In millions, except share and per share amounts)
Three fiscal years ended September 24, 2005 2005 2004 2003Net sales . . . . . . . . . . . . . . . . . . . . . . . . . . . . . . . . . . . . . . . . . . . . . . . . . . . . . $ 13,931 $ 8,279 $ 6,207Cost of sales . . . . . . . . . . . . . . . . . . . . . . . . . . . . . . . . . . . . . . . . . . . . . . . . . . 9,888 6,020 4,499
Gross margin . . . . . . . . . . . . . . . . . . . . . . . . . . . . . . . . . . . . . . . . . . . . . . . 4,043 2,259 1,708Operating expenses:
Research and development . . . . . . . . . . . . . . . . . . . . . . . . . . . . . . . . . . . 534 489 471Selling, general, and administrative . . . . . . . . . . . . . . . . . . . . . . . . . . . . 1,859 1,421 1,212Restructuring costs . . . . . . . . . . . . . . . . . . . . . . . . . . . . . . . . . . . . . . . . . . — 23 26
Total operating expenses. . . . . . . . . . . . . . . . . . . . . . . . . . . . . . . 2,393 1,933 1,709Operating income (loss). . . . . . . . . . . . . . . . . . . . . . . . . . . . . . . . . . . . . . . . 1,650 326 (1)
Other income and expense: Gains on non-current investments, net . . . . . . . . . . . . . . . . . . . . . . . . . — 4 10Interest and other income, net . . . . . . . . . . . . . . . . . . . . . . . . . . . . . . . . 165 53 83
Total other income and expense . . . . . . . . . . . . . . . . . . . . . . . . 165 57 93Income before provision for income taxes . . . . . . . . . . . . . . . . . . . . . . . . 1,815 383 92Provision for income taxes. . . . . . . . . . . . . . . . . . . . . . . . . . . . . . . . . . . . . . 480 107 24Income before accounting changes . . . . . . . . . . . . . . . . . . . . . . . . . . . . . . 1,335 276 68Cumulative effects of accounting changes, net of income taxes . . . . . . — — 1Net income . . . . . . . . . . . . . . . . . . . . . . . . . . . . . . . . . . . . . . . . . . . . . . . . . . . $ 1,335 $ 276 $ 69
Earnings per common share before accounting changes: Basic . . . . . . . . . . . . . . . . . . . . . . . . . . . . . . . . . . . . . . . . . . . . . . . . . . $ 1.65 $ 0.37 $ 0.09Diluted . . . . . . . . . . . . . . . . . . . . . . . . . . . . . . . . . . . . . . . . . . . . . . . . $ 1.56 $ 0.36 $ 0.09
Earnings per common share: Basic . . . . . . . . . . . . . . . . . . . . . . . . . . . . . . . . . . . . . . . . . . . . . . . . . . $ 1.65 $ 0.37 $ 0.10Diluted . . . . . . . . . . . . . . . . . . . . . . . . . . . . . . . . . . . . . . . . . . . . . . . . $ 1.56 $ 0.36 $ 0.09
Shares used in computing earnings per share (in thousands): Basic . . . . . . . . . . . . . . . . . . . . . . . . . . . . . . . . . . . . . . . . . . . . . . . . . . 808,439 743,180 721,262Diluted . . . . . . . . . . . . . . . . . . . . . . . . . . . . . . . . . . . . . . . . . . . . . . . . 856,780 774,622 726,932
See accompanying notes to consolidated financial statements.

62
CONSOLIDATED STATEMENTS OF SHAREHOLDERS’ EQUITY
(In millions, except share amounts which are in thousands)
Accumulated Other Total
Common Stock Deferred Stock Retained Comprehensive Shareholders’Shares Amount Compensation Earnings Income (Loss) Equity
Balances as of September 28, 2002 . . . . . . . . . 717,918 $1,826 $ (7) $2,325 $(49) $4,095Components of comprehensive income:
Net income . . . . . . . . . . . . . . . . . . . . . . . — — — 69 — 69Change in foreign currency translation . . — — — — 31 31Change in unrealized gain on available-
for-sale securities, net of tax . . . . . . . . — — — — (12) (12)Change in unrealized gain on derivative
investments, net of tax . . . . . . . . . . . . . — — — — (5 ) (5) Total comprehensive income. . . . . . . . 83
Amortization of deferred stock compensation . . . . . . . . . . . . . . . . . . . . . — — 15 — — 15
Write-off of deferred stock compensation . . . . . . . . . . . . . . . . . . . . . — — 5 — — 5
Common stock issued under stock plans . . 18,598 128 (75) — — 53Settlement of forward purchase
agreement . . . . . . . . . . . . . . . . . . . . . . . . (3,062) (35) — — — (35)Tax benefit related to stock options . . . . . . — 7 — — — 7
Balances as of September 27, 2003 . . . . . . . . . 733,454 $1,926 $(62) $2,394 $(35) $4,223Components of comprehensive income:
Net income . . . . . . . . . . . . . . . . . . . . . . . — — — 276 — 276Change in foreign currency translation . . — — — — 13 13Change in unrealized gain on available-
for-sale securities, net of tax . . . . . . . . — — — — (5) (5)Change in unrealized loss on derivative
investments, net of tax . . . . . . . . . . . . . — — — — 12 12Total comprehensive income. . . . . . . . 296
Issuance of restricted stock units . . . . . . . . — 64 (64) — — —Adjustment to common stock related to a
prior year acquisition . . . . . . . . . . . . . . . (159) (2) — — — (2) Amortization of deferred stock
compensation . . . . . . . . . . . . . . . . . . . . . — — 33 — — 33Common stock issued under stock plans . . 49,592 427 — — — 427Tax benefit related to stock options . . . . . . — 99 — — — 99
Balances as of September 25, 2004 . . . . . . . . . 782,887 $2,514 $(93) $2,670 $(15) $5,076Components of comprehensive income:
Net income . . . . . . . . . . . . . . . . . . . . . . . — — — 1,335 — 1,335Change in foreign currency translation . . — — — — 7 7Change in unrealized gain on derivative
investments, net of tax . . . . . . . . . . . . . — — — — 8 8 Total comprehensive income. . . . . . . . 1,350
Issuance of restricted stock units, net . . . . . — 7 (7) — — —Amortization of deferred stock
compensation . . . . . . . . . . . . . . . . . . . . . — — 40 — — 40Common stock issued under stock plans . . 52,132 547 — — — 547Tax benefit related to stock options . . . . . . — 453 — — — 453
Balances as of September 24, 2005 . . . . . . . . . 835,019 $3,521 $(60) $4,005 $ — $7,466
See accompanying notes to consolidated financial statements.

63
CONSOLIDATED STATEMENTS OF CASH FLOWS
(In millions)
Three fiscal years ended September 24, 2005 2005 2004 2003Cash and cash equivalents, beginning of the year . . . . . . . . . . . . . . . . . . . . . $ 2,969 $ 3,396 $ 2,252Operating Activities:Net income . . . . . . . . . . . . . . . . . . . . . . . . . . . . . . . . . . . . . . . . . . . . . . . . . . . . . . 1,335 276 69Cumulative effects of accounting changes, net of taxes . . . . . . . . . . . . . . . . — — (1)Adjustments to reconcile net income to cash generated by operating
activities: Depreciation, amortization and accretion . . . . . . . . . . . . . . . . . . . . . . . . . 179 150 113Stock-based compensation expense . . . . . . . . . . . . . . . . . . . . . . . . . . . . . . . 42 33 16Non-cash restructuring. . . . . . . . . . . . . . . . . . . . . . . . . . . . . . . . . . . . . . . . . . — 5 12Provision for (benefit from) deferred income taxes . . . . . . . . . . . . . . . . . 52 20 (11)Tax benefit from stock options . . . . . . . . . . . . . . . . . . . . . . . . . . . . . . . . . . . 453 99 7Loss on disposition of property, plant, and equipment . . . . . . . . . . . . . . 9 7 2Gains on sales of short-term investments, net . . . . . . . . . . . . . . . . . . . . . . — (1 ) (21)Gains on non-current investments, net . . . . . . . . . . . . . . . . . . . . . . . . . . . . — (4 ) (10)Gain on forward purchase agreement . . . . . . . . . . . . . . . . . . . . . . . . . . . . . — — (6)
Changes in operating assets and liabilities:Accounts receivable . . . . . . . . . . . . . . . . . . . . . . . . . . . . . . . . . . . . . . . . . . . . (121) (8 ) (201)Inventories . . . . . . . . . . . . . . . . . . . . . . . . . . . . . . . . . . . . . . . . . . . . . . . . . . . . (64) (45 ) (11)Other current assets . . . . . . . . . . . . . . . . . . . . . . . . . . . . . . . . . . . . . . . . . . . . (150) (176 ) (34)Other assets . . . . . . . . . . . . . . . . . . . . . . . . . . . . . . . . . . . . . . . . . . . . . . . . . . . (61) (39 ) (30)Accounts payable . . . . . . . . . . . . . . . . . . . . . . . . . . . . . . . . . . . . . . . . . . . . . . 328 297 243Other liabilities . . . . . . . . . . . . . . . . . . . . . . . . . . . . . . . . . . . . . . . . . . . . . . . . 533 320 152
Cash generated by operating activities . . . . . . . . . . . . . . . . . . . . . . . . . . 2,535 934 289
Investing Activities: Purchases of short-term investments . . . . . . . . . . . . . . . . . . . . . . . . . . . . . . . . (11,470) (3,270 ) (2,648)Proceeds from maturities of short-term investments . . . . . . . . . . . . . . . . . . 8,609 1,141 2,446Proceeds from sales of short-term investments . . . . . . . . . . . . . . . . . . . . . . . 586 801 1,116Proceeds from sales of non-current investments . . . . . . . . . . . . . . . . . . . . . . — 5 45Purchases of property, plant, and equipment. . . . . . . . . . . . . . . . . . . . . . . . . (260) (176 ) (164)Other . . . . . . . . . . . . . . . . . . . . . . . . . . . . . . . . . . . . . . . . . . . . . . . . . . . . . . . . . . . (21) 11 33
Cash (used for) generated by investing activities . . . . . . . . . . . . . . . . . (2,556) (1,488 ) 828
Financing Activities: Payment of long-term debt . . . . . . . . . . . . . . . . . . . . . . . . . . . . . . . . . . . . . . . . — (300 ) —Proceeds from issuance of common stock. . . . . . . . . . . . . . . . . . . . . . . . . . . . 543 427 53Cash used for repurchase of common stock . . . . . . . . . . . . . . . . . . . . . . . . . . — — (26)
Cash generated by financing activities. . . . . . . . . . . . . . . . . . . . . . . . . . . 543 127 27Increase (decrease) in cash and cash equivalents . . . . . . . . . . . . . . . . . . . . . 522 (427 ) 1,144Cash and cash equivalents, end of the year. . . . . . . . . . . . . . . . . . . . . . . . . . . $ 3,491 $ 2,969 $ 3,396
Supplemental cash flow disclosures: Cash paid during the year for interest . . . . . . . . . . . . . . . . . . . . . . . . . . . . . $ — $ 10 $ 20Cash paid (received) for income taxes, net. . . . . . . . . . . . . . . . . . . . . . . . . $ 17 $ (7 ) $ 45
See accompanying notes to consolidated financial statements.

NOTES TO CONSOLIDATED FINANCIAL STATEMENTS
64
Note 1—Summary of Significant Accounting Policies
Apple Computer, Inc. and its subsidiaries (the Company) designs, manufactures, and markets personal computers and related software, services, peripherals, and networking solutions. The Company also designs, develops, and markets a line of portable digital music players along with related accessories andservices including the online distribution of third-party music, audio books, music videos, short films, and television shows. The Company sells its products worldwide through its online stores, its own retail stores, its direct sales force, and third-party wholesalers, resellers, and value-added resellers. In addition to its own hardware, software, and peripheral products, the Company sells a variety of third-party hardware andsoftware products through its online and retail stores. The Company sells to education, consumer, creativeprofessional, business, and government customers.
Basis of Presentation and Preparation The accompanying consolidated financial statements include the accounts of the Company. Intercompanyaccounts and transactions have been eliminated. The preparation of these consolidated financialstatements in conformity with U.S. generally accepted accounting principles requires management to makeestimates and assumptions that affect the amounts reported in these consolidated financial statements and accompanying notes. Actual results could differ materially from those estimates. Certain prior year amounts in the consolidated financial statements and notes thereto have been reclassified to conform to the current year presentation.
Typically, the Company’s fiscal year ends on the last Saturday of September. Fiscal years 2005, 2004, and2003 were each 52-week years. However, approximately every six years, the Company reports a 53-week fiscal year to align its fiscal quarters with calendar quarters by adding a week to its first fiscal quarter. The Company will add this additional week in the first fiscal quarter of its fiscal year 2006. All informationpresented herein is based on the Company’s fiscal calendar.
Common Stock Split On February 28, 2005, the Company effected a two-for-one stock split to shareholders of record as of February 18, 2005. All share and per share information has been retroactively adjusted to reflect the stocksplit.
Financial Instruments
Cash Equivalents and Short-term Investments All highly liquid investments with maturities of three months or less at the date of purchase are classified as cash equivalents. Highly liquid investments with maturities greater than three months are classified as short-term investments. The Company’s debt and marketable equity securities have been classified andaccounted for as available-for-sale. Management determines the appropriate classification of itsinvestments in debt and marketable equity securities at the time of purchase and reevaluatesavailable-for-sale designation as of each balance sheet date. These securities are carried at fair value, with the unrealized gains and losses, net of taxes, reported as a component of shareholders’ equity. The cost of securities sold is based upon the specific identification method.
Derivative Financial Instruments The Company accounts for its derivative instruments as either assets or liabilities and carries them at fair value. Derivatives that are not defined as hedges in SFAS 133, Accounting for Derivative Instruments and Hedging Activities, must be adjusted to fair value through earnings. If the derivative is a hedge, dependingon the nature of the hedge, changes in fair value will either be offset against the change in fair value of the

NOTES TO CONSOLIDATED FINANCIAL STATEMENTS (Continued)
65
Note 1—Summary of Significant Accounting Policies (Continued)
hedged assets, liabilities, or firm commitments through earnings, or recognized in other comprehensiveincome until the hedged item is recognized in earnings.
For derivative instruments that hedge the exposure to variability in expected future cash flows that are designated as cash flow hedges, the net gain or loss on the derivative instrument is reported as a component of accumulated other comprehensive income in shareholders’ equity and reclassified into earnings in the same period or periods during which the hedged transaction affects earnings. To receive hedge accounting treatment, cash flow hedges must be highly effective in offsetting changes to expectedfuture cash flows on hedged transactions. For derivative instruments that hedge the exposure to changes inthe fair value of an asset or a liability and that are designated as fair value hedges, the net gain or loss on the derivative instrument as well as the offsetting gain or loss on the hedged item attributable to the hedged risk are recognized in earnings in the current period. The net gain or loss on the effective portion of a derivative instrument that is designated as an economic hedge of the foreign currency translation exposure of the net investment in a foreign operation is reported in the same manner as a foreign currency translation adjustment. For forward contracts designated as net investment hedges, the Company excludes changes in fair value relating to changes in the forward carry component from its definition ofeffectiveness. Accordingly, any gains or losses related to this component are recognized in currentearnings.
The Company may enter into foreign currency forward contracts to hedge the translation and economic exposure of a net investment position in a foreign subsidiary. For such contracts, hedge effectiveness is measured based on changes in the fair value of the contract attributable to changes in the spot exchange rate. The effective portion of the net gain or loss on a derivative instrument designated as a hedge of the net investment position in a foreign subsidiary is reported in the same manner as a foreign currencytranslation adjustment. Any residual changes in fair value of the forward contract, including changes in fair value based on the differential between the spot and forward exchange rates, are recognized in currentearnings in other income and expense.
Inventories Inventories are stated at the lower of cost, computed using the first-in, first-out method, or market. If the cost of the inventories exceeds their market value, provisions are made currently for the difference between the cost and the market value. The Company’s inventories consist primarily of finished goods forall periods presented.
Property, Plant, and Equipment Property, plant, and equipment are stated at cost. Depreciation is computed by use of the straight-linemethod over the estimated useful lives of the assets, which are 30 years for buildings, up to 5 years for equipment, and the shorter of lease terms or 10 years for leasehold improvements. The Company capitalizes eligible costs to acquire or develop internal-use software that are incurred subsequent to the preliminary project stage. Capitalized costs related to internal-use software are amortized using the straight-line method over the estimated useful lives of the assets, which range from 3 to 5 years. Depreciation and amortization expense on property and equipment was $141 million, $126 million, and $108 million during 2005, 2004, and 2003, respectively.

NOTES TO CONSOLIDATED FINANCIAL STATEMENTS (Continued)
66
Note 1—Summary of Significant Accounting Policies (Continued)
Asset Retirement Obligations The Company records obligations associated with the retirement of tangible long-lived assets and theassociated asset retirement costs in accordance with SFAS No. 143, Accounting for Asset Retirement Obligations. The Company reviews legal obligations associated with the retirement of long-lived assets thatresult from the acquisition, construction, development and/or normal use of the assets. If it is determined that a legal obligation exists, the fair value of the liability for an asset retirement obligation is recognized in the period in which it is incurred if a reasonable estimate of fair value can be made. The fair value of theliability is added to the carrying amount of the associated asset and this additional carrying amount isdepreciated over the life of the asset. The difference between the gross expected future cash flow and its present value is accreted over the life of the related lease as an operating expense. All of the Company’s existing asset retirement obligations are associated with commitments to return property subject tooperating leases to original condition upon lease termination.
The following table reconciles changes in the Company’s asset retirement liabilities for fiscal 2004 and 2005 (in millions):
Asset retirement liability as of September 27, 2003 . . . . . . . . . . . . . . . . . . . . . . . . . $ 7.2Additional asset retirement obligations recognized . . . . . . . . . . . . . . . . . . . . . . . 0.5Accretion recognized. . . . . . . . . . . . . . . . . . . . . . . . . . . . . . . . . . . . . . . . . . . . . . . . . 0.5
Asset retirement liability as of September 25, 2004 . . . . . . . . . . . . . . . . . . . . . . . . . $ 8.2Additional asset retirement obligations recognized . . . . . . . . . . . . . . . . . . . . . . . 2.8Accretion recognized. . . . . . . . . . . . . . . . . . . . . . . . . . . . . . . . . . . . . . . . . . . . . . . . . 0.7
Asset retirement liability as of September 24, 2005 . . . . . . . . . . . . . . . . . . . . . . . . . $11.7
Cumulative Effects of Accounting Changes In 2003, the Company recognized a net favorable cumulative effect type adjustment of approximately$1 million from the adoption of SFAS No. 150, Accounting for Certain Financial Instruments withCharacteristic of Both Liabilities and Equity and SFAS No. 143.
Long-Lived Assets Including Goodwill and Other Acquired Intangible Assets The Company reviews property, plant, and equipment and certain identifiable intangibles, excluding goodwill, for impairment whenever events or changes in circumstances indicate the carrying amount of anasset may not be recoverable. Recoverability of these assets is measured by comparison of its carryingamount to future undiscounted cash flows the assets are expected to generate. If property, plant, andequipment and certain identifiable intangibles are considered to be impaired, the impairment to be recognized equals the amount by which the carrying value of the assets exceeds its fair market value. For the three fiscal years ended September 24, 2005, the Company had no material impairment of its long-livedassets, except for the impairment of certain assets in connection with the restructuring actions described in Note 5 of these Notes to Consolidated Financial Statements.
SFAS No. 142, Goodwill and Other Intangible Assets requires that goodwill and intangible assets with indefinite useful lives should not be amortized but rather be tested for impairment at least annually orsooner whenever events or changes in circumstances indicate that they may be impaired. The Companyperforms its goodwill impairment tests on or about August 30 of each year. The Company did not recognize any goodwill or intangible asset impairment charges in 2005, 2004, or 2003. The Company established reporting units based on its current reporting structure. For purposes of testing goodwill for

NOTES TO CONSOLIDATED FINANCIAL STATEMENTS (Continued)
67
Note 1—Summary of Significant Accounting Policies (Continued)
impairment, goodwill has been allocated to these reporting units to the extent it relates to each reporting unit.SFAS No. 142 also requires that intangible assets with definite lives be amortized over their estimateduseful lives and reviewed for impairment in accordance with SFAS No. 144, Accounting for the Impairmentof Long-Lived Assets and for Long-Lived Assets to Be Disposed Of. The Company is currently amortizing its acquired intangible assets with definite lives over periods ranging from 3 to 10 years.
Foreign Currency Translation The Company translates the assets and liabilities of its international non-U.S. functional currencysubsidiaries into U.S. dollars using exchange rates in effect at the end of each period. Revenue andexpenses for these subsidiaries are translated using rates that approximate those in effect during the period. Gains and losses from these translations are credited or charged to foreign currency translationincluded in “accumulated other comprehensive income (loss)” in shareholders’ equity. The Company’s foreign manufacturing subsidiaries and certain other international subsidiaries that use the U.S. dollar astheir functional currency remeasure monetary assets and liabilities at exchange rates in effect at the end of each period, and inventories, property, and nonmonetary assets and liabilities at historical rates. Gains andlosses from these translations were insignificant and have been included in the Company’s results of operations.
Revenue Recognition Net sales consist primarily of revenue from the sale of hardware, software, peripherals, digital content, and service and support contracts. The Company recognizes revenue pursuant to applicable accountingstandards, including Statement of Position (SOP) No. 97-2, Software Revenue Recognition, as amended, and Securities and Exchange Commission (SEC) Staff Accounting Bulletin (SAB) No. 104, RevenueRecognition.
The Company recognizes revenue when persuasive evidence of an arrangement exists, delivery has occurred, the sales price is fixed or determinable, and collection is probable. Product is considereddelivered to the customer once it has been shipped and title and risk of loss have been transferred. For most of the Company’s product sales, these criteria are met at the time the product is shipped. For onlinesales to individuals, for some sales to education customers in the U.S., and for certain other sales, the Company defers revenue until the customer receives the product because the Company legally retains aportion of the risk of loss on these sales during transit. If at the outset of an arrangement the Companydetermines the arrangement fee is not, or is presumed to not be, fixed or determinable, revenue is deferred and subsequently recognized as amounts become due and payable.
Revenue from service and support contracts is deferred and recognized ratably over the service coverageperiods. These contracts typically include extended phone support, repair services, web-based supportresources, diagnostic tools, and extend the service coverage offered under the Company’s one-year limitedwarranty.
The Company sells software and peripheral products obtained from other companies. The Companyestablishes its own pricing and retains related inventory risk, is the primary obligor in sales transactionswith its customers, and assumes the credit risk for amounts billed to its customers. Accordingly, the Company recognizes revenue for the sale of products obtained from other companies at the gross amountbilled.

NOTES TO CONSOLIDATED FINANCIAL STATEMENTS (Continued)
68
Note 1—Summary of Significant Accounting Policies (Continued)
Revenue on arrangements that include multiple elements such as hardware, software, and services is allocated to each element based on the relative fair value of each element. Each element’s allocatedrevenue is recognized when revenue recognition criteria for that element has been met. Fair value is generally determined by vendor specific objective evidence (VSOE), which is based on the price chargedwhen each element is sold separately. If the Company cannot objectively determine the fair value of anyundelivered element included in a multiple-element arrangement, the Company defers revenue until allelements are delivered and services have been performed, or until fair value can objectively be determinedfor any remaining undelivered elements. When the fair value of a delivered element has not beenestablished, the Company uses the residual method to recognize revenue if the fair value of all undeliveredelements is determinable. Under the residual method, the fair value of the undelivered elements is deferred and the remaining portion of the arrangement fee is allocated to the delivered elements and is recognized as revenue.
The Company records reductions to revenue for estimated commitments related to price protection and for customer incentive programs, including reseller and end user rebates, and other sales programs and volume-based incentives. The estimated cost of these programs is accrued as a reduction to revenue in the period the Company has sold the product and committed to a plan. The Company also records reductions to revenue for expected future product returns based on the Company’s historical experience.
Generally, the Company does not offer specified or unspecified upgrade rights to its customers in connection with software sales or the sale of extended warranty and support contracts. When the Company does offer specified upgrade rights, the Company defers revenue for the fair value of the specified upgrade right until the future obligation is fulfilled or when the right to the specified upgrade expires. Additionally,a limited number of the Company’s software products are available with maintenance agreements that grant customers rights to unspecified future upgrades over the maintenance term on a when and if available basis. Revenue associated with such maintenance is recognized ratably over the maintenance term.
Allowance for Doubtful Accounts The Company records its allowance for doubtful accounts based upon its assessment of various factors. The Company considers historical experience, the age of the accounts receivable balances, credit quality ofthe Company’s customers, current economic conditions and other factors that may affect customers’ ability to pay.
Shipping Costs The Company’s shipping and handling costs are included in cost of sales for all periods presented.
Warranty Expense The Company provides currently for the estimated cost for product warranties at the time the relatedrevenue is recognized. The Company assesses the adequacy of its preexisting warranty liabilities and adjusts the amounts as necessary based on actual experience and changes in future estimates.
Software Development Costs Research and development costs are expensed as incurred. Development costs of computer software to be sold, leased, or otherwise marketed are subject to capitalization beginning when a product’s technologicalfeasibility has been established and ending when a product is available for general release to customers

NOTES TO CONSOLIDATED FINANCIAL STATEMENTS (Continued)
69
Note 1—Summary of Significant Accounting Policies (Continued)
pursuant to SFAS No. 86, Computer Software to be Sold, Leased, or Otherwise Marketed. In most instances,the Company’s products are released soon after technological feasibility has been established. Therefore, costs incurred subsequent to achievement of technological feasibility are usually not significant, and generally all software development costs have been expensed.
In the fourth quarter of 2004, the Company began incurring substantial development costs associated withMac OS X version 10.4 Tiger subsequent to achievement of technological feasibility as evidenced by public demonstration in August 2004 and the subsequent release of a developer beta version of the product. The Company capitalized approximately $29.7 and $4.5 million during 2005 and 2004, respectively, of costs associated with the development of Tiger. In accordance with SFAS No. 86, amortization of this asset tocost of sales began in April 2005 when the Company began shipping Tiger and is being recognized on a straight-line basis over a 3 year estimated useful life.
During the second quarter of 2004, the Company incurred substantial development costs associated with FileMaker Pro 7 subsequent to achievement of technological feasibility as evidenced by publicdemonstration and release of a developer beta version, and prior to the release of the final version of theproduct in March 2004. Therefore, during the second quarter of 2004, the Company capitalizedapproximately $2.3 million of costs associated with the development of FileMaker Pro 7. In accordance with SFAS No. 86, amortization of this asset to cost of sales began in March 2004 when the Companybegan shipping FileMaker Pro 7 and is being recognized on a straight-line basis over a 3 year estimated useful life.
During the third and fourth quarters of 2003, the Company incurred substantial development costs associated with the development of Mac OS X version 10.3 (code-named “Panther”), subsequent toachievement of technological feasibility as evidenced by public demonstration and release of a developerbeta in June 2003, and prior to release of the final version of the product in the first quarter of 2004. Therefore, during 2003 the Company capitalized approximately $14.7 million of development costs associated with the development of Panther. Amortization of this asset began in the first quarter of 2004when Panther was shipped and is being recognized on a straight-line basis in accordance with SFAS No. 86 over a 3 year estimated useful life.
Total amortization related to capitalized software development costs was $15.7 million, $10.7 million, and$5.8 million in 2005, 2004, and 2003, respectively.
Advertising Costs Advertising costs are expensed as incurred. Advertising expense was $287 million, $206 million, and$193 million for 2005, 2004, and 2003, respectively.
Stock-Based CompensationThe Company currently measures compensation expense for its employee stock-based compensation plans using the intrinsic value method prescribed by Accounting Principles Board (APB) Opinion No. 25,Accounting for Stock Issued to Employees. The Company applies the disclosure provisions of SFAS No. 123, Accounting for Stock-based Compensation, as amended by SFAS No. 148, Accounting for Stock-basedCompensation—Transition and Disclosure as if the fair-value-based method had been applied in measuringcompensation expense. Under APB Opinion No. 25, when the exercise price of the Company’s employeestock options equals the market price of the underlying stock on the date of the grant, no compensation expense is recognized.

NOTES TO CONSOLIDATED FINANCIAL STATEMENTS (Continued)
70
Note 1—Summary of Significant Accounting Policies (Continued)
As required under SFAS No. 123, the pro forma effects of stock-based compensation on net income and earnings per common share for employee stock options granted and employee stock purchase plan share purchases have been estimated at the date of grant and beginning of the period, respectively, using a Black-Scholes option pricing model. For purposes of pro forma disclosures, the estimated fair value of the options and shares is amortized to pro forma net income over the options’ vesting period and the shares’ plan period.
The Company’s pro forma information for each of the last three fiscal years follows (in millions, except pershare amounts):
2005 2004 2003Net income—as reported . . . . . . . . . . . . . . . . . . . . . . . . . . . . . . . . . . . . . $1,335 $ 276 $ 69Add: Stock-based employee compensation expense included in
reported net income, net of tax . . . . . . . . . . . . . . . . . . . . . . . . . . . . . . 38 33 15Deduct: Stock-based employee compensation expense determined
under the fair value based method for all awards, net of tax. . . . . . (114) (141) (181)Net income (loss)—pro forma . . . . . . . . . . . . . . . . . . . . . . . . . . . . . . . . . $1,259 $ 168 $ (97)
Net income per common share—as reported Basic . . . . . . . . . . . . . . . . . . . . . . . . . . . . . . . . . . . . . . . . . . . . . . . . . . . . . $ 1.65 $ 0.37 $ 0.10Diluted . . . . . . . . . . . . . . . . . . . . . . . . . . . . . . . . . . . . . . . . . . . . . . . . . . . $ 1.56 $ 0.36 $ 0.09
Net income (loss) per common share—pro forma Basic . . . . . . . . . . . . . . . . . . . . . . . . . . . . . . . . . . . . . . . . . . . . . . . . . . . . . $ 1.56 $ 0.23 $ (0.13)Diluted . . . . . . . . . . . . . . . . . . . . . . . . . . . . . . . . . . . . . . . . . . . . . . . . . . . $ 1.47 $ 0.22 $ (0.13)
In December 2004, the FASB issued SFAS No. 123 (revised 2004) (SFAS No. 123R), Share-Based Payment, which addresses the accounting for share-based payment transactions in which an enterprise receives employee services in exchange for (a) equity instruments of the enterprise or (b) liabilities that are based on the fair value of the enterprise’s equity instruments or that may be settled by the issuance of suchequity instruments. SFAS No. 123R eliminates the ability to account for share-based compensation transactions using the intrinsic value method under APB Opinion No. 25, and requires instead that suchtransactions be accounted for using a fair-value-based method. In January 2005, the SEC issuedSAB No. 107, which provides supplemental implementation guidance for SFAS No. 123R. SFAS No. 123Rwill be effective for the Company beginning in the first quarter of its fiscal 2006. The Company’s assessment of the estimated stock-based compensation expense is affected by the Company’s stock price aswell as assumptions regarding a number of complex variables and the related tax impact. These variables include, but are not limited to, the Company’s stock price, volatility, and employee stock option exercisebehaviors and the related tax impact. The Company will recognize stock-based compensation expense onall awards on a straight-line basis over the requisite service period using the modified prospective method. Although the adoption of SFAS No. 123R is expected to have a material effect on the Company’s results of operations, future changes to various assumptions used to determine the fair-value of awards issued or the amount and type of equity awards granted create uncertainty as to whether future stock-basedcompensation expense will be similar to the historical SFAS No. 123 pro forma expense.

NOTES TO CONSOLIDATED FINANCIAL STATEMENTS (Continued)
71
Note 1—Summary of Significant Accounting Policies (Continued)
Earnings Per Common Share Basic earnings per common share is computed by dividing income available to common shareholders by the weighted-average number of shares of common stock outstanding during the period. Diluted earnings per common share is computed by dividing income available to common shareholders by theweighted-average number of shares of common stock outstanding during the period increased to include the number of additional shares of common stock that would have been outstanding if the dilutivepotential shares of common stock had been issued. The dilutive effect of outstanding options, restricted stock and restricted stock units is reflected in diluted earnings per share by application of the treasurystock method. Under the treasury stock method, an increase in the fair market value of the Company’s common stock can result in a greater dilutive effect from outstanding options, restricted stock and restricted stock units. Additionally, the exercise of employee stock options and the vesting of restricted stock and restricted stock units can result in a greater dilutive effect on earnings per share.
The following table sets forth the computation of basic and diluted earnings per share:
2005 2004 2003Numerator (in millions):
Income before accounting changes . . . . . . . . . . . . . . . . . . . . . . . . . . . . . . $ 1,335 $ 276 $ 68Cumulative effects of accounting changes, net of tax . . . . . . . . . . . . . . . — — 1Net income. . . . . . . . . . . . . . . . . . . . . . . . . . . . . . . . . . . . . . . . . . . . . . . . . . . $ 1,335 $ 276 $ 69
Denominator (in thousands): Weighted-average shares outstanding, excluding unvested
restricted stock . . . . . . . . . . . . . . . . . . . . . . . . . . . . . . . . . . . . . . . . . . . . . 808,439 743,180 721,262Effect of dilutive options, restricted stock units and restricted stock. . 48,341 31,442 5,670Denominator for diluted earnings per share . . . . . . . . . . . . . . . . . . . . . . 856,780 774,622 726,932
Basic earnings per share before accounting changes . . . . . . . . . . . . . . . . . $ 1.65 $ 0.37 $ 0.09Basic earnings per share after accounting changes . . . . . . . . . . . . . . . . . . . $ 1.65 $ 0.37 $ 0.10Diluted earnings per share before accounting changes . . . . . . . . . . . . . . . $ 1.56 $ 0.36 $ 0.09Diluted earnings per share after accounting changes . . . . . . . . . . . . . . . . . $ 1.56 $ 0.36 $ 0.09
Potentially dilutive securities representing approximately 12.4 million, 8.7 million, and 101.6 million shares of common stock for the years ended September 24, 2005, September 25, 2004, and September 27, 2003, respectively, were excluded from the computation of diluted earnings per share for these periods because their effect would have been antidilutive. These potentially dilutive securities include stock options, restricted stock, and restricted stock units.
Comprehensive IncomeComprehensive income consists of two components, net income and other comprehensive income. Other comprehensive income refers to revenue, expenses, gains and losses that under generally acceptedaccounting principles are recorded as an element of shareholders’ equity but are excluded from netincome. The Company’s other comprehensive income is comprised of foreign currency translationadjustments from those subsidiaries not using the U.S. dollar as their functional currency, unrealized gains and losses on marketable securities categorized as available-for-sale, and net deferred gains and losses on certain derivative instruments accounted for as cash flow hedges.
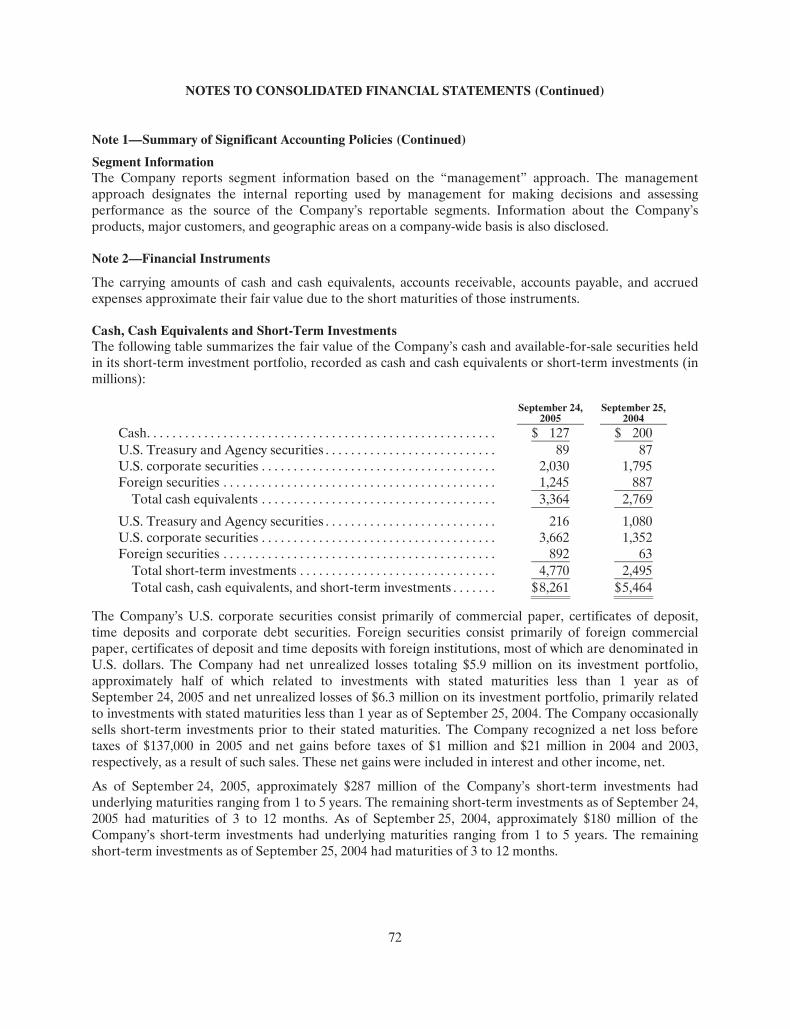
NOTES TO CONSOLIDATED FINANCIAL STATEMENTS (Continued)
72
Note 1—Summary of Significant Accounting Policies (Continued)
Segment Information The Company reports segment information based on the “management” approach. The managementapproach designates the internal reporting used by management for making decisions and assessingperformance as the source of the Company’s reportable segments. Information about the Company’s products, major customers, and geographic areas on a company-wide basis is also disclosed.
Note 2—Financial Instruments
The carrying amounts of cash and cash equivalents, accounts receivable, accounts payable, and accruedexpenses approximate their fair value due to the short maturities of those instruments.
Cash, Cash Equivalents and Short-Term InvestmentsThe following table summarizes the fair value of the Company’s cash and available-for-sale securities held in its short-term investment portfolio, recorded as cash and cash equivalents or short-term investments (in millions):
September 24, 2005
September 25,2004
Cash. . . . . . . . . . . . . . . . . . . . . . . . . . . . . . . . . . . . . . . . . . . . . . . . . . . . . . . $ 127 $ 200 U.S. Treasury and Agency securities . . . . . . . . . . . . . . . . . . . . . . . . . . . 89 87U.S. corporate securities . . . . . . . . . . . . . . . . . . . . . . . . . . . . . . . . . . . . . 2,030 1,795Foreign securities . . . . . . . . . . . . . . . . . . . . . . . . . . . . . . . . . . . . . . . . . . . 1,245 887
Total cash equivalents . . . . . . . . . . . . . . . . . . . . . . . . . . . . . . . . . . . . . 3,364 2,769
U.S. Treasury and Agency securities . . . . . . . . . . . . . . . . . . . . . . . . . . . 216 1,080U.S. corporate securities . . . . . . . . . . . . . . . . . . . . . . . . . . . . . . . . . . . . . 3,662 1,352Foreign securities . . . . . . . . . . . . . . . . . . . . . . . . . . . . . . . . . . . . . . . . . . . 892 63
Total short-term investments . . . . . . . . . . . . . . . . . . . . . . . . . . . . . . . 4,770 2,495Total cash, cash equivalents, and short-term investments . . . . . . . $8,261 $ 5,464
The Company’s U.S. corporate securities consist primarily of commercial paper, certificates of deposit,time deposits and corporate debt securities. Foreign securities consist primarily of foreign commercial paper, certificates of deposit and time deposits with foreign institutions, most of which are denominated inU.S. dollars. The Company had net unrealized losses totaling $5.9 million on its investment portfolio, approximately half of which related to investments with stated maturities less than 1 year as of September 24, 2005 and net unrealized losses of $6.3 million on its investment portfolio, primarily related to investments with stated maturities less than 1 year as of September 25, 2004. The Company occasionally sells short-term investments prior to their stated maturities. The Company recognized a net loss before taxes of $137,000 in 2005 and net gains before taxes of $1 million and $21 million in 2004 and 2003,respectively, as a result of such sales. These net gains were included in interest and other income, net.
As of September 24, 2005, approximately $287 million of the Company’s short-term investments had underlying maturities ranging from 1 to 5 years. The remaining short-term investments as of September 24, 2005 had maturities of 3 to 12 months. As of September 25, 2004, approximately $180 million of the Company’s short-term investments had underlying maturities ranging from 1 to 5 years. The remainingshort-term investments as of September 25, 2004 had maturities of 3 to 12 months.

NOTES TO CONSOLIDATED FINANCIAL STATEMENTS (Continued)
73
Note 2—Financial Instruments (Continued)
In accordance with EITF 03-1, The Meaning of Other-Than-Temporary Impairment and Its Application to Certain Investments, the following table shows gross unrealized losses and fair value for those investments that were in an unrealized loss position as of September 24, 2005 and September 25, 2004, aggregated by investment category and the length of time that individual securities have been in a continuous lossposition (in millions):
2005Less than 12
Months 12 Months or
Greater Total
Security Description Fair
Value Unrealized
Loss Fair
ValueUnrealized
Loss Fair
Value Unrealized
Loss U.S. Treasury and Agencies . . . . . . . . . . . . . . $ 160 $(1) $ 2 $— $ 162 $ (1) Corporate bonds . . . . . . . . . . . . . . . . . . . . . . . . 468 (3) 26 — 494 (3) Certificate of deposits. . . . . . . . . . . . . . . . . . . . 288 — — — 288 — Asset backed securities. . . . . . . . . . . . . . . . . . . 60 (1) — — 60 (1) Commercial paper. . . . . . . . . . . . . . . . . . . . . . . 4,526 (1) — — 4,526 (1) Total . . . . . . . . . . . . . . . . . . . . . . . . . . . . . . . . . . $ 5,502 $ (6) $28 $ — $ 5,530 $ (6)
2004Less than 12
Months 12 Months or
Greater Total
Security Description Fair
Value Unrealized
Loss Fair
ValueUnrealized
Loss Fair
Value Unrealized
Loss U.S. Treasury and Agencies . . . . . . . . . . . . $ 1,126 $ (4) $ — $ — $ 1,126 $ (4) Corporate bonds . . . . . . . . . . . . . . . . . . . . . . 134 — 144 (1) 278 (1) Certificate of deposits. . . . . . . . . . . . . . . . . . 420 (1) — — 420 (1) Asset backed securities. . . . . . . . . . . . . . . . . 426 — — — 426 — Commercial paper. . . . . . . . . . . . . . . . . . . . . 2,407 (1) — — 2,407 (1) Total . . . . . . . . . . . . . . . . . . . . . . . . . . . . . . . . $ 4,513 $ (6) $ 144 $ (1) $ 4,657 $ (7)
Market values were determined for each individual security in the investment portfolio. The decline in value of these investments is primarily related to changes in interest rates and is considered to be temporary in nature. Investments are reviewed periodically to identify possible impairment. When evaluating the investments, the Company reviews factors such as the length of time and extent to which fairvalue has been below cost basis, the financial condition of the issuer, and the Company’s ability and intent to hold the investment for a period of time which may be sufficient for anticipated recovery in market value.
Accounts ReceivableTrade Receivables The Company distributes its products through third-party resellers and directly to certain education, consumer, and commercial customers. The Company generally does not require collateral from its customers. However, when possible the Company does attempt to limit credit risk on trade receivables with credit insurance for certain customers in Latin America, Europe, and Asia and by arranging withthird-party financing companies to provide flooring arrangements and other loan and lease programs tothe Company’s direct customers. These credit financing arrangements are directly between the third-partyfinancing company and the end customer. As such, the Company generally does not assume any recourseor credit risk sharing related to any of these arrangements. However, considerable trade receivables that

NOTES TO CONSOLIDATED FINANCIAL STATEMENTS (Continued)
74
Note 2—Financial Instruments (Continued)
are not covered by collateral, third-party flooring arrangements, or credit insurance are outstanding withthe Company’s distribution and retail channel partners. No customer accounted for more than 10% of trade receivables as of September 24, 2005 or September 25, 2004.
The following table summarizes the activity in the allowance for doubtful accounts (in millions):
September 24,2005
September 25, 2004
September 27,2003
Beginning allowance balance . . . . . . . . . . . . . . . . . . . $47 $49 $51Charged to costs and expenses . . . . . . . . . . . . . . . . . . 8 3 4Deductions (a). . . . . . . . . . . . . . . . . . . . . . . . . . . . . . . . (9) (5) (6)Ending allowance balance . . . . . . . . . . . . . . . . . . . . . . $46 $47 $49
(a) Represents amounts written off against the allowance, net of recoveries.
Vendor Non-Trade Receivables The Company has non-trade receivables from certain of its manufacturing vendors resulting from the saleof raw material components to these manufacturing vendors who manufacture sub-assemblies or assemblefinal products for the Company. The Company purchases these raw material components directly from suppliers. These non-trade receivables, which are included in the consolidated balance sheets in other current assets, totaled $417 million and $276 million as of September 24, 2005 and September 25, 2004, respectively. The Company does not reflect the sale of these components in net sales and does notrecognize any profits on these sales until the products are sold through to the end customer at which time the profit is recognized as a reduction of cost of sales.
Derivative Financial Instruments The Company uses derivatives to partially offset its business exposure to foreign exchange and interest raterisk. Foreign currency forward and option contracts are used to offset the foreign exchange risk on certainexisting assets and liabilities and to hedge the foreign exchange risk on expected future cash flows oncertain forecasted revenue and cost of sales. From time to time, the Company enters into interest ratederivative agreements to modify the interest rate profile of certain investments and debt. The Company’s accounting policies for these instruments are based on whether the instruments are designated as hedge ornon-hedge instruments. The Company records all derivatives on the balance sheet at fair value.

NOTES TO CONSOLIDATED FINANCIAL STATEMENTS (Continued)
75
Note 2—Financial Instruments (Continued)
The following table shows the notional principal, net fair value, and credit risk amounts of the Company’s foreign currency instruments as of September 24, 2005 and September 25, 2004 (in millions):
September 24, 2005 September 25, 2004NotionalPrincipal
FairValue
Credit RiskAmounts
Notional Principal
Fair Value
Credit RiskAmounts
Foreign exchange instruments qualifying as accounting hedges: Spot/Forward contracts . . . . . . . . . . . . . $ 662 $ 10 $ 10 $598 $ (3 ) $ 3 Purchased options. . . . . . . . . . . . . . . . . . $1,668 $ 17 $ 17 $482 $ 4 $ 4Sold options . . . . . . . . . . . . . . . . . . . . . . . $ 1,087 $ (5) $ — $ 521 $ (3 ) $ —
Foreign exchange instruments other than accounting hedges: Spot/Forward contracts . . . . . . . . . . . . . $ 833 $ (3) $ 1 $609 $ 3 $ 4Purchased options. . . . . . . . . . . . . . . . . . $ 115 $ — $ — $ — $ — $ — Sold options . . . . . . . . . . . . . . . . . . . . . . . $ — $ — $ — $ — $ — $ —
The notional principal amounts for derivative instruments provide one measure of the transaction volume outstanding as of year-end, and do not represent the amount of the Company’s exposure to credit ormarket loss. The credit risk amount shown in the table above represents the Company’s gross exposure topotential accounting loss on these transactions if all counterparties failed to perform according to theterms of the contract, based on then-current currency exchange rates at each respective date. TheCompany’s exposure to credit loss and market risk will vary over time as a function of currency exchange rates.
The estimates of fair value are based on applicable and commonly used pricing models and prevailingfinancial market information as of September 24, 2005 and September 25, 2004. Although the table above reflects the notional principal, fair value, and credit risk amounts of the Company’s foreign exchangeinstruments, it does not reflect the gains or losses associated with the exposures and transactions that theforeign exchange instruments are intended to hedge. The amounts ultimately realized upon settlement of these financial instruments, together with the gains and losses on the underlying exposures, will depend on actual market conditions during the remaining life of the instruments.
Foreign Exchange Risk Management The Company may enter into foreign currency forward and option contracts with financial institutions toprotect against foreign exchange risk associated with existing assets and liabilities, certain firmly committed transactions, forecasted future cash flows, and net investments in foreign subsidiaries. Generally, the Company’s practice is to hedge a majority of its existing material foreign exchange transaction exposures. However, the Company may not hedge certain foreign exchange transaction exposures due to immateriality, prohibitive economic cost of hedging particular exposures, or limited availability of appropriate hedging instruments.
To help protect gross margins from fluctuations in foreign currency exchange rates, the Company’s U.S. dollar functional subsidiaries hedge a portion of forecasted foreign currency revenues, and the Company’s non-U.S. dollar functional subsidiaries selling in local currencies hedge a portion of forecasted inventory purchases not denominated in the subsidiaries’ functional currency. Other comprehensive incomeassociated with hedges of foreign currency revenues is recognized as a component of net sales in the same

NOTES TO CONSOLIDATED FINANCIAL STATEMENTS (Continued)
76
Note 2—Financial Instruments (Continued)
period as the related sales are recognized, and other comprehensive income related to inventory purchasesis recognized as a component of cost of sales in the same period as the related costs are recognized.Typically, the Company hedges portions of its forecasted foreign currency exposure associated with revenues and inventory purchases over a time horizon of 3 to 6 months.
Derivative instruments designated as cash flow hedges must be de-designated as hedges when it is probable that the forecasted hedged transaction will not occur in the initially identified time period or within a subsequent 2 month time period. Deferred gains and losses in other comprehensive income associated withsuch derivative instruments are immediately reclassified into earnings in other income and expense. Any subsequent changes in fair value of such derivative instruments are also reflected in current earnings unlessthey are re-designated as hedges of other transactions. The Company recognized net losses of $1.6 millionand $2.8 million in 2005 and 2004, respectively, in other income and expense related to the loss of hedge designation on discontinued cash flow hedges due to changes in the Company’s forecast of future net sales and cost of sales and due to prevailing market conditions. No net gains, or losses, of a similar nature wererecorded in 2003. As of September 24, 2005, the Company had a net deferred gain associated with cash flow hedges of approximately $3.6 million, net of taxes, substantially all of which is expected to bereclassified to earnings by the end of the second quarter of fiscal 2006.
The net gain or loss on the effective portion of a derivative instrument designated as a net investmenthedge is included in the cumulative translation adjustment account of accumulated other comprehensiveincome within shareholders’ equity. As of September 24, 2005 and September 25, 2004, the Company had a net gain of $673,000 and a net loss of $1.8 million, respectively, included in the cumulative translation adjustment.
The Company may also enter into foreign currency forward and option contracts to offset the foreign exchange gains and losses generated by the re-measurement of certain assets and liabilities recorded innon-functional currencies. Changes in the fair value of these derivatives are recognized in current earnings in other income and expense as offsets to the changes in the fair value of the related assets or liabilities. Due to currency market movements, changes in option time value can lead to increased volatility in otherincome and expense.
Interest Rate Risk ManagementFrom time to time, the Company historically entered into interest rate derivative transactions withfinancial institutions in order to better match the Company’s floating-rate interest income on its cashequivalents and short-term investments with its fixed-rate interest expense on any outstanding long-term debt, and/or to diversify a portion of the Company’s exposure away from fluctuations in short-term U.S.interest rates.
During 2001 and 2002, the Company entered into and then subsequently terminated various interest ratedebt swap agreements generating a realized gain of $23 million. These gains were deferred and amortizedover the remaining life of the underlying debt, which matured and was repaid in February 2004.
As of September 24, 2005 and September 25, 2004, the Company had no interest rate derivatives outstanding.

NOTES TO CONSOLIDATED FINANCIAL STATEMENTS (Continued)
77
Note 2—Financial Instruments (Continued)
Non-Current Debt and Equity Investments and Related Gains and Losses The Company previously held significant investments in ARM Holdings plc (ARM), AkamaiTechnologies, Inc. (Akamai), and EarthLink Network, Inc. (EarthLink). The Company sold all of theremaining holdings in these non-current investments in 2004 and 2003. Pretax gains recorded upon the sale of these non-current investments were $4 million and $10 million in 2004 and 2003, respectively.
Note 3—Consolidated Financial Statement Details (in millions)
Other Current Assets
2005 2004
Vendor non-trade receivables . . . . . . . . . . . . . . . . . . . . . . . . . . . . . . . . $ 417 $ 276 Other current assets . . . . . . . . . . . . . . . . . . . . . . . . . . . . . . . . . . . . . . . . . 231 209 Total other current assets . . . . . . . . . . . . . . . . . . . . . . . . . . . . . . . . . . . . $ 648 $ 485
Property, Plant, and Equipment
2005 2004Land and buildings . . . . . . . . . . . . . . . . . . . . . . . . . . . . . . . . . . . . . . . . . . $ 361 $ 351 Machinery, equipment, and internal-use software . . . . . . . . . . . . . . . 494 422 Office furniture and equipment . . . . . . . . . . . . . . . . . . . . . . . . . . . . . . . 81 79 Leasehold improvements . . . . . . . . . . . . . . . . . . . . . . . . . . . . . . . . . . . . 545 446
1,481 1,298 Accumulated depreciation and amortization . . . . . . . . . . . . . . . . . . . (664) (591 )Net property, plant, and equipment . . . . . . . . . . . . . . . . . . . . . . . . . . . $ 817 $ 707
Other Assets
2005 2004
Non-current deferred tax assets . . . . . . . . . . . . . . . . . . . . . . . . . . . . . . . $ 183 $ 86 Capitalized software development costs, net . . . . . . . . . . . . . . . . . . . . 38 25 Other assets . . . . . . . . . . . . . . . . . . . . . . . . . . . . . . . . . . . . . . . . . . . . . . . . 117 80 Total other assets . . . . . . . . . . . . . . . . . . . . . . . . . . . . . . . . . . . . . . . . . . . $ 338 $ 191
Accrued Expenses
2005 2004Deferred revenue—current . . . . . . . . . . . . . . . . . . . . . . . . . . . . . . . . . . $ 501 $ 342Accrued marketing and distribution . . . . . . . . . . . . . . . . . . . . . . . . . . . 221 147Accrued compensation and employee benefits . . . . . . . . . . . . . . . . . . 167 134Accrued warranty and related costs . . . . . . . . . . . . . . . . . . . . . . . . . . . 188 105Other current liabilities . . . . . . . . . . . . . . . . . . . . . . . . . . . . . . . . . . . . . . 628 472Total accrued expenses . . . . . . . . . . . . . . . . . . . . . . . . . . . . . . . . . . . . . . $1,705 $1,200

NOTES TO CONSOLIDATED FINANCIAL STATEMENTS (Continued)
78
Note 3—Consolidated Financial Statement Details (in millions) (Continued)
Non-current Liabilities
2005 2004Deferred revenue—non-current . . . . . . . . . . . . . . . . . . . . . . . . . . . . . . . . . . $281 $202Deferred tax liabilities . . . . . . . . . . . . . . . . . . . . . . . . . . . . . . . . . . . . . . . . . . . 308 113Other non-current liabilities . . . . . . . . . . . . . . . . . . . . . . . . . . . . . . . . . . . . . . 12 8Total non-current liabilities . . . . . . . . . . . . . . . . . . . . . . . . . . . . . . . . . . . . . . $601 $323
Interest and Other Income, net
2005 2004 2003Interest income . . . . . . . . . . . . . . . . . . . . . . . . . . . . . . . . . . . . . . . . $183 $ 64 $ 69Interest expense . . . . . . . . . . . . . . . . . . . . . . . . . . . . . . . . . . . . . . . — (3) (8)Gains on sales of short term investments . . . . . . . . . . . . . . . . . . — 1 21Other income (expense), net . . . . . . . . . . . . . . . . . . . . . . . . . . . . (18) (9) 1Total interest and other income, net . . . . . . . . . . . . . . . . . . . . . . $165 $ 53 $ 83
Note 4—Goodwill and Other intangible Assets
The Company is currently amortizing its acquired intangible assets with definite lives over periods ranging from 3 to 10 years.
The following table summarizes the components of gross and net intangible asset balances (in millions):
September 24, 2005 September 25, 2004Gross
CarryingAmount
AccumulatedAmortization
Net CarryingAmount
GrossCarrying Amount
Accumulated Amortization
Net CarryingAmount
Goodwill . . . . . . . . . . . . . . . . . . . . . . . . . $ 69 $ — $ 69 $ 80 $ — $ 80Other acquired intangible assets. . . . . 5 (5) — 5 (5 ) — Acquired technology. . . . . . . . . . . . . . . 61 (34) 27 42 (25 ) 17 Total acquired intangible assets . . . . . $ 135 $ (39) $ 96 $ 127 $ (30) $ 97
During the fourth quarter of 2005, the Company recorded an adjustment of approximately $11 million to goodwill relating to a reduction of valuation allowances that were recorded at the time certain netoperating loss carryforwards (NOLs) were acquired in previous business combinations. During the fourthquarter of 2005, these NOLs were deemed to be more likely than not to be realized and accordingly the valuation allowances were reversed against the related goodwill that was recognized at the time of theacquisitions.
During the third quarter of 2004, the Company recorded an adjustment of approximately $5 million to goodwill related to the acquisition of PowerSchool, Inc. (PowerSchool) in 2001. This reduction of goodwill included the cancellation of 158,334 shares of the Company’s common stock, valued at approximately$2 million, that were previously held in escrow and were refunded upon resolution of certain matters arising out of the acquisition of PowerSchool. This adjustment also included approximately $3 million to adjust the original estimates of the pre-acquisition PowerSchool restructuring liability to actual costs incurred.

NOTES TO CONSOLIDATED FINANCIAL STATEMENTS (Continued)
79
Note 4—Goodwill and Other intangible Assets (Continued)
Expected annual amortization expense related to acquired technology is as follows (in millions):
Fiscal Years: 2006. . . . . . . . . . . . . . . . . . . . . . . . . . . . . . . . . . . . . . . . . . . . . . . . . . . . . . . . . . . . . . . . . $102007. . . . . . . . . . . . . . . . . . . . . . . . . . . . . . . . . . . . . . . . . . . . . . . . . . . . . . . . . . . . . . . . . 82008. . . . . . . . . . . . . . . . . . . . . . . . . . . . . . . . . . . . . . . . . . . . . . . . . . . . . . . . . . . . . . . . . 52009. . . . . . . . . . . . . . . . . . . . . . . . . . . . . . . . . . . . . . . . . . . . . . . . . . . . . . . . . . . . . . . . . 12010. . . . . . . . . . . . . . . . . . . . . . . . . . . . . . . . . . . . . . . . . . . . . . . . . . . . . . . . . . . . . . . . . 1Thereafter . . . . . . . . . . . . . . . . . . . . . . . . . . . . . . . . . . . . . . . . . . . . . . . . . . . . . . . . . . . 2
Total expected annual amortization expense. . . . . . . . . . . . . . . . . . . . . . . . . . . . . . . . $27
Amortization expense related to acquired intangible assets was $9 million, $7 million, and $10 million in2005, 2004, and 2003, respectively.
Note 5—Restructuring Charges
Fiscal 2004 Restructuring Actions The Company recorded total restructuring charges of approximately $23 million during the year ended September 25, 2004, including approximately $14 million in severance costs, $5.5 million in assetimpairments, and a $3.5 million charge for lease cancellations in conjunction with the vacating of a leasedsales facility related to a European workforce reduction during the fourth quarter of 2004. Of the $23 million charge, $19.7 million had been utilized by the end of 2005, with the remaining $3.3 millionconsisting of $0.7 million for employee severance benefits and $2.6 million for lease cancellations. Theseactions will result in the termination of 461 employees, 448 of which had been terminated prior to the endof 2005.
The following table summarizes activity associated with restructuring actions initiated during 2004 (in millions):
EmployeeSeverance Asset Lease Benefits Impairments Cancellations Totals
Total charge . . . . . . . . . . . . . . . . . . . . . . . . . . . . . . . . $ 14.0 $ 5.5 $ 3.5 $ 23.0Total spending through September 24, 2005 . . . . (12.4) — (0.9) (13.3)Total non-cash items . . . . . . . . . . . . . . . . . . . . . . . . — (5.2) — (5.2)Adjustments. . . . . . . . . . . . . . . . . . . . . . . . . . . . . . . . (0.9) (0.3) — (1.2)Accrual at September 24, 2005 . . . . . . . . . . . . . . . . $ 0.7 $ — $ 2.6 $ 3.3
Fiscal 2003 Restructuring Actions The Company recorded total restructuring charges of approximately $26.8 million during the year ended September 27, 2003, including approximately $7.4 million in severance costs, a $5.0 million charge to write-off deferred compensation, $7.1 million in asset impairments, and a $7.3 million charge for lease cancellations primarily related to the closure of the Company’s Singapore manufacturing operations duringthe first quarter of 2003. Of the $26.8 million charge, all had been utilized by the end of 2005, except for approximately $1.7 million related to operating lease costs on abandoned facilities. During the third quarter of 2003, approximately $500,000 of the amount originally accrued for lease cancellations wasdetermined to be in excess due to the sublease of a property sooner than originally expected and a shortfall
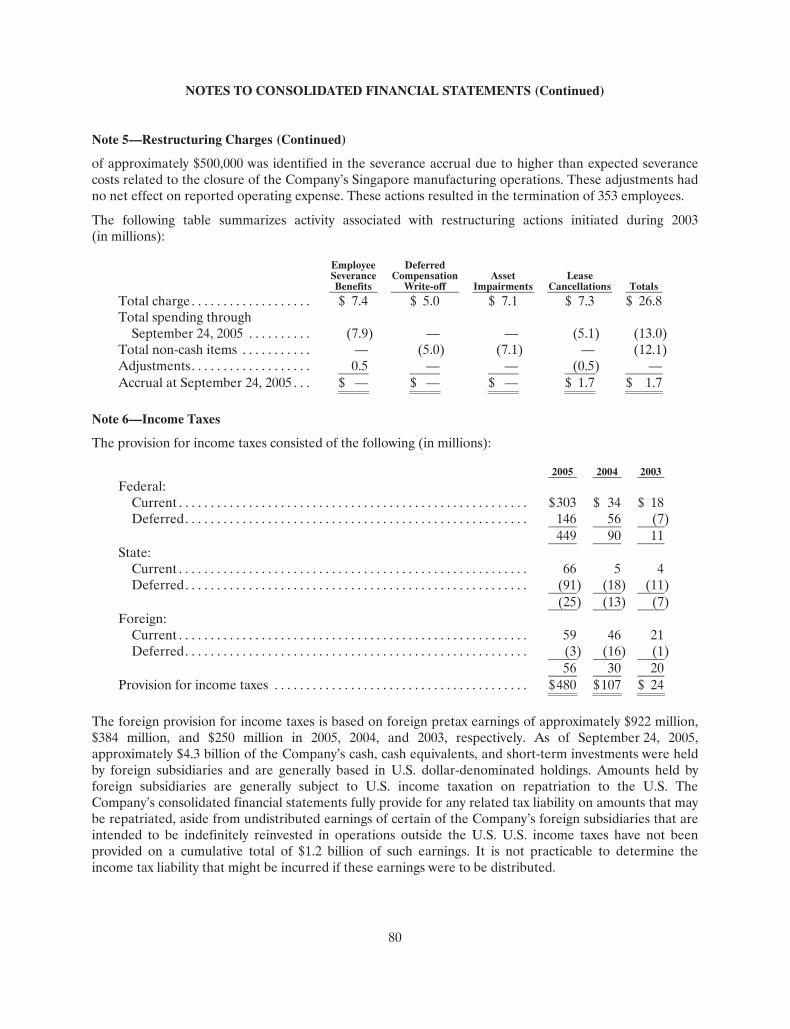
NOTES TO CONSOLIDATED FINANCIAL STATEMENTS (Continued)
80
Note 5—Restructuring Charges (Continued)
of approximately $500,000 was identified in the severance accrual due to higher than expected severancecosts related to the closure of the Company’s Singapore manufacturing operations. These adjustments hadno net effect on reported operating expense. These actions resulted in the termination of 353 employees.
The following table summarizes activity associated with restructuring actions initiated during 2003 (in millions):
Employee Deferred Severance Compensation Asset Lease Benefits Write-off Impairments Cancellations Totals
Total charge . . . . . . . . . . . . . . . . . . . $ 7.4 $ 5.0 $ 7.1 $ 7.3 $ 26.8Total spending through
September 24, 2005 . . . . . . . . . . (7.9) — — (5.1 ) (13.0)Total non-cash items . . . . . . . . . . . — (5.0) (7.1) — (12.1)Adjustments. . . . . . . . . . . . . . . . . . . 0.5 — — (0.5) —Accrual at September 24, 2005 . . . $ — $ — $ — $ 1.7 $ 1.7
Note 6—Income Taxes
The provision for income taxes consisted of the following (in millions):
2005 2004 2003Federal:
Current . . . . . . . . . . . . . . . . . . . . . . . . . . . . . . . . . . . . . . . . . . . . . . . . . . . . . . . $303 $ 34 $ 18Deferred. . . . . . . . . . . . . . . . . . . . . . . . . . . . . . . . . . . . . . . . . . . . . . . . . . . . . . 146 56 (7)
449 90 11State:
Current . . . . . . . . . . . . . . . . . . . . . . . . . . . . . . . . . . . . . . . . . . . . . . . . . . . . . . . 66 5 4Deferred. . . . . . . . . . . . . . . . . . . . . . . . . . . . . . . . . . . . . . . . . . . . . . . . . . . . . . (91) (18 ) (11)
(25 ) (13 ) (7)Foreign:
Current . . . . . . . . . . . . . . . . . . . . . . . . . . . . . . . . . . . . . . . . . . . . . . . . . . . . . . . 59 46 21Deferred. . . . . . . . . . . . . . . . . . . . . . . . . . . . . . . . . . . . . . . . . . . . . . . . . . . . . . (3) (16 ) (1)
56 30 20Provision for income taxes . . . . . . . . . . . . . . . . . . . . . . . . . . . . . . . . . . . . . . . . $480 $107 $ 24
The foreign provision for income taxes is based on foreign pretax earnings of approximately $922 million, $384 million, and $250 million in 2005, 2004, and 2003, respectively. As of September 24, 2005, approximately $4.3 billion of the Company’s cash, cash equivalents, and short-term investments were held by foreign subsidiaries and are generally based in U.S. dollar-denominated holdings. Amounts held byforeign subsidiaries are generally subject to U.S. income taxation on repatriation to the U.S. TheCompany’s consolidated financial statements fully provide for any related tax liability on amounts that maybe repatriated, aside from undistributed earnings of certain of the Company’s foreign subsidiaries that are intended to be indefinitely reinvested in operations outside the U.S. U.S. income taxes have not beenprovided on a cumulative total of $1.2 billion of such earnings. It is not practicable to determine theincome tax liability that might be incurred if these earnings were to be distributed.
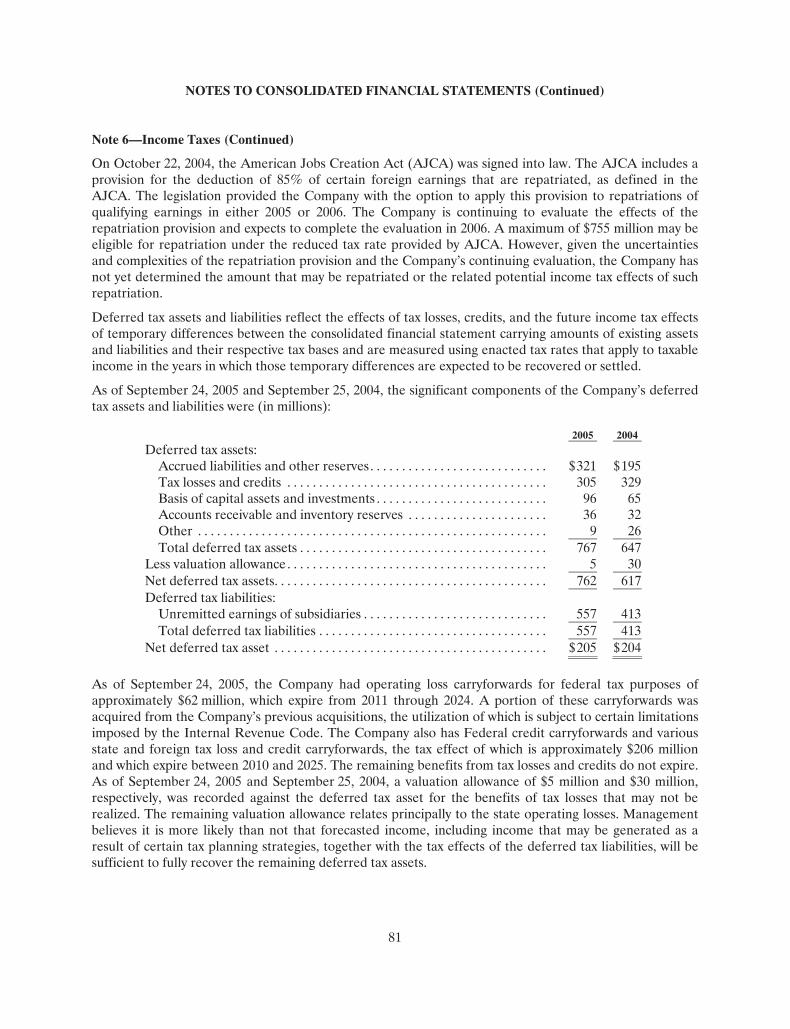
NOTES TO CONSOLIDATED FINANCIAL STATEMENTS (Continued)
81
Note 6—Income Taxes (Continued)
On October 22, 2004, the American Jobs Creation Act (AJCA) was signed into law. The AJCA includes a provision for the deduction of 85% of certain foreign earnings that are repatriated, as defined in theAJCA. The legislation provided the Company with the option to apply this provision to repatriations of qualifying earnings in either 2005 or 2006. The Company is continuing to evaluate the effects of therepatriation provision and expects to complete the evaluation in 2006. A maximum of $755 million may beeligible for repatriation under the reduced tax rate provided by AJCA. However, given the uncertaintiesand complexities of the repatriation provision and the Company’s continuing evaluation, the Company has not yet determined the amount that may be repatriated or the related potential income tax effects of such repatriation.
Deferred tax assets and liabilities reflect the effects of tax losses, credits, and the future income tax effectsof temporary differences between the consolidated financial statement carrying amounts of existing assetsand liabilities and their respective tax bases and are measured using enacted tax rates that apply to taxableincome in the years in which those temporary differences are expected to be recovered or settled.
As of September 24, 2005 and September 25, 2004, the significant components of the Company’s deferred tax assets and liabilities were (in millions):
2005 2004Deferred tax assets:
Accrued liabilities and other reserves. . . . . . . . . . . . . . . . . . . . . . . . . . . . $321 $195 Tax losses and credits . . . . . . . . . . . . . . . . . . . . . . . . . . . . . . . . . . . . . . . . . 305 329 Basis of capital assets and investments . . . . . . . . . . . . . . . . . . . . . . . . . . . 96 65 Accounts receivable and inventory reserves . . . . . . . . . . . . . . . . . . . . . . 36 32 Other . . . . . . . . . . . . . . . . . . . . . . . . . . . . . . . . . . . . . . . . . . . . . . . . . . . . . . . 9 26 Total deferred tax assets . . . . . . . . . . . . . . . . . . . . . . . . . . . . . . . . . . . . . . . 767 647
Less valuation allowance. . . . . . . . . . . . . . . . . . . . . . . . . . . . . . . . . . . . . . . . . 5 30 Net deferred tax assets. . . . . . . . . . . . . . . . . . . . . . . . . . . . . . . . . . . . . . . . . . . 762 617 Deferred tax liabilities:
Unremitted earnings of subsidiaries . . . . . . . . . . . . . . . . . . . . . . . . . . . . . 557 413 Total deferred tax liabilities . . . . . . . . . . . . . . . . . . . . . . . . . . . . . . . . . . . . 557 413
Net deferred tax asset . . . . . . . . . . . . . . . . . . . . . . . . . . . . . . . . . . . . . . . . . . . $205 $204
As of September 24, 2005, the Company had operating loss carryforwards for federal tax purposes of approximately $62 million, which expire from 2011 through 2024. A portion of these carryforwards was acquired from the Company’s previous acquisitions, the utilization of which is subject to certain limitationsimposed by the Internal Revenue Code. The Company also has Federal credit carryforwards and various state and foreign tax loss and credit carryforwards, the tax effect of which is approximately $206 millionand which expire between 2010 and 2025. The remaining benefits from tax losses and credits do not expire.As of September 24, 2005 and September 25, 2004, a valuation allowance of $5 million and $30 million, respectively, was recorded against the deferred tax asset for the benefits of tax losses that may not be realized. The remaining valuation allowance relates principally to the state operating losses. Management believes it is more likely than not that forecasted income, including income that may be generated as a result of certain tax planning strategies, together with the tax effects of the deferred tax liabilities, will besufficient to fully recover the remaining deferred tax assets.

NOTES TO CONSOLIDATED FINANCIAL STATEMENTS (Continued)
82
Note 6—Income Taxes (Continued)
A reconciliation of the provision for income taxes, with the amount computed by applying the statutoryfederal income tax rate (35% in 2005, 2004, and 2003) to income before provision for income taxes, is asfollows (in millions):
2005 2004 2003Computed expected tax . . . . . . . . . . . . . . . . . . . . . . . . . . . . . . . . . . . . . . . . . . $636 $134 $ 32 State taxes, net of federal effect . . . . . . . . . . . . . . . . . . . . . . . . . . . . . . . . . . . (19) (5) (4) Indefinitely invested earnings of foreign subsidiaries. . . . . . . . . . . . . . . . . (98) (31) (13) Nondeductible executive compensation . . . . . . . . . . . . . . . . . . . . . . . . . . . . 11 10 5 Research and development credit, net . . . . . . . . . . . . . . . . . . . . . . . . . . . . . (26) (5) (7) Other items . . . . . . . . . . . . . . . . . . . . . . . . . . . . . . . . . . . . . . . . . . . . . . . . . . . . (24) 4 11 Provision for income taxes . . . . . . . . . . . . . . . . . . . . . . . . . . . . . . . . . . . . . . . $480 $107 $ 24 Effective tax rate . . . . . . . . . . . . . . . . . . . . . . . . . . . . . . . . . . . . . . . . . . . . . . . . 26% 28% 26%
During 2005, the Company reversed certain tax contingency reserves and recorded a corresponding benefit to income tax expense primarily as a result of a change in the estimated outcome of certain tax disputes.Additionally, during the fourth quarter of 2005, the Company recorded a benefit to tax expense to adjustits net deferred tax assets as a result of the Company’s year-end review of its deferred tax accounts, theimpact of which was not material to the current or prior periods’ results of operations. The total benefit toincome tax expense from the reversal of these tax contingency reserves and adjustments to net deferred taxassets was $67 million. The Company also recorded a $14 million credit to income tax expense resulting from a reduction of the valuation allowance.
The Internal Revenue Service (IRS) has completed its field audit of the Company’s federal income tax returns for all years prior to 2002 and proposed certain adjustments. Certain of these adjustments arebeing contested through the IRS Appeals Office. Substantially all IRS audit issues for these years havebeen resolved. In addition, the Company is also subject to audits by state, local, and foreign tax authorities. Management believes that adequate provisions have been made for any adjustments that may result fromtax examinations. However, the outcome of tax audits cannot be predicted with certainty. Should any issues addressed in the Company’s tax audits be resolved in a manner not consistent with management’s expectations, the Company could be required to adjust its provision for income tax in the period suchresolution occurs.
Note 7—Shareholders’ Equity
Preferred Stock The Company has 5 million shares of authorized preferred stock, none of which is outstanding. Under the terms of the Company’s Restated Articles of Incorporation, the Board of Directors is authorized to determine or alter the rights, preferences, privileges and restrictions of the Company’s authorized but unissued shares of preferred stock.

NOTES TO CONSOLIDATED FINANCIAL STATEMENTS (Continued)
83
Note 7—Shareholders’ Equity (Continued)
Restricted Stock Units During 2005 and 2004, the Company’s Board of Directors approved the grant of 230,000 and 5.03 million restricted stock units, respectively, to members of the Company’s senior management team, excluding itsCEO. These restricted stock units generally vest over four years either in two equal installments on the second and fourth anniversaries of the date of grant or in equal installments on each of the first through fourth anniversaries of the grant date. Upon vesting, the restricted stock units will convert into an equivalent number of shares of common stock. The Company has recorded $10.3 million and $64.4 millionin 2005 and 2004, respectively, in value for these restricted stock units as a component of shareholders’equity and is amortizing the amounts on a straight-line basis over the four-year requisite service period.The value of the restricted stock units was based on the closing market price of the Company’s commonstock on the date of grant. The restricted stock units have been included in the calculation of diluted earnings per share utilizing the treasury stock method.
CEO Restricted Stock AwardOn March 19, 2003, the Company entered into an Option Cancellation and Restricted Stock AwardAgreement (the Agreement) with Mr. Steven P. Jobs, its CEO. The Agreement cancelled stock optionawards for the purchase of 55 million shares of the Company’s common stock previously granted toMr. Jobs in 2000 and 2001. Mr. Jobs retained options to purchase 120,000 shares of the Company’s common stock granted in August of 1997 in his capacity as a member of the Company’s Board of Directors, prior to becoming the Company’s CEO. The Agreement replaced the cancelled options with arestricted stock award of 10 million shares of the Company’s common stock. The restricted stock award generally vests three years from the date of grant. Vesting of some or all of the restricted shares will beaccelerated in the event Mr. Jobs is terminated without cause, dies, or has his management role reducedfollowing a change in control of the Company.
The Company determined the value of the restricted stock award in accordance with APB Opinion No. 25 and has recorded the value as deferred stock compensation as a component of shareholders’ equity and is amortizing that amount on a straight-line basis over the 3 year service period. The value of the restricted stock award was based on the closing market price of the Company’s common stock on the date of the award. The 10 million restricted shares have been included in the calculation of diluted earnings per share utilizing the treasury stock method.
Stock Repurchase Plan In July 1999, the Company’s Board of Directors authorized a plan for the Company to repurchase up to $500 million of its common stock. This repurchase plan does not obligate the Company to acquire any specific number of shares or acquire shares over any specified period of time.
During the fourth quarter of 2001, the Company entered into a forward purchase agreement to acquire 3.1 million shares of its common stock in September of 2003 at an average price of $8.32 per share for a total cost of $25.5 million. In August 2003, the Company settled this agreement prior to its maturity, atwhich time the Company’s common stock had a fair value of $11.41. Other than this forward purchasetransaction, the Company has not engaged in any transactions to repurchase its common stock since 2000. Since inception of the stock repurchase plan, the Company had repurchased a total of 13.1 million sharesat a cost of $217 million. The Company was authorized to repurchase up to an additional $283 million ofits common stock as of September 24, 2005.

NOTES TO CONSOLIDATED FINANCIAL STATEMENTS (Continued)
84
Note 7—Shareholders’ Equity (Continued)
Comprehensive Income Comprehensive income consists of two components, net income and other comprehensive income. Other comprehensive income refers to revenue, expenses, gains and losses that under U.S. generally accepted accounting principles are recorded as an element of shareholders’ equity but are excluded from netincome. The Company’s other comprehensive income consists of foreign currency translation adjustments from those subsidiaries not using the U.S. dollar as their functional currency, unrealized gains and losses on marketable securities categorized as available-for-sale, and net deferred gains and losses on certain derivative instruments accounted for as cash flow hedges.
The following table summarizes the components of accumulated other comprehensive income (loss), net of taxes (in millions):
2005 2004 2003Unrealized gains/(losses) on available-for-sale securities . . . . . . . . . . . . . . $ (4) $ (4) $ 1Unrealized gains/(losses) on derivative investments. . . . . . . . . . . . . . . . . . . 4 (4) (16)Cumulative foreign currency translation. . . . . . . . . . . . . . . . . . . . . . . . . . . . . — (7) (20)Accumulated other comprehensive income/(loss) . . . . . . . . . . . . . . . . . . . . $ — $ (15) $ (35)
The following table summarizes activity in other comprehensive income related to available-for-salesecurities, net of taxes (in millions):
2005 2004 2003Change in fair value of available-for-sale securities . . . . . . . . . . . . . . . . . . $— $(1) $ 11Adjustment for net gains realized and included in net income. . . . . . . . . — (4) (23)Change in unrealized gain/loss on available-for-sale securities . . . . . . . . $— $(5) $(12)
The tax effect related to the change in unrealized gain on available-for-sale securities was $4 million and $6 million for 2004 and 2003, respectively. The tax effect on the reclassification adjustment for net gains/losses included in net income was $1 million and $(8) million for 2004 and 2003, respectively.
The following table summarizes activity in other comprehensive income related to derivatives, net of taxes, held by the Company (in millions):
2005 2004 2003Changes in fair value of derivatives . . . . . . . . . . . . . . . . . . . . . . . . . . . . . . . . . . $7 $(21) $(24)Adjustment for net gains realized and included in net income. . . . . . . . . . . 1 33 19Change in unrealized gain/loss on derivative instruments . . . . . . . . . . . . . . . $8 $ 12 $ (5)
The tax effect related to the changes in fair value of derivatives was $(3) million, $10 million, and $11 million for 2005, 2004, and 2003, respectively. The tax effect related to derivative gains/losses reclassified from other comprehensive income to net income was $(2) million, $(13) million, and$(7) million for 2005, 2004, and 2003, respectively.
NOTES TO CONSOLIDATED FINANCIAL STATEMENTS (Continued)
85
Note 8—Employee Benefit Plans
2003 Employee Stock Plan The 2003 Employee Stock Plan (the 2003 Plan) is a shareholder approved plan that provides for broad-based grants to employees, including executive officers. Based on the terms of individual option grants, options granted under the 2003 Plan generally expire 7 to 10 years after the grant date andgenerally become exercisable over a period of 4 years, based on continued employment, with either annualor quarterly vesting. The 2003 Plan permits the granting of incentive stock options, nonstatutory stock options, restricted stock units, stock appreciation rights, and stock purchase rights.
1997 Employee Stock Option Plan In August 1997, the Company’s Board of Directors approved the 1997 Employee Stock Option Plan (the1997 Plan), a non-shareholder approved plan for grants of stock options to employees who are not officers of the Company. Based on the terms of individual option grants, options granted under the 1997 Plangenerally expire 7 to 10 years after the grant date and generally become exercisable over a period of 4 years, based on continued employment, with either annual or quarterly vesting. In October 2003, the Company terminated the 1997 Employee Stock Option Plan and cancelled all remaining unissued shares totaling 28,590,702. No new options can be granted from the 1997 Plan.
Employee Stock Option Exchange ProgramOn March 20, 2003, the Company announced a voluntary employee stock option exchange program (theExchange Program) whereby eligible employees, other than executive officers and members of the Board of Directors, had an opportunity to exchange outstanding options with exercise prices at or above$12.50 per share for a predetermined smaller number of new stock options issued with exercise pricesequal to the fair market value of one share of the Company’s common stock on the day the new awardswere issued, which was to be at least six months plus one day after the exchange options were cancelled.On April 17, 2003, in accordance with the Exchange Program, the Company cancelled options to purchase33,138,386 shares of its common stock. On October 22, 2003, new stock options totaling 13,394,736 shares were issued to employees at an exercise price of $11.38 per share, which is equivalent to the closing price ofthe Company’s stock on that date. No financial or accounting impact to the Company’s financial position, results of operations or cash flow was associated with this transaction.
1997 Director Stock Option PlanIn August 1997, the Company’s Board of Directors adopted a shareholder approved Director Stock OptionPlan (DSOP) for non-employee directors of the Company. Initial grants of 30,000 options under the DSOP vest in three equal installments on each of the first through third anniversaries of the date of grant, and subsequent annual grants of 10,000 options are fully vested at grant.
Rule 10b5-1 Trading Plans Certain of the Company’s executive officers, including Mr. Timothy D. Cook, Mr. Peter Oppenheimer, Mr. Jonathan Rubinstein, Mr. Philip W. Schiller, Dr. Bertrand Serlet, and Dr. Avadis Tevanian, Jr., have entered into trading plans pursuant to Rule 10b5-1(c)(1) of the Securities Exchange Act of 1934, as amended. A trading plan is a written document that pre-establishes the amounts, prices and dates (or formula for determining the amounts, prices and dates) of future purchases or sales of the Company’s stock including the exercise and sale of employee stock options and shares acquired pursuant to the Company’s employee stock purchase plan and upon vesting of restricted stock units.

NOTES TO CONSOLIDATED FINANCIAL STATEMENTS (Continued)
86
Note 8—Employee Benefit Plans (Continued)
Employee Stock Purchase Plan The Company has a shareholder approved employee stock purchase plan (the Purchase Plan), under which substantially all employees may purchase common stock through payroll deductions at a price equal to85% of the lower of the fair market values as of the beginning and end of six month offering periods. Stock purchases under the Purchase Plan are limited to 10% of an employee’s compensation, up to a maximum of $25,000 in any calendar year. Beginning with the six-month offering period that started on June 30,2003, the number of shares authorized for issuance is limited to a total of 1 million shares per offering period. During 2005, 2004, and 2003, adjusted for the February 2005 stock split 2.3 million, 3.9 million, and4.3 million shares, respectively, were issued under the Purchase Plan. As of September 24, 2005, approximately 3.8 million shares were reserved for future issuance under the Purchase Plan.
Employee Savings Plan The Company has an employee savings plan (the Savings Plan) qualifying as a deferred salary arrangement under Section 401(k) of the Internal Revenue Code. Under the Savings Plan, participating U.S. employeesmay defer a portion of their pre-tax earnings, up to the Internal Revenue Service annual contribution limit($14,000 for calendar year 2005). The Company matches 50% to 100% of each employee’s contributions,depending on length of service, up to a maximum 6% of the employee’s earnings. The Company’s matching contributions to the Savings Plan were approximately $28 million, $24 million, and $21 million in 2005, 2004, and 2003, respectively.

NOTES TO CONSOLIDATED FINANCIAL STATEMENTS (Continued)
87
Note 8—Employee Benefit Plans (Continued)
Stock Option Activity A summary of the Company’s stock option activity and related information for the last three fiscal yearsfollows (share amounts are presented in thousands):
Shares Outstanding Options Available Number of Weighted Averagefor Grant Shares Exercise Price
Balance at September 28, 2002 . . . . . . . . . . . . . . . . . . . . . . . . . . . . 13,142 218,860 $14.09Restricted Stock Granted . . . . . . . . . . . . . . . . . . . . . . . . . . . . . . (10,000) — —Options Granted . . . . . . . . . . . . . . . . . . . . . . . . . . . . . . . . . . . . . . (8,358) 8,358 $ 8.19Options Cancelled . . . . . . . . . . . . . . . . . . . . . . . . . . . . . . . . . . . . 96,886 (96,886) $ 19.80Options Exercised. . . . . . . . . . . . . . . . . . . . . . . . . . . . . . . . . . . . . — (4,308) $ 7.02Plan Shares Expired . . . . . . . . . . . . . . . . . . . . . . . . . . . . . . . . . . . (10) — —
Balance at September 27, 2003 . . . . . . . . . . . . . . . . . . . . . . . . . . . . 91,660 126,024 $ 9.54Restricted Stock Units Granted . . . . . . . . . . . . . . . . . . . . . . . . . (5,030) — —Options Granted . . . . . . . . . . . . . . . . . . . . . . . . . . . . . . . . . . . . . . (36,394) 36,394 $11.48Options Cancelled . . . . . . . . . . . . . . . . . . . . . . . . . . . . . . . . . . . . 6,010 (6,010) $ 10.35Options Exercised. . . . . . . . . . . . . . . . . . . . . . . . . . . . . . . . . . . . . — (45,686) $ 8.60Plan Shares Expired . . . . . . . . . . . . . . . . . . . . . . . . . . . . . . . . . . . (32,196) — —
Balance at September 25, 2004 . . . . . . . . . . . . . . . . . . . . . . . . . . . . 24,050 110,722 $10.52Additional Options Authorized . . . . . . . . . . . . . . . . . . . . . . . . . 49,000 — —Restricted Stock Units Granted . . . . . . . . . . . . . . . . . . . . . . . . . (460) — —Options Granted . . . . . . . . . . . . . . . . . . . . . . . . . . . . . . . . . . . . . . (16,214) 16,214 $42.52Options Cancelled . . . . . . . . . . . . . . . . . . . . . . . . . . . . . . . . . . . . 3,844 (3,844) $ 13.28Restricted Stock Units Cancelled. . . . . . . . . . . . . . . . . . . . . . . . 230 — —Options Exercised. . . . . . . . . . . . . . . . . . . . . . . . . . . . . . . . . . . . . — (49,871) $ 10.05Plan Shares Expired . . . . . . . . . . . . . . . . . . . . . . . . . . . . . . . . . . . (1,493) — —
Balance at September 24, 2005 . . . . . . . . . . . . . . . . . . . . . . . . . . . . 58,957 73,221 $17.79
In conjunction with the amendments to the 2003 Plan that were approved at the Annual Meeting of Shareholders held on April 21, 2005, the number of shares available for grant under the 2003 Plan will bereduced by two times the number of restricted shares and restricted stock units granted. This amendment is effective for all grants made after April 21, 2005.

NOTES TO CONSOLIDATED FINANCIAL STATEMENTS (Continued)
88
Note 8—Employee Benefit Plans (Continued)
The options outstanding as of September 24, 2005 have been segregated into eight ranges for additional disclosure as follows (option amounts are presented in thousands):
Options Outstanding Options Exercisable
Options Outstanding as of
September 24,2005
Weighted-Average
RemainingContractualLife in Years
WeightedAverageExercise
Price
Options Exercisable as of
September 24, 2005
Weighted Average
Exercise Price$0.62-$9.13 . . . . . . . . . . . . . . . . . . 10,092 4.29 $ 7.33 8,310 $ 7.26 $9.14-$10.20 . . . . . . . . . . . . . . . . . 14,954 5.65 $ 9.76 13,516 $ 9.73 $10.21-$10.80 . . . . . . . . . . . . . . . . 2,284 5.19 $ 10.31 996 $ 10.37$10.81-$10.90 . . . . . . . . . . . . . . . . 11,726 5.36 $ 10.89 2,858 $ 10.89 $10.91-$11.38 . . . . . . . . . . . . . . . . 9,151 5.10 $ 11.37 2,920 $ 11.37$11.39-$23.72 . . . . . . . . . . . . . . . . 9,622 5.39 $ 16.52 5,797 $ 17.50$23.73-$46.10 . . . . . . . . . . . . . . . . 4,791 6.38 $ 36.04 406 $ 31.62$46.11-$49.87 . . . . . . . . . . . . . . . . 10,601 6.94 $ 46.75 — $ — $0.62-$49.87 . . . . . . . . . . . . . . . . . 73,221 5.53 $ 17.79 34,803 $ 10.94
As of September 25, 2004, the Company had exercisable options outstanding to purchase 60.0 millionshares with a weighted average exercise price of $10.30 per share. As of September 27, 2003, the Company had exercisable options outstanding to purchase 77.5 million shares with a weighted average exercise price of $9.38 per share.
The Company had 5.03 million restricted stock units outstanding as of September 24, 2005, which were excluded from the options outstanding balances in the preceding tables. None of these restricted stockunits was vested as of September 24, 2005. These restricted stock units have been deducted from the shares available for grant under the Company’s stock option plans.
Note 9—Stock-Based Compensation
The Company has provided pro forma disclosures in Note 1 of these Notes to Consolidated FinancialStatements of the effect on net income and earnings per share as if the fair value method of accounting for stock compensation had been used for its employee stock option grants and employee stock purchase planpurchases. These pro forma effects have been estimated at the date of grant and beginning of the period, respectively, using the Black-Scholes option pricing model.
For purposes of the pro forma disclosures provided pursuant to SFAS No. 123, the option awards issued inOctober 2003 and the awards cancelled as part of the Employee Stock Option Exchange Program havebeen accounted for using modification accounting. In accordance with SFAS No. 123, the grant date of theawards issued is the date of acceptance of the exchange offer by participating employees. The cancellationof certain of the Company’s CEO’s options and replacement with restricted shares in March 2003 is alsobeing accounted for using modification accounting for purposes of the pro forma disclosures provided pursuant to SFAS No. 123.

NOTES TO CONSOLIDATED FINANCIAL STATEMENTS (Continued)
89
Note 9—Stock-Based Compensation (Continued)
The assumptions used for each of the last three fiscal years and the resulting estimate of weighted-averagefair value per share of options granted during those years are as follows:
2005 2004 2003Expected life of stock options . . . . . . . . . . . . . . . . . . . . . . 3.5 - 3.6 years 3.5 years 3.5 - 4 years Expected life of stock purchases. . . . . . . . . . . . . . . . . . . . 6 months 6 months 6 monthsInterest rate—stock options . . . . . . . . . . . . . . . . . . . . . . . 3.13% - 3.88% 2.33% - 3.15% 2.14% - 2.45%Interest rate—stock purchases . . . . . . . . . . . . . . . . . . . . . 1.67% - 3.30% 0.96% - 1.67% 1.10% - 1.77%Volatility—stock options . . . . . . . . . . . . . . . . . . . . . . . . . . 39% - 40% 40% 40% - 63%Volatility—stock purchases . . . . . . . . . . . . . . . . . . . . . . . . 32% - 48% 32% - 44% 35% - 44%Dividend yields . . . . . . . . . . . . . . . . . . . . . . . . . . . . . . . . . . — — — Weighted-average fair value of options granted
during the year. . . . . . . . . . . . . . . . . . . . . . . . . . . . . . . . . $ 14.41 $ 3.69 $ 3.32 Weighted-average fair value of stock purchases
during the year. . . . . . . . . . . . . . . . . . . . . . . . . . . . . . . . . $ 7.55 $ 2.78 $ 2.12
For purposes of the pro forma disclosures provided pursuant to SFAS No. 123, the expected volatilityassumptions used by the Company are based on the historical volatility of the Company’s common stockover the most recent period commensurate with the estimated expected life of the Company’s stock options and other relevant factors including implied volatility in market traded options on the Company’s common stock and the impact of unusual fluctuations not reasonably expected to recur on the historical volatility of the Company’s common stock. The Company bases its expected life assumption on its historical experience and on the terms and conditions of the stock options it grants to employees.
Note 10—Commitments and Contingencies
Lease Commitments The Company leases various equipment and facilities, including retail space, under noncancelableoperating lease arrangements. The Company does not currently utilize any other off-balance-sheetfinancing arrangements. The major facility leases are for terms of 5 to 15 years and generally providerenewal options for terms of 3 to 5 additional years. Leases for retail space are for terms of 5 to 20 years, the majority of which are for 10 years, and often contain multi-year renewal options. As of September 24, 2005, the Company’s total future minimum lease payments under noncancelable operating leases were$865 million, of which $606 million related to leases for retail space.

NOTES TO CONSOLIDATED FINANCIAL STATEMENTS (Continued)
90
Note 10—Commitments and Contingencies (Continued)
Rent expense under all operating leases, including both cancelable and noncancelable leases, was $140 million, $103 million, and $97 million in 2005, 2004, and 2003, respectively. Future minimum leasepayments under noncancelable operating leases having remaining terms in excess of one year as of September 24, 2005, are as follows (in millions):
Fiscal Years 2006 . . . . . . . . . . . . . . . . . . . . . . . . . . . . . . . . . . . . . . . . . . . . . . . . . . . . . . . . . . . . . . . . . . . . . . . . . . $1082007 . . . . . . . . . . . . . . . . . . . . . . . . . . . . . . . . . . . . . . . . . . . . . . . . . . . . . . . . . . . . . . . . . . . . . . . . . . 1102008 . . . . . . . . . . . . . . . . . . . . . . . . . . . . . . . . . . . . . . . . . . . . . . . . . . . . . . . . . . . . . . . . . . . . . . . . . . 1012009 . . . . . . . . . . . . . . . . . . . . . . . . . . . . . . . . . . . . . . . . . . . . . . . . . . . . . . . . . . . . . . . . . . . . . . . . . . 972010 . . . . . . . . . . . . . . . . . . . . . . . . . . . . . . . . . . . . . . . . . . . . . . . . . . . . . . . . . . . . . . . . . . . . . . . . . . 95Later years . . . . . . . . . . . . . . . . . . . . . . . . . . . . . . . . . . . . . . . . . . . . . . . . . . . . . . . . . . . . . . . . . . . . 354Total minimum lease payments . . . . . . . . . . . . . . . . . . . . . . . . . . . . . . . . . . . . . . . . . . . . . . . . . . $865
Accrued Warranty and Indemnifications The Company offers a basic limited parts and labor warranty on its hardware products. The basic warrantyperiod for hardware products is typically one year from the date of purchase by the end-user. TheCompany also offers a 90-day basic warranty for its service parts used to repair the Company’s hardwareproducts. The Company provides currently for the estimated cost that may be incurred under its basiclimited product warranties at the time related revenue is recognized. Factors considered in determiningappropriate accruals for product warranty obligations include the size of the installed base of productssubject to warranty protection, historical and projected warranty claim rates, historical and projected cost-per-claim, and knowledge of specific product failures that are outside of the Company’s typical experience. The Company assesses the adequacy of its preexisting warranty liabilities and adjusts the amounts as necessary based on actual experience and changes in future estimates.
The following table reconciles changes in the Company’s accrued warranties and related costs (in millions):
2005 2004 2003Beginning accrued warranty and related costs. . . . . . . . . . . . . . . . . . . . . . . $ 105 $ 67 $ 69Cost of warranty claims . . . . . . . . . . . . . . . . . . . . . . . . . . . . . . . . . . . . . . . . . . (188) (105) (71)Accruals for product warranties . . . . . . . . . . . . . . . . . . . . . . . . . . . . . . . . . . . 271 143 69Ending accrued warranty and related costs . . . . . . . . . . . . . . . . . . . . . . . . . $ 188 $ 105 $ 67
The Company generally does not indemnify end-users of its operating system and application software against legal claims that the software infringes third-party intellectual property rights. Other agreementsentered into by the Company sometimes include indemnification provisions under which the Company could be subject to costs and/or damages in the event of an infringement claim against the Company or an indemnified third-party. However, the Company has not been required to make any significant payments resulting from such an infringement claim asserted against itself or an indemnified third-party and, in theopinion of management, does not have a potential liability related to unresolved infringement claims subject to indemnification that would have a material adverse effect on its financial condition, liquidity orresults of operations. Therefore, the Company did not record a liability for infringement costs as of either September 24, 2005 or September 25, 2004.

NOTES TO CONSOLIDATED FINANCIAL STATEMENTS (Continued)
91
Note 10—Commitments and Contingencies (Continued)
Concentrations in the Available Sources of Supply of Materials and Product Although most components essential to the Company’s business are generally available from multiplesources, other key components (including microprocessors and application-specific integrated circuits (“ASICs”)) are currently obtained by the Company from single or limited sources. Some other key components, while currently available to the Company from multiple sources, are at times subject toindustry-wide availability and pricing pressures. In addition, the Company uses some components that are not common to the rest of the personal computer industry, and new products introduced by the Companyoften initially utilize custom components obtained from only one source until the Company has evaluatedwhether there is a need for and subsequently qualifies additional suppliers. If the supply of a keysingle-sourced component to the Company were to be delayed or curtailed, or in the event a keymanufacturing vendor delays shipments of completed products to the Company, the Company’s ability toship related products in desired quantities and in a timely manner could be adversely affected. The Company’s business and financial performance could also be adversely affected depending on the time required to obtain sufficient quantities from the original source, or to identify and obtain sufficientquantities from an alternative source. Continued availability of these components may be affected if producers were to decide to concentrate on the production of common components instead of components customized to meet the Company’s requirements. Finally, significant portions of the Company’s CPUs,logic boards, and assembled products are now manufactured by outsourcing partners, primarily in variousparts of Asia. Although the Company works closely with its outsourcing partners on manufacturingschedules, the Company’s operating results could be adversely affected if its outsourcing partners were unable to meet their production obligations.
Long-Term Supply AgreementsSubsequent to September 24, 2005, the Company entered into long-term supply agreements with Hynix Semiconductor, Inc., Intel Corporation, Micron Technology, Inc., Samsung Electronics Co., Ltd., andToshiba Corporation to secure supply of NAND flash memory through calendar year 2010. As part of these agreements, the Company intends to prepay a total of $1.25 billion for flash memory components bythe end of the second quarter of 2006.
ContingenciesThe Company is subject to certain other legal proceedings and claims that have arisen in the ordinarycourse of business and have not been fully adjudicated. In the opinion of management, the Company does not have a potential liability related to any current legal proceedings and claims that would individually orin the aggregate have a material adverse effect on its financial condition, liquidity, or results of operations. However, the results of legal proceedings cannot be predicted with certainty. Should the Company fail to prevail in any of these legal matters or should several of these legal matters be resolved against the Company in the same reporting period, the operating results of a particular reporting period could be materially adversely affected.
Production and marketing of products in certain states and countries may subject the Company toenvironmental and other regulations including, in some instances, the requirement to provide customers the ability to return product at the end of its useful life, and place responsibility for environmentally safedisposal or recycling with the Company. Such laws and regulations have recently been passed in severaljurisdictions in which the Company operates including various European Union member countries, Japan and certain states within the U.S. Although the Company does not anticipate any material adverse effects in the future based on the nature of its operations and the thrust of such laws, there is no assurance that

NOTES TO CONSOLIDATED FINANCIAL STATEMENTS (Continued)
92
Note 10—Commitments and Contingencies (Continued)
such existing laws or future laws will not have a material adverse effect on the Company’s financialcondition, liquidity, or results of operations.
Note 11—Segment Information and Geographic Data
In accordance with SFAS No. 131, Disclosures about Segments of an Enterprise and Related Information, the Company reports segment information based on the “management” approach. The management approachdesignates the internal reporting used by management for making decisions and assessing performance asthe source of the Company’s reportable segments.
The Company manages its business primarily on a geographic basis. The Company’s reportable operating segments are comprised of the Americas, Europe, Japan, and Retail. The Americas, Europe, and Japanreportable segments do not include activities related to the Retail segment. The Americas segmentincludes both North and South America. The Europe segment includes European countries as well as theMiddle East and Africa. The Retail segment operates Apple-owned retail stores in the U.S., Canada, Japan, and the U.K. Other operating segments include Asia-Pacific, which includes Australia and Asia except for Japan, and the Company’s subsidiary, FileMaker, Inc. Each reportable geographic operating segment provides similar hardware and software products and similar services, and the accounting policies of the various segments are the same as those described in Note 1, “Summary of Significant AccountingPolicies,” except as described below for the Retail segment.
The Company evaluates the performance of its operating segments based on net sales. The Retail segment’s performance is also evaluated based on operating income. Net sales for geographic segments are generally based on the location of the customers. Operating income for each segment includes net sales to third parties, related cost of sales, and operating expenses directly attributable to the segment. Operating income for each segment excludes other income and expense and certain expenses that are managed outside the operating segments. Costs excluded from segment operating income include various corporate expenses, manufacturing costs and variances not included in standard costs, income taxes, and various nonrecurring charges. Corporate expenses include research and development, corporate marketingexpenses, manufacturing costs and variances not included in standard costs, and other separately managed general and administrative expenses including certain corporate expenses associated with support of theRetail segment. The Company does not include intercompany transfers between segments for management reporting purposes. Segment assets exclude corporate assets. Corporate assets include cash, short-term and long-term investments, manufacturing facilities, miscellaneous corporate infrastructure, goodwill and other acquired intangible assets, and retail store construction-in-progress that is not subject to depreciation. Except for the Retail segment, capital expenditures for long-lived assets are not reported to management by segment. Capital expenditures by the Retail segment were $132 million, $104 million, and $92 million for 2005, 2004, and 2003 respectively.
Operating income for all segments, except Retail, includes cost of sales at manufacturing standard cost, other cost of sales, related sales and marketing costs, and certain general and administrative costs. Thismeasure of operating income, which includes manufacturing profit, provides a comparable basis for comparison between the Company’s various geographic segments. Certain manufacturing expenses andrelated adjustments not included in segment cost of sales, including variances between standard and actualmanufacturing costs and the mark-up above standard cost for product supplied to the Retail segment, are included in corporate expenses.

NOTES TO CONSOLIDATED FINANCIAL STATEMENTS (Continued)
93
Note 11—Segment Information and Geographic Data (Continued)
Management assesses the operating performance of the Retail segment differently than it assesses theoperating performance of the Company’s geographic segments. The Retail segment revenue and operating income is intended to depict a measure comparable to that of the Company’s major channel partners in theU.S. operating retail stores so the Company can evaluate the Retail segment performance as if it were a channel partner. Therefore, the Company makes three significant adjustments to the Retail segment for management reporting purposes that are not included in the results of the Company’s other segments.
First, the Retail segment’s operating income includes cost of sales for Apple products at an amount normally charged to major channel partners in the U.S. operating retail stores, less the cost of sales programs and incentives provided to those channel partners and the Company’s cost to support those partners. For the years ended September 24, 2005, September 25, 2004, and September 27, 2003, this resulted in the recognition of additional cost of sales above standard cost by the Retail segment and an offsetting benefit to corporate expenses of approximately $435 million, $213 million, and $106 million, respectively.
Second, the Company’s service and support contracts are transferred to the Retail segment at the samecost as that charged to the Company’s major retail channel partners in the U.S., resulting in a measure of revenue and gross margin for those items that is comparable between the Company’s Retail stores and those retail channel partners. The Retail segment recognizes the full amount of revenue and cost of salesof the Company’s service and support contracts at the time of sale. Because the Company has not yetearned the revenue or incurred the costs associated with the sale of these contracts, an offset to theseamounts is recognized in other operating segments’ net sales and cost of sales. For the year ended September 24, 2005, this resulted in the recognition of net sales and cost of sales by the Retail segment,with corresponding offsets in other operating segments, of $92 million and $64 million, respectively. For the year ended September 25, 2004, the net sales and cost of sales recognized by the Retail segment for sales of service and support contracts were $54 million and $37 million, respectively. For the year endedSeptember 27, 2003, this resulted in the recognition of net sales and cost of sales by the Retail segment of$30 million and $20 million, respectively.
Third, the Company has opened seven high profile stores in New York, Los Angeles, Chicago, San Francisco, Tokyo, Japan, Osaka, Japan, and London, England as of September 24, 2005. These high profile stores are larger than the Company’s typical retail stores and were designed to further promote brandawareness and provide a venue for certain corporate sales and marketing activities, including corporate briefings. As such, the Company allocates certain operating expenses associated with these stores to corporate marketing expense to reflect the estimated benefit realized Company-wide. The allocation ofthese operating costs is based on the amount incurred for a high profile store in excess of that incurred by a more typical Company retail location. Expenses allocated to corporate marketing resulting from the operations of these stores were $31 million, $16 million, and $6 million for the years ended September 24, 2005, September 25, 2004, and September 27, 2003, respectively.
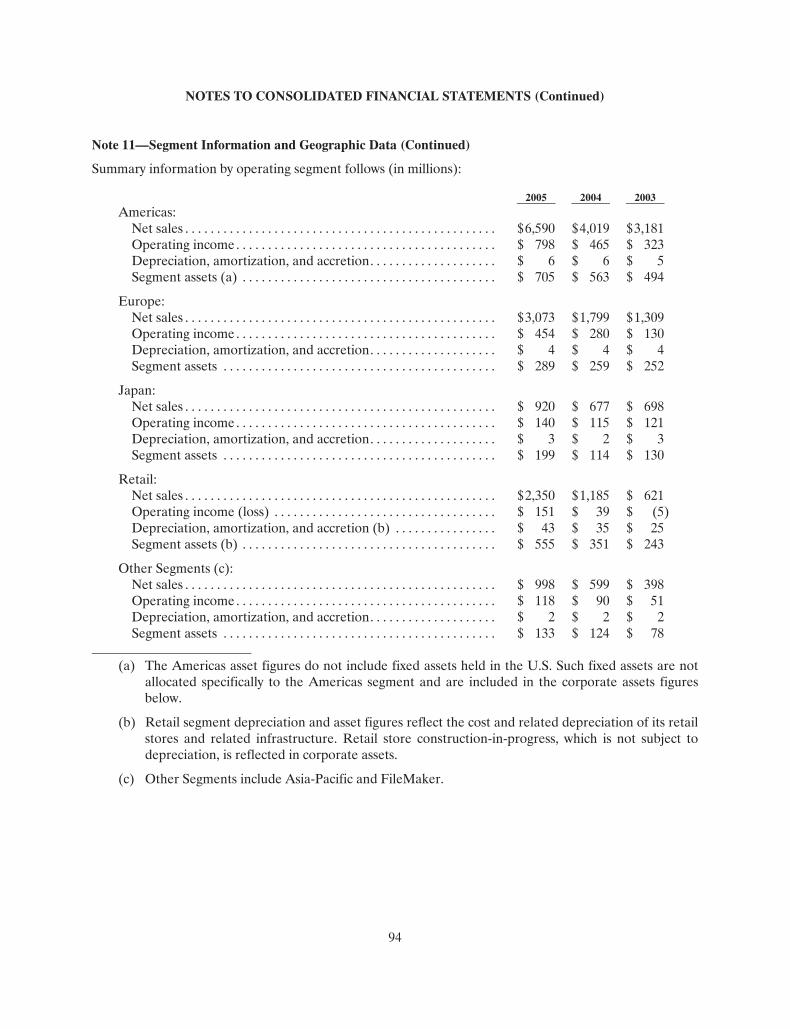
NOTES TO CONSOLIDATED FINANCIAL STATEMENTS (Continued)
94
Note 11—Segment Information and Geographic Data (Continued)
Summary information by operating segment follows (in millions):
2005 2004 2003Americas:
Net sales . . . . . . . . . . . . . . . . . . . . . . . . . . . . . . . . . . . . . . . . . . . . . . . . . $6,590 $4,019 $3,181Operating income. . . . . . . . . . . . . . . . . . . . . . . . . . . . . . . . . . . . . . . . . $ 798 $ 465 $ 323Depreciation, amortization, and accretion. . . . . . . . . . . . . . . . . . . . $ 6 $ 6 $ 5Segment assets (a) . . . . . . . . . . . . . . . . . . . . . . . . . . . . . . . . . . . . . . . . $ 705 $ 563 $ 494
Europe: Net sales . . . . . . . . . . . . . . . . . . . . . . . . . . . . . . . . . . . . . . . . . . . . . . . . . $3,073 $1,799 $1,309Operating income. . . . . . . . . . . . . . . . . . . . . . . . . . . . . . . . . . . . . . . . . $ 454 $ 280 $ 130Depreciation, amortization, and accretion. . . . . . . . . . . . . . . . . . . . $ 4 $ 4 $ 4Segment assets . . . . . . . . . . . . . . . . . . . . . . . . . . . . . . . . . . . . . . . . . . . $ 289 $ 259 $ 252
Japan: Net sales . . . . . . . . . . . . . . . . . . . . . . . . . . . . . . . . . . . . . . . . . . . . . . . . . $ 920 $ 677 $ 698Operating income. . . . . . . . . . . . . . . . . . . . . . . . . . . . . . . . . . . . . . . . . $ 140 $ 115 $ 121Depreciation, amortization, and accretion. . . . . . . . . . . . . . . . . . . . $ 3 $ 2 $ 3Segment assets . . . . . . . . . . . . . . . . . . . . . . . . . . . . . . . . . . . . . . . . . . . $ 199 $ 114 $ 130
Retail: Net sales . . . . . . . . . . . . . . . . . . . . . . . . . . . . . . . . . . . . . . . . . . . . . . . . . $2,350 $1,185 $ 621Operating income (loss) . . . . . . . . . . . . . . . . . . . . . . . . . . . . . . . . . . . $ 151 $ 39 $ (5)Depreciation, amortization, and accretion (b) . . . . . . . . . . . . . . . . $ 43 $ 35 $ 25Segment assets (b) . . . . . . . . . . . . . . . . . . . . . . . . . . . . . . . . . . . . . . . . $ 555 $ 351 $ 243
Other Segments (c):Net sales . . . . . . . . . . . . . . . . . . . . . . . . . . . . . . . . . . . . . . . . . . . . . . . . . $ 998 $ 599 $ 398Operating income. . . . . . . . . . . . . . . . . . . . . . . . . . . . . . . . . . . . . . . . . $ 118 $ 90 $ 51Depreciation, amortization, and accretion. . . . . . . . . . . . . . . . . . . . $ 2 $ 2 $ 2Segment assets . . . . . . . . . . . . . . . . . . . . . . . . . . . . . . . . . . . . . . . . . . . $ 133 $ 124 $ 78
(a) The Americas asset figures do not include fixed assets held in the U.S. Such fixed assets are notallocated specifically to the Americas segment and are included in the corporate assets figuresbelow.
(b) Retail segment depreciation and asset figures reflect the cost and related depreciation of its retail stores and related infrastructure. Retail store construction-in-progress, which is not subject todepreciation, is reflected in corporate assets.
(c) Other Segments include Asia-Pacific and FileMaker.

NOTES TO CONSOLIDATED FINANCIAL STATEMENTS (Continued)
95
Note 11—Segment Information and Geographic Data (Continued)
A reconciliation of the Company’s segment operating income and assets to the consolidated financial statements follows (in millions):
2005 2004 2003Segment operating income . . . . . . . . . . . . . . . . . . . . . . . . . . . . . . . . . . $ 1,661 $ 989 $ 620Retail manufacturing margin (a) . . . . . . . . . . . . . . . . . . . . . . . . . . . . . 435 213 106Corporate expenses, net (b) . . . . . . . . . . . . . . . . . . . . . . . . . . . . . . . . . (446) (853) (701)Restructuring costs . . . . . . . . . . . . . . . . . . . . . . . . . . . . . . . . . . . . . . . . . — (23) (26)
Consolidated operating income (loss). . . . . . . . . . . . . . . . . . . . . . . $ 1,650 $ 326 $ (1)
Segment assets. . . . . . . . . . . . . . . . . . . . . . . . . . . . . . . . . . . . . . . . . . . . . $ 1,881 $1,411 $1,197Corporate assets . . . . . . . . . . . . . . . . . . . . . . . . . . . . . . . . . . . . . . . . . . . 9,670 6,639 $5,618
Consolidated assets . . . . . . . . . . . . . . . . . . . . . . . . . . . . . . . . . . . . . . $11,551 $8,050 $6,815
Segment depreciation, amortization, and accretion . . . . . . . . . . . . . $ 58 $ 49 $ 39Corporate depreciation, amortization, and accretion. . . . . . . . . . . . 121 101 74
Consolidated depreciation, amortization, and accretion . . . . . . . $ 179 $ 150 $ 113
(a) Represents the excess of the Retail segment’s cost of sales over the Company’s standard cost ofsales for products sold through the Retail segment.
(b) Corporate expenses include research and development, corporate marketing expenses, manufacturing costs and variances not included in standard costs, and other separately managed general and administrative expenses including certain corporate expenses associated with supportof the Retail segment.
No single customer accounted for more than 10% of net sales in 2005, 2004, or 2003. Net sales and long-lived assets related to operations in the U.S., Japan, and other foreign countries are as follows (in millions):
2005 2004 2003Net Sales: U.S. . . . . . . . . . . . . . . . . . . . . . . . . . . . . . . . . . . . . . . . . . . . . . . . . . . . . . . $ 8,194 $4,893 $3,627Japan. . . . . . . . . . . . . . . . . . . . . . . . . . . . . . . . . . . . . . . . . . . . . . . . . . . . . 1,021 738 698Other Countries . . . . . . . . . . . . . . . . . . . . . . . . . . . . . . . . . . . . . . . . . . . 4,716 2,648 1,882
Total Net Sales . . . . . . . . . . . . . . . . . . . . . . . . . . . . . . . . . . . . . . . . . . $13,931 $8,279 $6,207
Long-Lived Assets: U.S. . . . . . . . . . . . . . . . . . . . . . . . . . . . . . . . . . . . . . . . . . . . . . . . . . . . . . . $ 738 $ 637 $ 635Japan. . . . . . . . . . . . . . . . . . . . . . . . . . . . . . . . . . . . . . . . . . . . . . . . . . . . . 63 52 19Other Countries . . . . . . . . . . . . . . . . . . . . . . . . . . . . . . . . . . . . . . . . . . . 112 72 60
Total Long-Lived Assets . . . . . . . . . . . . . . . . . . . . . . . . . . . . . . . . . . $ 913 $ 761 $ 714

NOTES TO CONSOLIDATED FINANCIAL STATEMENTS (Continued)
96
Note 11—Segment Information and Geographic Data (Continued)
Information regarding net sales by product is as follows (in millions):
2005 2004 2003Net Sales: Desktops (a) . . . . . . . . . . . . . . . . . . . . . . . . . . . . . . . . . . . . . . . . . . . . . . . $ 3,436 $2,373 $2,475Portables (b) . . . . . . . . . . . . . . . . . . . . . . . . . . . . . . . . . . . . . . . . . . . . . . . 2,839 2,550 2,016
Total Macintosh net sales . . . . . . . . . . . . . . . . . . . . . . . . . . . . . . . . . . 6,275 4,923 4,491iPod . . . . . . . . . . . . . . . . . . . . . . . . . . . . . . . . . . . . . . . . . . . . . . . . . . . . . . . 4,540 1,306 345Other music related products and services (c). . . . . . . . . . . . . . . . . . . 899 278 36Peripherals and other hardware (d). . . . . . . . . . . . . . . . . . . . . . . . . . . . 1,126 951 691Software, service, and other net sales (e) . . . . . . . . . . . . . . . . . . . . . . . 1,091 821 644
Total Net Sales . . . . . . . . . . . . . . . . . . . . . . . . . . . . . . . . . . . . . . . . . . . $13,931 $8,279 $6,207
(a) Includes iMac, eMac, Mac mini, Power Mac and Xserve product lines.
(b) Includes iBook and PowerBook product lines.
(c) Consists of iTunes Music Store sales and iPod services, and Apple-branded and third-party iPod accessories.
(d) Includes sales of Apple-branded and third-party displays, wireless connectivity and networkingsolutions, and other hardware accessories.
(e) Includes sales of Apple-branded operating system, application software, third-party software, AppleCare, and Internet services.
Note 12—Related Party Transactions and Certain Other Transactions
In March 2002, the Company entered into a Reimbursement Agreement with its CEO, Mr. Steven P. Jobs, for the reimbursement of expenses incurred by Mr. Jobs in the operation of his private plane when used for Apple business. The Reimbursement Agreement became effective for expenses incurred by Mr. Jobs for Apple business purposes since he took delivery of the plane in May 2001. The Company recognized a totalof $1.1 million, $483,000, and $404,000 in expenses pursuant to the Reimbursement Agreement during2005, 2004, and 2003, respectively. All expenses recognized pursuant to the Reimbursement Agreementhave been included in selling, general, and administrative expenses in the consolidated statements ofoperations.
Subsequent to September 24, 2005, the Company entered into an agreement with Pixar to sell certain of Pixar’s short films on the iTunes Music Store. Mr. Steven P. Jobs, the Company’s CEO is also the CEO, Chairman, and a large shareholder of Pixar.

NOTES TO CONSOLIDATED FINANCIAL STATEMENTS (Continued)
97
Note 13—Selected Quarterly Financial Information (Unaudited)
Fourth Quarter Third Quarter Second Quarter First Quarter(Tabular amounts in millions, except per share amounts)
2005Net sales . . . . . . . . . . . . . . . . . . . . . . . . . . . . . . . $ 3,678 $ 3,520 $ 3,243 $3,490Gross margin . . . . . . . . . . . . . . . . . . . . . . . . . . . $ 1,035 $ 1,044 $ 968 $ 996Net income . . . . . . . . . . . . . . . . . . . . . . . . . . . . . $ 430 $ 320 $ 290 $ 295Earnings per common share:
Basic . . . . . . . . . . . . . . . . . . . . . . . . . . . . . . . . $ 0.52 $ 0.39 $ 0.36 $ 0.37Diluted . . . . . . . . . . . . . . . . . . . . . . . . . . . . . . $ 0.50 $ 0.37 $ 0.34 $ 0.35
2004Net sales . . . . . . . . . . . . . . . . . . . . . . . . . . . . . . . $ 2,350 $ 2,014 $ 1,909 $2,006Gross margin . . . . . . . . . . . . . . . . . . . . . . . . . . . $ 634 $ 559 $ 530 $ 536Net income . . . . . . . . . . . . . . . . . . . . . . . . . . . . . $ 106 $ 61 $ 46 $ 63Earnings per common share:
Basic . . . . . . . . . . . . . . . . . . . . . . . . . . . . . . . . $ 0.14 $ 0.08 $ 0.06 $ 0.09Diluted . . . . . . . . . . . . . . . . . . . . . . . . . . . . . . $ 0.13 $ 0.08 $ 0.06 $ 0.08
Basic and diluted earnings per share are computed independently for each of the quarters presented. Therefore, the sum of quarterly basic and diluted per share information may not equal annual basic anddiluted earnings per share.
Net income during the fourth quarter of 2005 benefited by $81 million from the reversal of certain taxcontingency reserves and adjustments to net deferred tax assets, including reductions to valuationallowances.
Net income during the fourth, third, and second quarters of 2004 included restructuring charges, net of tax, of $4 million, $6 million, and $7 million, respectively. Net income during the fourth quarter of 2004included after-tax gains related to non-current investments of $3 million.
98
REPORT OF INDEPENDENT REGISTERED PUBLIC ACCOUNTING FIRM
The Board of Directors and Shareholders Apple Computer, Inc.:
We have audited the accompanying consolidated balance sheets of Apple Computer, Inc. and subsidiaries (the Company) as of September 24, 2005 and September 25, 2004, and the related consolidated statementsof operations, shareholders’ equity and cash flows for each of the years in the three-year period endedSeptember 24, 2005. These consolidated financial statements are the responsibility of the Company’s management. Our responsibility is to express an opinion on these consolidated financial statements basedon our audits.
We conducted our audits in accordance with the standards of the Public Company Accounting OversightBoard (United States). Those standards require that we plan and perform the audit to obtain reasonableassurance about whether the consolidated financial statements are free of material misstatement. An auditincludes examining, on a test basis, evidence supporting the amounts and disclosures in the consolidated financial statements. An audit also includes assessing the accounting principles used and significantestimates made by management, as well as evaluating the overall financial statement presentation. Webelieve that our audits provide a reasonable basis for our opinion.
In our opinion, the consolidated financial statements referred to above present fairly, in all material respects, the financial position of the Company as of September 24, 2005 and September 25, 2004, and theresults of their operations and their cash flows for each of the years in the three-year period ended September 24, 2005, in conformity with U.S. generally accepted accounting principles.
We also have audited, in accordance with the standards of the Public Company Accounting OversightBoard (United States), the effectiveness of the Company’s internal control over financial reporting as ofSeptember 24, 2005, based on criteria established in Internal Control-Integrated Framework issued by the Committee of Sponsoring Organizations of the Treadway Commission (COSO), and our report dated November 29, 2005 expressed an unqualified opinion on management’s assessment of, and the effectiveoperation of internal control over financial reporting.
As discussed in Note 1 to the consolidated financial statements, the Company changed its method ofaccounting for asset retirement obligations and for financial instruments with characteristics of bothliabilities and equity in 2003.
/s/ KPMG LLP
Mountain View, California November 29, 2005

99
REPORT OF INDEPENDENT REGISTERED PUBLIC ACCOUNTING FIRM
The Board of Directors and Shareholders Apple Computer, Inc.:
We have audited management’s assessment, included in the accompanying Management’s Annual Report on Internal Control over Financial Reporting, that Apple Computer, Inc. and subsidiaries maintainedeffective internal control over financial reporting as of September 24, 2005, based on criteria established in Internal Control-Integrated Framework issued by the Committee of Sponsoring Organizations of theTreadway Commission (COSO). Apple Computer, Inc.’s management is responsible for maintaining effective internal control over financial reporting and for its assessment of the effectiveness of internal control over financial reporting. Our responsibility is to express an opinion on management’s assessmentand an opinion on the effectiveness of Apple Computer, Inc.’s internal control over financial reporting based on our audit. We conducted our audit in accordance with the standards of the Public Company Accounting Oversight Board (United States). Those standards require that we plan and perform the audit to obtain reasonableassurance about whether effective internal control over financial reporting was maintained in all materialrespects. Our audit included obtaining an understanding of internal control over financial reporting,evaluating management’s assessment, testing and evaluating the design and operating effectiveness of internal control, and performing such other procedures as we considered necessary in the circumstances. We believe that our audit provides a reasonable basis for our opinion. A company’s internal control over financial reporting is a process designed to provide reasonable assurance regarding the reliability of financial reporting and the preparation of financial statements forexternal purposes in accordance with generally accepted accounting principles. A company’s internalcontrol over financial reporting includes those policies and procedures that (1) pertain to the maintenanceof records that, in reasonable detail, accurately and fairly reflect the transactions and dispositions of theassets of the company; (2) provide reasonable assurance that transactions are recorded as necessary topermit preparation of financial statements in accordance with generally accepted accounting principles, and that receipts and expenditures of the company are being made only in accordance with authorizations of management and directors of the company; and (3) provide reasonable assurance regarding prevention or timely detection of unauthorized acquisition, use, or disposition of the company’s assets that could havea material effect on the financial statements. Because of inherent limitations, internal control over financial reporting may not prevent or detect misstatements. Also, projections of any evaluation of effectiveness to future periods are subject to the risk that controls may become inadequate because of changes in conditions, or that the degree of compliance with the policies or procedures may deteriorate. In our opinion, management’s assessment that Apple Computer, Inc. maintained effective internal control over financial reporting as of September 24, 2005, is fairly stated, in all material respects, based on criteriaestablished in Internal Control-Integrated Framework issued by COSO. Also, in our opinion, AppleComputer, Inc. maintained, in all material respects, effective internal control over financial reporting as of September 24, 2005, based on criteria established in Internal Control-Integrated Framework issued byCOSO. We also have audited, in accordance with the standards of the Public Company Accounting OversightBoard (United States), the consolidated balance sheets of Apple Computer, Inc. as of September 24, 2005and September 25, 2004, and the related consolidated statements of operations, shareholders’ equity, andcash flows for each of the years in the three-year period ended September 24, 2005, and our report datedNovember 29, 2005 expressed an unqualified opinion on those consolidated financial statements.
/s/ KPMG LLP Mountain View, California November 29, 2005

100
Item 9. Changes in and Disagreements with Accountants on Accounting and Financial Disclosure
Not applicable.
Item 9A. Controls and Procedures
Evaluation of Disclosure Controls and ProceduresBased on an evaluation under the supervision and with the participation of the Company’s management, the Company’s principal executive officer and principal financial officer have concluded that theCompany’s disclosure controls and procedures as defined in rules 13a-15(e) and 15d-15(e) under the Securities Exchange Act of 1934, as amended (Exchange Act) were effective as of September 24, 2005 to ensure that information required to be disclosed by the Company in reports that it files or submits underthe Exchange Act is (i) recorded, processed, summarized and reported within the time periods specified in the Securities and Exchange Commission rules and forms and (ii) accumulated and communicated to the Company’s management, including its principal executive officer and principal financial officer, asappropriate to allow timely decisions regarding required disclosure.
Inherent Limitations Over Internal ControlsThe Company’s internal control over financial reporting is designed to provide reasonable assurance regarding the reliability of financial reporting and the preparation of financial statements for externalpurposes in accordance with generally accepted accounting principles. The Company’s internal control over financial reporting includes those policies and procedures that:
(i) pertain to the maintenance of records that, in reasonable detail, accurately and fairly reflect the transactions and dispositions of the Company’s assets;
(ii) provide reasonable assurance that transactions are recorded as necessary to permitpreparation of financial statements in accordance with generally accepted accountingprinciples, and that the Company’s receipts and expenditures are being made only in accordance with authorizations of the Company’s management and directors; and
(iii) provide reasonable assurance regarding prevention or timely detection of unauthorizedacquisition, use, or disposition of the Company’s assets that could have a material effecton the financial statements.
Management, including the Company’s Chief Executive Officer and Chief Financial Officer, does not expect that the Company’s internal controls will prevent or detect all errors and all fraud. A control system, no matter how well designed and operated, can provide only reasonable, not absolute, assurance that the objectives of the control system are met. Further, the design of a control system must reflect the fact that there are resource constraints, and the benefits of controls must be considered relative to their costs. Because of the inherent limitations in all control systems, no evaluation of internal controls can provide absolute assurance that all control issues and instances of fraud, if any, have been detected. Also, anyevaluation of the effectiveness of controls in future periods are subject to the risk that those internal controls may become inadequate because of changes in business conditions, or that the degree of compliance with the policies or procedures may deteriorate.
Management’s Annual Report on Internal Control Over Financial Reporting The Company’s management is responsible for establishing and maintaining adequate internal controlover financial reporting (as defined in Rule 13a-15(f) under the Securities Exchange Act of 1934, as amended). Management conducted an evaluation of the effectiveness of the Company’s internal controlover financial reporting based on the criteria set forth in Internal Control—Integrated Framework issuedby the Committee of Sponsoring Organizations of the Treadway Commission (COSO). Based on thisevaluation, management has concluded that the Company’s internal control over financial reporting was

101
effective as of September 24, 2005. The Company’s independent registered public accounting firm, KPMG LLP, has issued an attestation report on the Company’s assessment of its internal control overfinancial reporting. The report on the audit of internal control over financial reporting appears on page 99 of this Form 10-K.
Changes in Internal Control Over Financial Reporting There were no significant changes in the Company’s internal control over financial reporting identified inmanagement’s evaluation during the fourth quarter of fiscal 2005 that have materially affected, or are reasonably likely to materially affect, the Company’s internal control over financial reporting.
Item 9B. Other Information
None.

102
PART III
Item 10. Directors and Executive Officers of the Registrant
Directors Listed below are the Company’s seven directors whose terms expire at the next annual meeting of shareholders.
Name Position With the Company Age Director SinceFred D. Anderson . . . . . . . . . . . . . . . . . . . . . . Director 61 2004 William V. Campbell . . . . . . . . . . . . . . . . . . . Co-lead Director 65 1997 Millard S. Drexler . . . . . . . . . . . . . . . . . . . . . . Director 61 1999 Albert A. Gore, Jr. . . . . . . . . . . . . . . . . . . . . . Director 57 2003 Steven P. Jobs . . . . . . . . . . . . . . . . . . . . . . . . . Director and Chief Executive Officer 50 1997 Arthur D. Levinson. . . . . . . . . . . . . . . . . . . . . Co-lead Director 55 2000 Jerome B. York . . . . . . . . . . . . . . . . . . . . . . . . Director 67 1997
Fred D. Anderson has been a founding partner of Elevation Partners, a private equity firm focused on themedia and entertainment industry, since July 2004. Previously, Mr. Anderson served as the Company’s Executive Vice President and Chief Financial Officer from April 1996 to June 2004. Mr. Anderson also serves on the Board of Directors of eBay Inc.
William V. Campbell has been Chairman of the Board of Directors of Intuit, Inc. (“Intuit”) since August 1998. From September 1999 to January 2000, Mr. Campbell acted as Chief Executive Officer ofIntuit. From April 1994 to August 1998, Mr. Campbell was President and Chief Executive Officer and a director of Intuit. From January 1991 to December 1993, Mr. Campbell was President and Chief Executive Officer of GO Corporation. Mr. Campbell also serves on the Board of Directors of Opsware, Inc.
Millard S. Drexler has been Chairman and Chief Executive Officer of J. Crew Group, Inc. since January 2003. Previously, Mr. Drexler was Chief Executive Officer of Gap Inc. from 1995 and Presidentfrom 1987 until September 2002. Mr. Drexler was also a member of the Board of Directors of Gap Inc. from November 1983 until October 2002.
Albert A. Gore, Jr. has served as a Senior Advisor to Google, Inc. since 2001. He has also served as Executive Chairman of Current TV since 2002 and as Chairman of Generation Investment Management since 2004. He is a visiting professor at Middle Tennessee State University. Mr. Gore was inaugurated as the 45th Vice President of the U.S. in 1993. He was re-elected in 1996 and served for a total of eight yearsas President of the Senate, a member of the Cabinet and the National Security Council. Prior to 1993, heserved eight years in the U.S. Senate and eight years in the U.S. House of Representatives.
Steven P. Jobs is one of the Company’s co-founders and currently serves as its Chief Executive Officer. Mr. Jobs is also the Chairman and Chief Executive Officer of Pixar Animation Studios.
Arthur D. Levinson, Ph.D. has been Chief Executive Officer and a Director of Genentech Inc. (“Genentech”) since July 1995. Dr. Levinson has been Chairman of the Board of Directors of Genentech since September 1999. He joined Genentech in 1980 and served in a number of executive positions,including Senior Vice President of R&D from 1993 to 1995. Dr. Levinson also serves on the Board ofDirectors of Google, Inc.
Jerome B. York has been Chief Executive Officer of Harwinton Capital Corporation, a private investment company that he controls, since September 2003. From January 2000 until September 2003, Mr. York was Chairman and Chief Executive Officer of MicroWarehouse, Inc., a reseller of computer hardware, software and peripheral products. From September 1995 to October 1999, he was Vice Chairman of Tracinda Corporation. From May 1993 to September 1995 he was Senior Vice President and Chief

103
Financial Officer of IBM Corporation, and served as a member of IBM’s Board of Directors fromJanuary 1995 to August 1995. Mr. York is also a director of Tyco International Ltd. and Exide Technologies.
Role of the Board; Corporate Governance MattersIt is the paramount duty of the Board of Directors to oversee the Chief Executive Officer and other senior management in the competent and ethical operation of the Company on a day-to-day basis and to assurethat the long-term interests of the shareholders are being served. To satisfy this duty, the directors take aproactive, focused approach to their position, and set standards to ensure that the Company is committedto business success through maintenance of the highest standards of responsibility and ethics.
Members of the Board bring to the Company a wide range of experience, knowledge and judgment. These varied skills mean that governance is far more than a “check the box” approach to standards orprocedures. The governance structure in the Company is designed to be a working structure for principledactions, effective decision-making and appropriate monitoring of both compliance and performance. Thekey practices and procedures of the Board are outlined in the Corporate Governance Guidelines available on the Company’s website at www.apple.com/investor.
Board CommitteesThe Board has a standing Compensation Committee, a Nominating and Corporate Governance Committee (“Nominating Committee”) and an Audit and Finance Committee (“Audit Committee”). All committee members are independent under the listing standards of the NASDAQ Stock Market.
The Audit Committee is primarily responsible for overseeing the services performed by the Company’s independent auditors and internal audit department, evaluating the Company’s accounting policies and its system of internal controls and reviewing significant financial transactions. Members of the Audit Committee are Messrs. Campbell and York and Dr. Levinson.
The Compensation Committee is primarily responsible for reviewing the compensation arrangements for the Company’s executive officers, including the Chief Executive Officer, and for administering the Company’s equity compensation plans. Members of the Compensation Committee are Messrs. Campbell, Drexler, and Gore.
The Nominating Committee assists the Board in identifying qualified individuals to become directors, determines the composition of the Board and its committees, monitors the process to assess Board effectiveness and helps develop and implement the Company’s corporate governance guidelines. TheNominating Committee also considers nominees proposed by shareholders. Members of the NominatingCommittee are Messrs. Drexler and Gore and Dr. Levinson.
The Audit, Compensation and Nominating Committees operate under written charters adopted by the Board. These charters are available on Apple’s website at www.apple.com/investor.
Audit Committee Financial Expert All members of the Company’s Audit Committee, Messrs. Campbell and York and Dr. Levinson, qualify as “audit committee financial experts” under Item 401 (h) of Regulation S-K and are considered“independent” as the term is used in Item 7(d)(3)(iv) of Schedule 14A under the Exchange Act.
Code of Ethics The Company has a code of ethics that applies to all of the Company’s employees, including its principal executive officer, principal financial officer, principal accounting officer and its Board of Directors. A copyof this code, “Ethics: The Way We Do Business Worldwide” is available on the Company’s
104
website at www.apple.com/investor. The Company intends to disclose any changes in or waivers from its code of ethics by posting such information on its website or by filing a Form 8-K.
Executive Officers The following sets forth certain information regarding executive officers of the Company. Information pertaining to Mr. Jobs, who is both a director and an executive officer of the Company, may be found in the section entitled “Directors.”
Timothy D. Cook, Chief Operating Officer (age 45), joined the Company in February 1998. Mr. Cook also served with the Company as Executive Vice President, Worldwide Sales and Operations from 2002 to 2005. In 2004, his responsibilities were expanded to include the Company’s Macintosh hardware engineering. From 1998 to 2002, Mr. Cook served in the position of Senior Vice President, WorldwideOperations, Sales, Service and Support. Prior to joining the Company, Mr. Cook held the position of VicePresident, Corporate Materials for Compaq Computer Corporation (“Compaq”). Previous to his work at Compaq, Mr. Cook was the Chief Operating Officer of the Reseller Division at Intelligent Electronics. Mr. Cook also spent 12 years with IBM, most recently as Director of North American Fulfillment.Mr. Cook also serves as a member of the Board of Directors of Nike, Inc.
Nancy R. Heinen, Senior Vice President, General Counsel and Secretary (age 49), joined the Company in September 1997. Prior to joining the Company, Ms. Heinen held the position of Vice President, General Counsel and Secretary of the Board of Directors at NeXT Software, Inc. (“NeXT”) from February 1994 until the acquisition of NeXT by the Company in February 1997.
Ronald B. Johnson, Senior Vice President, Retail (age 47), joined the Company in January 2000. Prior tojoining the Company, Mr. Johnson spent 16 years with Target Stores, most recently as Senior Merchandising Executive.
Peter Oppenheimer, Senior Vice President and Chief Financial Officer (age 42), joined the Company in July 1996. Mr. Oppenheimer also served with the Company in the position of Vice President and Corporate Controller and as Senior Director of Finance for the Americas. Prior to joining the Company, Mr. Oppenheimer was CFO of one of the four business units for Automatic Data Processing, Inc.(“ADP”). Prior to joining ADP, Mr. Oppenheimer spent six years in the Information TechnologyConsulting Practice with Coopers and Lybrand.
Jonathan Rubinstein, Senior Vice President, iPod Division (age 49), joined the Company in February 1997. Mr. Rubinstein also served with the Company in the position of Senior Vice President, Hardware Engineering. Before joining the Company, Mr. Rubinstein was Executive Vice President andChief Operating Officer of FirePower Systems Incorporated, from May 1993 to August 1996. Mr. Rubinstein also serves as a member of the Board of Directors of Immersion Corporation.
Philip W. Schiller, Senior Vice President, Worldwide Product Marketing (age 45), rejoined the Companyin 1997. Prior to rejoining the Company, Mr. Schiller was Vice President of Product Marketing atMacromedia, Inc. from December 1995 to March 1997 and was Director of Product Marketing at FirePower Systems, Inc. from 1993 to December 1995. Prior to that, Mr. Schiller spent six years at the Company in various marketing positions.
Bertrand Serlet, Ph.D., Senior Vice President, Software Engineering (age 44), joined the Company in February 1997 upon the Company’s acquisition of NeXT. At NeXT, Dr. Serlet held several engineeringand managerial positions, including Director of Web Engineering. Prior to NeXT, from 1985 to 1989, Dr. Serlet worked as a research engineer at Xerox PARC.
Sina Tamaddon, Senior Vice President, Applications (age 48), joined the Company in September 1997. Mr. Tamaddon has also served with the Company in the position of Senior Vice President, Worldwide Service and Support, and Vice President and General Manager, Newton Group. Before joining the

105
Company, Mr. Tamaddon held the position of Vice President, Europe with NeXT from September 1996through March 1997. From August 1994 to August 1996, Mr. Tamaddon held the position of VicePresident, Professional Services with NeXT.
Avadis Tevanian, Jr., Ph.D., Senior Vice President, Chief Software Technology Officer (age 44), joined the Company in February 1997 upon the Company’s acquisition of NeXT. Dr. Tevanian served with the Company in the position of Senior Vice President, Software Engineering from 1997 to July 2003. WithNeXT, Dr. Tevanian held several positions, including Vice President, Engineering, from April 1995 to February 1997. Prior to April 1995, Dr. Tevanian worked as an engineer with NeXT and held severalmanagement positions.
Section 16(a) Beneficial Ownership Reporting Compliance Section 16(a) of the Securities Exchange Act of 1934, as amended, requires the Company’s officers anddirectors, and persons who own more than ten percent of a registered class of the Company’s equity securities, to file reports of securities ownership and changes in such ownership with the Securities and Exchange Commission (“SEC”). Officers, directors and greater than ten percent shareholders also arerequired by rules promulgated by the SEC to furnish the Company with copies of all Section 16(a) formsthey file.
Based solely upon a review of the copies of such forms furnished to the Company or writtenrepresentations that no Forms 5 were required, the Company believes that all Section 16(a) filingrequirements were met during fiscal year 2005.

106
Item 11. Executive Compensation
Information Regarding Executive Compensation The following table summarizes compensation information for the last three fiscal years for (i) Mr. Jobs, Chief Executive Officer and (ii) the four most highly compensated executive officers other than the Chief Executive Officer who were serving as executive officers of the Company at the end of the fiscal year(collectively, the “Named Executive Officers”).
SUMMARY COMPENSATION TABLE
Annual CompensationLong-Term
Compensation
Name and Principal PositionFiscalYear
Salary($)
Bonus ($)
RestrictedStock Award
($)
SecuritiesUnderlyingOptions*
(#)
All Other Compensation
($) Steven P. Jobs . . . . . . . . . . . . . . . . . 2005 1 — — — — Chief Executive Officer 2004 1 — — — —
2003 1 — 74,750,000(1) — —
Timothy D. Cook. . . . . . . . . . . . . . . 2005 602,434 600,239 — — 12,600(3)Chief Operating Officer 2004 602,632 — 7,650,000(2) — 12,588(3)
2003 617,673 — — — 9,929(3)
Ronald B. Johnson . . . . . . . . . . . . . 2005 552,795 550,202 — — — Senior Vice President, Retail 2004 484,836 1,500,000 6,375,000(2) — —
2003 452,404 1,500,000 — — —
Peter Oppenheimer . . . . . . . . . . . . 2005 552,189 550,202 — — 21,092(3)Senior Vice President and 2004 450,739 — 6,375,000(2) — 3,808(3)Chief Financial Officer 2003 402,237 — — — —
Jonathan Rubinstein. . . . . . . . . . . . 2005 552,795 551,239 — — 12,600(3)Senior Vice President, 2004 485,216 — 6,375,000(2) — 12,300(3)iPod Division 2003 452,939 — — — 11,986(3)
(1) In March 2003, Mr. Jobs voluntarily cancelled all of his outstanding options, excluding those grantedto him in his capacity as a Director. In March 2003, the Board awarded Mr. Jobs 10 million (split-adjusted) restricted shares of the Company’s Common Stock that generally vest in full on the third anniversary of the grant date.
(2) Market value of restricted stock units granted on March 24, 2004 (based on $12.75 per share, theclosing price of the Company’s common stock on the NASDAQ National Market on the day of grant). Restricted stock units generally vest over four years with 50% of the total number of shares vesting on each of the second and fourth anniversaries of the grant date.
(3) Consists of matching contributions made by the Company in accordance with the terms of the401(k) plan.
Option Grants in Last Fiscal Year There were no options, restricted stock, or restricted stock units granted to the Named Executive Officersduring fiscal year 2005.

107
Options Exercised and Year-End Option Holdings The following table provides information about stock option exercises by the Named Executive Officers during fiscal year 2005 and stock options held by each of them at fiscal year-end. The table has beenadjusted to reflect the Company’s two-for-one stock split in February 2005.
AGGREGATED OPTION EXERCISES IN THE LAST FISCAL YEAR AND FISCAL YEAR-END OPTION VALUES
SharesAcquired on
Exercise Value
Realized
Number of Securities Underlying Unexercised
Options at FiscalYear-End (#)
Value of UnexercisedIn-the-Money Options at Fiscal Year-End ($)(1)
Name (#) ($) Exercisable Unexercisable Exercisable UnexercisableSteven P. Jobs . . . . . . — — 120,000(2) —(3) $ 5,694,000(2) —Timothy D. Cook. . . . 500,000 $13,329,677 — —(3) — —Ronald B. Johnson . . 1,350,000 $32,257,127 2,100,000 150,000(3) $61,910,625 $ 6,220,500Peter Oppenheimer . — — 1,107,500 37,500(3) $ 45,994,859 $ 1,560,062Jonathan Rubinstein. 1,800,000 $31,012,815 — —(3) — —
(1) Market value of securities underlying in-the-money options at the end of fiscal year 2005 (based on $53.20 per share, the closing price of Common Stock on the NASDAQ National Market onSeptember 23, 2005), minus the exercise price.
(2) Consists of 120,000 options granted to Mr. Jobs in his capacity as a director pursuant to the 1997 Director Stock Option Plan. Since accepting the position of CEO, Mr. Jobs is no longer eligible toreceive option grants under the Director Plan. In March 2003, Mr. Jobs voluntarily cancelled all of his outstanding options, excluding those granted to him in his capacity as a director.
(3) This does not include 10 million restricted shares granted to Mr. Jobs, 600,000 restricted stock units granted to Mr. Cook, and 500,000 restricted stock units granted to each of Messrs. Johnson,Oppenheimer, and Rubinstein.
Director Compensation The form and amount of director compensation is determined by the Board after a review of recommendations made by the Nominating Committee. The current practice of the Board is to base asubstantial portion of a director’s annual retainer on equity. In 1998, shareholders approved the 1997 Director Stock Option Plan (the “Director Plan”) and 1,600,000 shares were reserved for issuance thereunder. Pursuant to the Director Plan, the Company’s non-employee directors are granted an optionto acquire 30,000 shares of Common Stock upon their initial election to the Board (“Initial Options”). The Initial Options vest and become exercisable in three equal annual installments on each of the first through third anniversaries of the grant date. On the fourth anniversary of a non-employee director’s initialelection to the Board and on each subsequent anniversary thereafter, the director will be entitled toreceive an option to acquire 10,000 shares of Common Stock (“Annual Options”). Annual Options are fullyvested and immediately exercisable on their date of grant. As of the end of the fiscal year, there were options for 740,000 shares outstanding under the Director Plan. Since accepting the position of CEO,Mr. Jobs is no longer eligible for grants under the Director Plan. Non-employee directors also receive a $50,000 annual retainer paid in quarterly increments. In addition, directors receive up to two free computer systems per year and are eligible to purchase additional equipment at a discount. Directors do not receive any additional consideration for serving on committees or as committee chairperson.
Compensation Committee Interlocks and Insider Participation The current members of the Compensation Committee are Messrs. Campbell, Drexler and Gore, none ofwhom are employees of the Company and all of whom are considered “independent” directors under the
108
applicable NASDAQ rules. There were no interlocks or insider participation between any member of the Board or Compensation Committee and any member of the board of the directors or compensationcommittee of another company.
Arrangements with Named Executive Officers
Change In Control Arrangements—Stock Options, Restricted Stock, and Restricted Stock Units In the event of a “change in control” of the Company, all outstanding options under the Company’s stock option plans, except the Director Plan, will, unless otherwise determined by the plan administrator, become fully exercisable, and will be cashed out at an amount equal to the difference between the applicable “change in control price” and the exercise price. The Director Plan provides that upon a“change in control” of the Company, all outstanding options held by non-employee directors willautomatically become fully exercisable and will be cashed out at an amount equal to the differencebetween the applicable “change in control price” and the exercise price of the options. A “change incontrol” under these plans is generally defined as (i) the acquisition by any person of 50% or more of thecombined voting power of the Company’s outstanding securities or (ii) the occurrence of a transaction requiring shareholder approval and involving the sale of all or substantially all of the assets of the Company or the merger of the Company with or into another corporation.
In addition, options, restricted stock grants, and restricted stock units granted to the Named Executive Officers generally provide that in the event there is a “change in control,” as defined in the Company’s stock option plans, and if in connection with or following such “change in control,” their employment isterminated without “Cause” or if they should resign for “Good Reason,” those options, restricted stock, and restricted stock units outstanding that are not yet vested as of the date of such “change in control” shall become fully vested. Further, restricted stock and restricted stock units granted to the Named Executive Officers also provide that, in the event the Company terminates the Officer without cause at anytime, the restricted stock units and restricted stock will vest in full. Generally, “Cause” is defined to include a felony conviction, willful disclosure of confidential information or willful and continued failure to perform his or her employment duties. “Good Reason” includes resignation of employment as a result of a substantial diminution in position or duties, or an adverse change in title or reduction in annual basesalary.
Item 12. Security Ownership of Certain Beneficial Owners and Management
The following table sets forth certain information as of October 31, 2005 (the “Table Date”) with respect to the beneficial ownership of the Company’s Common Stock by (i) each person the Company believes beneficially holds more than 5% of the outstanding shares of Common Stock; (ii) each director; (iii) eachNamed Executive Officer listed in the Summary Compensation Table under the heading “ExecutiveCompensation;” and (iv) all directors and executive officers as a group. On the Table Date, 839,776,934 shares of Common Stock were issued and outstanding. Unless otherwise indicated, all persons named asbeneficial owners of Common Stock have sole voting power and sole investment power with respect to theshares indicated as beneficially owned. In addition, unless otherwise indicated, all persons named below can be reached at Apple Computer, Inc., 1 Infinite Loop, Cupertino, CA 95014.

109
Security Ownership of 5% Holders, Directors, Nominees and Executive Officers
Name of Beneficial Owner Shares of Common Stock
Beneficially Owned(1)Percent of Common Stock
Outstanding Fidelity Investments . . . . . . . . . . . . . . . . . . . . . . . . . . . . . . . . . . . 58,552,916(2) 6.97%Barclays Global Investors . . . . . . . . . . . . . . . . . . . . . . . . . . . . . . 55,223,982(3) 6.58%AXA . . . . . . . . . . . . . . . . . . . . . . . . . . . . . . . . . . . . . . . . . . . . . . . . 47,861,070(4) 5.70%Steven P. Jobs . . . . . . . . . . . . . . . . . . . . . . . . . . . . . . . . . . . . . . . . 10,120,004(5) 1.21%Fred D. Anderson . . . . . . . . . . . . . . . . . . . . . . . . . . . . . . . . . . . . . 5,344 *William V. Campbell . . . . . . . . . . . . . . . . . . . . . . . . . . . . . . . . . . 211,004(6) *Timothy D. Cook. . . . . . . . . . . . . . . . . . . . . . . . . . . . . . . . . . . . . . 12,597(7) *Millard S. Drexler . . . . . . . . . . . . . . . . . . . . . . . . . . . . . . . . . . . . . 210,000(8) *Albert A. Gore, Jr. . . . . . . . . . . . . . . . . . . . . . . . . . . . . . . . . . . . . 40,000(9) *Ronald B. Johnson . . . . . . . . . . . . . . . . . . . . . . . . . . . . . . . . . . . . 2,112,597(10) *Arthur D. Levinson. . . . . . . . . . . . . . . . . . . . . . . . . . . . . . . . . . . . 352,400(11) *Peter Oppenheimer . . . . . . . . . . . . . . . . . . . . . . . . . . . . . . . . . . . 396,643(12) *Jonathan J. Rubinstein. . . . . . . . . . . . . . . . . . . . . . . . . . . . . . . . . 22,174(13) *Jerome B. York . . . . . . . . . . . . . . . . . . . . . . . . . . . . . . . . . . . . . . . 70,000(14) *All executive officers and directors as a group (16 persons) . 16,307,625(15) 1.94%
(1) Represents shares of Common Stock held and/or options held by such individuals that were exercisable at the Table Date or within 60 days thereafter. This does not include options or restrictedstock units that vest after 60 days. The share numbers have been adjusted to reflect the Company’stwo-for-one stock split in February 2005.
(2) Based on a Form 13F filed November 14, 2005 by FMR Corp. FMR Corp. lists its address as82 Devonshire Street, Boston, MA, 02109, in such filing.
(3) Based on a Form 13F filed November 14, 2005, by Barclays Global Investors. Barclays GlobalInvestors lists its address as 45 Fremont Street, San Francisco, CA 94105.
(4) Based on a Form 13F filed November 14, 2005, by AXA. AXA lists its address as 25, Avenue Matigon,Paris, France 10.
(5) Includes 120,000 shares of Common Stock that Mr. Jobs has the right to acquire by exercise of stock options.
(6) Includes 210,000 shares of Common Stock that Mr. Campbell has the right to acquire by exercise of stock options.
(7) Excludes 600,000 restricted stock units.
(8) Includes 170,000 shares of Common Stock that Mr. Drexler has the right to acquire by exercise of stock options.
(9) Consists of 40,000 shares of Common Stock that Mr. Gore has the right to acquire by exercise of stock options.
(10) Includes 2,100,000 shares of Common Stock that Mr. Johnson has the right to acquire by exercise ofstock options and excludes 500,000 restricted stock units.
(11) Includes 2,000 shares of Common Stock that Dr. Levinson holds indirectly and 90,000 shares of Common Stock that Dr. Levinson has the right to acquire by exercise of stock options.
(12) Includes 382,500 shares of Common Stock that Mr. Oppenheimer has the right to acquire by exerciseof stock options and excludes 500,000 restricted stock units.

110
(13) Excludes 500,000 restricted stock units.
(14) Includes 30,000 shares of Common Stock that Mr. York has the right to acquire by exercise of stock options.
(15) Includes 5,870,796 shares of Common Stock that executive officers or directors have the right to acquire by exercise of stock options. Does not include 4.4 million of restricted stock units.
* Represents less than 1% of the issued and outstanding shares of Common Stock on the Table Date.
Equity Compensation Plan Information The following table sets forth certain information, as of September 24, 2005, concerning shares of commonstock authorized for issuance under all of the Company’s equity compensation plans. The table has beenadjusted to reflect the Company’s two-for-one stock split in February 2005.
(a) Number of Securities
to be Issued UponExercise of
Outstanding Options,Warrants and Rights
(b) Weighted AverageExercise Price of
Outstanding Options,Warrants and Rights
(c) Number of Securities
Remaining Available forFuture Issuance Under
Equity Compensation Plans(Excluding Securities
Reflected in Column (a)) Equity compensation plans approved
by shareholders . . . . . . . . . . . . . . . . . 42,365,700 $23.27 62,791,724(1)Equity compensation plans not
approved by shareholders . . . . . . . . 30,827,565 $10.27 —Total equity compensation plans(2). . 73,193,265 $ 17.79 62,791,724
(1) This number includes 3,834,300 shares of common stock reserved for issuance under the EmployeeStock Purchase Plan, 440,000 shares available for issuance under the 1997 Director Stock Option Plan, and 58,517,424 shares available for issuance under the 2003 Employee Stock Plan. The grant of 5,260,000 shares of restricted stock units has been deducted from the number of shares available for future issuance. Shares of restricted stock and restricted stock units granted after April 2005 count against the shares available for grant as two shares for every share granted. This amount does notinclude shares under the 1990 Stock Option Plan that was terminated in 1997. No new options can be granted under the 1990 Stock Option Plan.
(2) This table does not include 28,082 outstanding options assumed in connection with a prior acquisition of a company that originally granted those options. These assumed options have a weighted averageexercise price of $3.39 per share. No additional options may be granted under the assumed plan.
Item 13. Certain Relationships and Related Transactions
In March 2002, the Company entered into a Reimbursement Agreement with its Chief Executive Officer, Mr. Steven P. Jobs, for the reimbursement of expenses incurred by Mr. Jobs in the operation of his privateplane when used for Apple business. The Reimbursement Agreement is effective for expenses incurred byMr. Jobs for Apple business purposes since he took delivery of the plane in May 2001. During 2005, the Company recognized a total of $1,075,545 in expenses pursuant to this reimbursement agreement related to expenses incurred by Mr. Jobs during 2005.
In October 2005, the Company entered into an agreement with Pixar to sell certain of Pixar’s short films on the iTunes Music Store. Mr. Jobs, the Company’s Chief Executive Officer is also the Chief ExecutiveOfficer, Chairman, and a large shareholder of Pixar.

111
Item 14. Principal Accountant Fees and Services
The following table sets forth the fees paid to the Company’s independent registered public accountingfirm, KPMG LLP, during fiscal years 2005 and 2004.
Audit and Non-Audit Fees
2005 2004Audit Fees . . . . . . . . . . . . . . . . . . . . . . . . . . . . . . . . . . . . . . . . . . . . . . . . . . $ 6,948,800(1) $ 3,402,300Audit-Related Fees . . . . . . . . . . . . . . . . . . . . . . . . . . . . . . . . . . . . . . . . . . 46,700(2) 57,000Tax Fees . . . . . . . . . . . . . . . . . . . . . . . . . . . . . . . . . . . . . . . . . . . . . . . . . . . . 923,000(3) 784,500All Other Fees. . . . . . . . . . . . . . . . . . . . . . . . . . . . . . . . . . . . . . . . . . . . . . . — —Total . . . . . . . . . . . . . . . . . . . . . . . . . . . . . . . . . . . . . . . . . . . . . . . . . . . . . . . $ 7,918,500 $ 4,243,800
(1) Audit fees relate to professional services rendered in connection with the audit of the Company’s annual financial statements and internal control over financial reporting, quarterly review of financialstatements included in the Company’s Forms 10-Q, and audit services provided in connection with other statutory and regulatory filings.
(2) Audit-related fees primarily relate to professional services for the audits of employee benefit plans.
(3) Tax fees include $690,000 for professional services rendered in connection with tax compliance and preparation relating to the Company’s expatriate program, tax audits and international taxcompliance; and $233,000 for international tax consulting and planning services. The Company doesnot engage KPMG to perform personal tax services for its executive officers.
Policy on Audit Committee Pre-Approval of Audit and Non-Audit Services Performed by the Independent Auditors
Prior to the enactment of the Sarbanes-Oxley Act of 2002 (the “Act”), the Company adopted an auditor independence policy that banned its auditors from performing non-financial consulting services, such asinformation technology consulting and internal audit services. This auditor policy also mandates that the audit and non-audit services and related budget be approved by the Audit Committee in advance, and that the Audit Committee be provided with quarterly reporting on actual spending. In accordance with this policy, all services to be performed by KPMG were pre-approved by the Audit Committee.
Subsequent to the enactment of the Act, the Audit Committee met with KPMG to further understand the provisions of that Act as it relates to auditor independence. KPMG rotated the lead audit partner for fiscalyear 2005 and will rotate other partners as appropriate in compliance with the Act. The Audit Committeewill continue to monitor the activities undertaken by KPMG to comply with the Act.

112
PART IV
Item 15. Exhibits and Financial Statement Schedules.
(a) Index to Exhibits
ExhibitNumber Exhibit Description Form
Filing Date/ Period End Date
Filedherewith
3.1 Restated Articles of Incorporation, filed with the Secretary of State of the State of California on January 27, 1988.
S-3 7/27/88
3.2 Amendment to Restated Articles of Incorporation, filed with the Secretary of State of the State of California on May 4, 2000.
10-Q 5/11/00
3.3 By-Laws of the Company, as amended through June 7, 2004. 10-Q 6/26/04
3.4 Certificate of Amendment to Restated Articles of Incorporation, as amended, filed with the Secretary of State of the State of California on February 25, 2005.
10-Q 3/26/05
4.2 Indenture dated as of February 1, 1994, between the Company and Morgan Guaranty Trust Company of New York.
10-Q 4/01/94
4.3 Supplemental Indenture dated as of February 1, 1994, among the Company, Morgan Guaranty Trust Company of New York, as resigning trustee, and Citibank, N.A., as successor trustee.
10-Q 4/01/94
4.5 Form of the Company’s 6 1/2% Notes due 2004. 10-Q 4/01/94
4.8 Registration Rights Agreement, dated June 7, 1996 among the Company and Goldman, Sachs & Co. and Morgan Stanley & Co. Incorporated.
S-3 8/28/96
4.9 Certificate of Determination of Preferences of Series A Non-Voting Convertible Preferred Stock of Apple Computer, Inc.
10-K 9/26/97
10.A.3 Apple Computer, Inc. Savings and Investment Plan, as amended and restated effective as of October 1, 1990.
10-K 9/27/91
10.A.3-1 Amendment of Apple Computer, Inc. Savings andInvestment Plan dated March 1, 1992.
10-K 9/25/92
10.A.3-2 Amendment No. 2 to the Apple Computer, Inc. Savings and Investment Plan.
10-Q 3/28/97
10.A.5 1990 Stock Option Plan, as amended through November 5, 1997.
10-Q 12/26/97
10.A.6 Apple Computer, Inc. Employee Stock Purchase Plan, as amended through April 21, 2005.
10-Q 3/26/05
10.A.8 Form of Indemnification Agreement between the Registrant and each officer of the Registrant.
10-K 9/26/97
10.A.43 NeXT Computer, Inc. 1990 Stock Option Plan, as amended. S-8 3/21/97

113
ExhibitNumber Exhibit Description Form
Filing Date/ Period End Date
Filedherewith
10.A.49 1997 Employee Stock Option Plan, as amended throughOctober 19, 2001.
10-K 9/28/02
10.A.50 1997 Director Stock Option Plan. 10-Q 3/27/98
10.A.51 2003 Employee Stock Plan, as amended through November 9, 2005.
10.A.52 Reimbursement Agreement dated as of May 25, 2001 byand between the Registrant and Steven P. Jobs.
10-Q 6/29/02
10.A.53 Option Cancellation and Restricted Stock Award Agreement dated as of March 19, 2003 by and between The Registrant and Steven P. Jobs.
10-Q 6/28/03
10.A.54 Form of Restricted Stock Unit Award Agreement. 10-Q 3/27/04
10.A.54-1 Alternative Form of Restricted Stock Unit Award Agreement.
10.A.55 Apple Computer, Inc. Performance Bonus Plan dated April21, 2005.
10-Q 3/26/05
10.A.56 Form of Election to Satisfy Tax Withholding with Stock. 8-K 8/15/05
10.A.57 Form of Option Agreements.
10.B.18* Custom Sales Agreement effective October 21, 2002between the Registrant and International Business Machines Corporation.
10-K 9/27/03
10.B.19* Purchase Agreement effective August 10, 2005 between the Registrant and Freescale Semiconductor, Inc.
14.1 Code of Ethics of the Company. 10-K 9/27/03
21 Subsidiaries of Apple Computer, Inc.
23.1 Consent of Independent Registered Public AccountingFirm.
31.1 Rule13a-14(a)/15d-14(a) Certification of Chief ExecutiveOfficer.
31.2 Rule13a-14(a)/15d-14(a) Certification of Chief FinancialOfficer.
32.1 Section 1350 Certifications of Chief Executive Officer and Chief Financial Officer.
* Confidential Treatment requested as to certain portions of this exhibit.

114
SIGNATURES
Pursuant to the requirements of Section 13 or 15(d) of the Securities Exchange Act of 1934, the registranthas duly caused this report to be signed on its behalf by the undersigned, thereunto duly authorized, this 29th day of November 2005.
APPLE COMPUTER, INC. By: /s/ PETER OPPENHEIMER
Peter Oppenheimer Senior Vice President and
Chief Financial Officer
KNOW ALL PERSONS BY THESE PRESENTS, that each person whose signature appears below constitutes and appoints Steven P. Jobs and Peter Oppenheimer, jointly and severally, his attorneys-in-fact, each with the power of substitution, for him in any and all capacities, to sign any amendments to this Annual Report on Form 10-K, and to file the same, with exhibits thereto and other documents inconnection therewith, with the Securities and Exchange Commission, hereby ratifying and confirming all that each of said attorneys-in-fact, or his substitute or substitutes, may do or cause to be done by virtue hereof.
Pursuant to the requirements of the Securities Exchange Act of 1934, this report has been signed below by the following persons on behalf of the registrant and in the capacities and on the dates indicated:
Name Title Date
/s/ STEVEN P. JOBS
STEVEN P. JOBS Chief Executive Officer and Director
(Principal Executive Officer) November 29, 2005
/s/ PETER OPPENHEIMER
PETER OPPENHEIMER
Senior Vice President and Chief Financial Officer (Principal Financial and Principal AccountingOfficer)
November 29, 2005
/s/ FRED ANDERSON
FRED ANDERSON Director November 29, 2005
/s/ WILLIAM V. CAMPBELL
WILLIAM V. CAMPBELL Director November 29, 2005
/s/ MILLARD S. DREXLER
MILLARD S. DREXLER Director November 29, 2005
/s/ ALBERT GORE, JR. ALBERT GORE, JR.
Director November 29, 2005
/s/ ARTHUR D. LEVINSON
ARTHUR D. LEVINSON Director November 29, 2005
/s/ JEROME B. YORK
JEROME B. YORK Director November 29, 2005

Exhibit 21
SUBSIDIARIES OF APPLE COMPUTER, INC*
Name Jurisdiction
of IncorporationApple Computer Inc. Limited. . . . . . . . . . . . . . . . . . . . . . . . . . . . . . . . . . . . . . . . . . . . . . . . . . . . . IrelandApple Computer Limited . . . . . . . . . . . . . . . . . . . . . . . . . . . . . . . . . . . . . . . . . . . . . . . . . . . . . . . . IrelandApple Computer International . . . . . . . . . . . . . . . . . . . . . . . . . . . . . . . . . . . . . . . . . . . . . . . . . . . . Ireland
* Pursuant to Item 601(b)(21)(ii) of Regulation S-K, the names of other subsidiaries of Apple Computer, Inc. are omitted because, considered in the aggregate, they would not constitute asignificant subsidiary as of the end of the year covered by this report.

Exhibit 23.1
Consent of Independent Registered Public Accounting Firm
The Board of Directors Apple Computer, Inc.:
We consent to the incorporation by reference in the registration statements on Forms S-8 (Nos. 2-70449, 2-77563, 2-85095, 33-00866, 33-23650, 33-31075, 33-40877, 33-47596, 33-57092, 33-57080, 33-53873, 33-53879, 33-53895, 33-60279, 33-60281, 333-07437, 333-23719, 333-23725, 333-60455, 333-82603, 333-93471, 333-37012, 333-52116, 333-61276, 333-70506, 333-75930, 333-102184, 333-106421, and333-125148) and the registration statements on Forms S-3 (Nos. 33-23317, 33-29578, and 33-62310) of Apple Computer, Inc. of our reports dated November 29, 2005 with respect to the consolidated balancesheets of Apple Computer, Inc. and subsidiaries as of September 24, 2005 and September 25, 2004, and therelated consolidated statements of operations, shareholders’ equity, and cash flows for each of the years inthe three-year period ended September 24, 2005, and management’s assessment of the effectiveness of internal control over financial reporting as of September 24, 2005 and the effectiveness of internal control over financial reporting as of September 24, 2005, which reports appear in the September 24, 2005 annualreport on Form 10-K of Apple Computer, Inc. Our report refers to changes in accounting for asset retirement obligations and for financial instruments with characteristics of both liabilities and equity in2003.
/s/ KPMG LLP
Mountain View, California November 29, 2005
Exhibit 31.1
CERTIFICATIONS
I, Steven P. Jobs, certify that:
1. I have reviewed this annual report on Form 10-K of Apple Computer, Inc.;
2. Based on my knowledge, this report does not contain any untrue statement of a material fact or omitto state a material fact necessary to make the statements made, in light of the circumstances under which such statements were made, not misleading with respect to the period covered by this report;
3. Based on my knowledge, the financial statements, and other financial information included in thisreport, fairly present in all material respects the financial condition, results of operations and cash flows of the registrant as of, and for, the periods presented in this report;
4. The registrant’s other certifying officer(s) and I are responsible for establishing and maintaining disclosure controls and procedures (as defined in Exchange Act Rules 13a-15(e) and 15d-15(e)) andinternal control over financial reporting (as defined in Exchange Act Rules 13a-15(f) and15d-15(f) for the registrant and have:
(a) Designed such disclosure controls and procedures, or caused such disclosure controls andprocedures to be designed under our supervision, to ensure that material information relating to the registrant, including its consolidated subsidiaries, is made known to us by others within thoseentities, particularly during the period in which this report is being prepared;
(b) Designed such internal control over financial reporting, or caused such internal control over financial reporting to be designed under our supervision, to provide reasonable assurance regarding the reliability of financial reporting and the preparation of financial statements for external purposes in accordance with generally accepted accounting principles;
(c) Evaluated the effectiveness of the registrant’s disclosure controls and procedures and presentedin this report our conclusions about the effectiveness of the disclosure controls and procedures, as of the end of the period covered by this report based on such evaluation; and
(d) Disclosed in this report any change in the registrant’s internal control over financial reporting that occurred during the registrant’s most recent fiscal quarter (the registrant’s fourth fiscalquarter in the case of an annual report) that has materially affected, or is reasonably likely to materially affect, the registrant’s internal control over financial reporting; and
5. The registrant’s other certifying officer(s) and I have disclosed, based on our most recent evaluation ofinternal control over financial reporting, to the registrant’s auditors and the audit committee of theregistrant’s board of directors (or persons performing the equivalent functions):
(a) All significant deficiencies and material weaknesses in the design or operation of internal controlover financial reporting which are reasonably likely to adversely affect the registrant’s ability to record, process, summarize, and report financial information; and
(b) Any fraud, whether or not material, that involves management or other employees who have a significant role in the registrant’s internal control over financial reporting.
Date: November 29, 2005
By: /s/ STEVEN P. JOBSSteven P. Jobs
Chief Executive Officer

Exhibit 31.2
CERTIFICATIONS
I, Peter Oppenheimer, certify that:
1. I have reviewed this annual report on Form 10-K of Apple Computer, Inc.;
2. Based on my knowledge, this report does not contain any untrue statement of a material fact or omitto state a material fact necessary to make the statements made, in light of the circumstances under which such statements were made, not misleading with respect to the period covered by this report;
3. Based on my knowledge, the financial statements, and other financial information included in thisreport, fairly present in all material respects the financial condition, results of operations and cash flows of the registrant as of, and for, the periods presented in this report;
4. The registrant’s other certifying officer(s) and I are responsible for establishing and maintaining disclosure controls and procedures (as defined in Exchange Act Rules 13a-15(e) and 15d-15(e)) andinternal control over financial reporting (as defined in Exchange Act Rules 13a-15(f) and15d-15(f) for the registrant and have:
(a) Designed such disclosure controls and procedures, or caused such disclosure controls andprocedures to be designed under our supervision, to ensure that material information relating to the registrant, including its consolidated subsidiaries, is made known to us by others within thoseentities, particularly during the period in which this report is being prepared;
(b) Designed such internal control over financial reporting, or caused such internal control over financial reporting to be designed under our supervision, to provide reasonable assurance regarding the reliability of financial reporting and the preparation of financial statements for external purposes in accordance with generally accepted accounting principles;
(c) Evaluated the effectiveness of the registrant’s disclosure controls and procedures and presentedin this report our conclusions about the effectiveness of the disclosure controls and procedures, as of the end of the period covered by this report based on such evaluation; and
(d) Disclosed in this report any change in the registrant’s internal control over financial reporting that occurred during the registrant’s most recent fiscal quarter (the registrant’s fourth fiscalquarter in the case of an annual report) that has materially affected, or is reasonably likely to materially affect, the registrant’s internal control over financial reporting; and
5. The registrant’s other certifying officer(s) and I have disclosed, based on our most recent evaluation ofinternal control over financial reporting, to the registrant’s auditors and the audit committee of registrant’s board of directors (or persons performing the equivalent functions):
(a) All significant deficiencies and material weaknesses in the design or operation of internal controlover financial reporting which are reasonably likely to adversely affect the registrant’s ability to record, process, summarize, and report financial information; and
(b) Any fraud, whether or not material, that involves management or other employees who have a significant role in the registrant’s internal control over financial reporting.
Date: November 29, 2005
By: /s/ PETER OPPENHEIMERPeter Oppenheimer
Senior Vice President andChief Financial Officer

Exhibit 32.1
CERTIFICATION OF CHIEF EXECUTIVE OFFICER AND CHIEF FINANCIAL OFFICERPURSUANT TO
18 U.S.C. SECTION 1350, AS ADOPTED PURSUANT TO
SECTION 906 OF THE SARBANES-OXLEY ACT OF 2002
I, Steven P. Jobs, certify, pursuant to 18 U.S.C. Section 1350, as adopted pursuant to Section 906 of theSarbanes-Oxley Act of 2002, that the Annual Report of Apple Computer, Inc. on Form 10-K for the fiscal year ended September 24, 2005 fully complies with the requirements of Section 13(a) or 15(d) of theSecurities Exchange Act of 1934 and that information contained in such Form 10-K fairly presents in all material respects the financial condition and results of operations of Apple Computer, Inc.
By: /s/ STEVEN P. JOBSSteven P. Jobs
Chief Executive Officer
I, Peter Oppenheimer, certify, pursuant to 18 U.S.C. Section 1350, as adopted pursuant to Section 906 ofthe Sarbanes-Oxley Act of 2002, that the Annual Report of Apple Computer, Inc. on Form 10-K for the fiscal year ended September 24, 2005 fully complies with the requirements of Section 13(a) or 15(d) of theSecurities Exchange Act of 1934 and that information contained in such Form 10-K fairly presents in all material respects the financial condition and results of operations of Apple Computer, Inc.
By: /s/ PETER OPPENHEIMERPeter Oppenheimer
Senior Vice President and Chief Financial Officer