Embed Size (px)
Citation preview
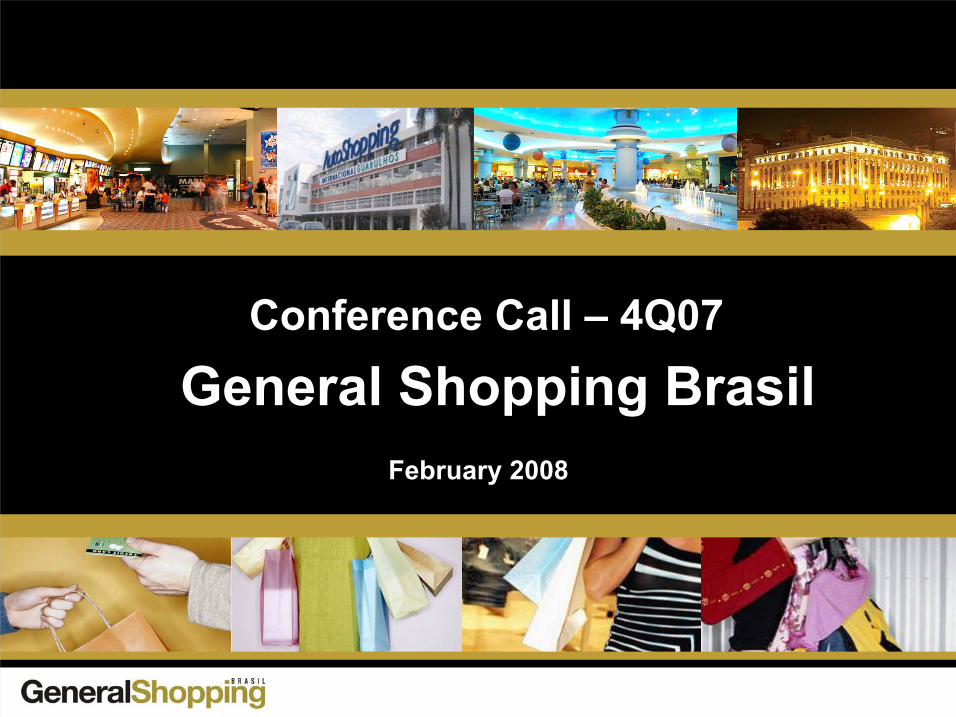
General Shopping BrasilConference Call – 4Q07
February 2008
Disclaimer
1
This presentation contains statements that are forward-looking within the meaning of Section 27A of the Securities Act of 1933 and Section 21E of the Securities Exchange Act of 1934. Such forward-looking statements are only predictions and are not guarantees of future performance. Investors are cautioned that any such forward-looking statements are and will be, as the case may be, subject to many risks, uncertainties and factors relating to the operations and business environments of General Shopping and its subsidiaries that may cause the actual results of the companies to be materially different from any future results expressed or implied in such forward-looking statements.
This material is published solely for informational purposes and is not to be construed as a solicitation or an offer to buy or sell any securities or related financial instruments and should not be treated as giving investment advice. It is not targeted to the specific investment objectives, financial situation or particular needs of any recipient. No representation or warranty, either express or implied, is provided in relation to the accuracy, completeness or reliability of the information contained herein. This material should not be regarded by recipients as a substitute for the exercise of their own judgment.
Any opinions expressed in this material are expressed as of this date and subject to change without notice and General Shopping is not under the obligation to update or keep current the information contained herein. General Shopping and the respective affiliates, directors, partners and employees accept no liability whatsoever for any loss or damage of any kind arising out of the use of all or any part of this material. You should consult with your own legal, regulatory, tax, business, investment, financial and accounting advisers to the extent that you deem it necessary, and make your own investment, hedging and trading decision (including decisions regarding the suitability of this transaction) based upon your own judgment and advice from such advisers as you deem necessary and not upon any views expressed in this material.
Agenda
2
Highlights
Sector Overview
Company Overview
Financial Highlights
3
Highlights
One of the largest companies in the Brazilian Shopping Center industry in terms of own GLA (1)
Majority ownership: 86.7% average interest
12 shopping centers and 5 greenfields
Total GLA: 198,017 m2
Own GLA: 171,576 m2
Complementary services activities
4T07 financial highlights
– Gross revenue: +61.2%
– Adjusted EBITDA: +134.2%
2007 EBITDA margin: 72.2%
Focus on serving the B and C consumption classes
These classes represent approximately 66% of the total consumption in Brazil
(1) Gross leasable area

Sector Overview
5
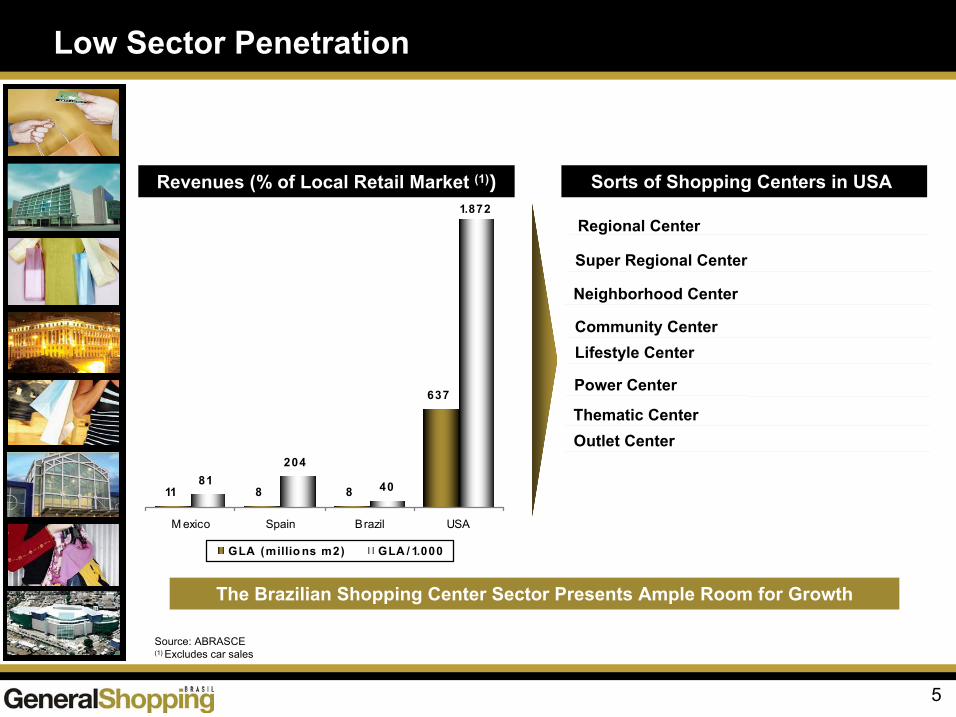
Sorts of Shopping Centers in USA
11 8 8
637
81204
40
1.872
M exico Spain Brazil USA
GLA (millio ns m2) GLA / 1.000
Regional Center
Super Regional Center
Neighborhood Center
Community CenterLifestyle Center
Power Center
Thematic CenterOutlet Center
Low Sector Penetration
Revenues (% of Local Retail Market (1))
The Brazilian Shopping Center Sector Presents Ample Room for Growth
Source: ABRASCE(1) Excludes car sales
6
Brazilian Shopping Center Industry Revenue (1)
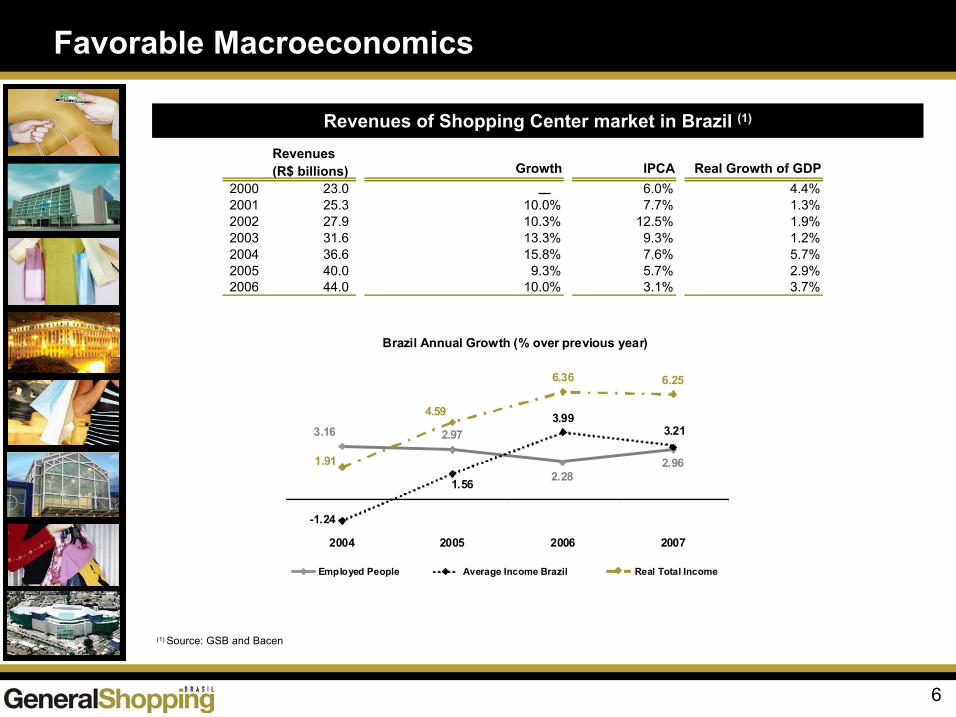
(1) Source: GSB and Bacen
Favorable Macroeconomics
Revenues of Shopping Center market in Brazil (1)
Brazil Annual Growth (% over previous year)
3.16 2.97
2.282.96
-1.24
1.56
3.993.21
1.91
4.59
6.36 6.25
2004 2005 2006 2007
Employed People Average Income Brazil Real Total Income
Revenues (R$ billions) Growth IPCA Real Growth of GDP
2000 23.0 6.0% 4.4%2001 25.3 10.0% 7.7% 1.3%2002 27.9 10.3% 12.5% 1.9%2003 31.6 13.3% 9.3% 1.2%2004 36.6 15.8% 7.6% 5.7%2005 40.0 9.3% 5.7% 2.9%2006 44.0 10.0% 3.1% 3.7%
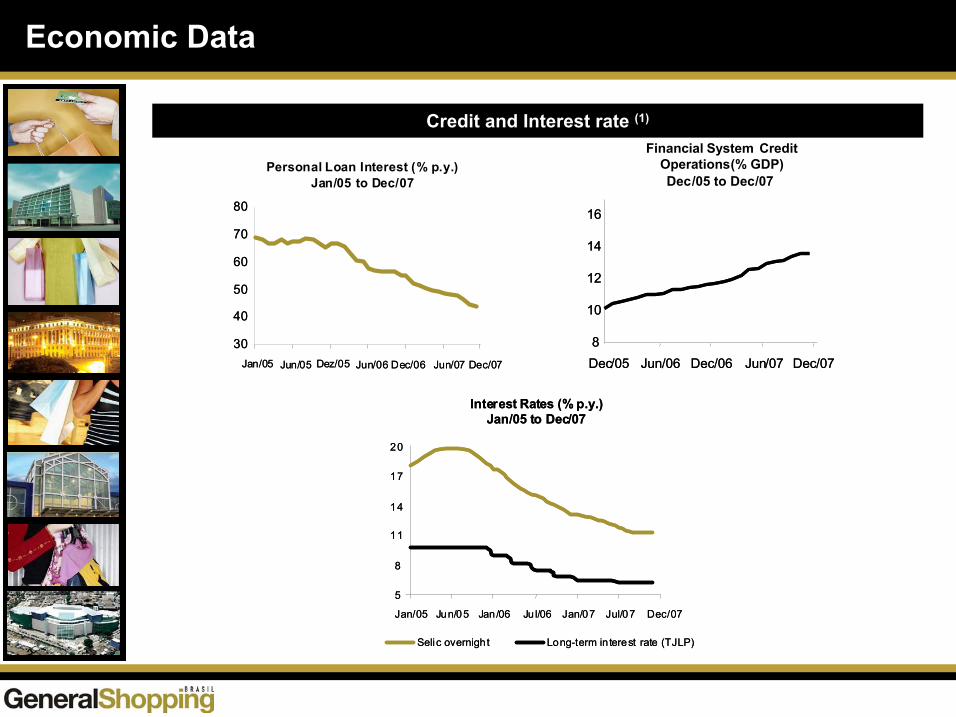
Economic Data
Credit and Interest rate (1)
30
40
50
60
70
80
Jan/05 Jun/05 Dez/05 Jun/06 Dec/06 Jun/07 Dec/07
30
40
50
60
70
80
Jan/05 Jun/05 Dez/05 Jun/06 Dec/06 Jun/07 Dec/07
Personal Loan Interest (% p.y.)Jan/05 to Dec/07
5
8
11
14
17
20
Jan/05 Jun/05 Jan/06 Ju l/06 Jan/07 Jul/07
Selic overnight Long-term interest rate (TJLP)
Dec/07
Interest Rates (% p.y.)Jan/05 to Dec/07
5
8
11
14
17
20
Jan/05 Jun/05 Jan/06 Ju l/06 Jan/07 Jul/07
Selic overnight Long-term interest rate (TJLP)
Dec/07
Interest Rates (% p.y.)Jan/05 to Dec/07
Financial System CreditOperations(% GDP)Dec/05 to Dec/07
8
10
12
14
16
Dec/05 Jun/06 Dec/06 Jun/07 Dec/078
10
12
14
16
Dec/05 Jun/06 Dec/06 Jun/07 Dec/07
8
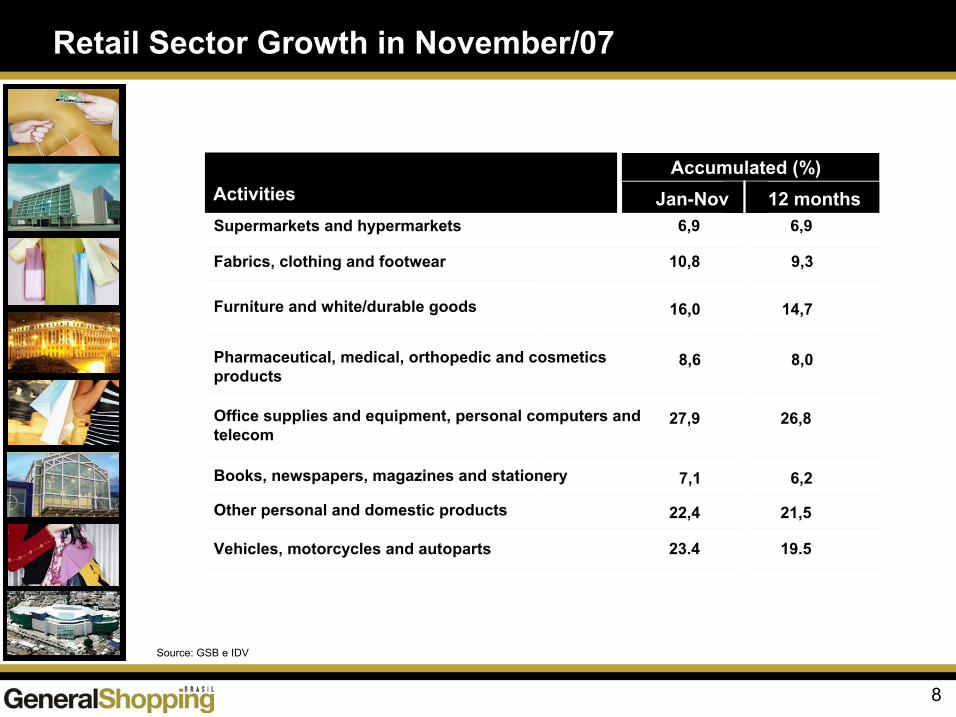
Source: GSB e IDV
Activities Jan-Nov 12 months6,9 6,9
10,8 9,3
8,6 8,0
27,9 26,8
7,1 6,2
22,4 21,5
Accumulated (%)
16,0 14,7
Retail Sector Growth in November/07
Supermarkets and hypermarkets
Fabrics, clothing and footwear
Pharmaceutical, medical, orthopedic and cosmetics products
Office supplies and equipment, personal computers and telecom
Books, newspapers, magazines and stationery
Other personal and domestic products
Vehicles, motorcycles and autoparts 23.4 19.5
Furniture and white/durable goods
9
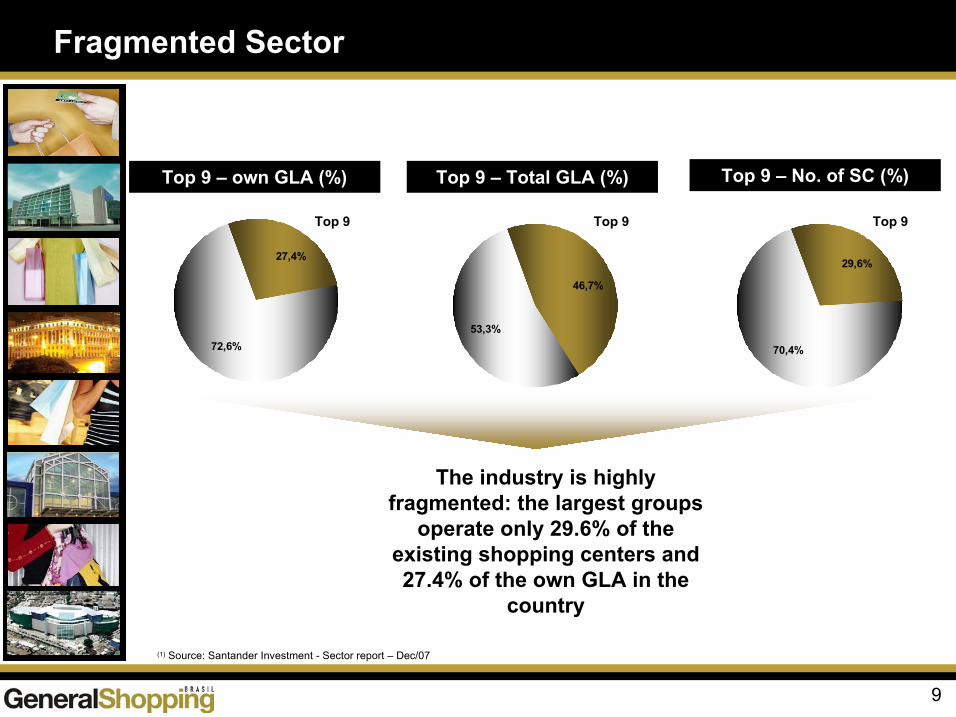
29,6%
70,4%
(1) Source: Santander Investment - Sector report – Dec/07
Top 9 – own GLA (%)
27,4%
72,6%
Top 9 – No. of SC (%)Top 9 – Total GLA (%)
46,7%
53,3%
Top 9
Fragmented Sector
The industry is highly fragmented: the largest groups
operate only 29.6% of the existing shopping centers and 27.4% of the own GLA in the
country
Top 9 Top 9

Company Overview
11
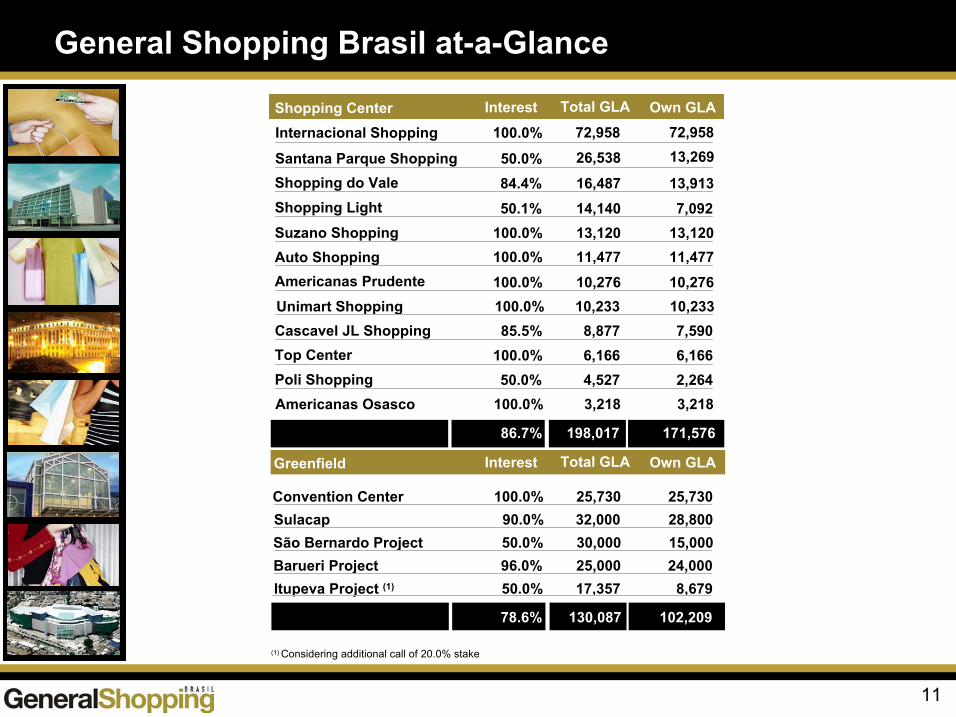
Internacional Shopping 100.0% 72,958 72,958
Santana Parque Shopping 50.0% 26,538 13,269
Shopping do Vale 84.4% 16,487 13,913Shopping Light 50.1% 14,140 7,092Suzano Shopping 100.0% 13,120 13,120Auto Shopping 100.0% 11,477 11,477Americanas Prudente 100.0% 10,276 10,276
Cascavel JL Shopping 85.5% 8,877 7,590Top Center 100.0% 6,166 6,166Poli Shopping 50.0% 4,527 2,264Americanas Osasco 100.0% 3,218 3,218
86.7% 198,017 171,576
Itupeva Project (1) 50.0% 17,357 8,679Barueri Project 96.0% 25,000 24,000
Sulacap 90.0% 32,000 28,800Convention Center 100.0% 25,730 25,730
Greenfield
78.6% 130,087 102,209
Unimart Shopping 100.0% 10,233 10,233
São Bernardo Project 50.0% 30,000 15,000
(1) Considering additional call of 20.0% stake
Shopping Center Total GLA Own GLAInterest
General Shopping Brasil at-a-Glance
Total GLA Own GLAInterest
12
Majority ownership interest
Close relationship with store owners and retail intelligence
Well defined growth strategy
Diversified portfolio comprised of high quality assets
Innovative malls and services
Experienced management team
Competitive Advantages
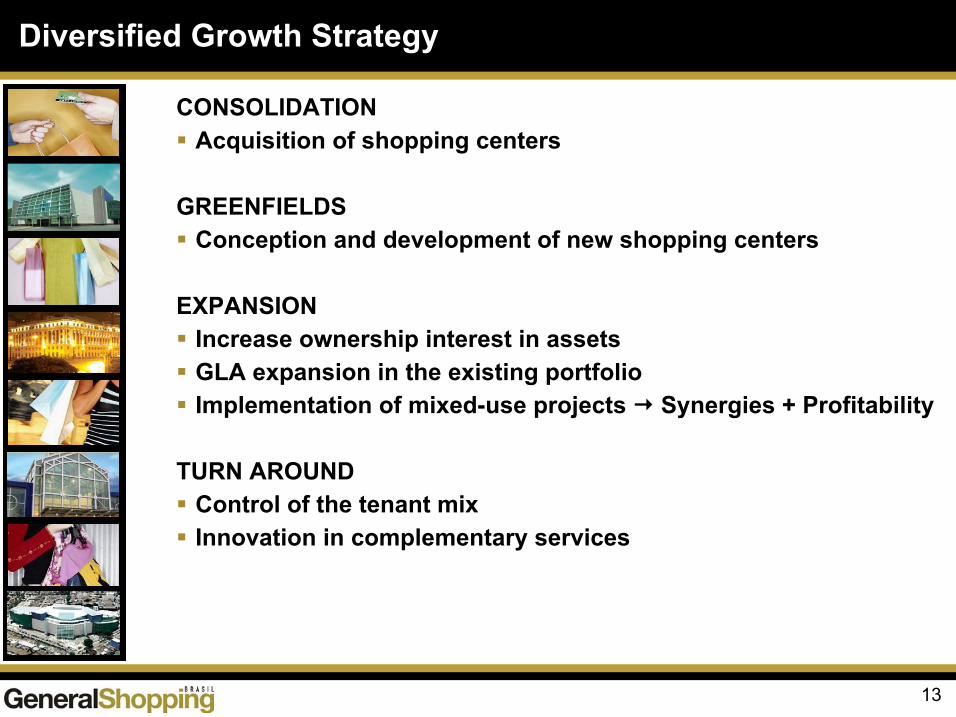
CONSOLIDATIONAcquisition of shopping centers
GREENFIELDSConception and development of new shopping centers
EXPANSIONIncrease ownership interest in assetsGLA expansion in the existing portfolioImplementation of mixed-use projects Synergies + Profitability
TURN AROUNDControl of the tenant mixInnovation in complementary services
13
Diversified Growth Strategy
14
Diversified Growth Strategy
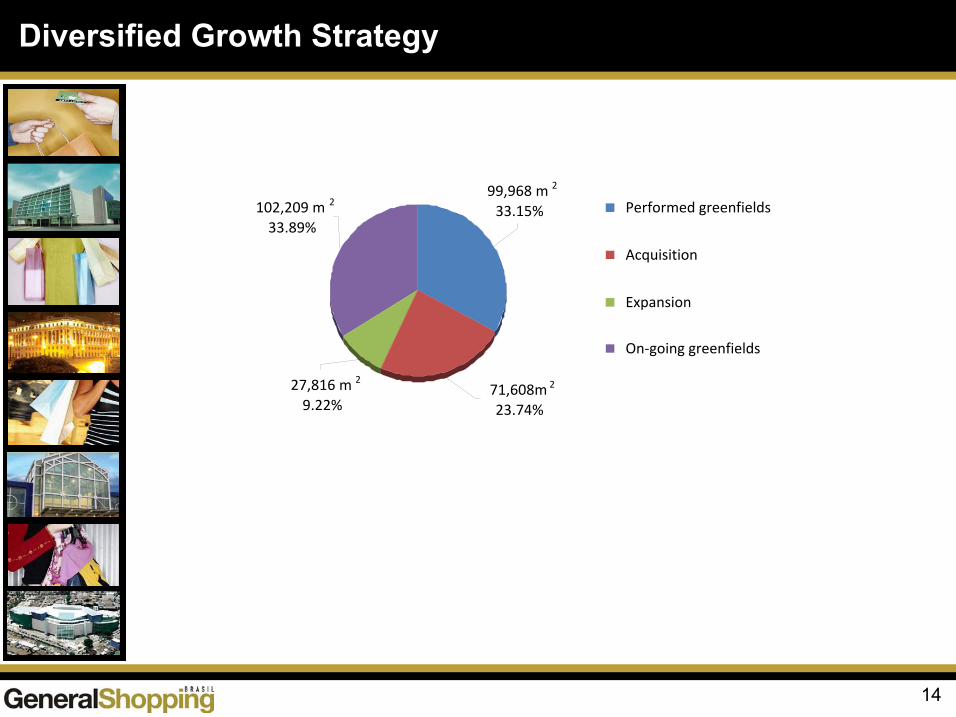
99,968 m 2
33.15%
71,608m 2
23.74%
27,816 m 2
9.22%
102,209 m 2
33.89%Performed greenfields
Acquisition
Expansion
On-going greenfields
15
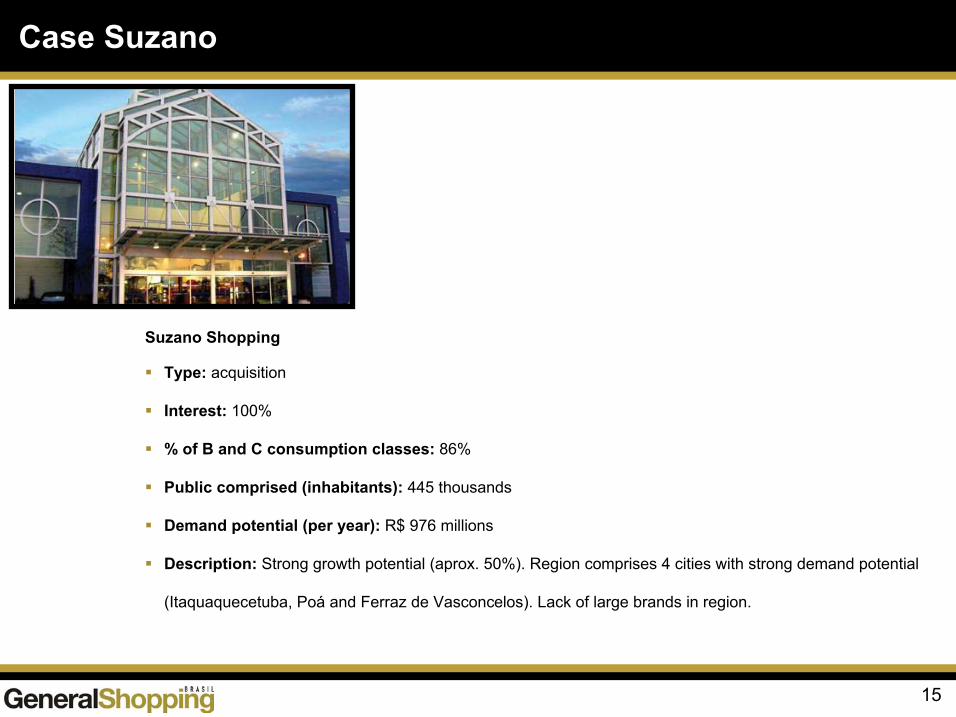
Case Suzano
Suzano Shopping
Type: acquisition
Interest: 100%
% of B and C consumption classes: 86%
Public comprised (inhabitants): 445 thousands
Demand potential (per year): R$ 976 millions
Description: Strong growth potential (aprox. 50%). Region comprises 4 cities with strong demand potential
(Itaquaquecetuba, Poá and Ferraz de Vasconcelos). Lack of large brands in region.
16
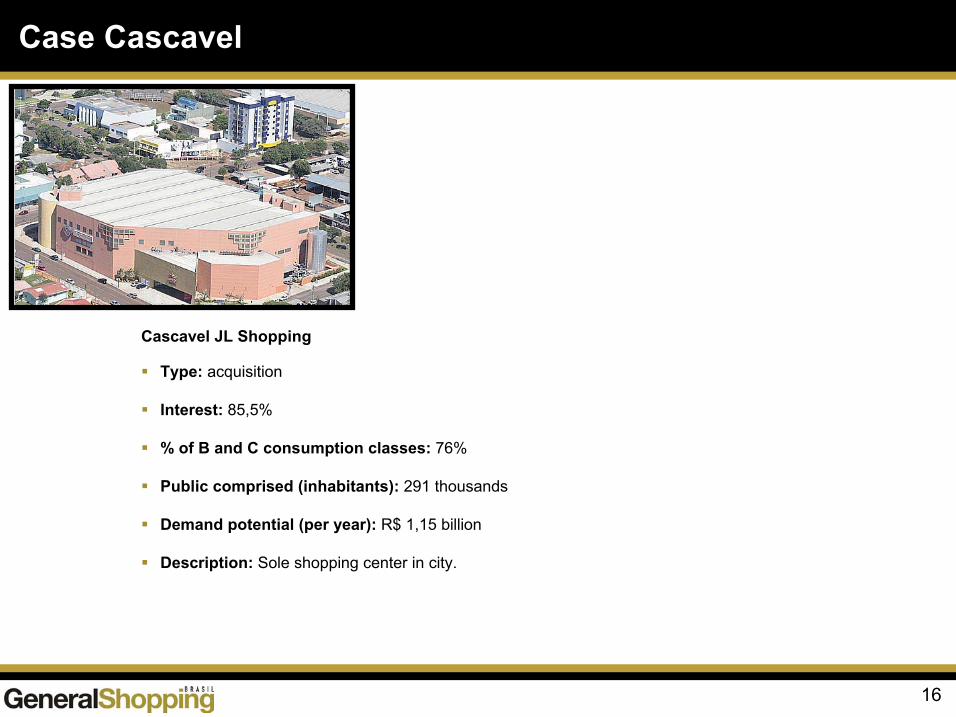
Case Cascavel
Cascavel JL Shopping
Type: acquisition
Interest: 85,5%
% of B and C consumption classes: 76%
Public comprised (inhabitants): 291 thousands
Demand potential (per year): R$ 1,15 billion
Description: Sole shopping center in city.
17
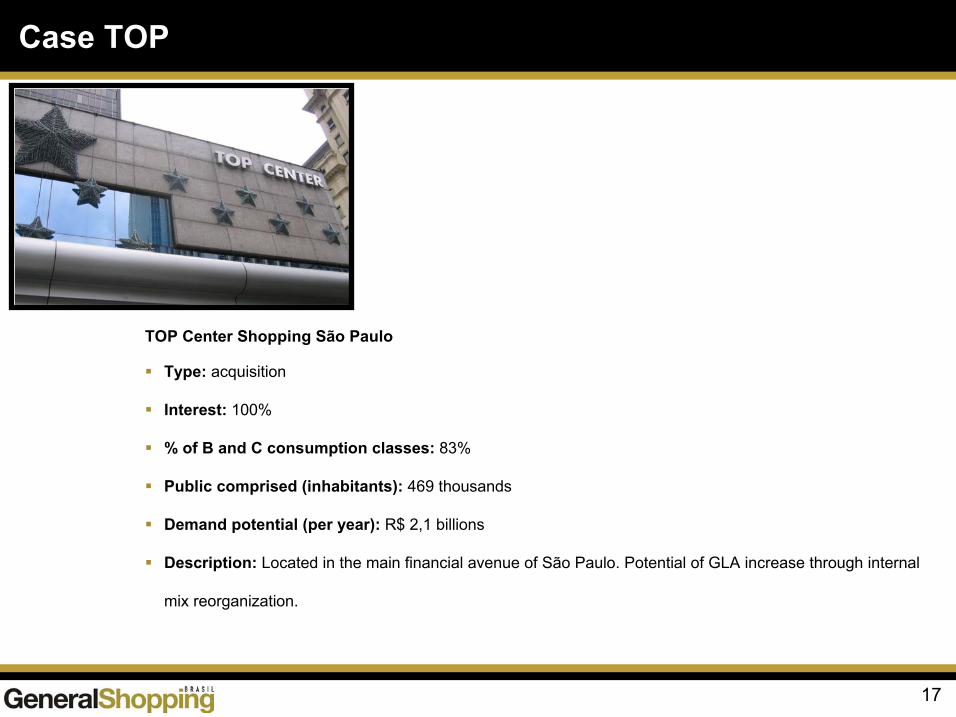
Case TOP
TOP Center Shopping São Paulo
Type: acquisition
Interest: 100%
% of B and C consumption classes: 83%
Public comprised (inhabitants): 469 thousands
Demand potential (per year): R$ 2,1 billions
Description: Located in the main financial avenue of São Paulo. Potential of GLA increase through internal
mix reorganization.
18
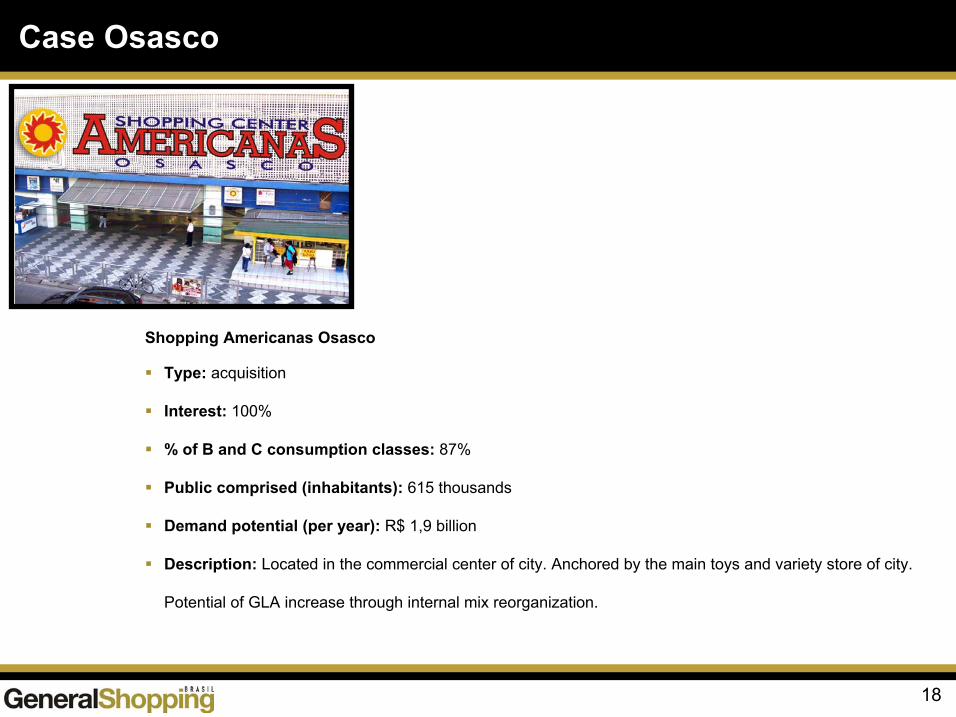
Case Osasco
Shopping Americanas Osasco
Type: acquisition
Interest: 100%
% of B and C consumption classes: 87%
Public comprised (inhabitants): 615 thousands
Demand potential (per year): R$ 1,9 billion
Description: Located in the commercial center of city. Anchored by the main toys and variety store of city.
Potential of GLA increase through internal mix reorganization.
19
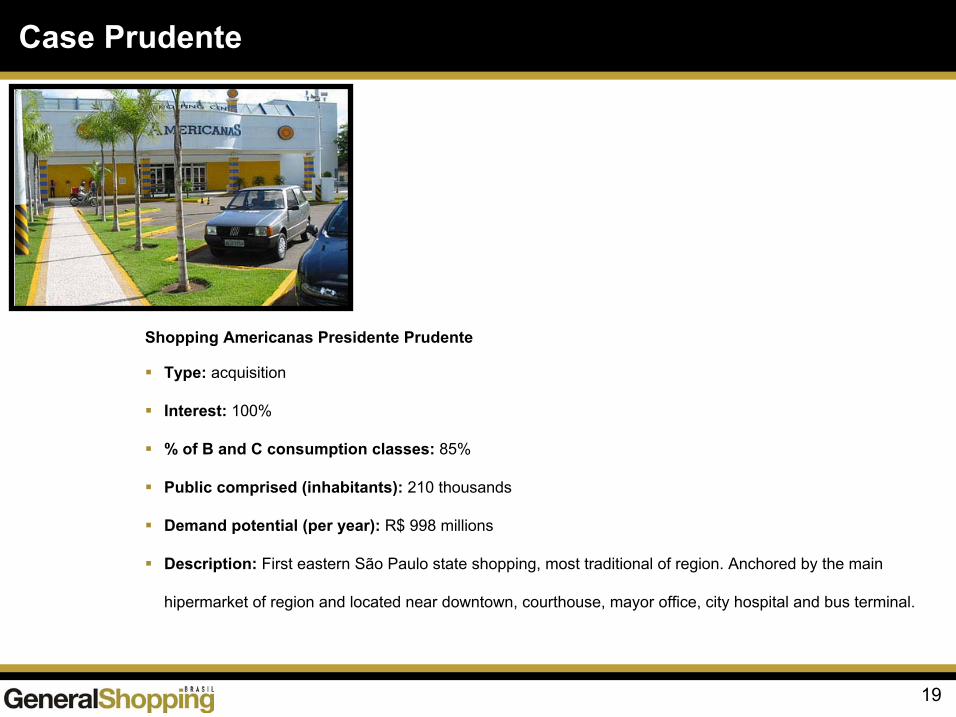
Case Prudente
Shopping Americanas Presidente Prudente
Type: acquisition
Interest: 100%
% of B and C consumption classes: 85%
Public comprised (inhabitants): 210 thousands
Demand potential (per year): R$ 998 millions
Description: First eastern São Paulo state shopping, most traditional of region. Anchored by the main
hipermarket of region and located near downtown, courthouse, mayor office, city hospital and bus terminal.
20
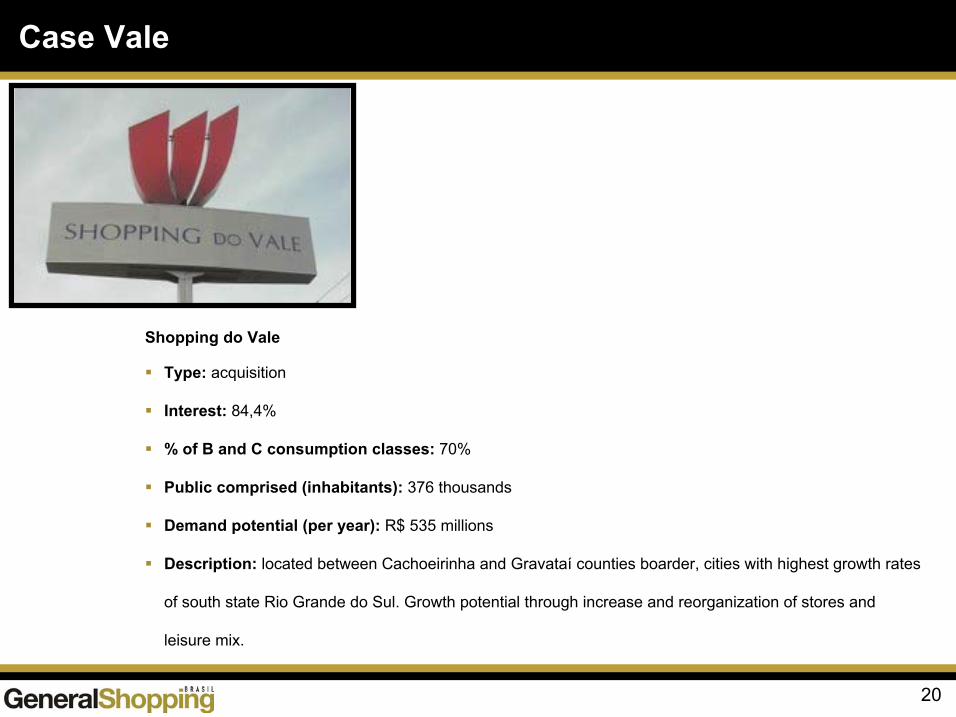
Case Vale
Shopping do Vale
Type: acquisition
Interest: 84,4%
% of B and C consumption classes: 70%
Public comprised (inhabitants): 376 thousands
Demand potential (per year): R$ 535 millions
Description: located between Cachoeirinha and Gravataí counties boarder, cities with highest growth rates
of south state Rio Grande do Sul. Growth potential through increase and reorganization of stores and
leisure mix.
21
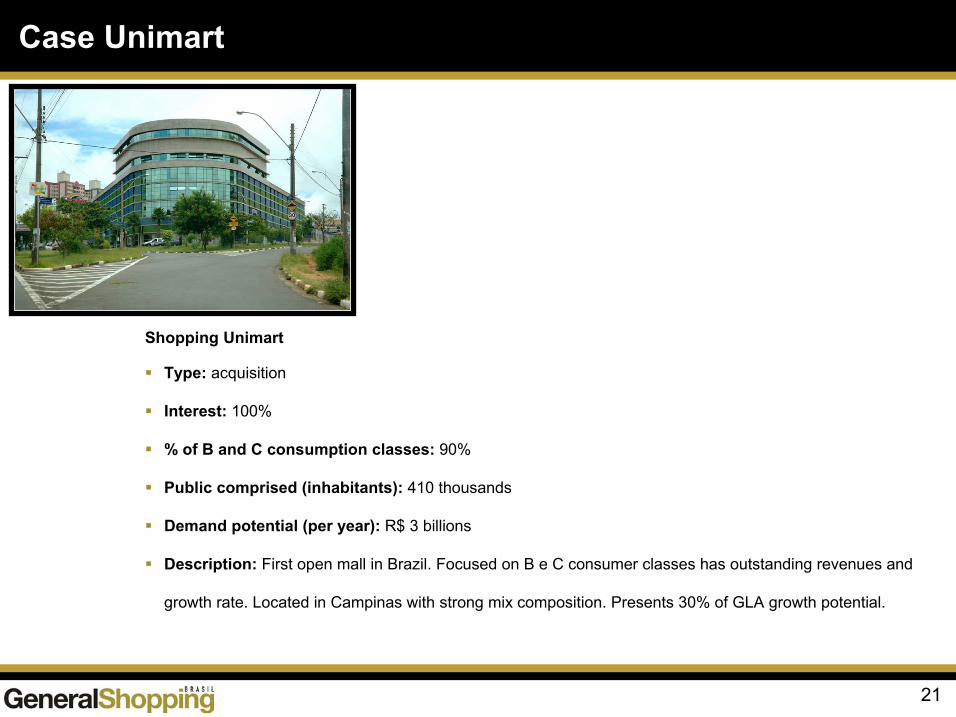
Case Unimart
Shopping Unimart
Type: acquisition
Interest: 100%
% of B and C consumption classes: 90%
Public comprised (inhabitants): 410 thousands
Demand potential (per year): R$ 3 billions
Description: First open mall in Brazil. Focused on B e C consumer classes has outstanding revenues and
growth rate. Located in Campinas with strong mix composition. Presents 30% of GLA growth potential.
22
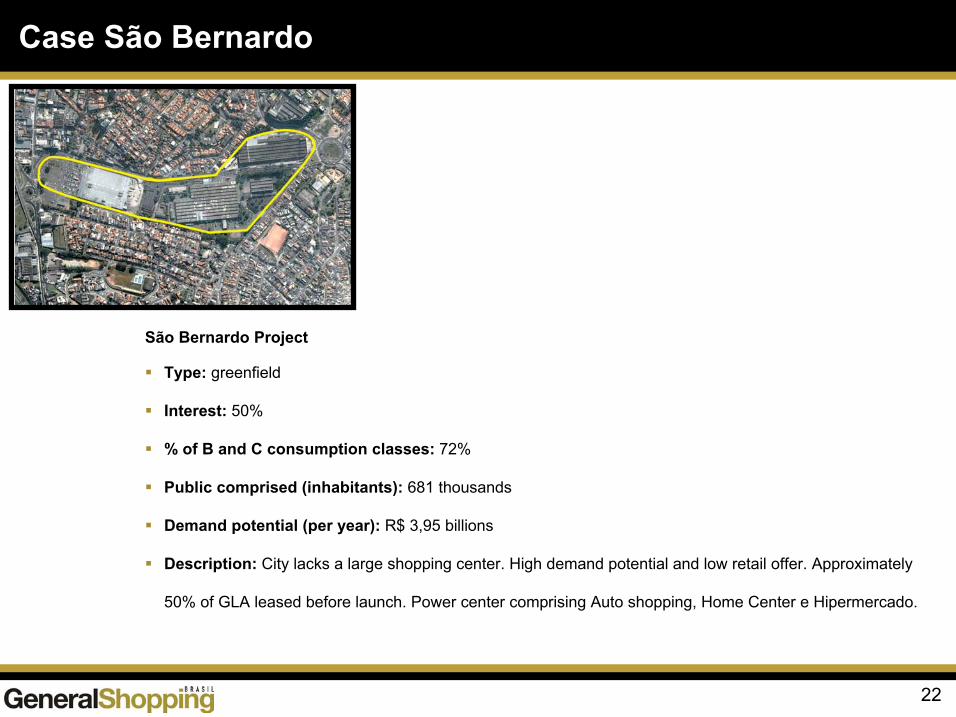
Case São Bernardo
São Bernardo Project
Type: greenfield
Interest: 50%
% of B and C consumption classes: 72%
Public comprised (inhabitants): 681 thousands
Demand potential (per year): R$ 3,95 billions
Description: City lacks a large shopping center. High demand potential and low retail offer. Approximately
50% of GLA leased before launch. Power center comprising Auto shopping, Home Center e Hipermercado.
23
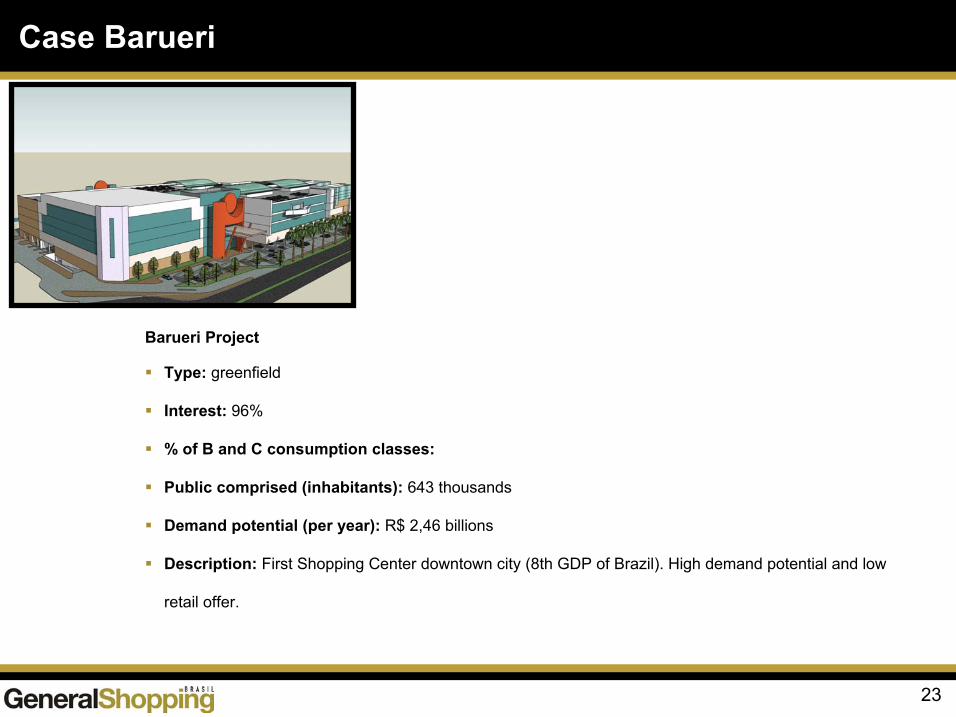
Case Barueri
Barueri Project
Type: greenfield
Interest: 96%
% of B and C consumption classes:
Public comprised (inhabitants): 643 thousands
Demand potential (per year): R$ 2,46 billions
Description: First Shopping Center downtown city (8th GDP of Brazil). High demand potential and low
retail offer.
24
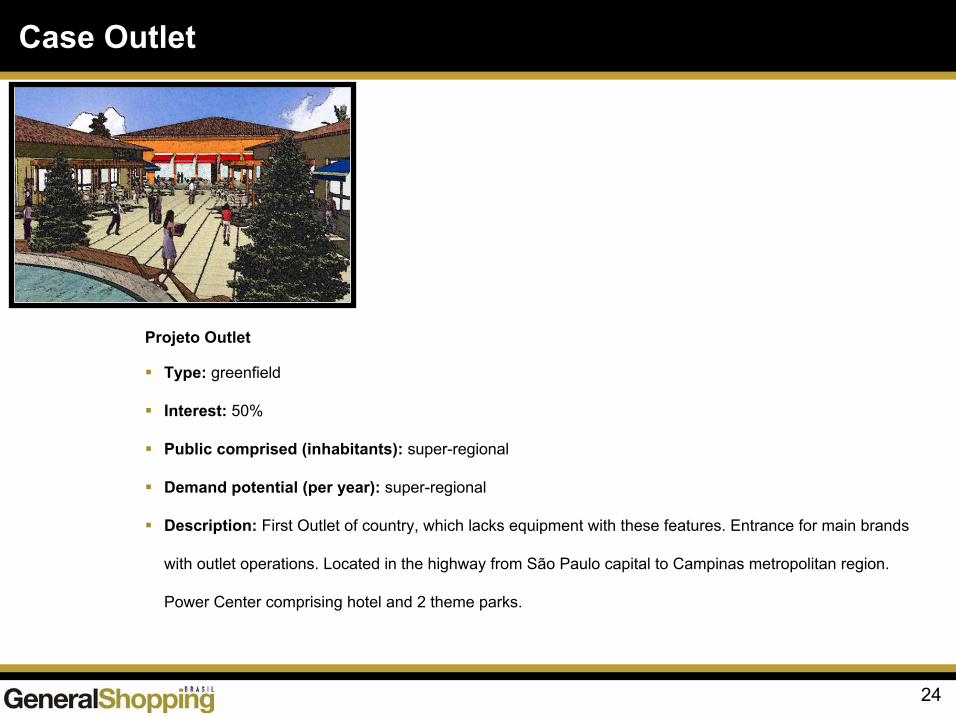
Case Outlet
Projeto Outlet
Type: greenfield
Interest: 50%
Public comprised (inhabitants): super-regional
Demand potential (per year): super-regional
Description: First Outlet of country, which lacks equipment with these features. Entrance for main brands
with outlet operations. Located in the highway from São Paulo capital to Campinas metropolitan region.
Power Center comprising hotel and 2 theme parks.
25
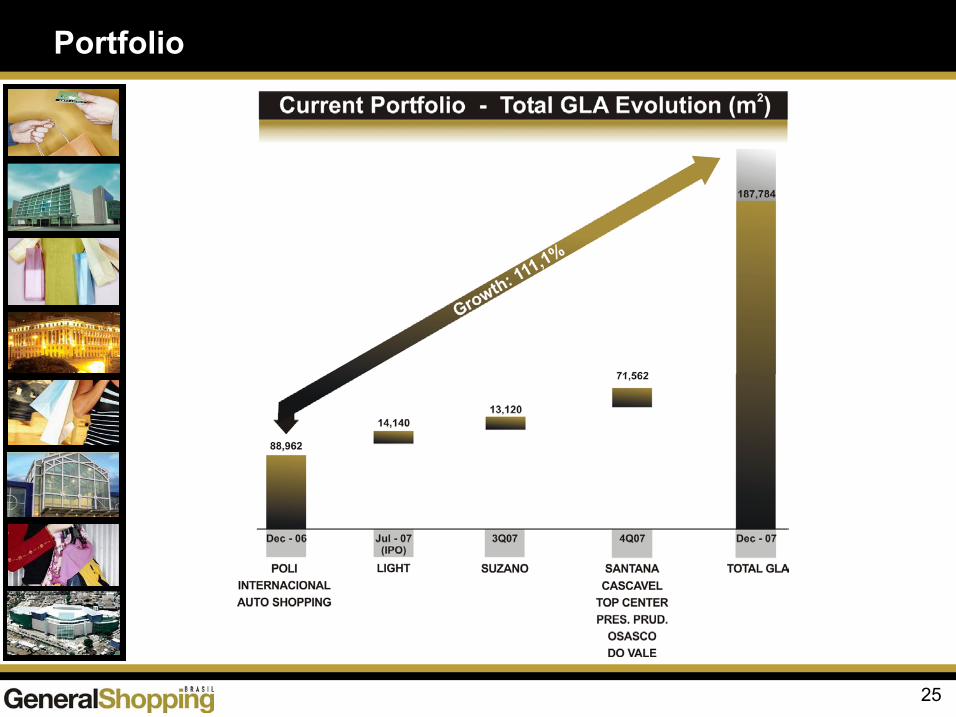
Portfolio
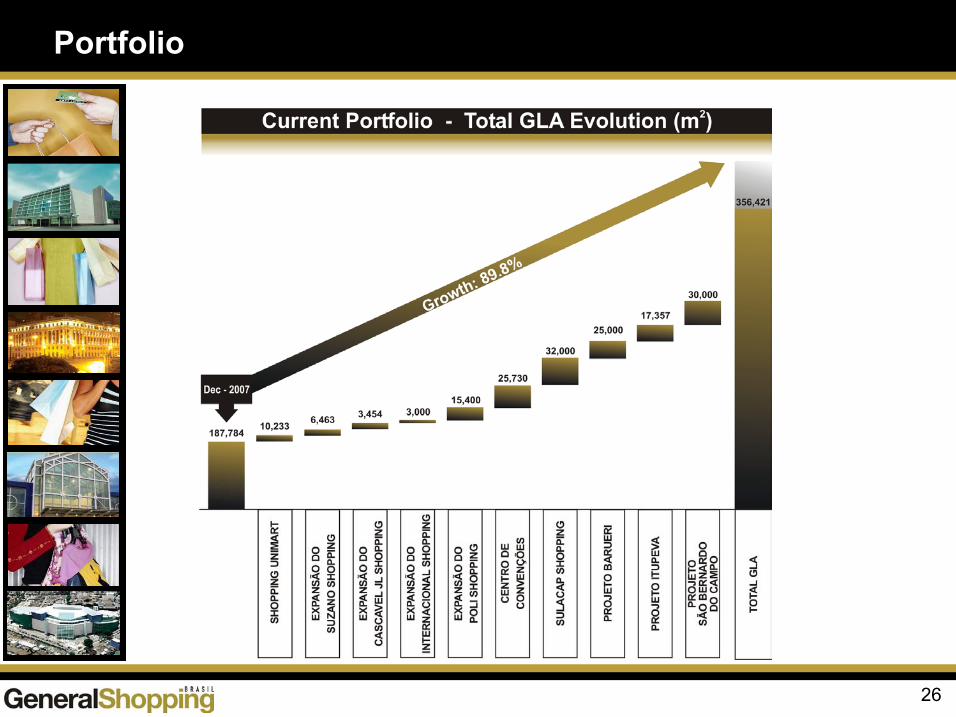
26
Portfolio
Total GLA (m2)No. of storesVisitors/year (mm)
27
Total GLA (m2)No. of storesVisitors/year (mm)
11,47780
NA
9
72,958292
23.5
1
Total GLA (m2)No. of storesVisitors/year (mm)
16
17,357NANA
(1)Total GLA (m2)No. of storesVisitors/year (mm)
14,140134
12.0
7
Total GLA (m2)No. of storesVisitors/year (mm)
13,1201709.0
6
Total GLA (m2)No. of storesVisitors/year (mm)
5
26,538176NA
Total GLA (m2)No. of storesVisitors/year (mm)
(1) Estimated
14
25,000 NA NA
(1)
13
25,730NANA
Total GLA (m2)No. of storesVisitors/year (mm)
4
3,21819
1.5
Total GLA (m2)No. of storesVisitors/year (mm)
2
6,16655
4.0
Total GLA (m2)No. of storesVisitors/year (mm)
4,52752
6.0
3
Total GLA (m2)No. of storesVisitors/year (mm)
8
10,27656
4.0
Total GLA (m2)No. of storesVisitors/year (mm)
12
10,23391
6.48
Total GLA (m2)No. of storesVisitors/year (mm)
17
30,000NANA
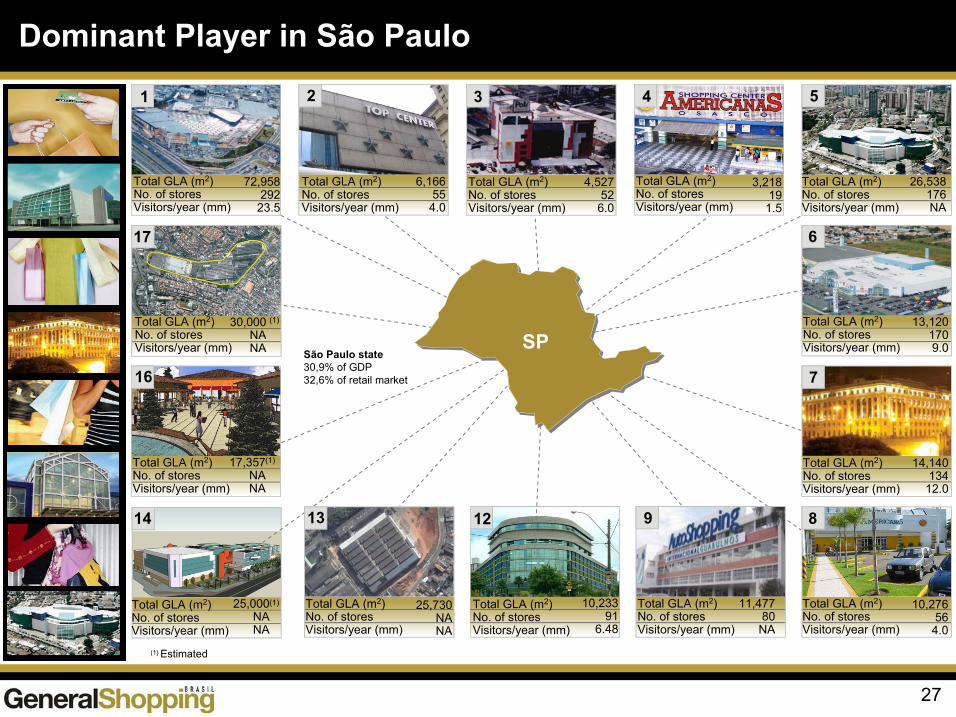
Total GLA (m2)No. of storesVisitors/year (mm) SP
(1)
São Paulo state30,9% of GDP32,6% of retail market
Dominant Player in São Paulo
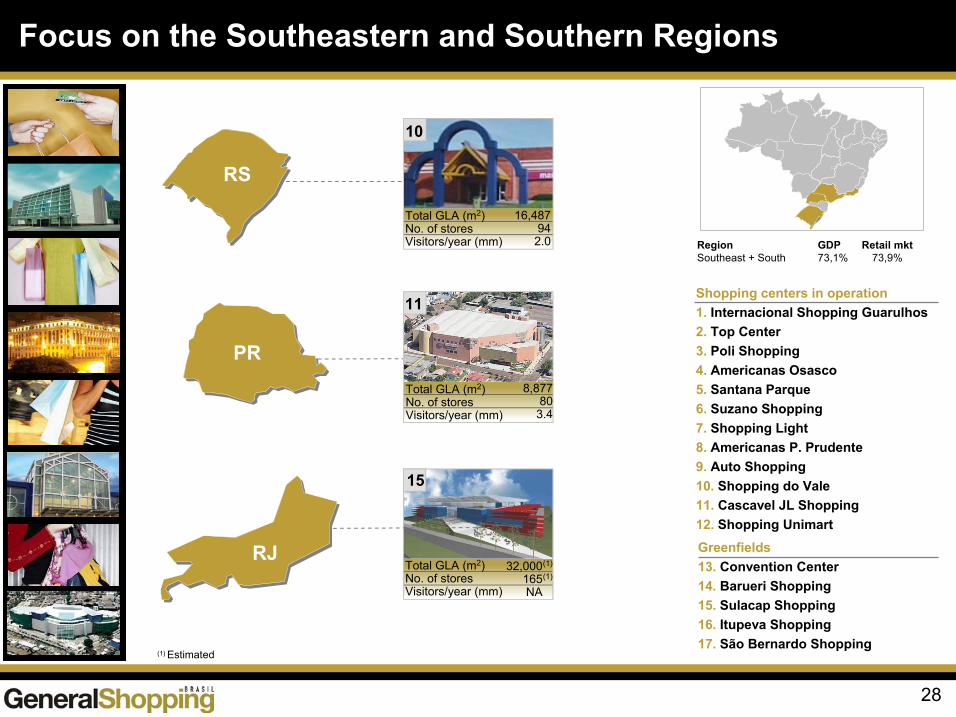
28
Shopping centers in operation1. Internacional Shopping Guarulhos2. Top Center3. Poli Shopping4. Americanas Osasco5. Santana Parque6. Suzano Shopping7. Shopping Light8. Americanas P. Prudente9. Auto Shopping10. Shopping do Vale11. Cascavel JL Shopping12. Shopping UnimartGreenfields13. Convention Center14. Barueri Shopping15. Sulacap Shopping16. Itupeva Shopping17. São Bernardo Shopping
(1) Estimated
16,48794
2.0
Total GLA (m2)No. of storesVisitors/year (mm)
10
11
8,87780
3.4
Total GLA (m2)No. of storesVisitors/year (mm)
32,000165NA
(1)(1)
15
Total GLA (m2)No. of storesVisitors/year (mm)
RJ
RS
PR
RegionSoutheast + South
Focus on the Southeastern and Southern Regions
GDP Retail mkt73,1% 73,9%
29
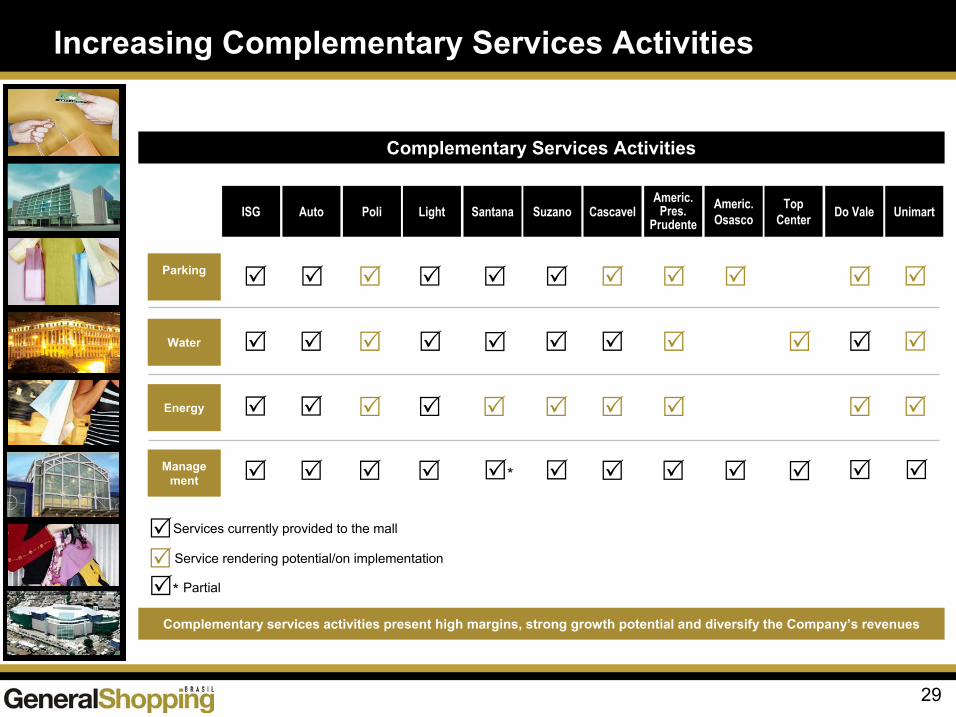
Complementary services activities present high margins, strong growth potential and diversify the Company’s revenues
ISG Auto Poli Light Santana Suzano CascavelAmeric.
Pres.Prudente
Americ.Osasco Do ValeTop
Center
*
*
Unimart
Increasing Complementary Services Activities
Services currently provided to the mall
Service rendering potential/on implementation
Parking
Water
Energy
Management
Partial
Complementary Services Activities
30
Use of energy sources approved by the federal government’s Alternative Electric Energy Sources Incentive Program
Water supply managementReuse for air-conditioning, gardens and bathrooms Licensed wells
Waste recycling
Fluorescent lamp recycling
Natural lighting in architecture projects
Reforesting programs
Sustainability
31
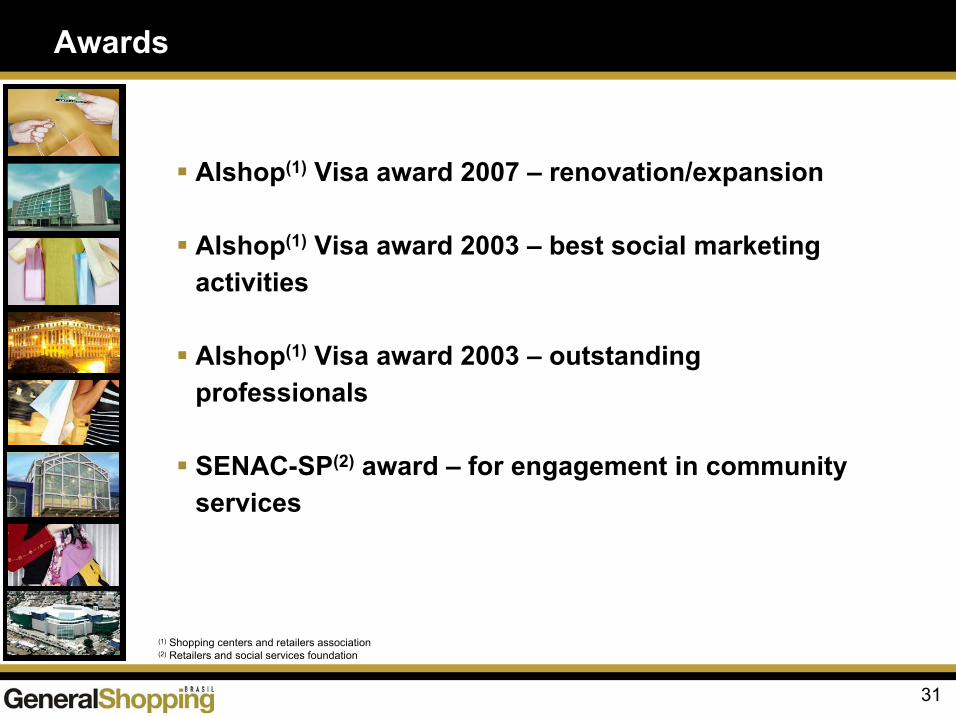
(1) Shopping centers and retailers association(2) Retailers and social services foundation
Alshop(1) Visa award 2007 – renovation/expansion
Alshop(1) Visa award 2003 – best social marketing activities
Alshop(1) Visa award 2003 – outstanding professionals
SENAC-SP(2) award – for engagement in community services
Awards
32
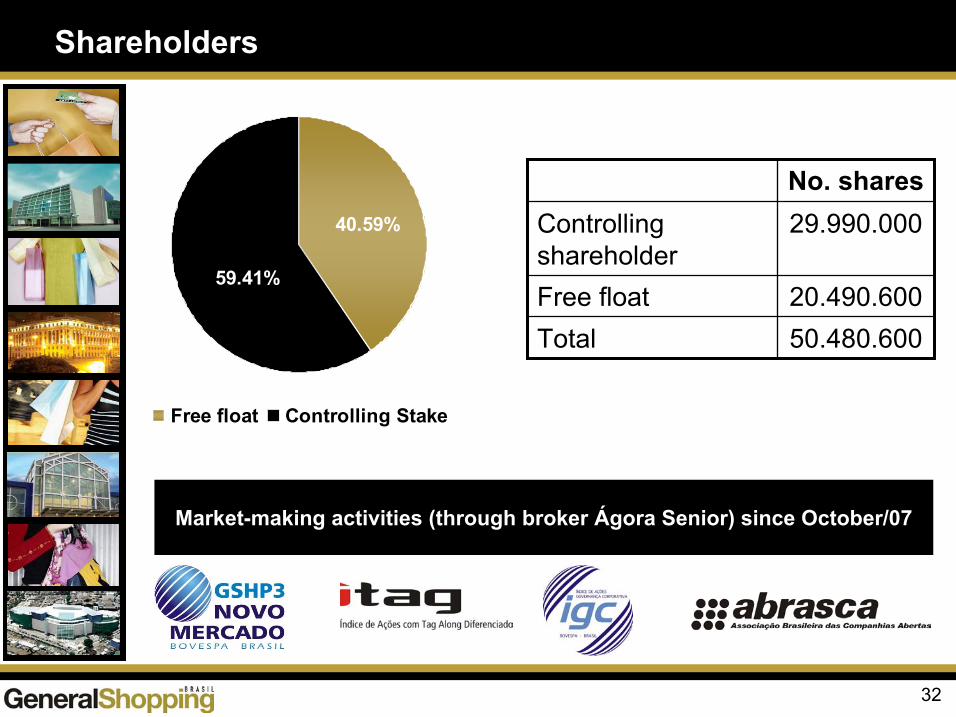
Shareholders
Market-making activities (through broker Ágora Senior) since October/07
40.59%
59.41%
Free float Controlling Stake
50.480.600Total20.490.600Free float
29.990.000Controlling shareholder
No. shares
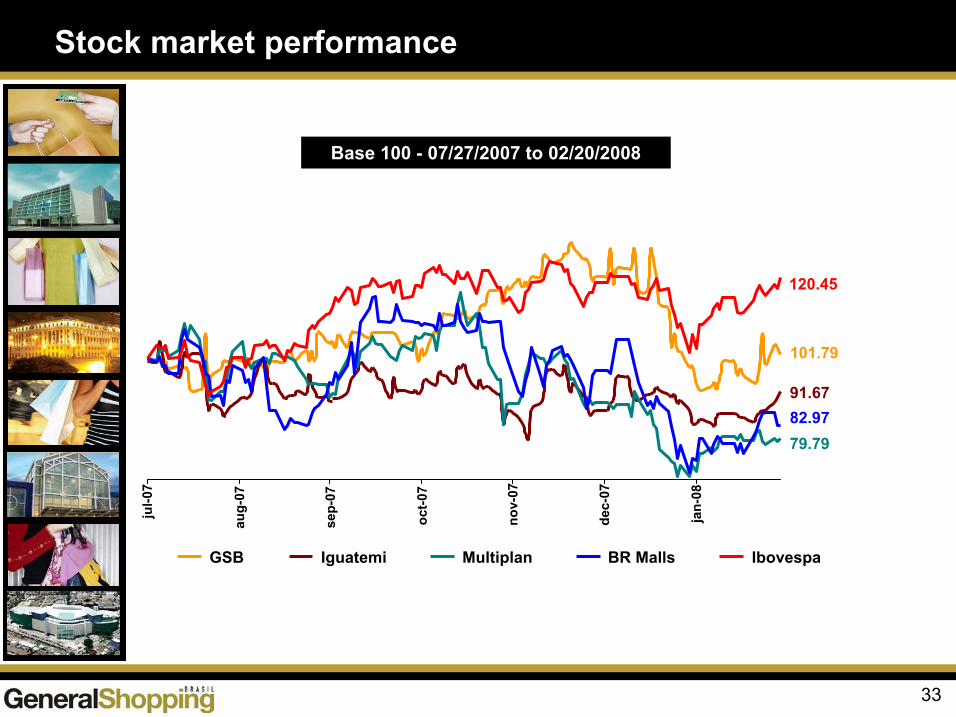
Stock market performance
33
Base 100 - 07/27/2007 to 02/20/2008
101.79
91.67
79.7982.97
120.45
jul-0
7
aug-
07
sep-
07
oct-0
7
nov-
07
dec-
07
jan-
08
GSB Iguatemi Multiplan BR Malls Ibovespa

Financial Performance
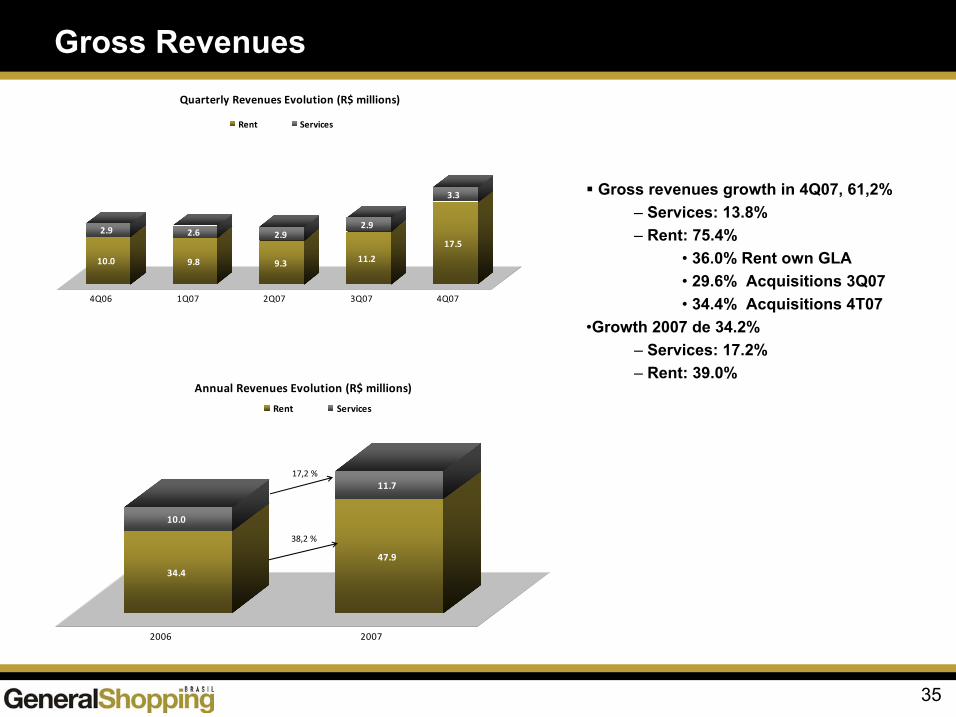
Gross Revenues
35
Gross revenues growth in 4Q07, 61,2%– Services: 13.8%– Rent: 75.4%
• 36.0% Rent own GLA• 29.6% Acquisitions 3Q07• 34.4% Acquisitions 4T07
•Growth 2007 de 34.2%– Services: 17.2%– Rent: 39.0%
10.0
2.9
9.8
2.6
9.3
2.9
11.2
2.9
17.5
3.3
4Q06 1Q07 2Q07 3Q07 4Q07
Quarterly Revenues Evolution (R$ millions)
Rent Services
34.4
10.0
47.9
11.7
2006 2007
Annual Revenues Evolution (R$ millions)
Rent Services
38,2 %
17,2 %

36
Rent Revenues
Same Store Rent growth of 27,4% in 4Q07 and 10,8% in 2007
Rent revenues breakdown in 2007: 90.6% rent, 4.9% transfer fees and e 4.5% mall/merchandise
89,5% minimum rent and 10.5% complementary rent in 2007
Quarterly Rent Revenues Evolution (R$ millions)
13.7
9.27.97.78.5
1.60.90.70.50.8
0.0
2.0
4.0
6.0
8.0
10.0
12.0
14.0
16.0
4Q06 1Q07 2Q07 3Q07 4Q07
Minimum
Complementary
10.012.7
33.6
37.2
4Q06 4Q07 2,006 2007
Same Store Revenues (R$ millions)
27.4 %
30.0
41.6
1.0 2.4 1.1 2.1 2.3 1.8
Rent Transfer fees Mall &Merchandising
Other rent
Rent Revenues Evolution (R$ millions)
2,006 2,007 2006
Revenues from projects
37
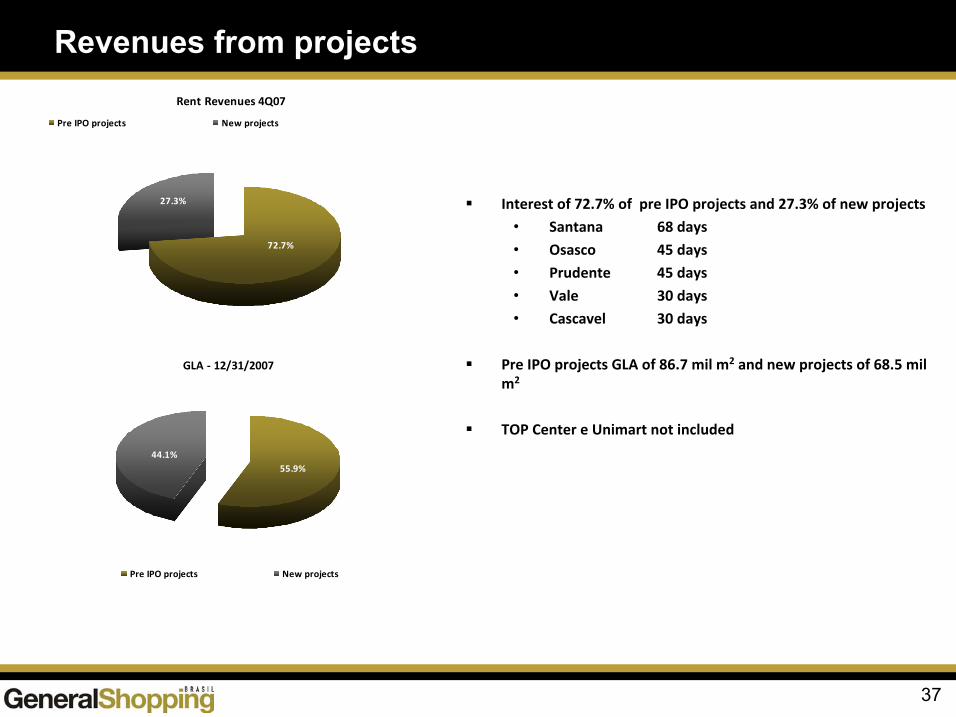
Interest of 72.7% of pre IPO projects and 27.3% of new projects
• Santana 68 days
• Osasco 45 days
• Prudente 45 days
• Vale 30 days
• Cascavel 30 days
Pre IPO projects GLA of 86.7 mil m2 and new projects of 68.5 mil m2
TOP Center e Unimart not included
Rent Revenues 4Q07
72.7%
27.3%
Pre IPO projects New projects
GLA - 12/31/2007
44.1%55.9%
Pre IPO projects New projects
38
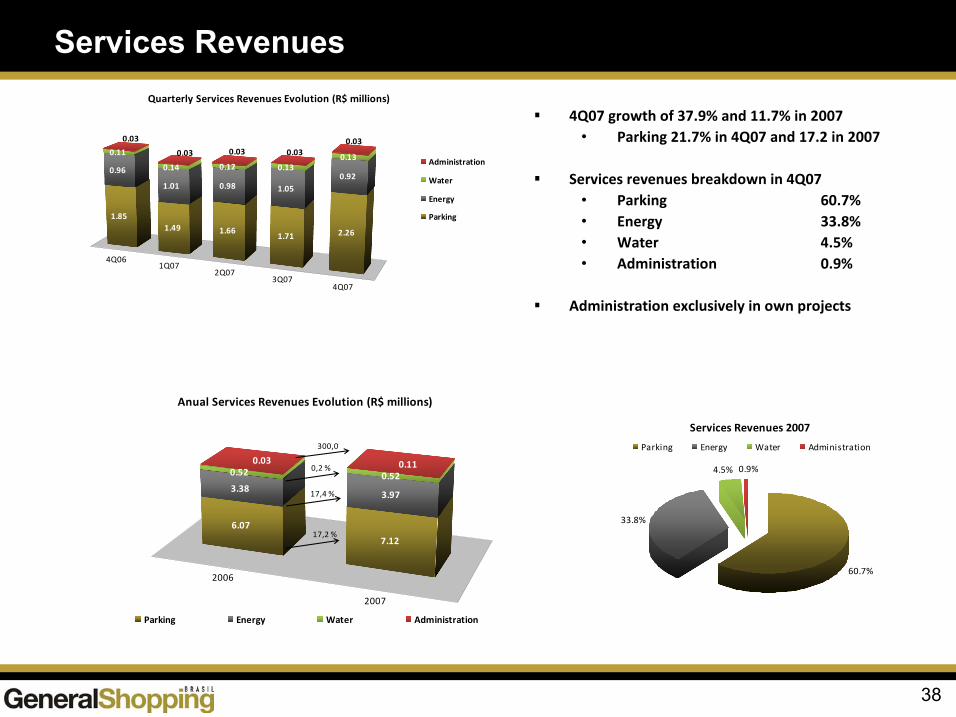
Services Revenues
4Q07 growth of 37.9% and 11.7% in 2007• Parking 21.7% in 4Q07 and 17.2 in 2007
Services revenues breakdown in 4Q07• Parking 60.7%• Energy 33.8%• Water 4.5%• Administration 0.9%
Administration exclusively in own projects
4Q061Q07
2Q073Q07
4Q07
1.85
0.96
0.11
0.03
1.49
1.01
0.14
0.03
1.66
0.98
0.12
0.03
1.71
1.05
0.13
0.03
2.26
0.92
0.13
0.03
0.00
0.50
1.00
1.50
2.00
2.50
3.00
3.50
Quarterly Services Revenues Evolution (R$ millions)
Administration
Water
Energy
Parking
Services Revenues 2007
60.7%
33.8%
4.5% 0.9%
Parking Energy Water Administration
2006
2007
6.07
3.38
0.520.03
7.12
3.97
0.520.11
0.00
2.00
4.00
6.00
8.00
10.00
12.00
Anual Services Revenues Evolution (R$ millions)
Parking Energy Water Administration
17,2 %
17,4 %
0,2 %
300,0
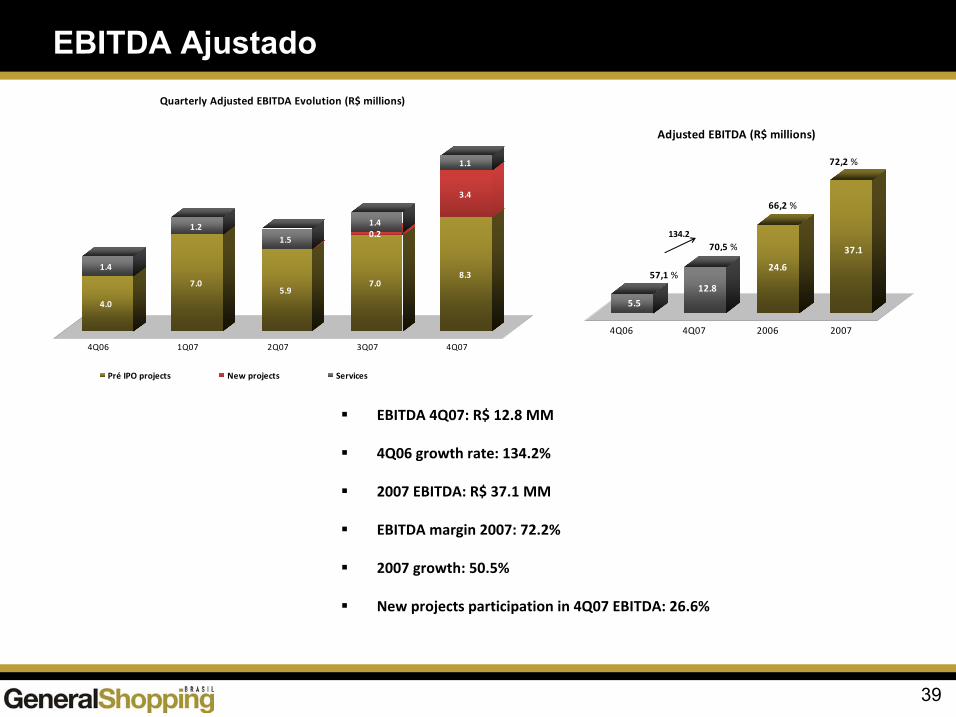
EBITDA Ajustado
39
EBITDA 4Q07: R$ 12.8 MM
4Q06 growth rate: 134.2%
2007 EBITDA: R$ 37.1 MM
EBITDA margin 2007: 72.2%
2007 growth: 50.5%
New projects participation in 4Q07 EBITDA: 26.6%
4.0
1.4
7.0
1.2
5.9
1.5
7.0
0.21.4
8.3
3.4
1.1
0.0
2.0
4.0
6.0
8.0
10.0
12.0
14.0
4Q06 1Q07 2Q07 3Q07 4Q07
Quarterly Adjusted EBITDA Evolution (R$ millions)
Pré IPO projects New projects Services
5.5
12.8
24.6
37.1
0.0
5.0
10.0
15.0
20.0
25.0
30.0
35.0
40.0
4Q06 4Q07 2006 2007
Adjusted EBITDA (R$ millions)
134.2
57,1 %
70,5 %
66,2 %
72,2 %
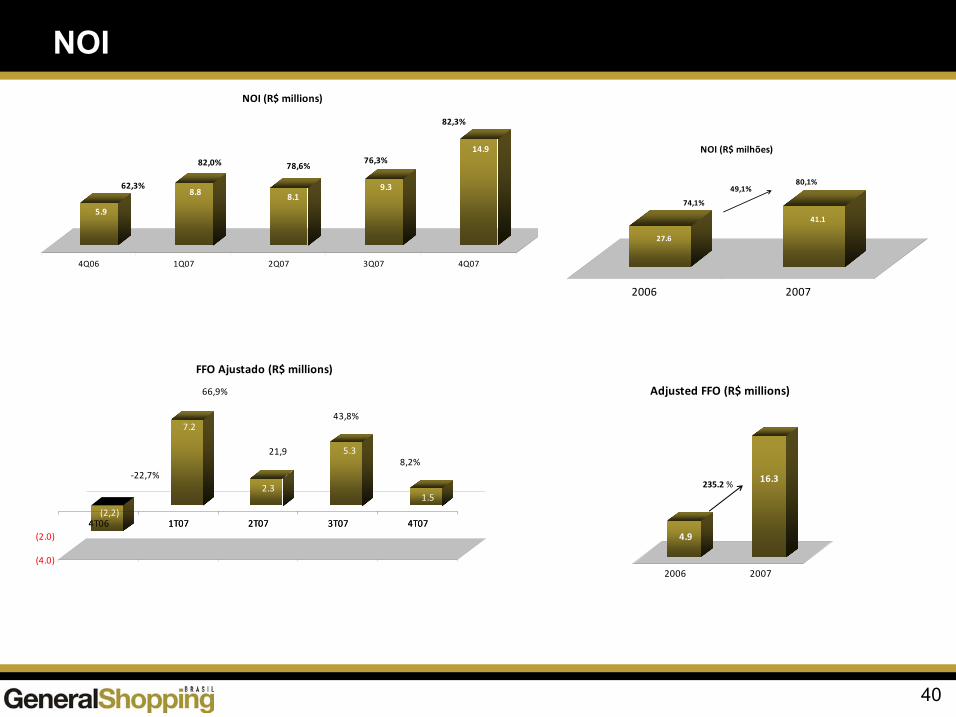
NOI
40
4T06 1T07 2T07 3T07 4T07(2,2)
7.2
2.3
5.3
1.5
(4.0)
(2.0)
0.0
2.0
4.0
6.0
8.0
4T06 1T07 2T07 3T07 4T07
FFO Ajustado (R$ millions)
-22,7%
66,9%
21,9
43,8%
8,2%
5.9
8.8 8.19.3
14.9
0.0
2.0
4.0
6.0
8.0
10.0
12.0
14.0
16.0
4Q06 1Q07 2Q07 3Q07 4Q07
NOI (R$ millions)
62,3%
82,0% 78,6%76,3%
82,3%
4.9
16.3
0.0
2.0
4.0
6.0
8.0
10.0
12.0
14.0
16.0
18.0
2006 2007
Adjusted FFO (R$ millions)
235.2 %
27.6
41.1
0.0
10.0
20.0
30.0
40.0
50.0
2006 2007
NOI (R$ milhões)
74,1%
80,1%49,1%
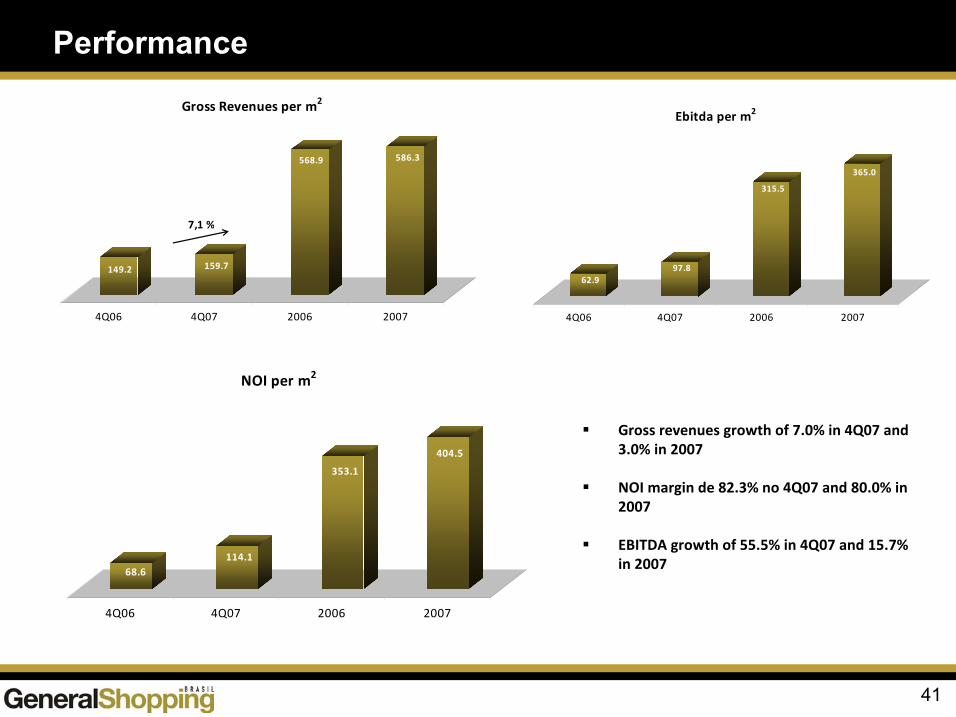
Performance
41
Gross revenues growth of 7.0% in 4Q07 and 3.0% in 2007
NOI margin de 82.3% no 4Q07 and 80.0% in 2007
EBITDA growth of 55.5% in 4Q07 and 15.7% in 2007
149.2 159.7
568.9 586.3
0.0
100.0
200.0
300.0
400.0
500.0
600.0
4Q06 4Q07 2006 2007
Gross Revenues per m2
7,1 %
62.997.8
315.5
365.0
0.0
50.0
100.0
150.0
200.0
250.0
300.0
350.0
400.0
4Q06 4Q07 2006 2007
Ebitda per m2
68.6114.1
353.1
404.5
0.0
50.0
100.0
150.0
200.0
250.0
300.0350.0
400.0
450.0
4Q06 4Q07 2006 2007
NOI per m2
42
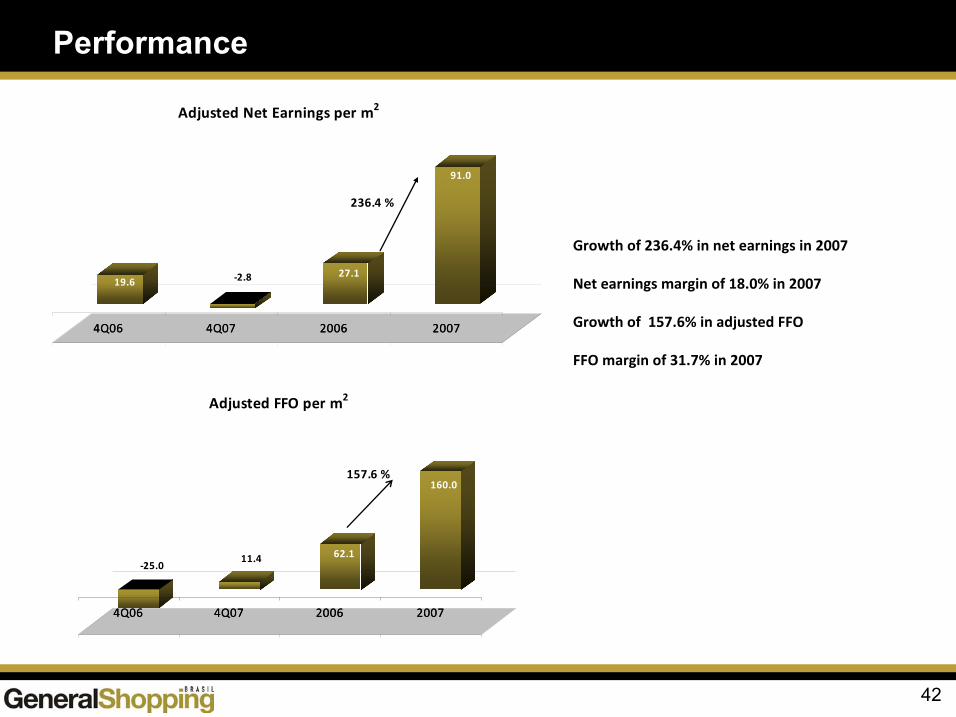
Performance
Growth of 236.4% in net earnings in 2007
Net earnings margin of 18.0% in 2007
Growth of 157.6% in adjusted FFO
FFO margin of 31.7% in 2007
4Q06 4Q07 2006 2007
19.6 -2.8 27.1
91.0
-20.0
0.0
20.0
40.0
60.0
80.0
100.0
4Q06 4Q07 2006 2007
Adjusted Net Earnings per m2
236.4 %
4Q06 4Q07 2006 2007
-25.011.4 62.1
160.0
-50.0
0.0
50.0
100.0
150.0
200.0
4Q06 4Q07 2006 2007
Adjusted FFO per m2
157.6 %
'
Indebtness
43
Total debt R$ 140,3 MM
87% long term
BNDES represents 81.4% of total
Indebtness - dec/31/07
13%
87%
Short term Long term
R$139,8 million
9.77.1
1.8
85.7
3.51.3
18.7
1.5
1.5 8.6
0.0
20.0
40.0
60.0
80.0
100.0
2008 2009 2010 2011 after 2011
Amortization Timeline (R$ million)
BNDES Other debt CCI
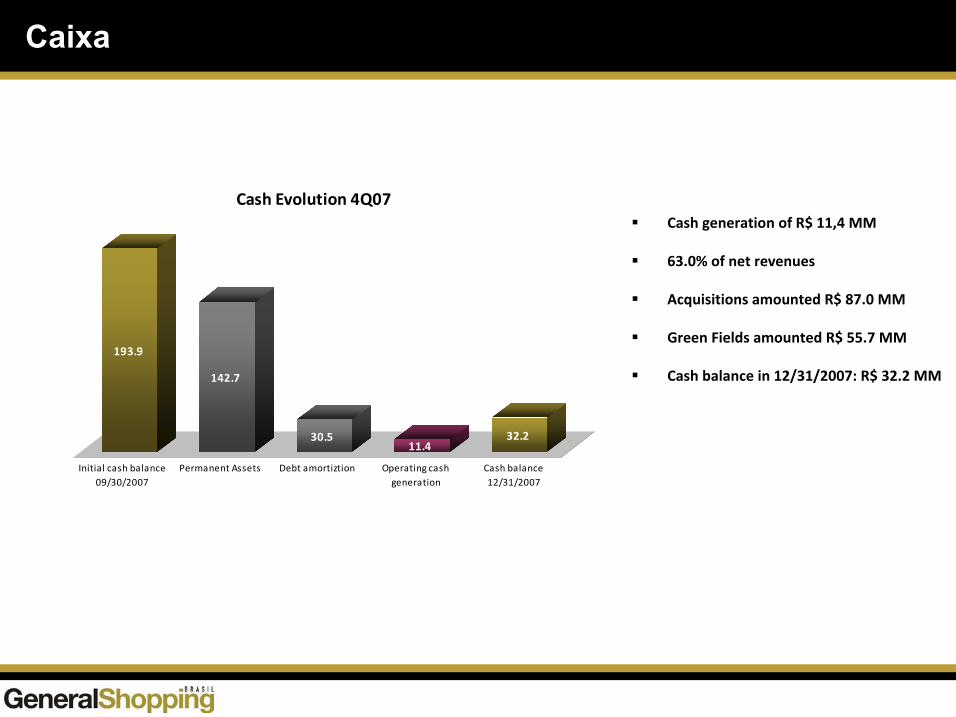
Caixa
Cash generation of R$ 11,4 MM
63.0% of net revenues
Acquisitions amounted R$ 87.0 MM
Green Fields amounted R$ 55.7 MM
Cash balance in 12/31/2007: R$ 32.2 MM
193.9
142.7
30.511.4
32.2
0.0
20.0
40.0
60.0
80.0
100.0
120.0
140.0
160.0
180.0
200.0
Initial cash balance09/30/2007
Permanent Assets Debt amortiztion Operating cashgeneration
Cash balance12/31/2007
Cash Evolution 4Q07
45
Market-driven company with retail approach
B and C consumption classes as target market
Innovative complementary services
Innovative shopping center operations and themes
Key Takeaways
GSB INVESTOR RELATIONS
Alessandro Poli VeroneziInvestor Relations Director
Marcio SniokaInvestor Relations Manager
55 11 3159-5100
www.generalshopping.com.br
Contacts