Embed Size (px)
Citation preview

Jeanette Schwarz Young, CFP®, CMT, M.S.
Jordan Young, CMT
83 Highwood Terrace
Weehawken, New Jersey 07086
www.OptnQueen.com
April 5, 2015
The Option Queen Letter
By the Option Royal
We are back into earnings season again, bet-ya couldn’t wait!!!! Alcoa on Wednesday
yahoooeee! Can’t wait to see to forward guidance the multi-nationals will release given the
strong US Dollar. Oh, and if you get too bored with the markets, we have lots of Fed-speak this
week probably trying to talk down the strength in the US Dollar with more dovish talk. Then
there is crude oil for more excitement. We can add to that negative interest rates abroad and the
USA looks like a sure-fired winner and is enjoying the flow of investment money into the
markets. Think about it, would you rather be charged to parking money at a bank or make a
pittance in interest by parking money at a bank. Given the choice we would opt for being paid.
That said, the currency risk would require hedging.
Bottom line: if you are going to invest, the US market looks to be the destination of choice.
Remember that this market is a mature market and that it is likely that the returns will offer less
but with less risk. The US market is an aging bull market, ripe for a retreat or at the very least a
deeper correction.
The past week’s softer employment report gives the FOMC a break from having to defend their
zero interest rate policy and clearly puts any interest rate hike on the back burner. What is all
this going to do to the real-estate market? Some of the current impetus to close a real-estate deal
was encouraged by the threatened interest rate hike in the near future, say June or September.
Now that an increase in interest rates is further off in the calendar, there is less urgency in
purchasing a property quickly to lock in lower mortgage rates. Thus, the deals probably will
slow down even as the spring buying season blooms. Remember also in real-estate that the
school calendar inspires buyers. The goal for young families with children is to settle down
before the new school year begins in September. Basically buying should peak by June or July
and then perhaps begin to decline. Multi-family units are always in demand but unfortunately
prices are escalating.
Although the US markets were closed for the Good Friday Holiday, the monthly “Jobs Report”
was released. The reaction to the lower than expected number, released at 8:30, caused the
electronically traded markets to plummet to 2038 from the previous close of 2059.50 by
9:14a.m.EST. The weekend allowed the traders time to review the instant statistics seen in the
“Job’s Report” and granted a couple of days for the market to mellow out its response to that
information. At 8:30a.m.EST the market traded up to 2059.75. It took the market 44 minutes to
plunge 21.75 S&P 500 futures handles (points). It is important to note that the S&P 500 did not
test the 2033.25 triple bottom (one of our two chart providers shows a triple horizontal support
line at that level, while the other shows a double horizontal support line). Should the market

break that level, we would expect to see a much deeper reaction to that support line violation.
All of the indicators that we follow herein remain flat and are not really issuing anything of
value. The 5-period exponential moving average is 2053.69. The top of the Bollinger Band is
2105.10 and the lower edge is seen at 2029.12. The downtrend line is 2066.12. The 60 minute
0.1% by 3-box chart is showing us that we are below the downtrend line and have an internal
uptrend line. The daily 1% by 3-box chart remains positive with an upside target of 2371.33.
We continue to believe that money will continue to flow into the market on pull-backs. This
money is not the smart money but rather the money late to the game. Caution is warranted,
continue to use trailing stops.


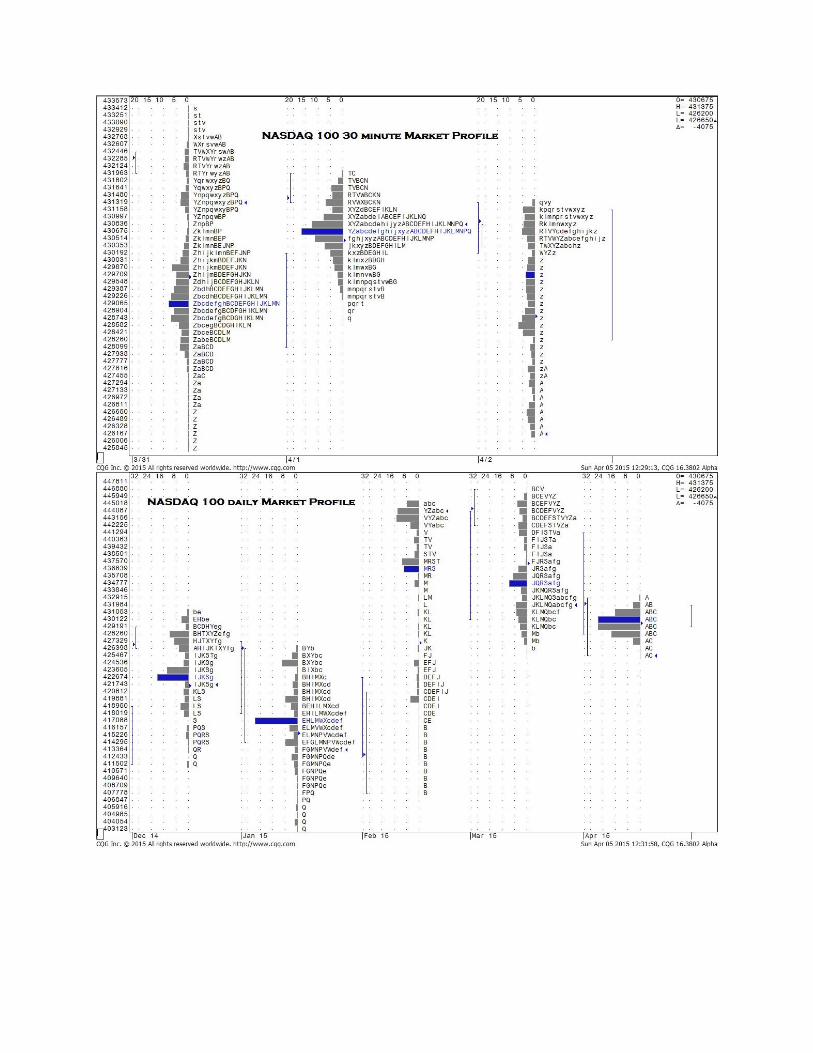
The NASDAQ 100 declined for a fourth day in the Good Friday electronic session. The 5-period
exponential moving average is 4305.24. The top of the Bollinger Band is 4467.55 and the lower

edge is seen at 4288.18. The horizontal support line is 4259. The downtrend line is 4338.15.
All of the indicators that we follow are either negative or flat. The 60 minute 0.1% by 3-box
point and figure chart seems to be consolidating. There is a downtrend line on this chart as well
as an internal uptrend line. We continue to have a downside target of 4254.89. The action in the
Friday session has skewed the chart and makes it difficult to render a clear view of this action.
The daily 1% by 3-box point and figure chart has a downside target of 3978.36.


The Russell 2000 reacted to the “Jobs Report” in the same manner as the other indices reacted.
This index has been a good performer doing better than it other indices that we report on. The

downtrend line is 1256.96 and the uptrend line is 1230.14. We have a horizontal support line at
1220.10 and another support line at 1204.10. The 5-period exponential moving average is
1244.09. The top of the Bollinger Band is 1269.67 and the lower edge is seen at 1212.62. The
stochastic indicator and the RSI are both pointing lower with plenty of room to the downside.
Our own indicator is issuing a mild buy-signal but has been unreliable in the past few sessions as
this index see-saw back and forth. Trade with caution, but remember this is the poster-index for
the risk on crowd, besides; these companies that make up this index are less apt to be exporter
and thus are not impacted by the strong US Dollar.


Crude oil lost 54 cents in the last trading session. The chart looks neither positive nor does it
look especially negative, it does look range bound for the moment. That said, until or unless
crude oil breaks below 43.43 or above 54.47 nothing exciting is going to happen. As to the
indicators, our own indicator has issued a buy-signal, the stochastic indicator is flattish on the

positive side and the RSI is about the same, flattish. The 5-period exponential moving average is
48.95. The top of the Bollinger Band is 52.09 and the lower edge is seen at 42.75. If you would
like a tighter range we offer you 47.05 to 52.48, a violation of either of these numbers will likely
quickly move the trade to the upper resistance area or the lower support area. It is interesting to
note that the volume has been picking up. The most frequently traded price in the last session
was 49.52. The 60 minute 0.25% by e-box point and figure chart is neither especially positive
nor is it negative. It does look as though there is some downside pressure. The daily 1% by 3-
box point and figure chart has a downside target of 38.93. It does look as though this market is
trying to find a bottom and consolidate but the downside target of 38.93 brings that thought into
question.


Gold retreated in the Thursday session losing 6.70 dollars on the day. This market seems to be
range bound with the upside resistance at 1223 and the downside support at 1141.40. The 5-
period exponential moving average is 1196.26. The top of the Bollinger Band is 1213.51 and the
lower edge is seen at 1139.70. It is important for this market to stay above 1178.20. Should the
market close below that level, we will open the door to 1146.50 and then 1141.40. The most
frequently traded price in the Thursday session was 1203.20 which accounted for 13.4% of the
day’s volume. The 60 minute 0.2% by 3-box point and figure chart looks as though it is trying to
consolidate but does have a serious downtrend line on the chart. The daily 1% by 3-box point
and figure chart has both downtrend and uptrend lines in place. This one is going to have to play
out. We would like to believe that this chart is consolidating but should it break below 1135.6
we will have major retreat. Both crude oil and gold should rally as the US Dollar retreats.


The US Dollar index retreated in the Good Friday Holiday session. The weaker than expected
“Jobs Report” caused weakness in this product as the traders understood this signal that the
FOMC would not raise interest rates for longer than they had expected. As we have mentioned
many times in the past, there were just too many US Dollar bulls and too many Euro bears.
When markets become distorted in this manner, something always happens to upset the trade and
we see a reaction. In the case of the US Dollar index, it was an accident waiting to happen. The
5-period exponential moving average is 97.868. The top of the Bollinger Band is 100.105 and
the lower edge is seen at 96.570. It is important for the US Dollar to stay above 96.315. Should
this index close below that level, expect to see a retreat to the 95 area. All the indicators that we
follow herein are pointing lower with plenty of room to the downside. The daily 0.25 by 3-box
point and figure chart looks like a flag is forming. The chart shows two downtrend lines. The 60
minute 0.25% by 3-box point and figure chart has an upside target of 101.42.


Risk Trading Futures, Options on Futures, and retail off-exchange foreign currency transactions
involves substantial risk of loss and is not suitable for all investors. You should carefully
consider whether trading is suitable for you in light of your circumstances, knowledge, and
financial resources. You may lose all or more of your initial investment