Embed Size (px)
Citation preview
2nd QUARTER 2008
InvestorBriefing No. 261 | July 23, 2008
AT&T Inc. reported solid second-quarter results highlighted by strong wireless growth, double-digit gains in revenues from IP-based data services, and further expansion of consolidated margins. Second-quarter highlights include the following:• Totalwirelessrevenuesincreased15.8percentversustheyear-earlierquarter,
drivenbysolidsubscribergainsand52.0percentgrowthinwirelessdataservicessuch as Internet access, e-mail, messaging, data access and media bundles.
• AT&T’ssecond-quarternetgainintotalwirelesssubscribersexceeded 1.3million,withcontinuedstronggrossaddflowshareandareduction inretailpostpaidchurnto1.1percentinthesecondquarter,thelowest levelinthecompany’shistory.
• AT&Tfurtheradvancedthesignificantimprovementinwholesalecustomerrevenue trends it has achieved over the past year. Total wholesale revenues were$3.5billion,downjust0.2percentversustheyear-earlierquarter. Thisrepresentsamajorstepupfromayear-over-yeardeclineof8.3percent inthesecondquarterof2007andmarksthecompany’ssecondconsecutivequarter of sequential revenue growth in this category. This growth reflects solid demand from wireless carriers, Internet service providers, content providers and other customers.
AT&T Delivers Solid Second-Quarter Results Highlighted by Strong Wireless Growth, Double-Digit Increase in IP Data Revenues, Further Ramp in AT&T U-verse TV Subscribers
Results include continued
solid earnings growth,
progress on major
growth initiatives and
substantial value returned
to shareowners through
dividends and
share repurchases.
Second-Quarter EPS Reconciliation 2Q08 2Q07
Reported EPS . . . . . . . . . . . . . . . . . . . . . . . . . . . . . . . . . . . . . . . . . . . . . . . . . . . . . . . . . . . . . . . . . . . . . . . $0.63 $0.47
Adjustmentstoresults:
Merger integration costs . . . . . . . . . . . . . . . . . . . . . . . . . . . . . . . . . . . . . . . . . . . . . . . . . . . . . . . . . . . . 0.03
Noncash merger-related costs . . . . . . . . . . . . . . . . . . . . . . . . . . . . . . . . . . . . . . . . . . . . . . . . . . . . . . . 0.13 0.20
Adjusted EPS . . . . . . . . . . . . . . . . . . . . . . . . . . . . . . . . . . . . . . . . . . . . . . . . . . . . . . . . . . . . . . . . . . . . . . $0.76 $0.70
Pretaxadjustmentstoearnings:in2Q07,mergerintegration,noncashintangibleamortizationandadirectory-relatedpurchaseaccountingeffecttotaling$2,164million;in2Q08,noncashintangibleamortizationtotaling$1,169million.
2InvestorBriefing | 2Q 2008
• Enterprisebusinessrevenuetrends continue to be solid, led by strong double-digit growth in IP-based data servicessuchasvirtualprivatenetworking(VPN) and managed Internet services. Enterprise fundamentals in terms of closed sales, a strong sales funnel and new service adoption remain solid. AT&T expects to deliver positive growth in total enterprise revenues for the fullyear2008.
• AT&TU-verseSMTV,thecompany’snext- generation IP-based video service, continued its strong ramp during the second quarter, with a net subscriber gainof170,000toreach549,000inservice.U-versenetworkdeployment is on schedule, install times continue to decline and the attach rates for broadband service continue to be high. The company isonatrajectorytoreachitstargetofmorethan1millionAT&TU-verseTVsubscribersbyyear-end2008.
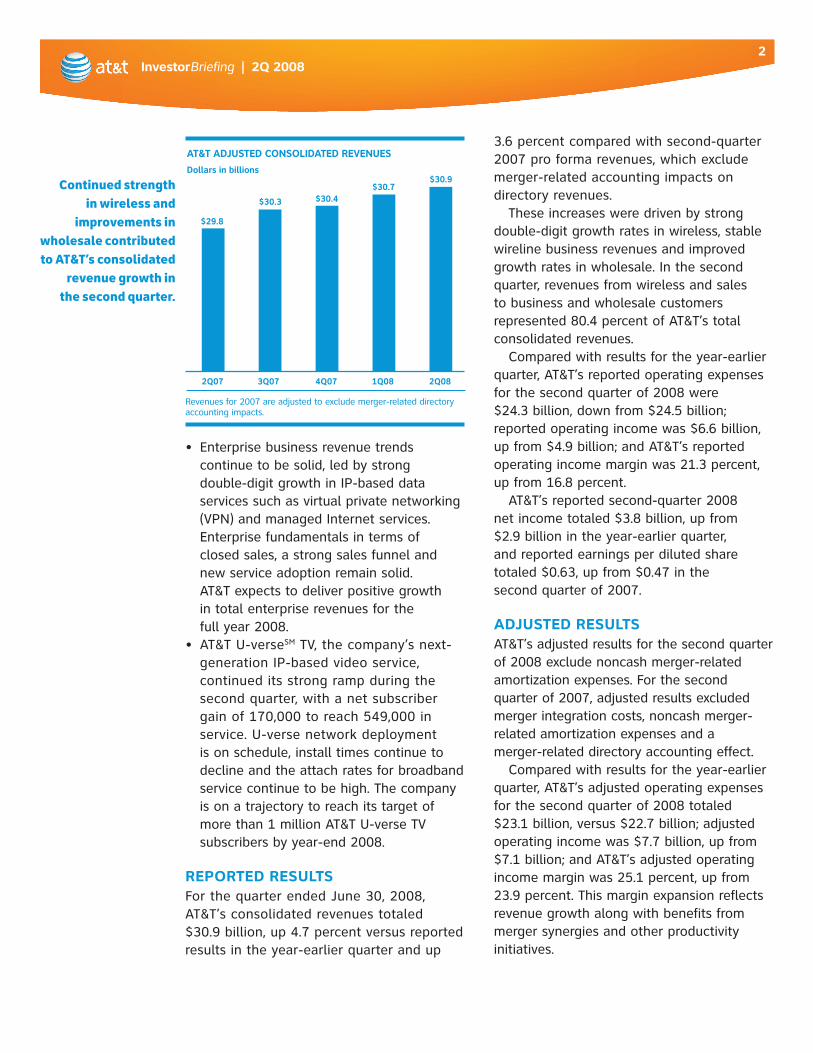
REPORTED RESULTS ForthequarterendedJune30,2008,AT&T’sconsolidatedrevenuestotaled $30.9billion,up4.7percentversusreportedresults in the year-earlier quarter and up
3.6percentcomparedwithsecond-quarter2007proformarevenues,whichexclude merger-related accounting impacts on directory revenues.
These increases were driven by strong double-digit growth rates in wireless, stable wireline business revenues and improved growth rates in wholesale. In the second quarter, revenues from wireless and sales to business and wholesale customers represented80.4percentofAT&T’stotalconsolidated revenues.
Compared with results for the year-earlier quarter,AT&T’sreportedoperatingexpensesforthesecondquarterof2008were $24.3billion,downfrom$24.5billion;reportedoperatingincomewas$6.6billion,upfrom$4.9billion;andAT&T’sreportedoperatingincomemarginwas21.3percent,upfrom16.8percent.
AT&T’sreportedsecond-quarter2008 netincometotaled$3.8billion,upfrom $2.9billionintheyear-earlierquarter, and reported earnings per diluted share totaled$0.63,upfrom$0.47inthe secondquarterof2007.
ADJUSTED RESULTSAT&T’sadjustedresultsforthesecondquarterof2008excludenoncashmerger-relatedamortizationexpenses.Forthesecondquarterof2007,adjustedresultsexcludedmerger integration costs, noncash merger-relatedamortizationexpensesanda merger-related directory accounting effect.
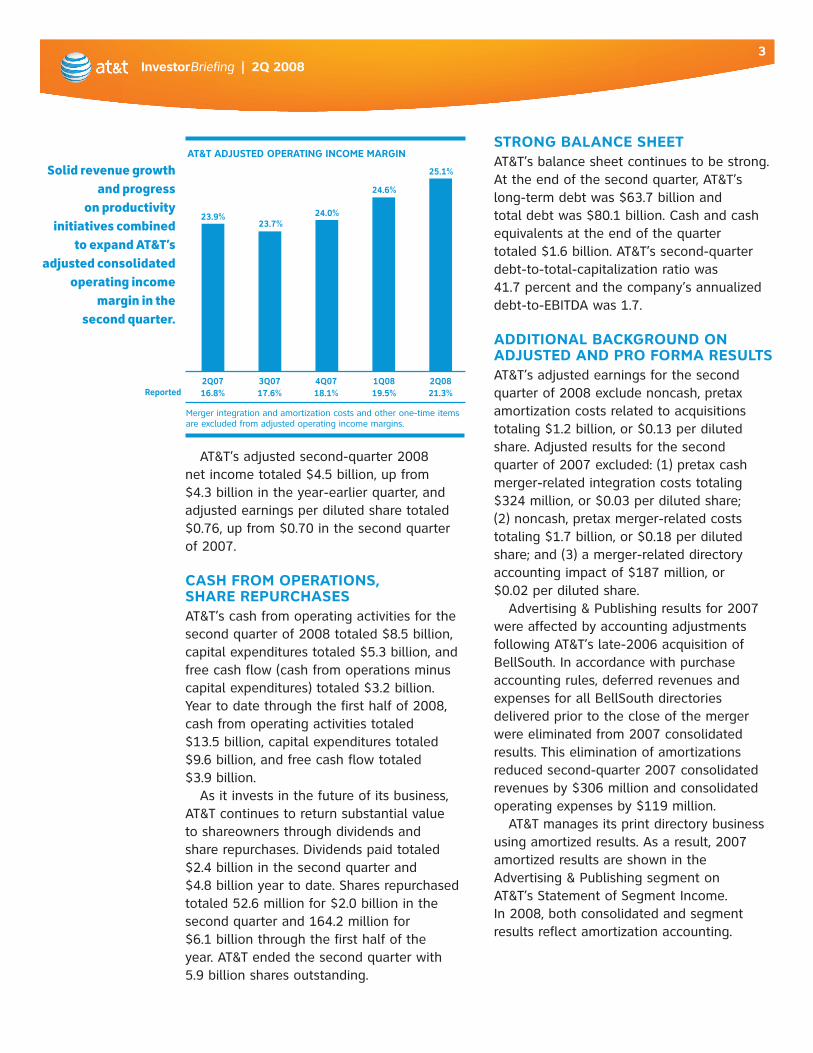
Compared with results for the year-earlier quarter,AT&T’sadjustedoperatingexpensesforthesecondquarterof2008totaled $23.1billion,versus$22.7billion;adjustedoperatingincomewas$7.7billion,upfrom$7.1billion;andAT&T’sadjustedoperatingincomemarginwas25.1percent,upfrom23.9percent.Thismarginexpansionreflectsrevenue growth along with benefits from merger synergies and other productivity initiatives.
USE THESE
1Q08 2Q08
$29.8
$30.3
Revenues for 2007 are adjusted to exclude merger-related directory accounting impacts.
AT&T ADJUSTED CONSOLIDATED REVENUES
Dollars in billions
Page TWO
2Q0716.8%Reported
3Q0717.6%
4Q0718.1%
1Q0819.5%
2Q0821.3%
23.9%23.7%
24.6%
Merger integration and amortization costs and other one-time items are excluded from adjusted operating income margins.
AT&T ADJUSTED OPERATING INCOME MARGIN
24.0%
Page THREE
2Q07 3Q07 4Q07
$30.7$30.9
$30.4 25.1%Continued strength
in wireless and improvements in
wholesale contributed to AT&T’s consolidated
revenue growth in the second quarter.
InvestorBriefing | 2Q 20083
AT&T’sadjustedsecond-quarter2008 netincometotaled$4.5billion,upfrom $4.3billionintheyear-earlierquarter,andadjustedearningsperdilutedsharetotaled$0.76,upfrom$0.70inthesecondquarterof2007.
CASH FROM OPERATIONS, SHARE REPURCHASESAT&T’scashfromoperatingactivitiesforthesecondquarterof2008totaled$8.5billion,capitalexpenditurestotaled$5.3billion,andfree cash flow (cash from operations minus capitalexpenditures)totaled$3.2billion.Yeartodatethroughthefirsthalfof2008,cash from operating activities totaled $13.5billion,capitalexpenditurestotaled$9.6billion,andfreecashflowtotaled $3.9billion.
As it invests in the future of its business, AT&T continues to return substantial value to shareowners through dividends and share repurchases. Dividends paid totaled $2.4billioninthesecondquarterand $4.8billionyeartodate.Sharesrepurchasedtotaled52.6millionfor$2.0billioninthesecondquarterand164.2millionfor $6.1billionthroughthefirsthalfofthe year. AT&T ended the second quarter with 5.9billionsharesoutstanding.
STRONG BALANCE SHEETAT&T’sbalancesheetcontinuestobestrong.Attheendofthesecondquarter,AT&T’slong-termdebtwas$63.7billionand totaldebtwas$80.1billion.Cashandcash equivalents at the end of the quarter totaled$1.6billion.AT&T’ssecond-quarterdebt-to-total-capitalizationratiowas 41.7percentandthecompany’sannualizeddebt-to-EBITDAwas1.7.
ADDITIONAL BACKGROUND ON ADJUSTED AND PRO FORMA RESULTSAT&T’sadjustedearningsforthesecondquarterof2008excludenoncash,pretaxamortizationcostsrelatedtoacquisitionstotaling$1.2billion,or$0.13perdilutedshare.Adjustedresultsforthesecondquarterof2007excluded:(1)pretaxcashmerger-related integration costs totaling $324million,or$0.03perdilutedshare; (2)noncash,pretaxmerger-relatedcoststotaling$1.7billion,or$0.18perdilutedshare;and(3)amerger-relateddirectoryaccountingimpactof$187million,or $0.02perdilutedshare.
Advertising&Publishingresultsfor2007wereaffectedbyaccountingadjustmentsfollowingAT&T’slate-2006acquisitionofBellSouth. In accordance with purchase accounting rules, deferred revenues and expenses for all BellSouth directories delivered prior to the close of the merger wereeliminatedfrom2007consolidatedresults.Thiseliminationofamortizationsreducedsecond-quarter2007consolidatedrevenuesby$306millionandconsolidatedoperatingexpensesby$119million.
AT&T manages its print directory business usingamortizedresults.Asaresult,2007amortizedresultsareshowninthe Advertising & Publishing segment on AT&T’sStatementofSegmentIncome. In2008,bothconsolidatedandsegmentresultsreflectamortizationaccounting.
USE THESE
1Q08 2Q08
$29.8
$30.3
Revenues for 2007 are adjusted to exclude merger-related directory accounting impacts.
AT&T ADJUSTED CONSOLIDATED REVENUES
Dollars in billions
Page TWO
2Q0716.8%Reported
3Q0717.6%
4Q0718.1%
1Q0819.5%
2Q0821.3%
23.9%23.7%
24.6%
Merger integration and amortization costs and other one-time items are excluded from adjusted operating income margins.
AT&T ADJUSTED OPERATING INCOME MARGIN
24.0%
Page THREE
2Q07 3Q07 4Q07
$30.7$30.9
$30.4 25.1%Solid revenue growth and progress
on productivity initiatives combined
to expand AT&T’s adjusted consolidated
operating income margin in the
second quarter.
InvestorBriefing | 2Q 20084
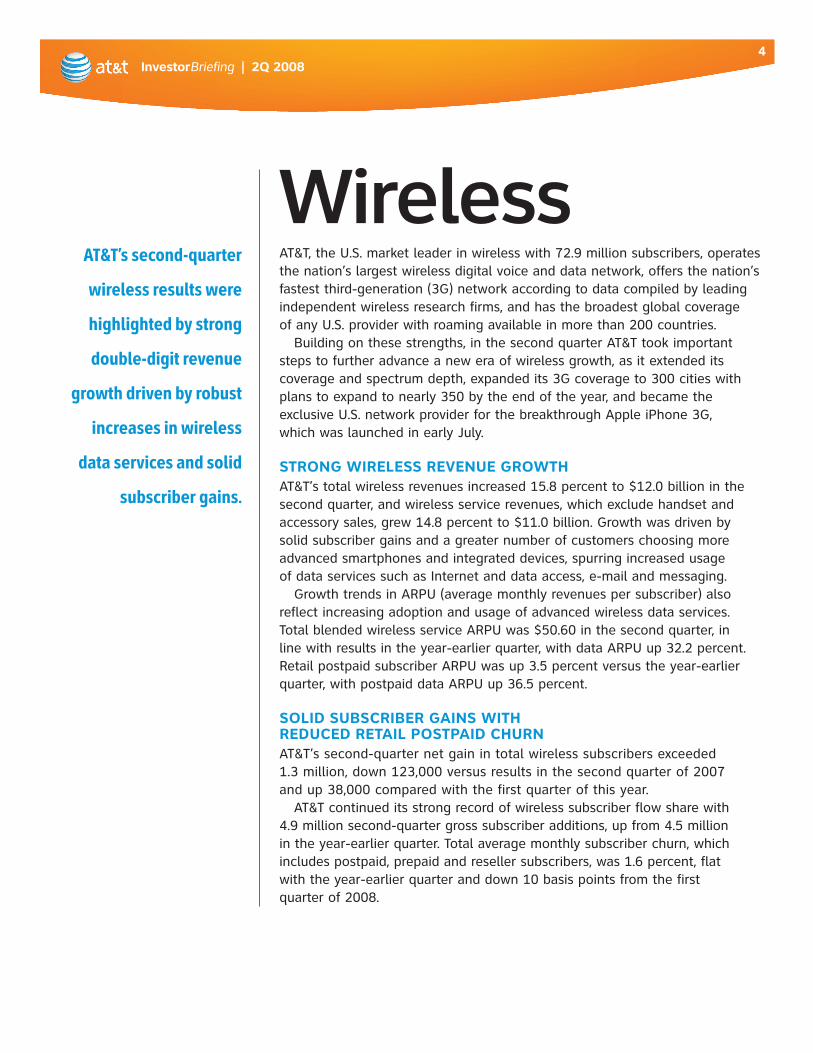
WirelessAT&T,theU.S.marketleaderinwirelesswith72.9millionsubscribers,operatesthenation’slargestwirelessdigitalvoiceanddatanetwork,offersthenation’sfastestthird-generation(3G)networkaccordingtodatacompiledbyleadingindependent wireless research firms, and has the broadest global coverage ofanyU.S.providerwithroamingavailableinmorethan200countries.
Buildingonthesestrengths,inthesecondquarterAT&Ttookimportant steps to further advance a new era of wireless growth, as it extended its coverageandspectrumdepth,expandedits3Gcoverageto300citieswithplanstoexpandtonearly350bytheendoftheyear,andbecamethe exclusiveU.S.networkproviderforthebreakthroughAppleiPhone3G, which was launched in early July.
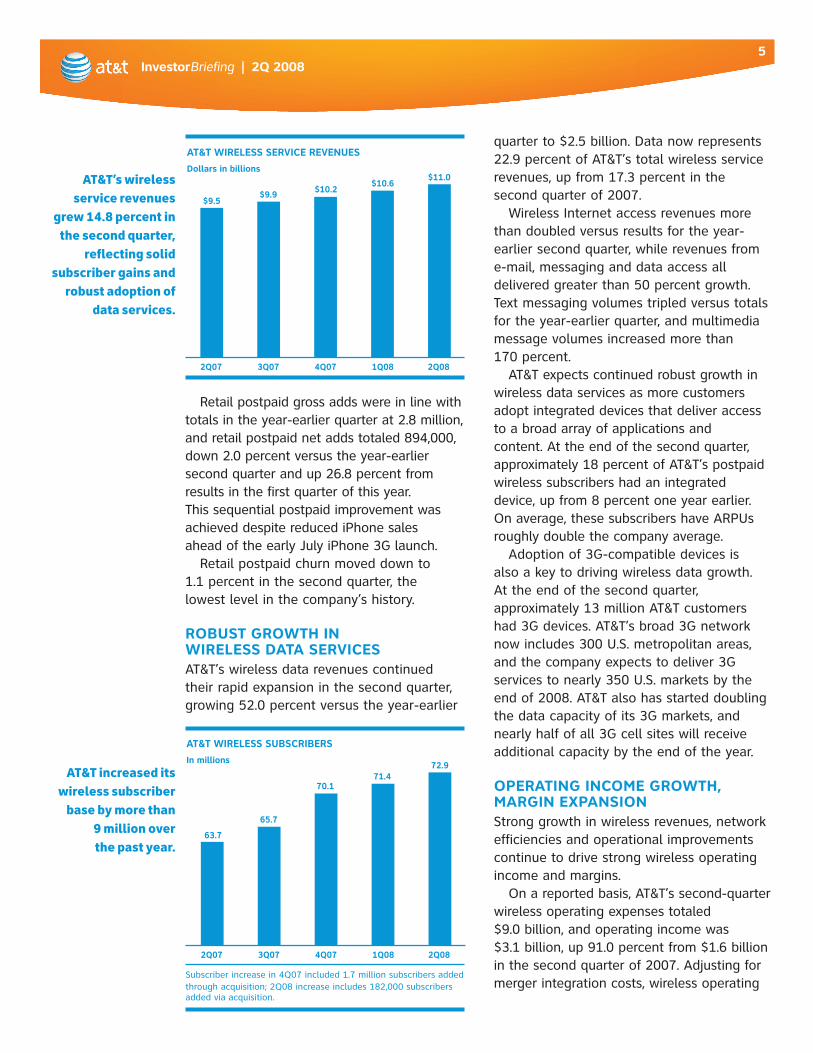
STRONG WIRELESS REVENUE GROWTHAT&T’stotalwirelessrevenuesincreased15.8percentto$12.0billioninthesecond quarter, and wireless service revenues, which exclude handset and accessorysales,grew14.8percentto$11.0billion.Growthwasdrivenby solid subscriber gains and a greater number of customers choosing more advanced smartphones and integrated devices, spurring increased usage of data services such as Internet and data access, e-mail and messaging.
GrowthtrendsinARPU(averagemonthlyrevenuespersubscriber)also reflect increasing adoption and usage of advanced wireless data services. TotalblendedwirelessserviceARPUwas$50.60inthesecondquarter,in linewithresultsintheyear-earlierquarter,withdataARPUup32.2percent.RetailpostpaidsubscriberARPUwasup3.5percentversustheyear-earlierquarter,withpostpaiddataARPUup36.5percent.
SOLID SUBSCRIBER GAINS WITH REDUCED RETAIL POSTPAID CHURNAT&T’ssecond-quarternetgainintotalwirelesssubscribersexceeded 1.3million,down123,000versusresultsinthesecondquarterof2007 andup38,000comparedwiththefirstquarterofthisyear.
AT&T continued its strong record of wireless subscriber flow share with 4.9millionsecond-quartergrosssubscriberadditions,upfrom4.5million in the year-earlier quarter. Total average monthly subscriber churn, which includespostpaid,prepaidandresellersubscribers,was1.6percent,flat withtheyear-earlierquarteranddown10basispointsfromthefirst quarterof2008.
AT&T’s second-quarter
wireless results were
highlighted by strong
double-digit revenue
growth driven by robust
increases in wireless
data services and solid
subscriber gains.
InvestorBriefing | 2Q 20085
Retail postpaid gross adds were in line with totalsintheyear-earlierquarterat2.8million,andretailpostpaidnetaddstotaled894,000,down2.0percentversustheyear-earliersecondquarterandup26.8percentfromresults in the first quarter of this year. This sequential postpaid improvement was achieved despite reduced iPhone sales aheadoftheearlyJulyiPhone3Glaunch.
Retail postpaid churn moved down to 1.1percentinthesecondquarter,the lowestlevelinthecompany’shistory.
ROBUST GROWTH IN WIRELESS DATA SERVICESAT&T’swirelessdatarevenuescontinuedtheir rapid expansion in the second quarter, growing52.0percentversustheyear-earlier
USE THESE
2Q07 3Q07 4Q07 1Q08 2Q08
$1.7$1.8
$2.0
$2.5
AT&T WIRELESS DATA REVENUES
Dollars in billions
$2.3
AT&T WIRELESS SERVICE REVENUES
Dollars in billions
2Q07 3Q07 4Q07 1Q08 2Q08
$9.5$9.9 $10.2
$10.6$11.0
2Q07 3Q07 4Q07 1Q08 2Q08
63.7
65.7
70.171.4
72.9
Wireless - Chart ONE Wireless - Chart TWO
AT&T WIRELESS SUBSCRIBERS
In millions
Wireless - Chart THREEWireless - Chart FOUR
2Q0715.4%
2Q0825.5%
2Q0735.8%
2Q0841.2%
24.9%
29.9%
37.5%
41.2%
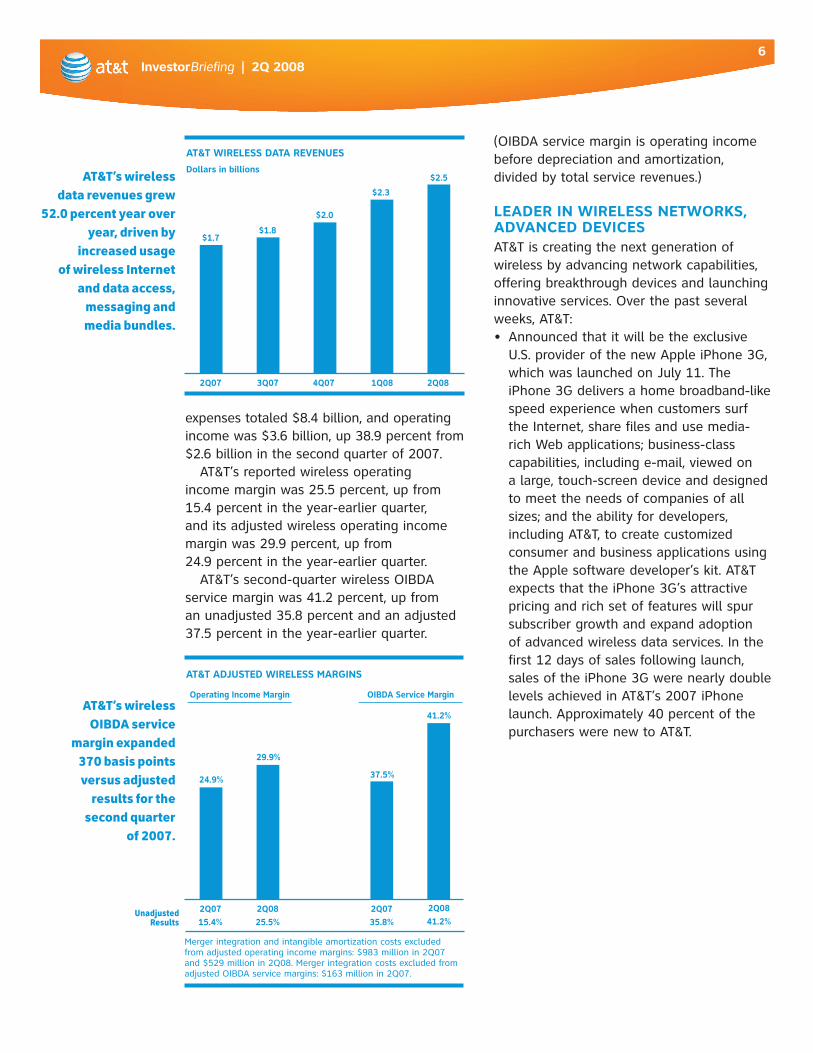
Merger integration and intangible amortization costs excluded from adjusted operating income margins: $983 million in 2Q07 and $529 million in 2Q08. Merger integration costs excluded from adjusted OIBDA service margins: $163 million in 2Q07.
AT&T ADJUSTED WIRELESS MARGINS
UnadjustedResults
Operating Income Margin OIBDA Service Margin
Subscriber increase in 4Q07 included 1.7 million subscribers addedthrough acquisition; 2Q08 increase includes 182,000 subscribers added via acquisition.
USE THESE
2Q07 3Q07 4Q07 1Q08 2Q08
$1.7$1.8
$2.0
$2.5
AT&T WIRELESS DATA REVENUES
Dollars in billions
$2.3
AT&T WIRELESS SERVICE REVENUES
Dollars in billions
2Q07 3Q07 4Q07 1Q08 2Q08
$9.5$9.9 $10.2
$10.6$11.0
2Q07 3Q07 4Q07 1Q08 2Q08
63.7
65.7
70.171.4
72.9
Wireless - Chart ONE Wireless - Chart TWO
AT&T WIRELESS SUBSCRIBERS
In millions
Wireless - Chart THREEWireless - Chart FOUR
2Q0715.4%
2Q0825.5%
2Q0735.8%
2Q0841.2%
24.9%
29.9%
37.5%
41.2%
Merger integration and intangible amortization costs excluded from adjusted operating income margins: $983 million in 2Q07 and $529 million in 2Q08. Merger integration costs excluded from adjusted OIBDA service margins: $163 million in 2Q07.
AT&T ADJUSTED WIRELESS MARGINS
UnadjustedResults
Operating Income Margin OIBDA Service Margin
Subscriber increase in 4Q07 included 1.7 million subscribers addedthrough acquisition; 2Q08 increase includes 182,000 subscribers added via acquisition.
AT&T’s wireless service revenues
grew 14.8 percent in the second quarter,
reflecting solid subscriber gains and
robust adoption of data services.
AT&T increased itswireless subscriber
base by more than9 million overthe past year.
quarterto$2.5billion.Datanowrepresents22.9percentofAT&T’stotalwirelessservicerevenues,upfrom17.3percentinthe secondquarterof2007.
Wireless Internet access revenues more than doubled versus results for the year-earlier second quarter, while revenues from e-mail, messaging and data access all deliveredgreaterthan50percentgrowth.Text messaging volumes tripled versus totals for the year-earlier quarter, and multimedia message volumes increased more than 170percent.
AT&T expects continued robust growth in wireless data services as more customers adopt integrated devices that deliver access to a broad array of applications and content. At the end of the second quarter, approximately18percentofAT&T’spostpaidwireless subscribers had an integrated device,upfrom8percentoneyearearlier.Onaverage,thesesubscribershaveARPUsroughly double the company average.
Adoptionof3G-compatibledevicesis alsoakeytodrivingwirelessdatagrowth. At the end of the second quarter, approximately13millionAT&Tcustomershad3Gdevices.AT&T’sbroad3Gnetworknowincludes300U.S.metropolitanareas,andthecompanyexpectstodeliver3Gservicestonearly350U.S.marketsbytheendof2008.AT&Talsohasstarteddoublingthedatacapacityofits3Gmarkets,andnearlyhalfofall3Gcellsiteswillreceive additional capacity by the end of the year.
OPERATING INCOME GROWTH, MARGIN EXPANSIONStronggrowthinwirelessrevenues,networkefficiencies and operational improvements continue to drive strong wireless operating income and margins.
Onareportedbasis,AT&T’ssecond-quarterwireless operating expenses totaled $9.0billion,andoperatingincomewas $3.1billion,up91.0percentfrom$1.6billioninthesecondquarterof2007.Adjustingformerger integration costs, wireless operating
InvestorBriefing | 2Q 20086
USE THESE
2Q07 3Q07 4Q07 1Q08 2Q08
$1.7$1.8
$2.0
$2.5
AT&T WIRELESS DATA REVENUES
Dollars in billions
$2.3
AT&T WIRELESS SERVICE REVENUES
Dollars in billions
2Q07 3Q07 4Q07 1Q08 2Q08
$9.5$9.9 $10.2
$10.6$11.0
2Q07 3Q07 4Q07 1Q08 2Q08
63.7
65.7
70.171.4
72.9
Wireless - Chart ONE Wireless - Chart TWO
AT&T WIRELESS SUBSCRIBERS
In millions
Wireless - Chart THREEWireless - Chart FOUR
2Q0715.4%
2Q0825.5%
2Q0735.8%
2Q0841.2%
24.9%
29.9%
37.5%
41.2%
Merger integration and intangible amortization costs excluded from adjusted operating income margins: $983 million in 2Q07 and $529 million in 2Q08. Merger integration costs excluded from adjusted OIBDA service margins: $163 million in 2Q07.
AT&T ADJUSTED WIRELESS MARGINS
UnadjustedResults
Operating Income Margin OIBDA Service Margin
Subscriber increase in 4Q07 included 1.7 million subscribers addedthrough acquisition; 2Q08 increase includes 182,000 subscribers added via acquisition.
AT&T’s wireless data revenues grew
52.0 percent year over year, driven by
increased usage of wireless Internet
and data access, messaging and media bundles.
AT&T’s wireless OIBDA service
margin expanded 370 basis points versus adjusted
results for the second quarter
of 2007.
(OIBDA service margin is operating income beforedepreciationandamortization, divided by total service revenues.)
LEADER IN WIRELESS NETWORKS, ADVANCED DEVICESAT&T is creating the next generation of wirelessbyadvancingnetworkcapabilities,offeringbreakthroughdevicesandlaunchinginnovative services. Over the past several weeks,AT&T:• Announcedthatitwillbetheexclusive
U.S.providerofthenewAppleiPhone3G,whichwaslaunchedonJuly11.TheiPhone3Gdeliversahomebroadband-likespeed experience when customers surf the Internet, share files and use media- richWebapplications;business-classcapabilities, including e-mail, viewed on a large, touch-screen device and designed to meet the needs of companies of all sizes;andtheabilityfordevelopers,includingAT&T,tocreatecustomizedconsumer and business applications using theApplesoftwaredeveloper’skit.AT&TexpectsthattheiPhone3G’sattractivepricing and rich set of features will spur subscriber growth and expand adoption of advanced wireless data services. In the first12daysofsalesfollowinglaunch,salesoftheiPhone3GwerenearlydoublelevelsachievedinAT&T’s2007iPhonelaunch.Approximately40percentofthepurchasers were new to AT&T.
expensestotaled$8.4billion,andoperatingincomewas$3.6billion,up38.9percentfrom $2.6billioninthesecondquarterof2007.
AT&T’sreportedwirelessoperating incomemarginwas25.5percent,upfrom15.4percentintheyear-earlierquarter, anditsadjustedwirelessoperatingincomemarginwas29.9percent,upfrom 24.9percentintheyear-earlierquarter.
AT&T’ssecond-quarterwirelessOIBDAservicemarginwas41.2percent,upfrom anunadjusted35.8percentandanadjusted37.5percentintheyear-earlierquarter.
InvestorBriefing | 2Q 20087
• CompletedthedeploymentofHighSpeedUplinkPacketAccess(HSUPA)technologyacrossAT&T’sentire3Gwirelessbroadbandnetwork,makingAT&TtheonlyU.S.carriertohavefullydeployedHSPAtechnology inits3Gnetwork.WiththenewadditionofHSUPAtechnology,AT&T3Gusers cansendlargefilesfasterandtakefull advantage of the latest interactive Internet and business applications.
• LaunchedfreeWi-FiaccessforqualifyingLaptopConnectcustomerstomorethan17,000Wi-Fihotspotsacrossthe UnitedStates.UserscanaccessWi-Fi atnearly7,000participatingStarbuckslocations plus thousands more AT&T Wi-FiSM locations, including restaurants, airports, hotels and other convenient locationsacrosstheUnitedStates.
• JoinedwithMediaFLOUSAInc.to introduceAT&TMobileTVwithFLO, a mobile television service featuring high-quality live programming. The mobileTVservicelaunchedinMay2008ontwonewexclusivehandsets,theLGVuTM and the Samsung AccessTM. AT&T Mobile TV delivers full-length television content and sporting events from top networks,includingprogrammingfromleading entertainment brands CBS Mobile, Comedy Central, ESPN Mobile TV,FOXMobile,MTV,NBC2GO,NBC News2GoandNickelodeon.
InvestorBriefing | 2Q 20088
WirelineSecond-quarter results in
AT&T’s wired operations
were highlighted by
double-digit growth in
IP data revenues, a
continued turnaround in
wholesale, and a further
ramp in AT&T U-verse
TV subscribers.
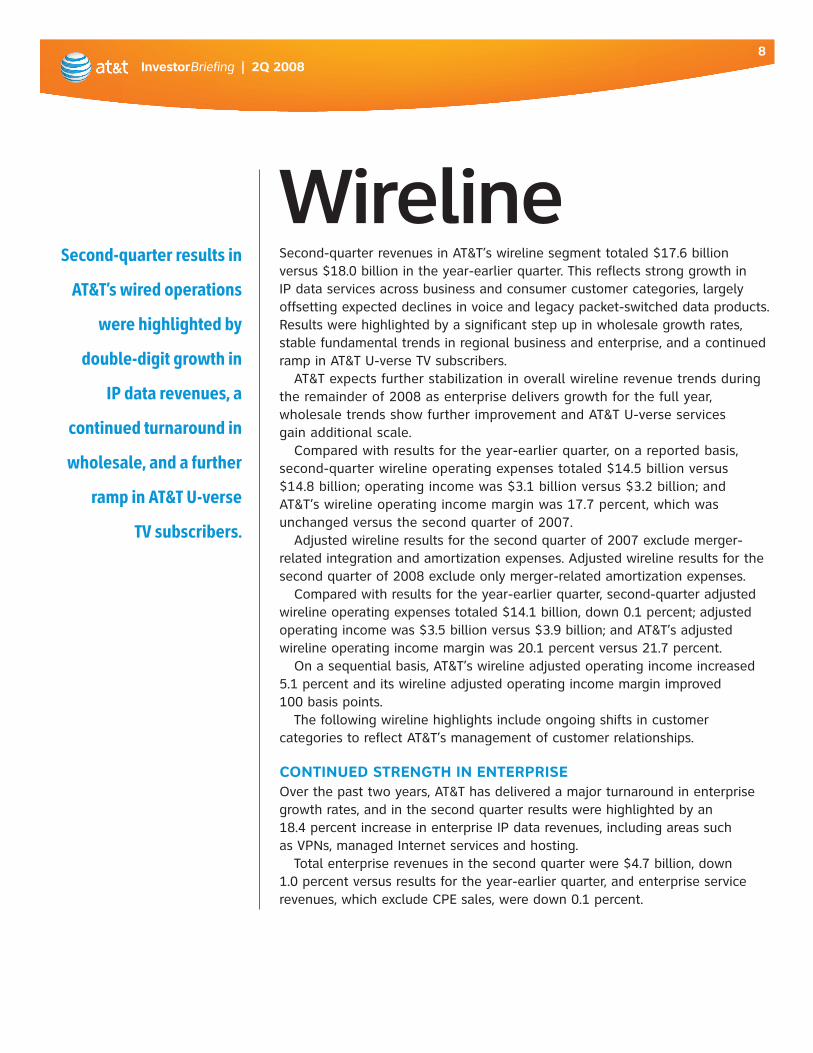
Second-quarterrevenuesinAT&T’swirelinesegmenttotaled$17.6billion versus$18.0billionintheyear-earlierquarter.Thisreflectsstronggrowthin IP data services across business and consumer customer categories, largely offsettingexpecteddeclinesinvoiceandlegacypacket-switcheddataproducts.Results were highlighted by a significant step up in wholesale growth rates, stable fundamental trends in regional business and enterprise, and a continued rampinAT&TU-verseTVsubscribers.
AT&Texpectsfurtherstabilizationinoverallwirelinerevenuetrendsduringtheremainderof2008asenterprisedeliversgrowthforthefullyear, wholesaletrendsshowfurtherimprovementandAT&TU-verseservices gain additional scale.
Compared with results for the year-earlier quarter, on a reported basis, second-quarterwirelineoperatingexpensestotaled$14.5billionversus $14.8billion;operatingincomewas$3.1billionversus$3.2billion;and AT&T’swirelineoperatingincomemarginwas17.7percent,whichwas unchangedversusthesecondquarterof2007.
Adjustedwirelineresultsforthesecondquarterof2007excludemerger-relatedintegrationandamortizationexpenses.Adjustedwirelineresultsforthesecondquarterof2008excludeonlymerger-relatedamortizationexpenses.
Comparedwithresultsfortheyear-earlierquarter,second-quarteradjustedwirelineoperatingexpensestotaled$14.1billion,down0.1percent;adjustedoperatingincomewas$3.5billionversus$3.9billion;andAT&T’sadjustedwirelineoperatingincomemarginwas20.1percentversus21.7percent.
Onasequentialbasis,AT&T’swirelineadjustedoperatingincomeincreased5.1percentanditswirelineadjustedoperatingincomemarginimproved 100basispoints.
The following wireline highlights include ongoing shifts in customer categoriestoreflectAT&T’smanagementofcustomerrelationships.
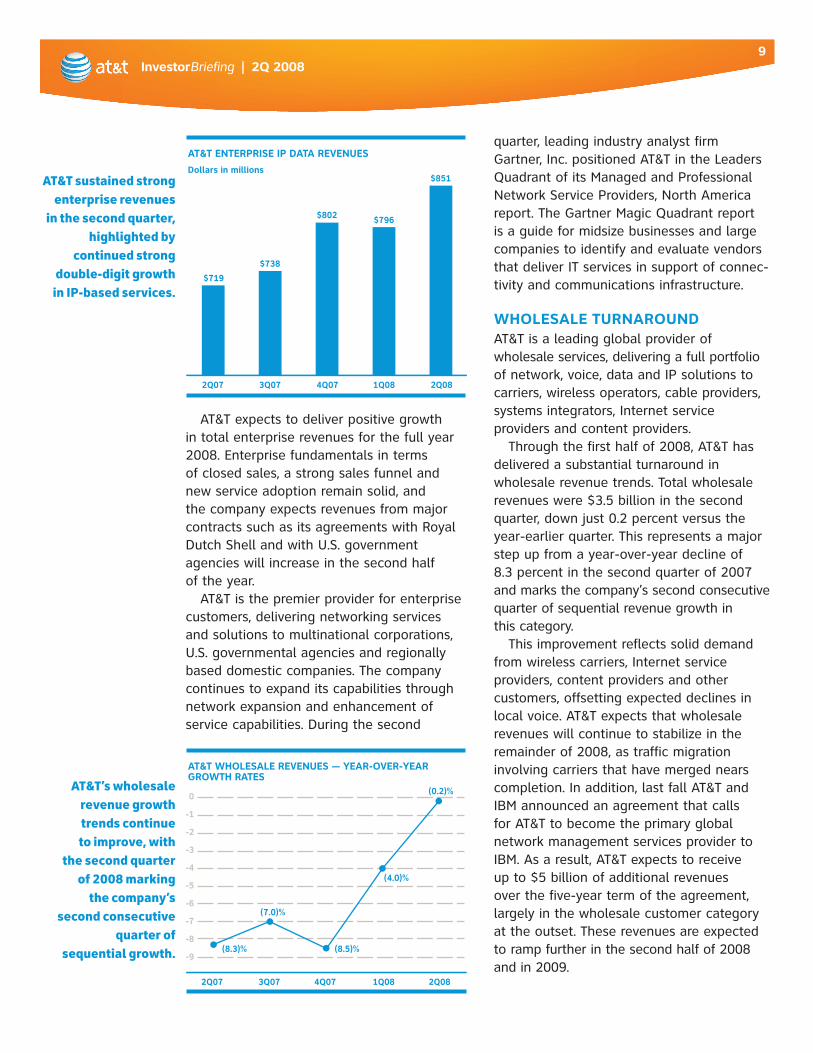
CONTINUED STRENGTH IN ENTERPRISE Overthepasttwoyears,AT&Thasdeliveredamajorturnaroundinenterprisegrowth rates, and in the second quarter results were highlighted by an 18.4percentincreaseinenterpriseIPdatarevenues,includingareassuch as VPNs, managed Internet services and hosting.
Totalenterpriserevenuesinthesecondquarterwere$4.7billion,down 1.0percentversusresultsfortheyear-earlierquarter,andenterpriseservicerevenues,whichexcludeCPEsales,weredown0.1percent.
InvestorBriefing | 2Q 20089
AT&T expects to deliver positive growth in total enterprise revenues for the full year 2008.Enterprisefundamentalsinterms of closed sales, a strong sales funnel and new service adoption remain solid, and thecompanyexpectsrevenuesfrommajorcontracts such as its agreements with Royal DutchShellandwithU.S.governmentagencies will increase in the second half of the year.
AT&T is the premier provider for enterprise customers,deliveringnetworkingservicesand solutions to multinational corporations, U.S.governmentalagenciesandregionallybased domestic companies. The company continues to expand its capabilities through networkexpansionandenhancementofservice capabilities. During the second
quarter, leading industry analyst firm Gartner,Inc.positionedAT&TintheLeadersQuadrantofitsManagedandProfessionalNetworkServiceProviders,NorthAmericareport.TheGartnerMagicQuadrantreport isaguideformidsizebusinessesandlargecompanies to identify and evaluate vendors that deliver IT services in support of connec-tivity and communications infrastructure.
WHOLESALE TURNAROUNDAT&T is a leading global provider of wholesale services, delivering a full portfolio ofnetwork,voice,dataandIPsolutionstocarriers, wireless operators, cable providers, systems integrators, Internet service providers and content providers.
Throughthefirsthalfof2008,AT&Thasdelivered a substantial turnaround in wholesale revenue trends. Total wholesale revenueswere$3.5billioninthesecondquarter,downjust0.2percentversustheyear-earlierquarter.Thisrepresentsamajorstep up from a year-over-year decline of 8.3percentinthesecondquarterof2007andmarksthecompany’ssecondconsecutivequarter of sequential revenue growth in this category.
This improvement reflects solid demand from wireless carriers, Internet service providers, content providers and other customers, offsetting expected declines in local voice. AT&T expects that wholesale revenueswillcontinuetostabilizeintheremainderof2008,astrafficmigrationinvolving carriers that have merged nears completion. In addition, last fall AT&T and IBM announced an agreement that calls for AT&T to become the primary global networkmanagementservicesprovidertoIBM. As a result, AT&T expects to receive upto$5billionofadditionalrevenues over the five-year term of the agreement, largely in the wholesale customer category at the outset. These revenues are expected torampfurtherinthesecondhalfof2008andin2009.
USE THESE
2Q07 3Q07 4Q07 1Q08 2Q08
$719
$738
$802
Wireline
AT&T ENTERPRISE IP DATA REVENUES
Dollars in millions
Wireline
2Q07 3Q07 4Q07 1Q08 2Q08
51
126
379
549
AT&T U-VERSE TV CONNECTIONS IN SERVICE
In thousands
231
$796
2Q07 3Q07 4Q07 1Q08 2Q08
$58.91$59.43 $59.73
$61.40
AT&T AVERAGE MONTHLY CONSUMER REVENUES PER HOUSEHOLD SERVED
$60.57
Wireline
2007 comparisons are to 2006 pro forma results, which combine results from the former BellSouth and AT&T and exclude revenues from acquired operations.
AT&T WHOLESALE REVENUES — YEAR-OVER-YEAR GROWTH RATES
2Q07(3.0)%
3Q07(0.7)%
4Q070.4%
1Q081.5%
2Q082.1%
(8.3)%
(4.0)%
0
-1
-2
-3
-4
-5
-6
-7
-8
-9
Wireline
$851
Enterprise servicerevenue growth
2007 comparisons are to 2006 pro forma results, which combine results from the former BellSouth and AT&T and exclude revenues from acquired operations.
AT&T TOTAL ENTERPRISE REVENUE GROWTH RATES
1Q07(3.0)%
2Q07(0.7)%
3Q070.4%
4Q071.5%
1Q082.1%
(3.9)%
(1.7)%
(0.2)%
(2.0)%
2
1
0
-1
-2
-3
-4
Wireline
1.2%
Enterprise servicerevenue growth
Unchanged from 1Q Earnings
(7.0)%
(8.5)%
(0.2)%
AT&T sustained strong enterprise revenues
in the second quarter, highlighted by
continued strong double-digit growth
in IP-based services.
AT&T’s wholesale revenue growth trends continue to improve, with
the second quarter of 2008 marking
the company’s second consecutive
quarter of sequential growth.
InvestorBriefing | 2Q 200810
USE THESE
2Q07 3Q07 4Q07 1Q08 2Q08
$719
$738
$802
Wireline
AT&T ENTERPRISE IP DATA REVENUES
Dollars in millions
Wireline
2Q07 3Q07 4Q07 1Q08 2Q08
51
126
379
549
AT&T U-VERSE TV CONNECTIONS IN SERVICE
In thousands
231
$796
2Q07 3Q07 4Q07 1Q08 2Q08
$58.91$59.43 $59.73
$61.40
AT&T AVERAGE MONTHLY CONSUMER REVENUES PER HOUSEHOLD SERVED
$60.57
Wireline
2007 comparisons are to 2006 pro forma results, which combine results from the former BellSouth and AT&T and exclude revenues from acquired operations.
AT&T WHOLESALE REVENUES — YEAR-OVER-YEAR GROWTH RATES
2Q07(3.0)%
3Q07(0.7)%
4Q070.4%
1Q081.5%
2Q082.1%
(8.3)%
(4.0)%
0
-1
-2
-3
-4
-5
-6
-7
-8
-9
Wireline
$851
Enterprise servicerevenue growth
2007 comparisons are to 2006 pro forma results, which combine results from the former BellSouth and AT&T and exclude revenues from acquired operations.
AT&T TOTAL ENTERPRISE REVENUE GROWTH RATES
1Q07(3.0)%
2Q07(0.7)%
3Q070.4%
4Q071.5%
1Q082.1%
(3.9)%
(1.7)%
(0.2)%
(2.0)%
2
1
0
-1
-2
-3
-4
Wireline
1.2%
Enterprise servicerevenue growth
Unchanged from 1Q Earnings
(7.0)%
(8.5)%
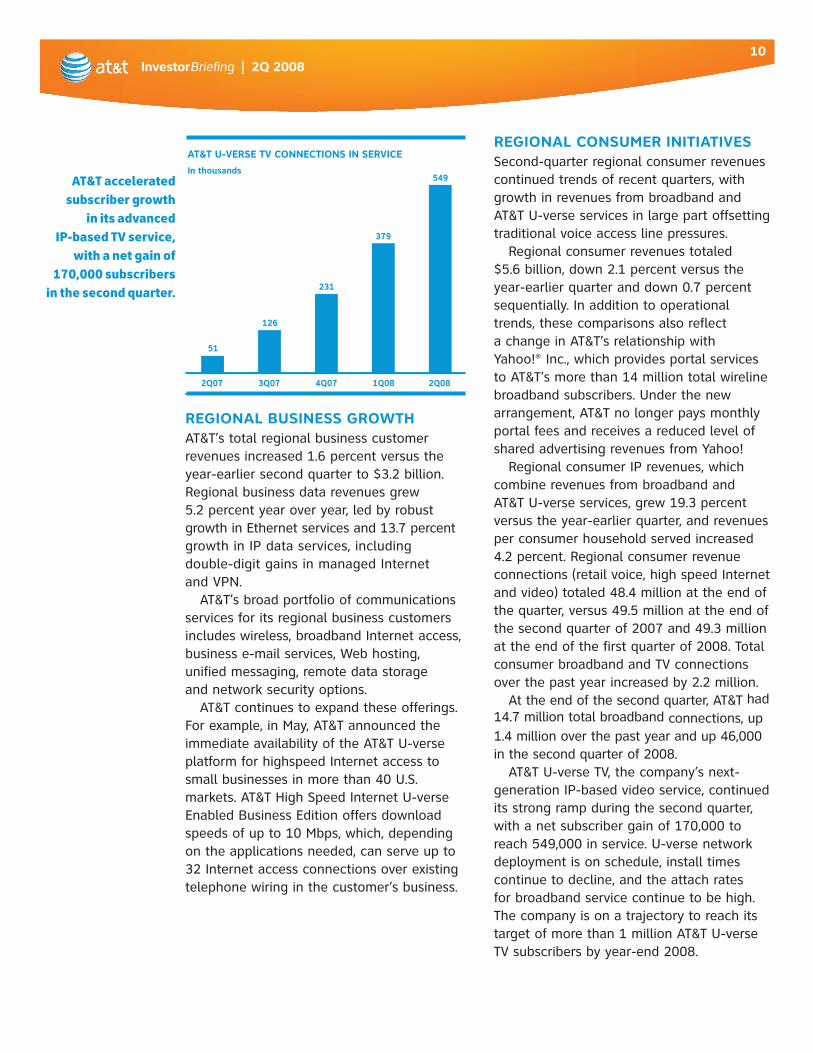
(0.2)% AT&T accelerated subscriber growth
in its advanced IP-based TV service,
with a net gain of 170,000 subscribers
in the second quarter.
REGIONAL CONSUMER INITIATIVESSecond-quarter regional consumer revenues continued trends of recent quarters, with growth in revenues from broadband and AT&TU-verseservicesinlargepartoffsettingtraditional voice access line pressures.
Regional consumer revenues totaled $5.6billion,down2.1percentversustheyear-earlierquarteranddown0.7percentsequentially. In addition to operational trends, these comparisons also reflect achangeinAT&T’srelationshipwith Yahoo!® Inc., which provides portal services toAT&T’smorethan14milliontotalwirelinebroadbandsubscribers.Underthenewarrangement, AT&T no longer pays monthly portal fees and receives a reduced level of shared advertising revenues from Yahoo!
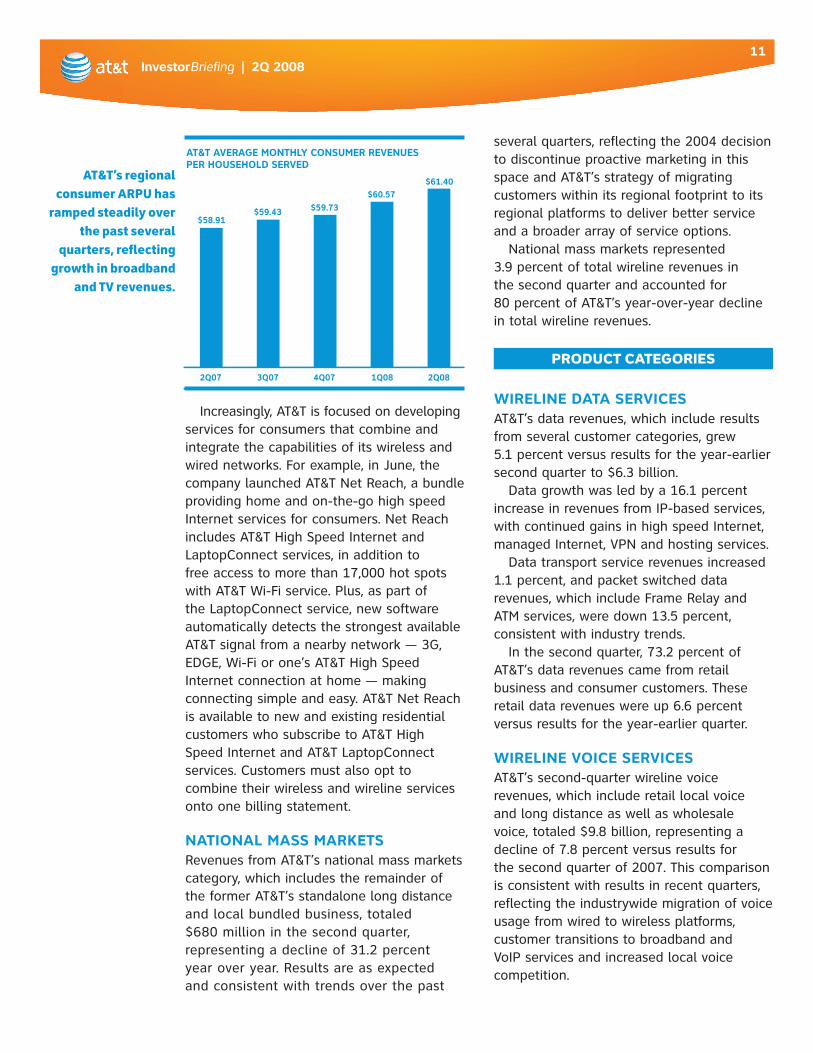
Regional consumer IP revenues, which combine revenues from broadband and AT&TU-verseservices,grew19.3percentversus the year-earlier quarter, and revenues per consumer household served increased 4.2percent.Regionalconsumerrevenueconnections (retail voice, high speed Internet andvideo)totaled48.4millionattheendofthequarter,versus49.5millionattheendofthesecondquarterof2007and49.3millionattheendofthefirstquarterof2008.Totalconsumer broadband and TV connections overthepastyearincreasedby2.2million.
At the end of the second quarter, AT&T had 14.7milliontotalbroadbandconnections, up 1.4millionoverthepastyearandup46,000inthesecondquarterof2008.
AT&TU-verseTV,thecompany’snext- generation IP-based video service, continued its strong ramp during the second quarter, withanetsubscribergainof170,000toreach549,000inservice.U-versenetworkdeployment is on schedule, install times continue to decline, and the attach rates for broadband service continue to be high. Thecompanyisonatrajectorytoreachitstargetofmorethan1millionAT&TU-verseTVsubscribersbyyear-end2008.
REGIONAL BUSINESS GROWTHAT&T’stotalregionalbusinesscustomerrevenuesincreased1.6percentversustheyear-earliersecondquarterto$3.2billion.Regional business data revenues grew 5.2percentyearoveryear,ledbyrobustgrowthinEthernetservicesand13.7percentgrowth in IP data services, including double-digit gains in managed Internet and VPN.
AT&T’sbroadportfolioofcommunicationsservices for its regional business customers includes wireless, broadband Internet access, business e-mail services, Web hosting, unified messaging, remote data storage andnetworksecurityoptions.
AT&T continues to expand these offerings. For example, in May, AT&T announced the immediateavailabilityoftheAT&TU-verseplatform for highspeed Internet access to smallbusinessesinmorethan40U.S.markets.AT&THighSpeedInternetU-verseEnabled Business Edition offers download speedsofupto10Mbps,which,dependingon the applications needed, can serve up to 32Internetaccessconnectionsoverexistingtelephonewiringinthecustomer’sbusiness.
InvestorBriefing | 2Q 200811
Increasingly, AT&T is focused on developing services for consumers that combine and integrate the capabilities of its wireless and wirednetworks.Forexample,inJune,thecompany launched AT&T Net Reach, a bundle providing home and on-the-go high speed Internet services for consumers. Net Reach includesAT&THighSpeedInternetandLaptopConnectservices,inadditionto freeaccesstomorethan17,000hotspotswith AT&T Wi-Fi service. Plus, as part of theLaptopConnectservice,newsoftware automatically detects the strongest available AT&Tsignalfromanearbynetwork—3G,EDGE,Wi-Fiorone’sAT&THighSpeedInternetconnectionathome—makingconnecting simple and easy. AT&T Net Reach is available to new and existing residential customerswhosubscribetoAT&THighSpeedInternetandAT&TLaptopConnectservices. Customers must also opt to combine their wireless and wireline services onto one billing statement.
NATIONAL MASS MARKETSRevenuesfromAT&T’snationalmassmarketscategory, which includes the remainder of theformerAT&T’sstandalonelongdistanceand local bundled business, totaled $680millioninthesecondquarter, representingadeclineof31.2percent year over year. Results are as expected and consistent with trends over the past
severalquarters,reflectingthe2004decisiontodiscontinueproactivemarketinginthisspaceandAT&T’sstrategyofmigratingcustomers within its regional footprint to its regional platforms to deliver better service and a broader array of service options.
Nationalmassmarketsrepresented 3.9percentoftotalwirelinerevenuesin the second quarter and accounted for 80percentofAT&T’syear-over-yeardeclinein total wireline revenues.
PRODUCT CATEGORIES
WIRELINE DATA SERVICESAT&T’sdatarevenues,whichincluderesultsfrom several customer categories, grew 5.1percentversusresultsfortheyear-earliersecondquarterto$6.3billion.
Datagrowthwasledbya16.1percentincrease in revenues from IP-based services, with continued gains in high speed Internet, managed Internet, VPN and hosting services.
Data transport service revenues increased 1.1percent,andpacketswitcheddatarevenues, which include Frame Relay and ATMservices,weredown13.5percent,consistent with industry trends.
Inthesecondquarter,73.2percentofAT&T’sdatarevenuescamefromretailbusiness and consumer customers. These retaildatarevenueswereup6.6percentversus results for the year-earlier quarter.
WIRELINE VOICE SERVICESAT&T’ssecond-quarterwirelinevoice revenues, which include retail local voice and long distance as well as wholesale voice,totaled$9.8billion,representingadeclineof7.8percentversusresultsfor thesecondquarterof2007.Thiscomparisonis consistent with results in recent quarters, reflecting the industrywide migration of voice usage from wired to wireless platforms, customer transitions to broadband and VoIP services and increased local voice competition.
USE THESE
2Q07 3Q07 4Q07 1Q08 2Q08
$719
$738
$802
Wireline
AT&T ENTERPRISE IP DATA REVENUES
Dollars in millions
Wireline
2Q07 3Q07 4Q07 1Q08 2Q08
51
126
379
549
AT&T U-VERSE TV CONNECTIONS IN SERVICE
In thousands
231
$796
2Q07 3Q07 4Q07 1Q08 2Q08
$58.91$59.43 $59.73
$61.40
AT&T AVERAGE MONTHLY CONSUMER REVENUES PER HOUSEHOLD SERVED
$60.57
Wireline
2007 comparisons are to 2006 pro forma results, which combine results from the former BellSouth and AT&T and exclude revenues from acquired operations.
AT&T WHOLESALE REVENUES — YEAR-OVER-YEAR GROWTH RATES
2Q07(3.0)%
3Q07(0.7)%
4Q070.4%
1Q081.5%
2Q082.1%
(8.3)%
(4.0)%
0
-1
-2
-3
-4
-5
-6
-7
-8
-9
Wireline
$851
Enterprise servicerevenue growth
2007 comparisons are to 2006 pro forma results, which combine results from the former BellSouth and AT&T and exclude revenues from acquired operations.
AT&T TOTAL ENTERPRISE REVENUE GROWTH RATES
1Q07(3.0)%
2Q07(0.7)%
3Q070.4%
4Q071.5%
1Q082.1%
(3.9)%
(1.7)%
(0.2)%
(2.0)%
2
1
0
-1
-2
-3
-4
Wireline
1.2%
Enterprise servicerevenue growth
Unchanged from 1Q Earnings
(7.0)%
(8.5)%
(0.2)% AT&T’s regional consumer ARPU has
ramped steadily over the past several
quarters, reflecting growth in broadband
and TV revenues.

InvestorBriefing | 2Q 200812
Advertising & Publishing
AT&T is a leader in local
search with more than
1,250 print directories
and YELLOWPAGES.COM,
its fast-growing online
search service.
AT&T’sAdvertising&Publishingsegmentoffersbusinessesafullsuiteoflocalsearch options including print and Internet Yellow Pages in addition to Web site design,searchenginemarketingandmobilesearch.
AT&T’sAdvertising&Publishingoperationsdeliverprintdirectoriestomorethan83millionresidencesandbusinessesin22statesandhaveapremieronlinepresencenationwidewithYELLOWPAGES.COM,whichoffersconsumersaccess to local business information, the latest business listings, city guides, maps and driving directions. Combined, these print and online products receive approximately5billionconsumersearchesayearforlocalbusinessinformationandprovidemorethan1millionadvertiserswithvaluablesalesleadstohelptheir businesses grow.
Advertising & Publishing revenue trends reflect migration from print to electronicsearch,includingrapidgrowthatAT&T’sYELLOWPAGES.COM.Advertising&Publishing’sInternetrevenuesincreased40.2percentversus the year-earlier second quarter, and total Advertising & Publishing revenues declined4.8percent,inpartreflectingrevenueslostthroughthesaleof a sales agency business that serves independent telephone companies. That transaction closed early in the second quarter.
Compared with reported results in the year-earlier quarter, operating expensestotaled$974million,down7.7percent;operatingincometotaled$433million,up2.4percent;andthesegment’soperatingincomemargin was30.8percent,up220basispoints.
AdjustedresultsforAdvertising&Publishingexcludemerger-relatednoncashamortizationcostsinbothquarters.Comparedwithresultsintheyear-earlierquarter,second-quarter2008adjustedoperatingexpensestotaled$781million,down2.4percent;adjustedoperatingincometotaled$626million,down 7.7percent;andthesegment’sadjustedoperatingincomemarginwas 44.5percent,down140basispoints.
InvestorBriefing | 2Q 200813
OtherAT&T’sOthersegmentincludesresultsfromAT&T’sSterlingCommerceoperationsandAT&T’scustomerinformationservicesoperations,bothofwhichareincludedin segment revenues and operating expenses. Customer information services include operator services and directory assistance. Sterling Commerce is one oftheworld’slargestprovidersofmulti-enterprisecollaborationsolutions. Thecompanyservestheretail,consumerpackagedgoods,manufacturing,financial services, health care and telecommunications industries.
TheOthersegmentalsoincludesAT&T’sproportionateshareofresultsfromTelmex, América Móvil and Telmex Internacional, which are shown in the Equity inNetIncomeofAffiliateslineforthissegment.AT&T’sequityinterestineachcompanyismorethan8percent.
América Móvil is one of the leading providers of telecommunications services inLatinAmerica,withmorethan159millionwirelesssubscribersattheendofthefirstquarterof2008incountriesthroughouttheregion,includingmorethan51millioninMexico.
Telmex is the leading telecommunications company in Mexico. Telmex and its subsidiaries provide a wide range of telecommunications services, data and video transmission, Internet access and integrated telecommunications solutions. Telmex Internacional has telecommunications operations in Argentina, Brazil,Chile,Colombia,Ecuador,Mexico,PeruandUruguay.
Onareportedbasis,Othersegmentincometotaled$167millioninthesecondquarterversus$117millionintheyear-earlierquarter.Segment revenuestotaled$512million,comparedwith$558millionforthesecondquarterof2007.EquityinNetIncomeofAffiliatestotaled$209million, upfrom$202millionintheyear-earlierquarter.
AT&T’s Other segment
includes results from its
Sterling Commerce unit,
customer information
services and equity
investments in Telmex,
América Móvil and
Telmex Internacional.
InvestorBriefing | 2Q 200814
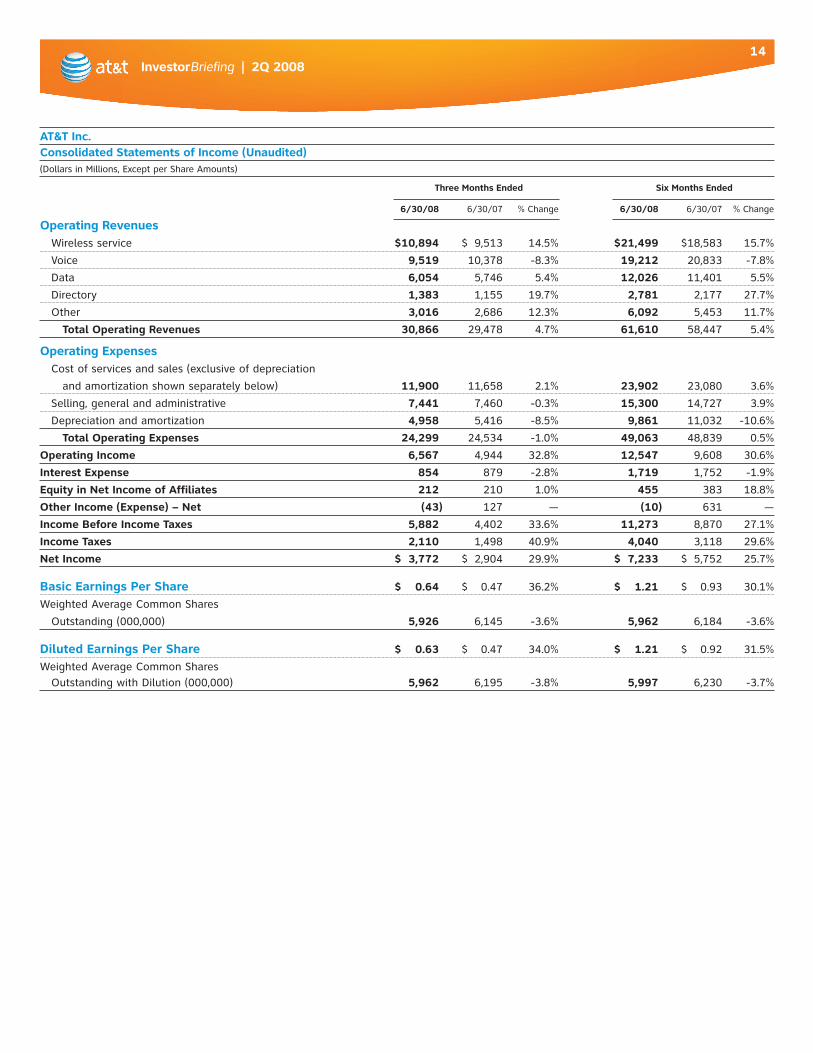
AT&T Inc.Consolidated Statements of Income (Unaudited)(Dollars in Millions, Except per Share Amounts)
Three Months Ended Six Months Ended
6/30/08 6/30/07 %Change 6/30/08 6/30/07 %Change
Operating Revenues Wireless service $10,894 $ 9,513 14.5% $21,499 $18,583 15.7%
Voice 9,519 10,378 -8.3% 19,212 20,833 -7.8%
Data 6,054 5,746 5.4% 12,026 11,401 5.5%
Directory 1,383 1,155 19.7% 2,781 2,177 27.7%
Other 3,016 2,686 12.3% 6,092 5,453 11.7%
Total Operating Revenues 30,866 29,478 4.7% 61,610 58,447 5.4%
Operating Expenses Cost of services and sales (exclusive of depreciation
andamortizationshownseparatelybelow) 11,900 11,658 2.1% 23,902 23,080 3.6%
Selling, general and administrative 7,441 7,460 -0.3% 15,300 14,727 3.9%
Depreciationandamortization 4,958 5,416 -8.5% 9,861 11,032 -10.6%
Total Operating Expenses 24,299 24,534 -1.0% 49,063 48,839 0.5%
Operating Income 6,567 4,944 32.8% 12,547 9,608 30.6%
Interest Expense 854 879 -2.8% 1,719 1,752 -1.9%
Equity in Net Income of Affiliates 212 210 1.0% 455 383 18.8%
Other Income (Expense) – Net (43) 127 — (10) 631 —
Income Before Income Taxes 5,882 4,402 33.6% 11,273 8,870 27.1%
Income Taxes 2,110 1,498 40.9% 4,040 3,118 29.6%
Net Income $ 3,772 $ 2,904 29.9% $ 7,233 $ 5,752 25.7%
Basic Earnings Per Share $ 0.64 $ 0.47 36.2% $ 1.21 $ 0.93 30.1%
Weighted Average Common Shares
Outstanding(000,000) 5,926 6,145 -3.6% 5,962 6,184 -3.6%
Diluted Earnings Per Share $ 0.63 $ 0.47 34.0% $ 1.21 $ 0.92 31.5%
Weighted Average Common Shares OutstandingwithDilution(000,000) 5,962 6,195 -3.8% 5,997 6,230 -3.7%
InvestorBriefing | 2Q 200815
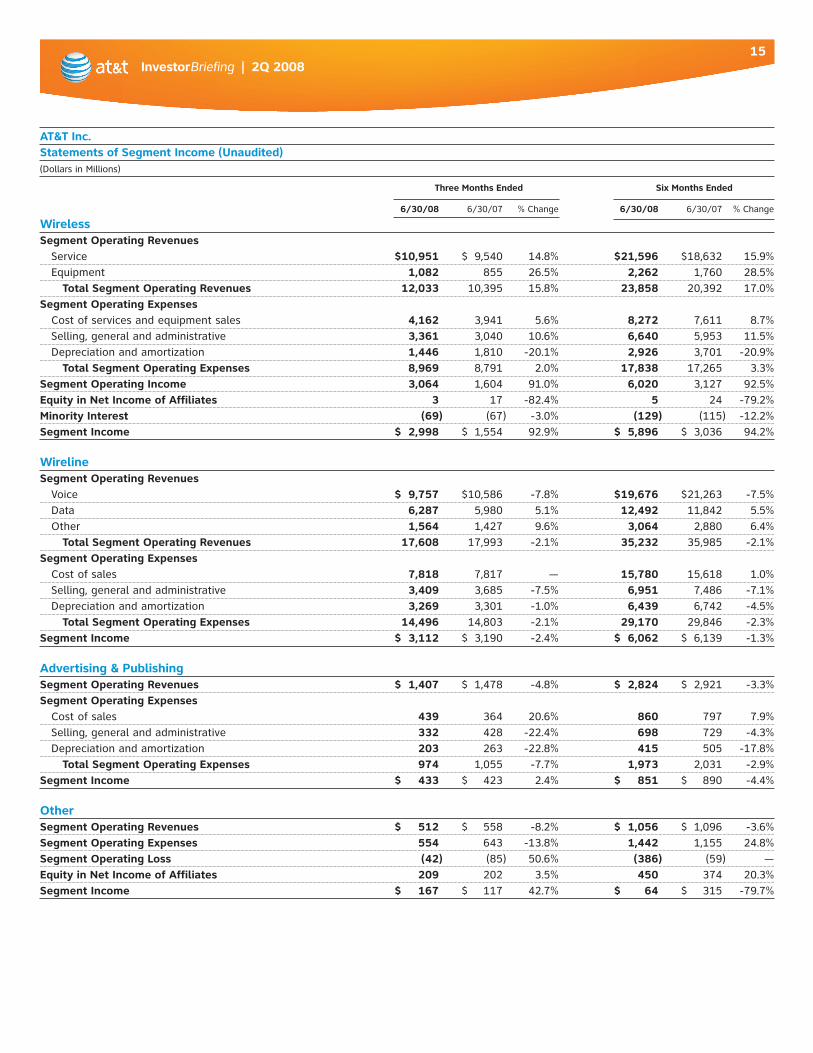
AT&T Inc.Statements of Segment Income (Unaudited)(Dollars in Millions)
Three Months Ended Six Months Ended
6/30/08 6/30/07 %Change 6/30/08 6/30/07 %Change
WirelessSegment Operating Revenues Service $10,951 $ 9,540 14.8% $21,596 $18,632 15.9% Equipment 1,082 855 26.5% 2,262 1,760 28.5% Total Segment Operating Revenues 12,033 10,395 15.8% 23,858 20,392 17.0%Segment Operating Expenses Cost of services and equipment sales 4,162 3,941 5.6% 8,272 7,611 8.7% Selling, general and administrative 3,361 3,040 10.6% 6,640 5,953 11.5% Depreciationandamortization 1,446 1,810 -20.1% 2,926 3,701 -20.9% Total Segment Operating Expenses 8,969 8,791 2.0% 17,838 17,265 3.3%Segment Operating Income 3,064 1,604 91.0% 6,020 3,127 92.5%Equity in Net Income of Affiliates 3 17 -82.4% 5 24 -79.2%Minority Interest (69) (67) -3.0% (129) (115) -12.2%Segment Income $ 2,998 $ 1,554 92.9% $ 5,896 $ 3,036 94.2%
WirelineSegment Operating Revenues Voice $ 9,757 $10,586 -7.8% $19,676 $21,263 -7.5% Data 6,287 5,980 5.1% 12,492 11,842 5.5% Other 1,564 1,427 9.6% 3,064 2,880 6.4% Total Segment Operating Revenues 17,608 17,993 -2.1% 35,232 35,985 -2.1%Segment Operating Expenses Cost of sales 7,818 7,817 — 15,780 15,618 1.0% Selling, general and administrative 3,409 3,685 -7.5% 6,951 7,486 -7.1% Depreciationandamortization 3,269 3,301 -1.0% 6,439 6,742 -4.5% Total Segment Operating Expenses 14,496 14,803 -2.1% 29,170 29,846 -2.3%Segment Income $ 3,112 $ 3,190 -2.4% $ 6,062 $ 6,139 -1.3%
Advertising & PublishingSegment Operating Revenues $ 1,407 $ 1,478 -4.8% $ 2,824 $ 2,921 -3.3%Segment Operating Expenses Cost of sales 439 364 20.6% 860 797 7.9% Selling, general and administrative 332 428 -22.4% 698 729 -4.3% Depreciationandamortization 203 263 -22.8% 415 505 -17.8% Total Segment Operating Expenses 974 1,055 -7.7% 1,973 2,031 -2.9%Segment Income $ 433 $ 423 2.4% $ 851 $ 890 -4.4%
OtherSegment Operating Revenues $ 512 $ 558 -8.2% $ 1,056 $ 1,096 -3.6%Segment Operating Expenses 554 643 -13.8% 1,442 1,155 24.8%Segment Operating Loss (42) (85) 50.6% (386) (59) —Equity in Net Income of Affiliates 209 202 3.5% 450 374 20.3%Segment Income $ 167 $ 117 42.7% $ 64 $ 315 -79.7%
InvestorBriefing | 2Q 200816
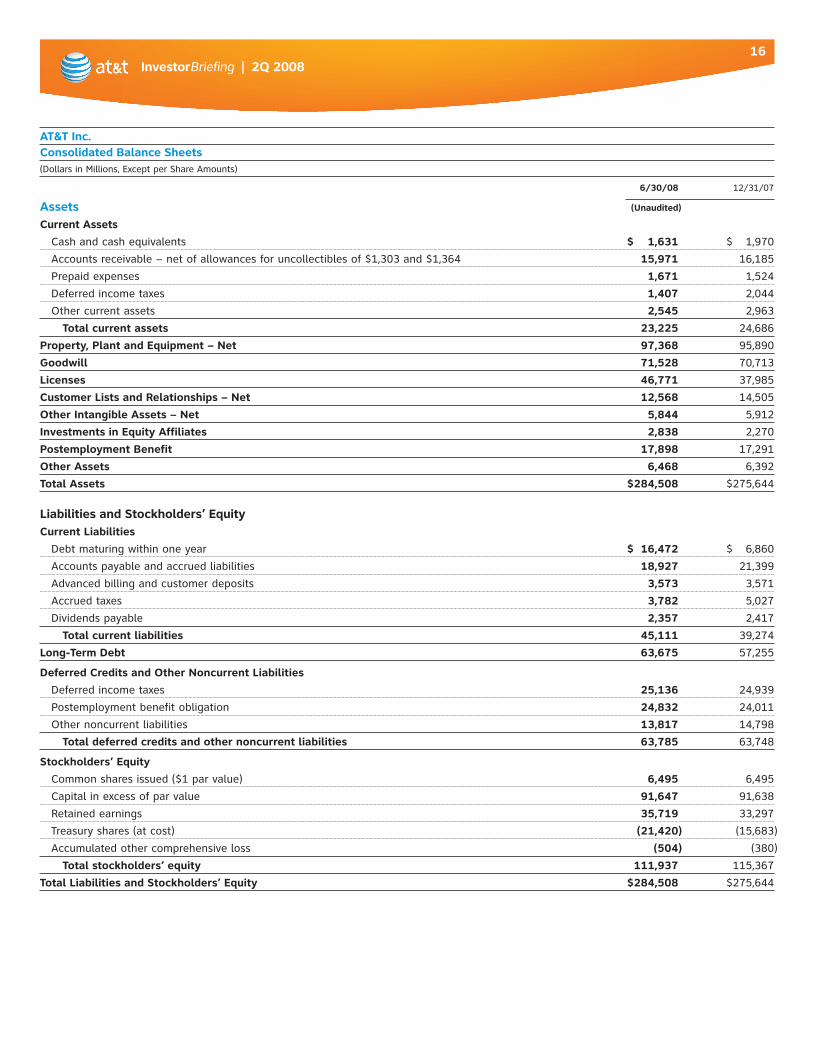
AT&T Inc.Consolidated Balance Sheets(Dollars in Millions, Except per Share Amounts)
6/30/08 12/31/07
Assets (Unaudited)
Current Assets
Cash and cash equivalents $ 1,631 $ 1,970
Accountsreceivable–netofallowancesforuncollectiblesof$1,303and$1,364 15,971 16,185
Prepaid expenses 1,671 1,524
Deferred income taxes 1,407 2,044
Other current assets 2,545 2,963
Total current assets 23,225 24,686
Property, Plant and Equipment – Net 97,368 95,890
Goodwill 71,528 70,713
Licenses 46,771 37,985
Customer Lists and Relationships – Net 12,568 14,505
Other Intangible Assets – Net 5,844 5,912
Investments in Equity Affiliates 2,838 2,270
Postemployment Benefit 17,898 17,291
Other Assets 6,468 6,392
Total Assets $284,508 $275,644
Liabilities and Stockholders’ EquityCurrent Liabilities
Debt maturing within one year $ 16,472 $ 6,860
Accounts payable and accrued liabilities 18,927 21,399
Advanced billing and customer deposits 3,573 3,571
Accrued taxes 3,782 5,027
Dividends payable 2,357 2,417
Total current liabilities 45,111 39,274
Long-Term Debt 63,675 57,255
Deferred Credits and Other Noncurrent Liabilities
Deferred income taxes 25,136 24,939
Postemployment benefit obligation 24,832 24,011
Other noncurrent liabilities 13,817 14,798
Total deferred credits and other noncurrent liabilities 63,785 63,748
Stockholders’ Equity
Commonsharesissued($1parvalue) 6,495 6,495
Capital in excess of par value 91,647 91,638
Retained earnings 35,719 33,297
Treasury shares (at cost) (21,420) (15,683)
Accumulated other comprehensive loss (504) (380)
Total stockholders’ equity 111,937 115,367
Total Liabilities and Stockholders’ Equity $284,508 $275,644
InvestorBriefing | 2Q 200817
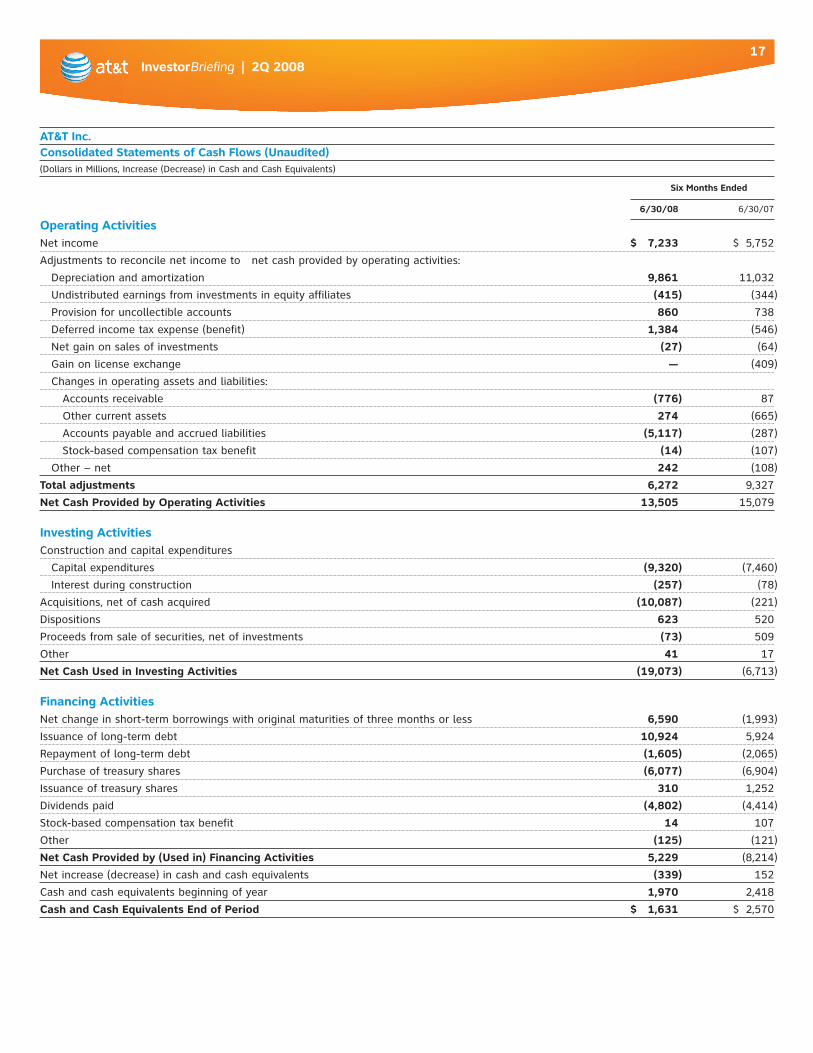
AT&T Inc.Consolidated Statements of Cash Flows (Unaudited)(Dollars in Millions, Increase (Decrease) in Cash and Cash Equivalents)
Six Months Ended
6/30/08 6/30/07
Operating ActivitiesNet income $ 7,233 $ 5,752
Adjustmentstoreconcilenetincometonetcashprovidedbyoperatingactivities:
Depreciationandamortization 9,861 11,032
Undistributedearningsfrominvestmentsinequityaffiliates (415) (344)
Provision for uncollectible accounts 860 738
Deferred income tax expense (benefit) 1,384 (546)
Net gain on sales of investments (27) (64)
Gainonlicenseexchange — (409)
Changes in operating assets and liabilities:
Accounts receivable (776) 87
Other current assets 274 (665)
Accounts payable and accrued liabilities (5,117) (287)
Stock-basedcompensationtaxbenefit (14) (107)
Other – net 242 (108)
Total adjustments 6,272 9,327
Net Cash Provided by Operating Activities 13,505 15,079
Investing ActivitiesConstruction and capital expenditures
Capital expenditures (9,320) (7,460)
Interest during construction (257) (78)
Acquisitions, net of cash acquired (10,087) (221)
Dispositions 623 520
Proceeds from sale of securities, net of investments (73) 509
Other 41 17
Net Cash Used in Investing Activities (19,073) (6,713)
Financing ActivitiesNet change in short-term borrowings with original maturities of three months or less 6,590 (1,993)
Issuance of long-term debt 10,924 5,924
Repayment of long-term debt (1,605) (2,065)
Purchase of treasury shares (6,077) (6,904)
Issuance of treasury shares 310 1,252
Dividends paid (4,802) (4,414)
Stock-basedcompensationtaxbenefit 14 107
Other (125) (121)
Net Cash Provided by (Used in) Financing Activities 5,229 (8,214)
Net increase (decrease) in cash and cash equivalents (339) 152
Cash and cash equivalents beginning of year 1,970 2,418
Cash and Cash Equivalents End of Period $ 1,631 $ 2,570
InvestorBriefing | 2Q 200818
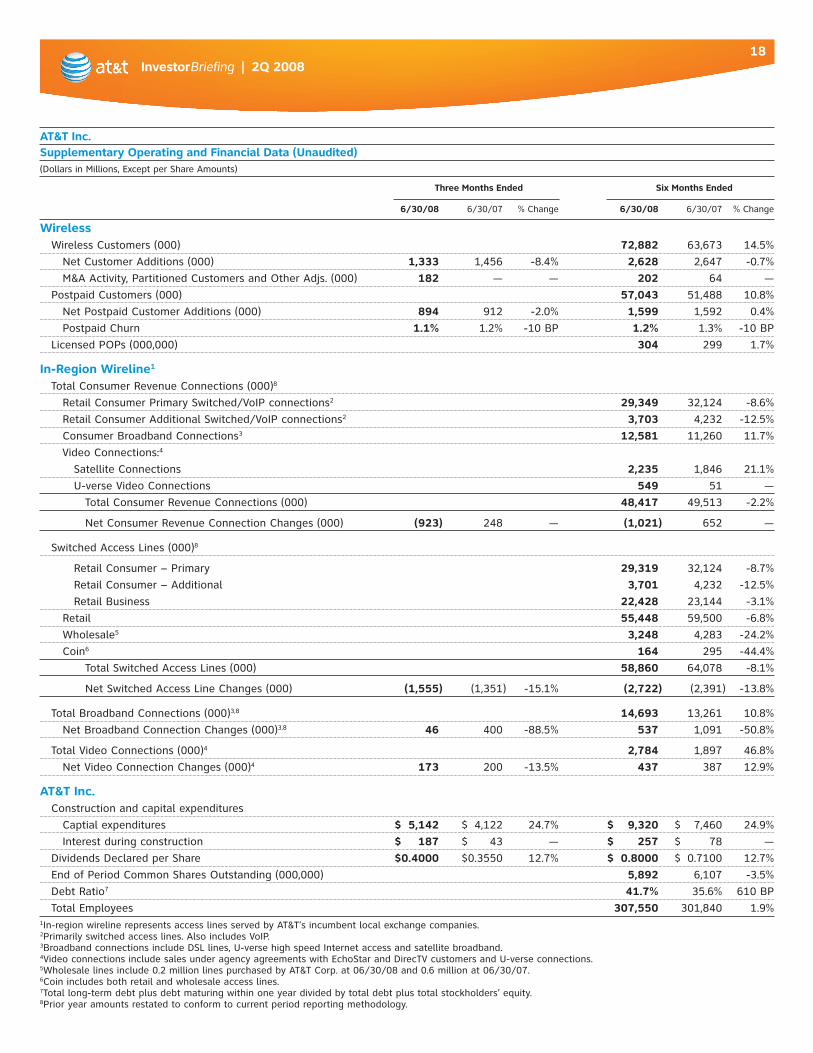
AT&T Inc.Supplementary Operating and Financial Data (Unaudited)(Dollars in Millions, Except per Share Amounts)
Three Months Ended Six Months Ended
6/30/08 6/30/07 %Change 6/30/08 6/30/07 %Change
Wireless WirelessCustomers(000) 72,882 63,673 14.5%
NetCustomerAdditions(000) 1,333 1,456 -8.4% 2,628 2,647 -0.7%
M&AActivity,PartitionedCustomersandOtherAdjs.(000) 182 — — 202 64 —
PostpaidCustomers(000) 57,043 51,488 10.8%
NetPostpaidCustomerAdditions(000) 894 912 -2.0% 1,599 1,592 0.4%
Postpaid Churn 1.1% 1.2% -10BP 1.2% 1.3% -10BP
LicensedPOPs(000,000) 304 299 1.7%
In-Region Wireline1
TotalConsumerRevenueConnections(000)8
RetailConsumerPrimarySwitched/VoIPconnections2 29,349 32,124 -8.6%
RetailConsumerAdditionalSwitched/VoIPconnections2 3,703 4,232 -12.5%
Consumer Broadband Connections3 12,581 11,260 11.7%
Video Connections:4
Satellite Connections 2,235 1,846 21.1%
U-verseVideoConnections 549 51 —
TotalConsumerRevenueConnections(000) 48,417 49,513 -2.2%
NetConsumerRevenueConnectionChanges(000) (923) 248 — (1,021) 652 —
SwitchedAccessLines(000)8
Retail Consumer – Primary 29,319 32,124 -8.7%
Retail Consumer – Additional 3,701 4,232 -12.5%
Retail Business 22,428 23,144 -3.1%
Retail 55,448 59,500 -6.8%
Wholesale5 3,248 4,283 -24.2%
Coin6 164 295 -44.4%
TotalSwitchedAccessLines(000) 58,860 64,078 -8.1%
NetSwitchedAccessLineChanges(000) (1,555) (1,351) -15.1% (2,722) (2,391) -13.8%
TotalBroadbandConnections(000)3,8 14,693 13,261 10.8%
NetBroadbandConnectionChanges(000)3,8 46 400 -88.5% 537 1,091 -50.8%
TotalVideoConnections(000)4 2,784 1,897 46.8%
NetVideoConnectionChanges(000)4 173 200 -13.5% 437 387 12.9%
AT&T Inc. Construction and capital expenditures
Captial expenditures $ 5,142 $ 4,122 24.7% $ 9,320 $ 7,460 24.9%
Interest during construction $ 187 $ 43 — $ 257 $ 78 —
Dividends Declared per Share $0.4000 $0.3550 12.7% $ 0.8000 $ 0.7100 12.7%
EndofPeriodCommonSharesOutstanding(000,000) 5,892 6,107 -3.5%
Debt Ratio7 41.7% 35.6% 610BP
Total Employees 307,550 301,840 1.9%1In-regionwirelinerepresentsaccesslinesservedbyAT&T’sincumbentlocalexchangecompanies.2Primarily switched access lines. Also includes VoIP.3BroadbandconnectionsincludeDSLlines,U-versehighspeedInternetaccessandsatellitebroadband.4VideoconnectionsincludesalesunderagencyagreementswithEchoStarandDirecTVcustomersandU-verseconnections.5Wholesalelinesinclude0.2millionlinespurchasedbyAT&TCorp.at06/30/08and0.6millionat06/30/07.6Coin includes both retail and wholesale access lines.7Totallong-termdebtplusdebtmaturingwithinoneyeardividedbytotaldebtplustotalstockholders’equity.8Prior year amounts restated to conform to current period reporting methodology.
InvestorBriefing | 2Q 200819
Third-Quarter 2008 Earnings Date: Oct. 22, 2008
AT&T will release third-quarter 2008 earnings on Oct. 22, 2008, before the market opens.
Thecompany’sInvestorBriefing and related earnings materials will be available on
the AT&T Web site at www.att.com/investor.relationsby8a.m.Easterntime.
AT&Twillalsohostaconferencecalltodiscusstheresultsat10a.m.Easterntimethe
same day. Dial-in and replay information will be announced on First Call approximately
eightweeksbeforethecall,whichwillalsobebroadcastliveandwillbeavailablefor
replay over the Internet at www.att.com/investor.relations.
Cautionary Language Concerning Forward-Looking Statements
Information set forth in this InvestorBriefing contains financial estimates and other
forward-lookingstatementsthataresubjecttorisksanduncertainties,andactual
results may differ materially. A discussion of factors that may affect future results
iscontainedinAT&T’sfilingswiththeSecuritiesandExchangeCommission.
AT&T disclaims any obligation to update or revise statements contained in this
InvestorBriefing based on new information or otherwise.
This InvestorBriefingmaycontaincertainnon-GAAPfinancialmeasures.Reconciliations
betweenthenon-GAAPfinancialmeasuresandtheGAAPfinancialmeasuresare
availableonthecompany’sWebsiteatwww.att.com/investor.relations.
AT&T InvestorBriefing The AT&T InvestorBriefing is published by the Investor Relations staff of AT&T Inc. Requests for further information may be directed to one of the Investor Relations managers byphoneat210-351-3327orbyfax at210-351-2071.
Correspondence should be sent to: Investor Relations AT&T Inc. Whitacre Tower 175E.Houston,Room8-A-60 SanAntonio,TX78205
E-mail address: [email protected]
Senior Vice President- Investor Relations BrooksMcCorcle
Investor Relations StaffRay CarpenterKris CartagenaRosa EscobedoKent EvansJeff FancherJerryHealy
Kim MainShelly MathewsJerrell RossDamon SmithBlakeStewardChrisWomack