Embed Size (px)
Citation preview
1
Cover
Results for the six months ended 30 June 2013
Tuesday, 23 July 2013
Disclaimer notice
Certain statements in the presentation, are or may constitute “forward looking statements”. Such forward looking statements involve risks, uncertainties and other factors which may cause the actual results, performance or achievements of the company, or industry results, to be materially different from any future results, performance or achievements expressed by such forward looking statements. The information and opinions contained in this presentation are provided as at the date of this presentation and are subject to change without notice. There is no intention, nor is any duty or obligation assumed to supplement, amend, update or revise any of the information contained in this presentation.
2
Contents
Pages
Overview 5 Business update 6
FinancialsPerformance 8 Investments 9-10 Reserves 11-12 Capital position 13
In Focus Property 14-19
Underwriting review and outlook 20-22
Appendix 24-34
3

Generic title white
Overview
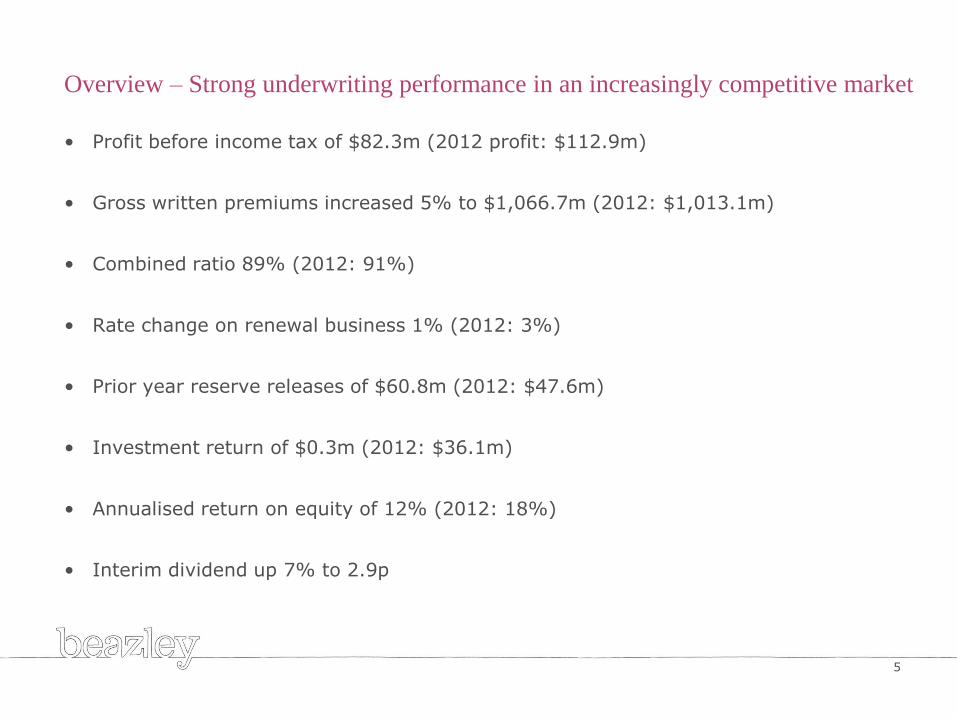
Overview – Strong underwriting performance in an increasingly competitive market
• Profit before income tax of $82.3m (2012 profit: $112.9m)
• Gross written premiums increased 5% to $1,066.7m (2012: $1,013.1m)
• Combined ratio 89% (2012: 91%)
• Rate change on renewal business 1% (2012: 3%)
• Prior year reserve releases of $60.8m (2012: $47.6m)
• Investment return of $0.3m (2012: $36.1m)
• Annualised return on equity of 12% (2012: 18%)
• Interim dividend up 7% to 2.9p
5
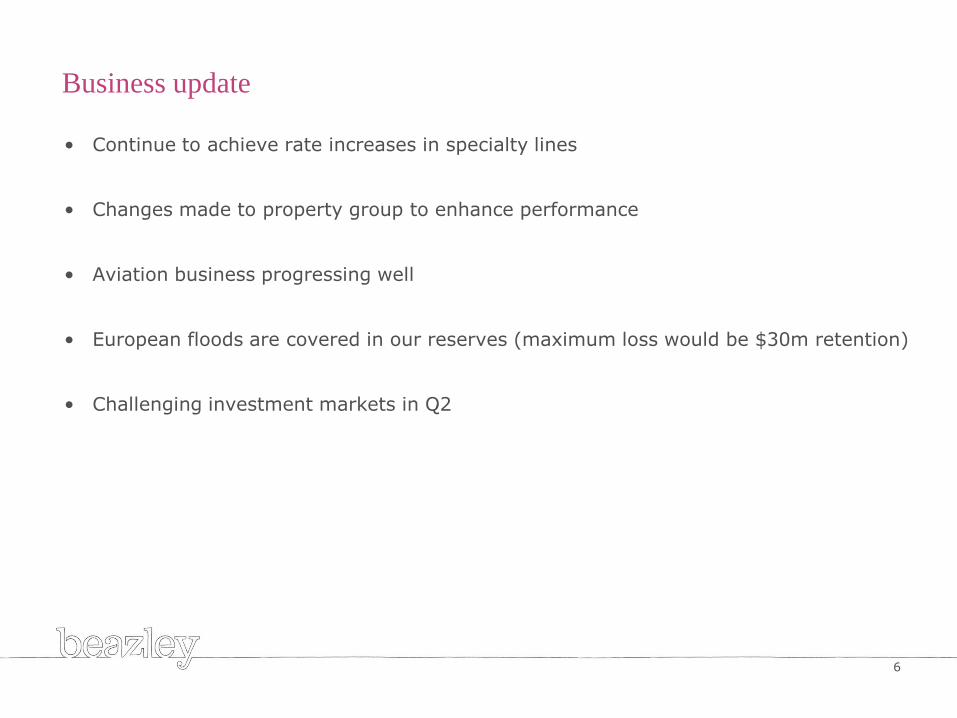
• Continue to achieve rate increases in specialty lines
• Changes made to property group to enhance performance
• Aviation business progressing well
• European floods are covered in our reserves (maximum loss would be $30m retention)
• Challenging investment markets in Q2
Business update
6

Generic title white
Financials
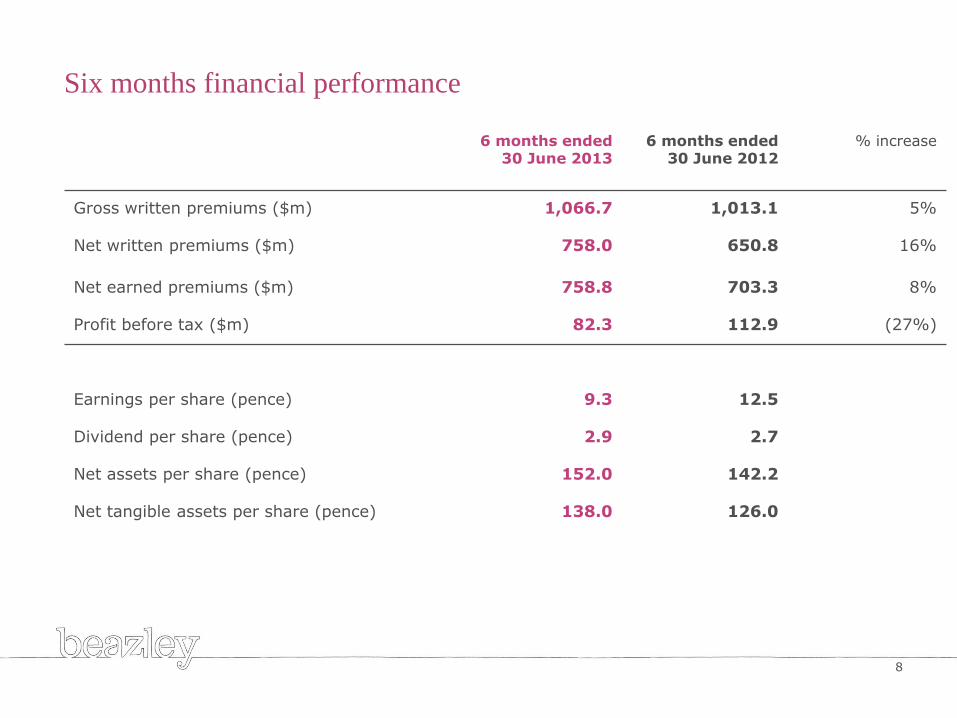
Six months financial performance
6 months ended 30 June 2013
6 months ended 30 June 2012
% increase
Gross written premiums ($m) 1,066.7 1,013.1 5%
Net written premiums ($m) 758.0 650.8 16%
Net earned premiums ($m) 758.8 703.3 8%
Profit before tax ($m) 82.3 112.9 (27%)
Earnings per share (pence) 9.3 12.5
Dividend per share (pence) 2.9 2.7
Net assets per share (pence) 152.0 142.2
Net tangible assets per share (pence) 138.0 126.0
8
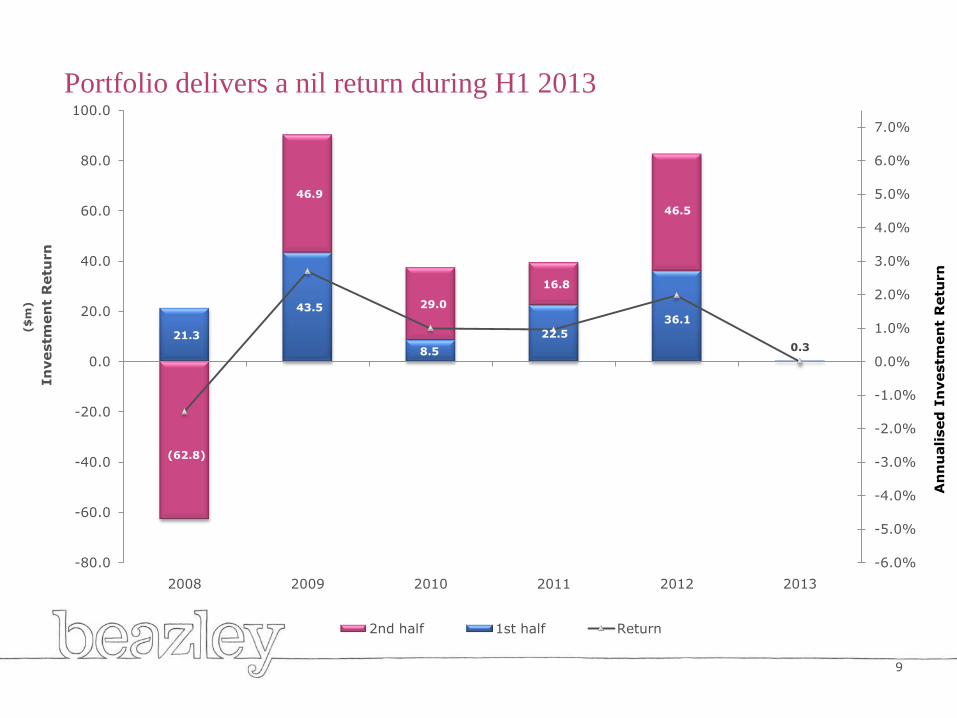
Portfolio delivers a nil return during H1 2013
21.3
43.5
8.5
22.5
36.1
0.3
(62.8)
46.9
29.0
16.8
46.5
-6.0%
-5.0%
-4.0%
-3.0%
-2.0%
-1.0%
0.0%
1.0%
2.0%
3.0%
4.0%
5.0%
6.0%
7.0%
-80.0
-60.0
-40.0
-20.0
0.0
20.0
40.0
60.0
80.0
100.0
2008 2009 2010 2011 2012 2013
2nd half 1st half Return
An
nu
alised
In
vestm
en
t R
etu
rn
($
m)
In
vestm
en
t R
etu
rn
9
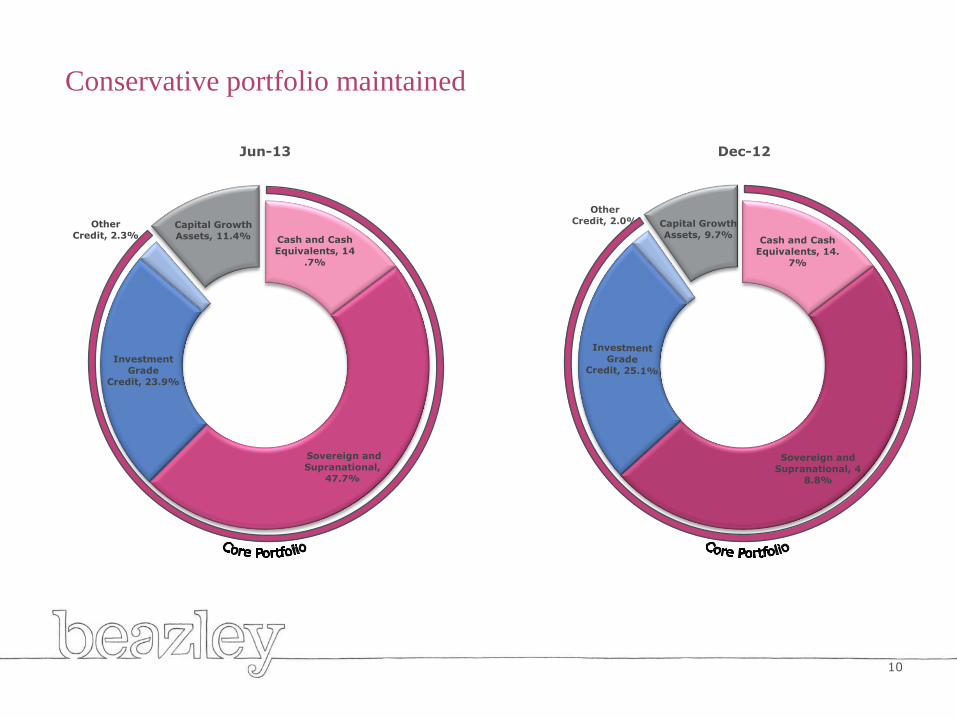
Conservative portfolio maintained
Cash and Cash
Equivalents, 14
.7%
Sovereign and
Supranational,
47.7%
Investment
Grade
Credit, 23.9%
Other
Credit, 2.3%Capital Growth
Assets, 11.4%
Jun-13
Cash and Cash
Equivalents, 14.
7%
Sovereign and
Supranational, 4
8.8%
Other
Credit, 2.0% Capital Growth
Assets, 9.7%
Dec-12
10
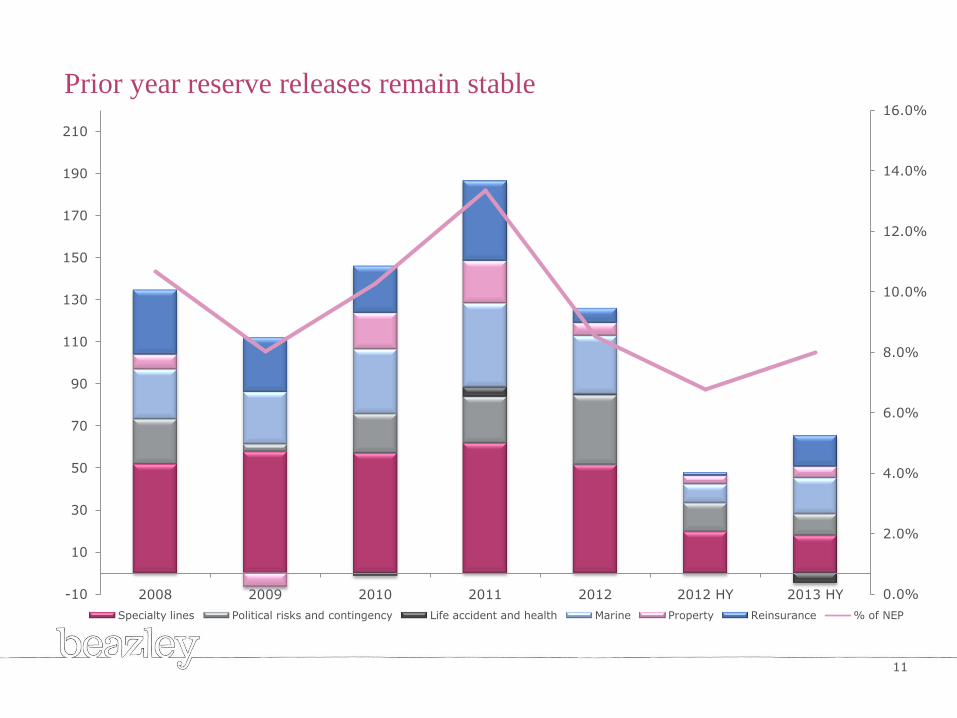
Prior year reserve releases remain stable
11
0.0%
2.0%
4.0%
6.0%
8.0%
10.0%
12.0%
14.0%
16.0%
-10
10
30
50
70
90
110
130
150
170
190
210
2008 2009 2010 2011 2012 2012 HY 2013 HY
Specialty lines Political risks and contingency Life accident and health Marine Property Reinsurance % of NEP
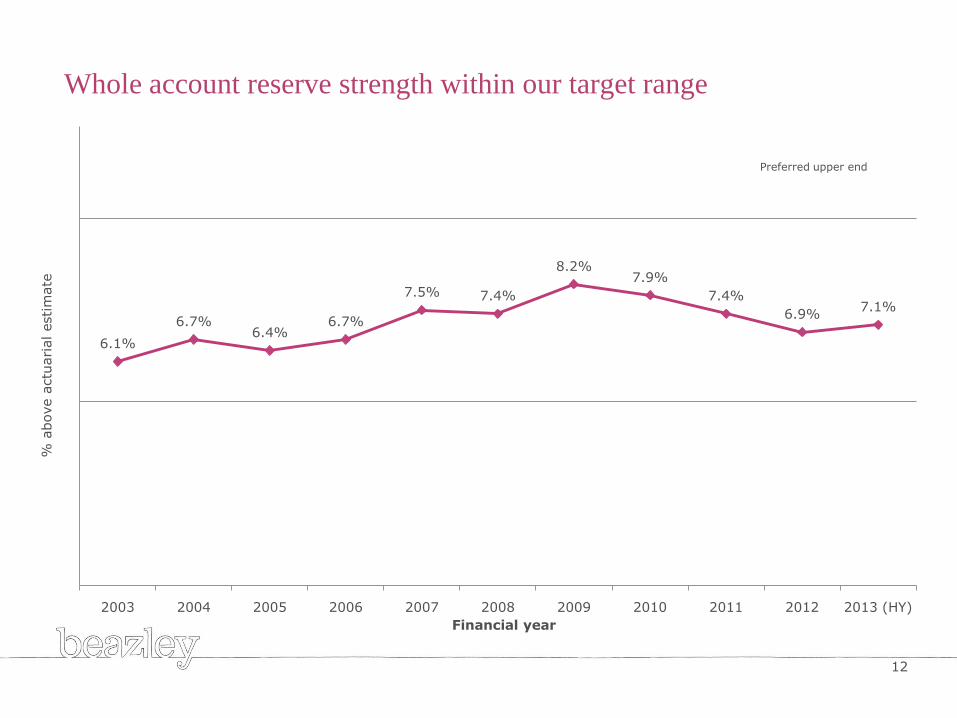
Whole account reserve strength within our target range
12
Preferred upper end
% a
bove a
ctu
ari
al estim
ate
6.1%
6.7%6.4%
6.7%
7.5% 7.4%
8.2%7.9%
7.4%
6.9%7.1%
2003 2004 2005 2006 2007 2008 2009 2010 2011 2012 2013 (HY)
Financial year
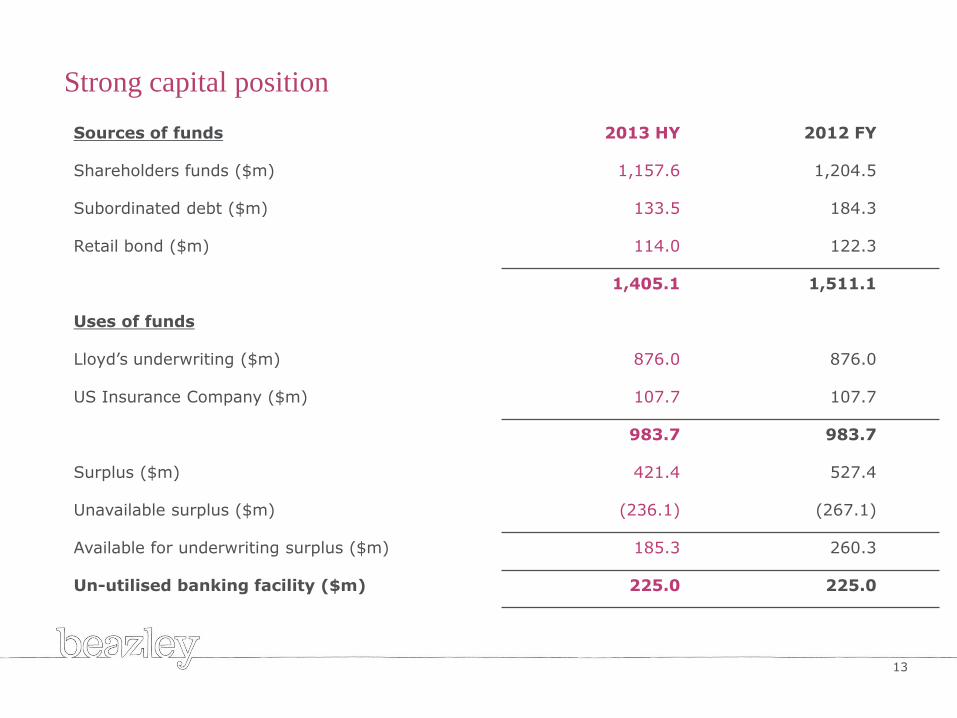
Strong capital position
Sources of funds 2013 HY 2012 FY
Shareholders funds ($m) 1,157.6 1,204.5
Subordinated debt ($m) 133.5 184.3
Retail bond ($m) 114.0 122.3
1,405.1 1,511.1
Uses of funds
Lloyd’s underwriting ($m) 876.0 876.0
US Insurance Company ($m) 107.7 107.7
983.7 983.7
Surplus ($m) 421.4 527.4
Unavailable surplus ($m) (236.1) (267.1)
Available for underwriting surplus ($m) 185.3 260.3
Un-utilised banking facility ($m) 225.0 225.0
13

Generic title white
In Focus – Property
15
• Team Structure
• Product Mix
• Performance
•
Covering:
• Continuity in leadership
• Increased margins
• Growth where appropriate
• Favourable trading conditions
Key themes
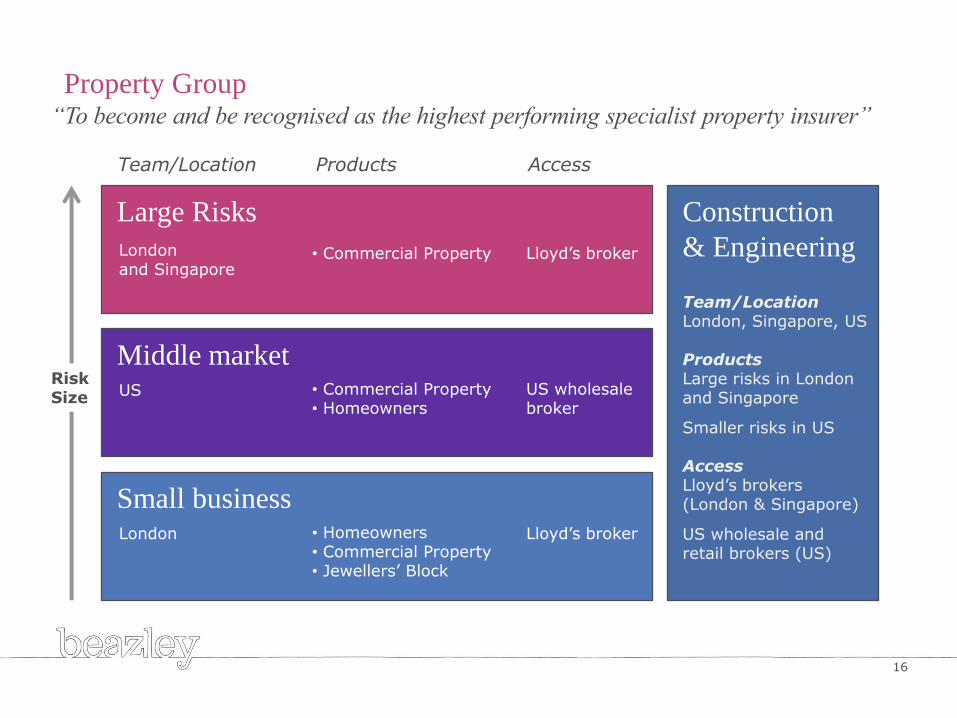
Property Group
Large Risks
Middle market
Small business
Construction
& Engineering
RiskSize
Team/Location Products Access
London and Singapore
US
London
Lloyd’s broker
Lloyd’s broker
US wholesalebroker
Team/LocationLondon, Singapore, US
ProductsLarge risks in London and Singapore
Smaller risks in US
AccessLloyd’s brokers (London & Singapore)
US wholesale and retail brokers (US)
“To become and be recognised as the highest performing specialist property insurer”
• Commercial Property
• Commercial Property• Homeowners
• Homeowners• Commercial Property• Jewellers’ Block
16
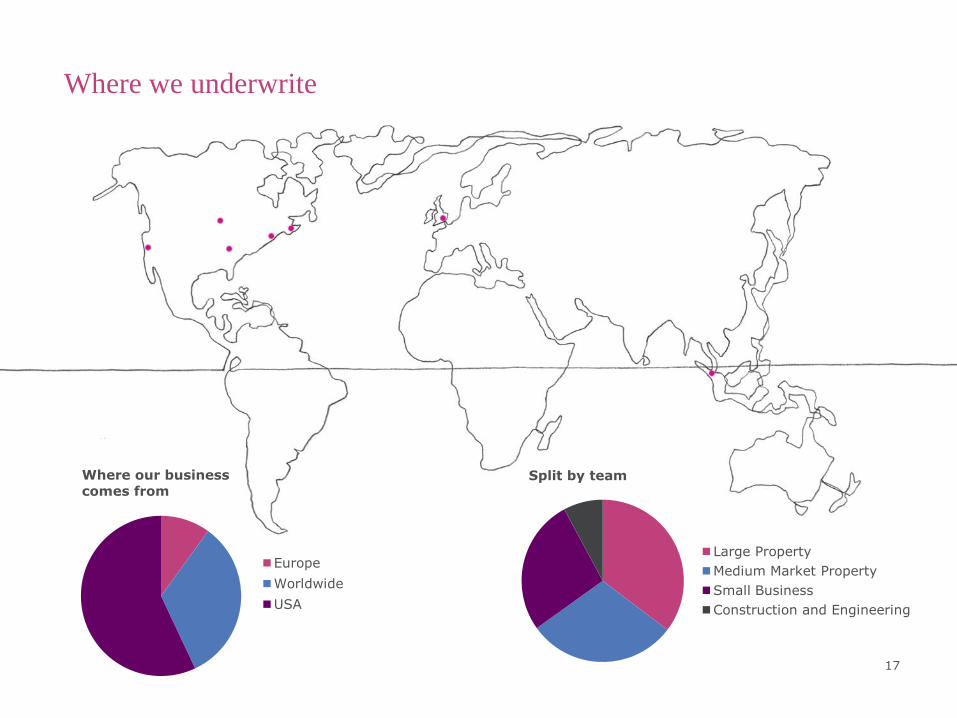
Where we underwrite
17
Where our business
comes from
Europe
Worldwide
USA
Split by team
Large Property
Medium Market Property
Small Business
Construction and Engineering
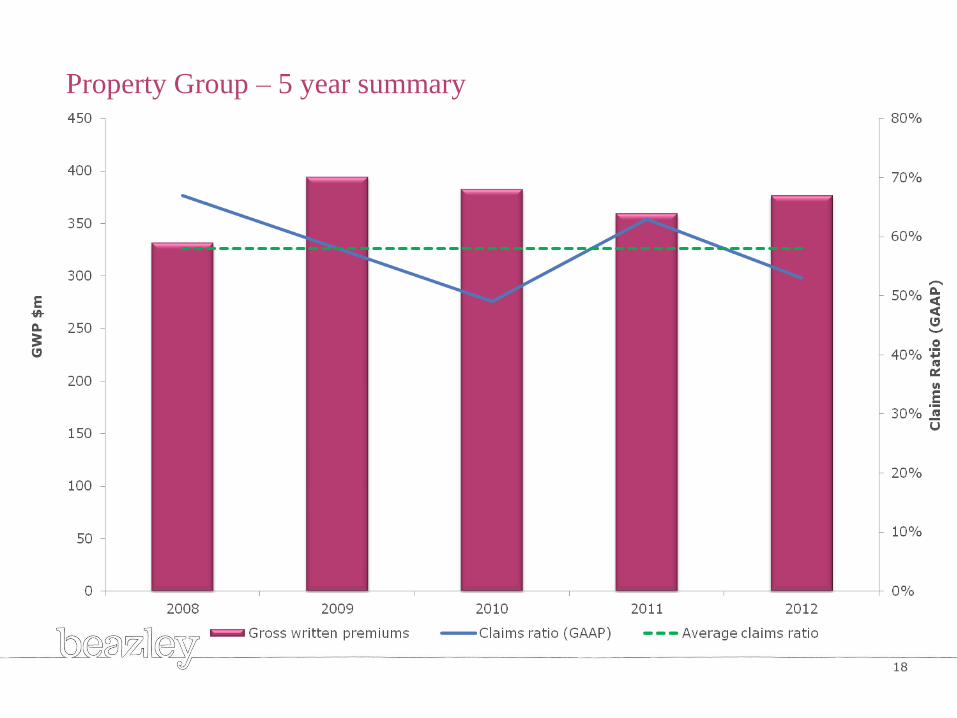
Property Group – 5 year summary
18
GW
P $
m
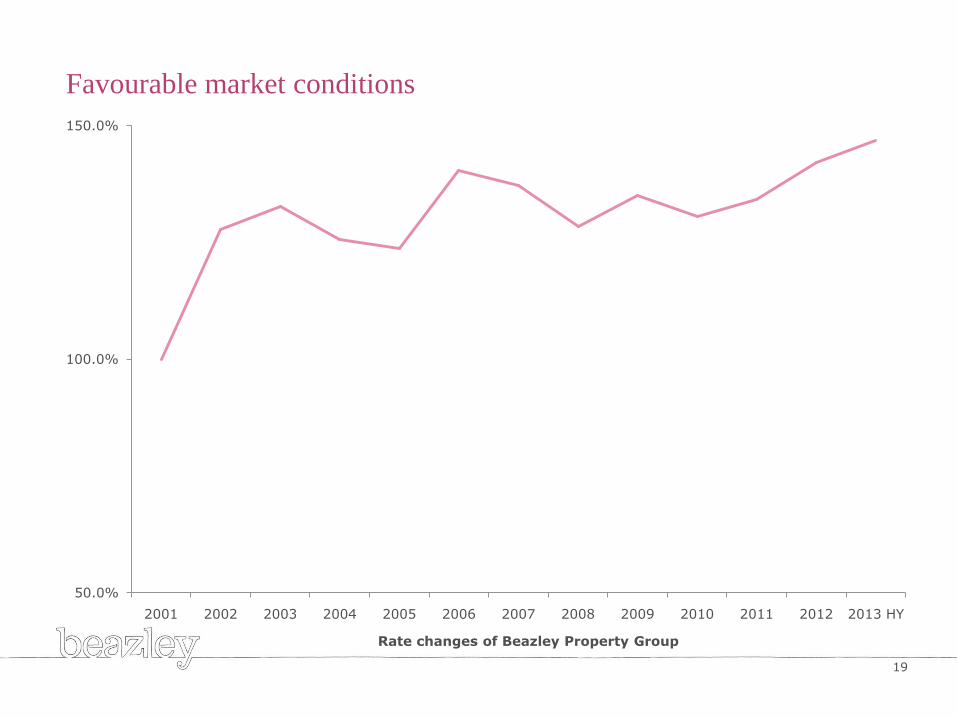
Favourable market conditions
19
50.0%
100.0%
150.0%
2001 2002 2003 2004 2005 2006 2007 2008 2009 2010 2011 2012 2013 HY
Rate changes of Beazley Property Group
Underwriting review and outlook
20
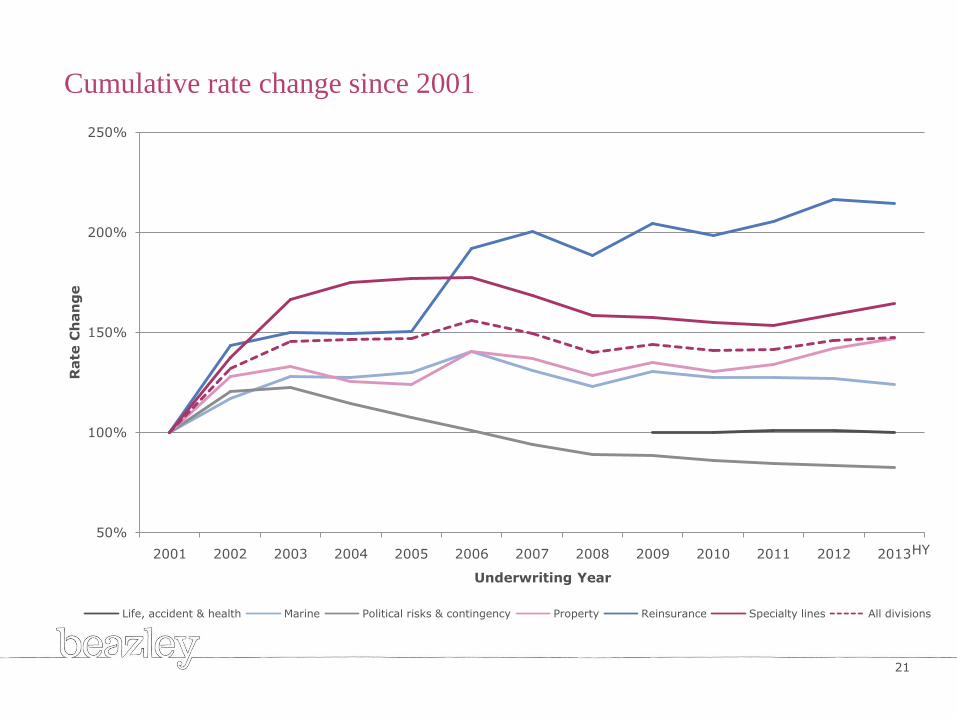
Cumulative rate change since 2001
21
50%
100%
150%
200%
250%
2001 2002 2003 2004 2005 2006 2007 2008 2009 2010 2011 2012 2013
Rate
Ch
an
ge
Underwriting Year
Life, accident & health Marine Political risks & contingency Property Reinsurance Specialty lines All divisions
HY
• Increasing competitive headwinds
• New capital entering the reinsurance market
• Entrants to US surplus lines markets
• Broker led initiatives increasing capacity in London
• Beazley’s balanced portfolio is well positioned for these headwinds and thanks to specialty lines, we are planning to achieve flat rates in 2014
• We have growth areas that will continue into 2014
• We expect to earn a 2% yield on the investment portfolio going forward
Outlook
22

Questions?
Any questions?

Generic title white
Appendix
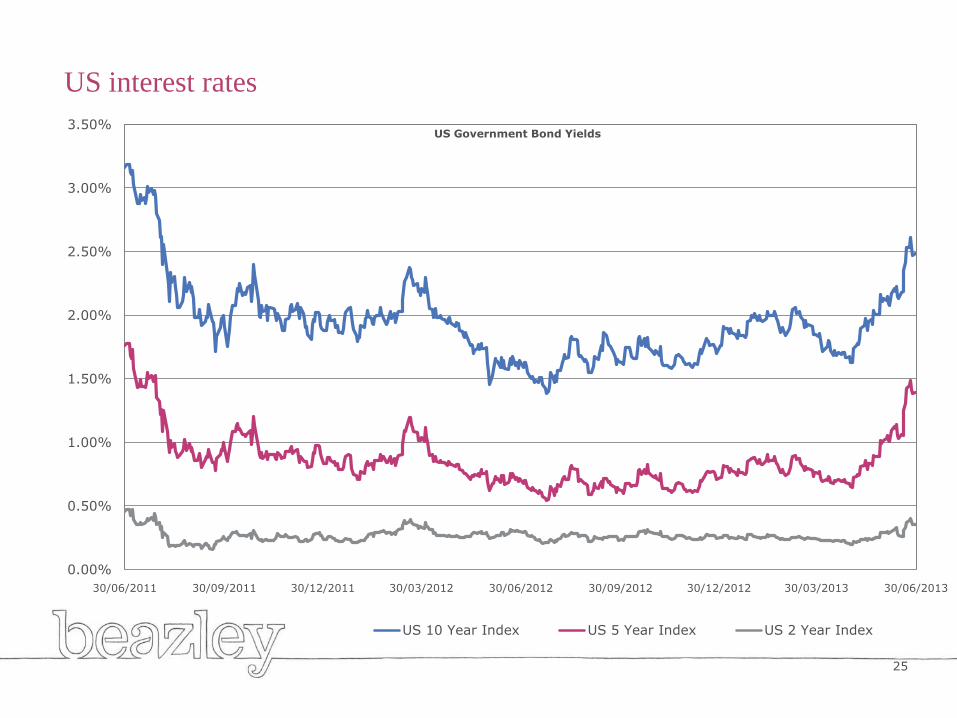
US interest rates
0.00%
0.50%
1.00%
1.50%
2.00%
2.50%
3.00%
3.50%
30/06/2011 30/09/2011 30/12/2011 30/03/2012 30/06/2012 30/09/2012 30/12/2012 30/03/2013 30/06/2013
US Government Bond Yields
US 10 Year Index US 5 Year Index US 2 Year Index
25
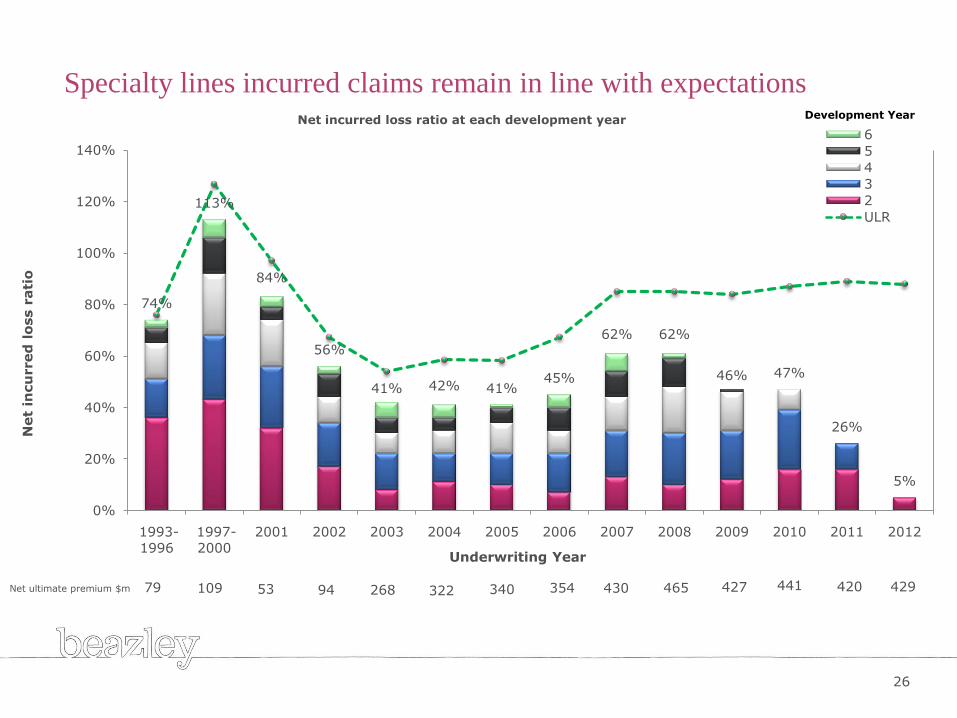
Specialty lines incurred claims remain in line with expectations
Net ultimate premium $m
26
74%
113%
84%
56%
41% 42% 41%45%
62% 62%
46% 47%
26%
5%
79 109 53 94 268 322 340 354 430 465 427 441 420 429
0%
20%
40%
60%
80%
100%
120%
140%
1993-
1996
1997-
2000
2001 2002 2003 2004 2005 2006 2007 2008 2009 2010 2011 2012
Net
incu
rred
lo
ss r
ati
o
Underwriting Year
Net incurred loss ratio at each development year
6
5
4
3
2
ULR
Development YearDevelopment Year
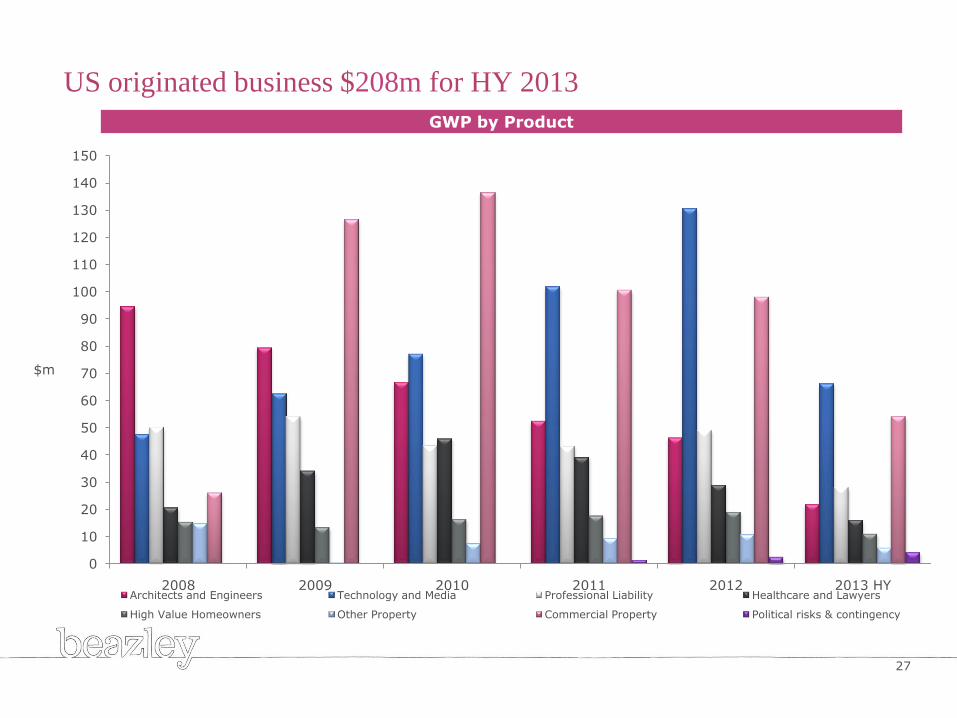
US originated business $208m for HY 2013
$m
27
GWP by Product
0
10
20
30
40
50
60
70
80
90
100
110
120
130
140
150
2008 2009 2010 2011 2012 2013 HYArchitects and Engineers Technology and Media Professional Liability Healthcare and Lawyers
High Value Homeowners Other Property Commercial Property Political risks & contingency
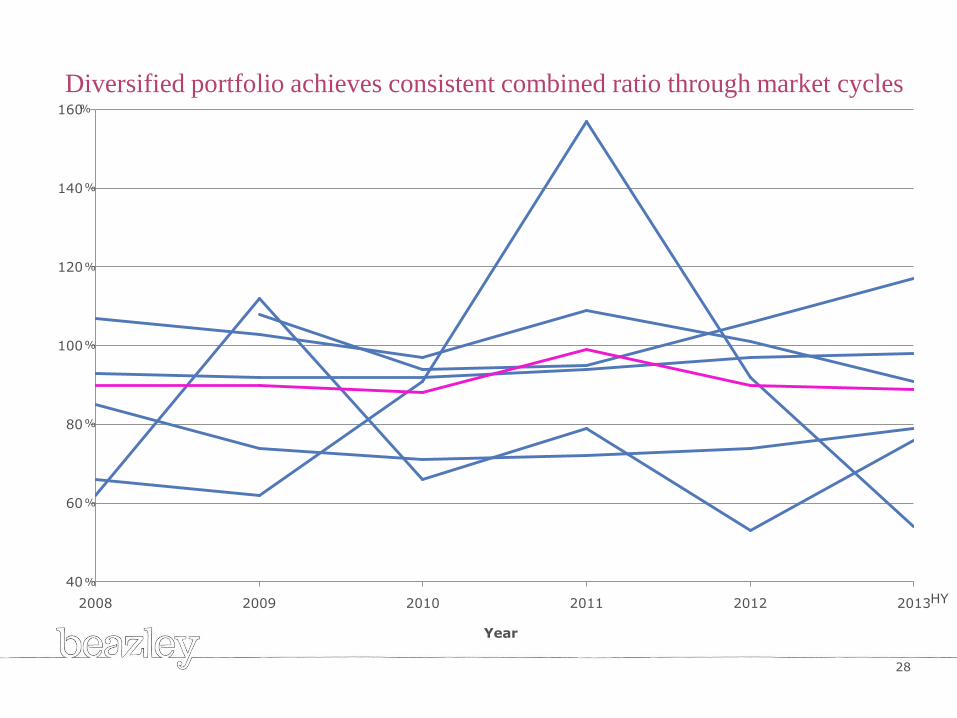
Diversified portfolio achieves consistent combined ratio through market cycles
28
40
60
80
100
120
140
160
2008 2009 2010 2011 2012 2013
Year
%
%
%
%
%
%
%
HY
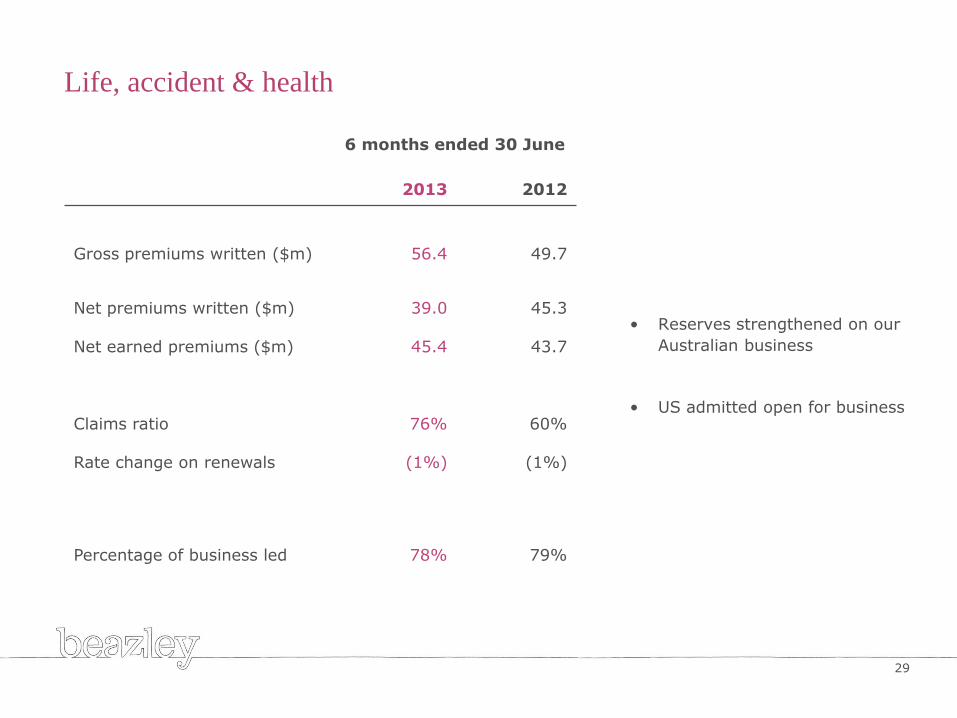
Life, accident & health
6 months ended 30 June
2013 2012
Gross premiums written ($m) 56.4 49.7
Net premiums written ($m) 39.0 45.3
Net earned premiums ($m) 45.4 43.7
Claims ratio 76% 60%
Rate change on renewals (1%) (1%)
Percentage of business led 78% 79%
29
• Reserves strengthened on our
Australian business
• US admitted open for business
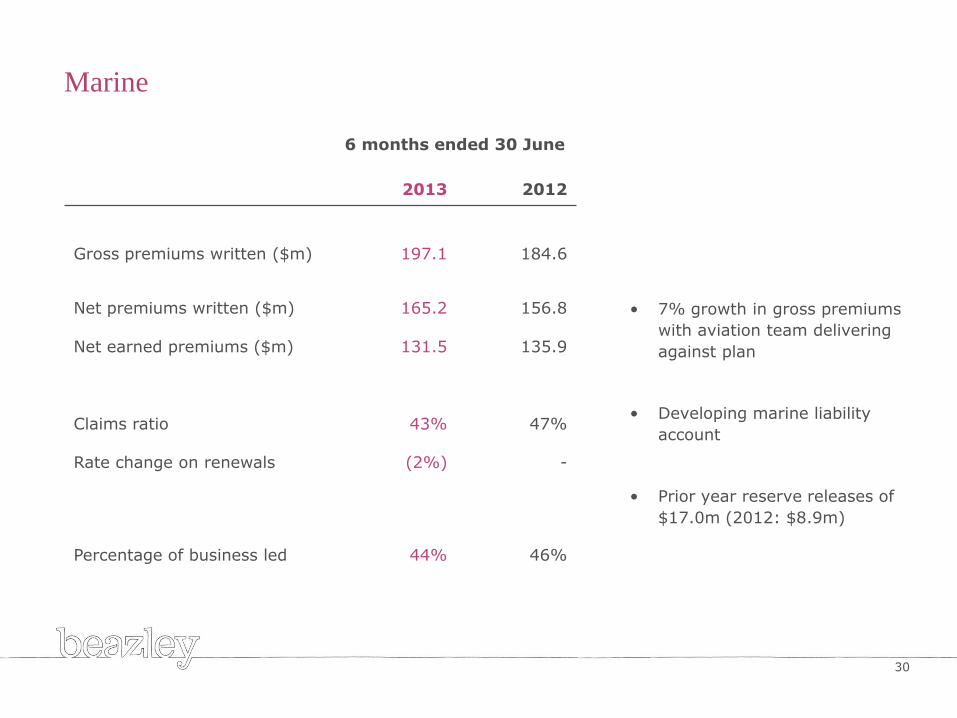
Marine
6 months ended 30 June
2013 2012
Gross premiums written ($m) 197.1 184.6
Net premiums written ($m) 165.2 156.8
Net earned premiums ($m) 131.5 135.9
Claims ratio 43% 47%
Rate change on renewals (2%) -
Percentage of business led 44% 46%
30
• 7% growth in gross premiums
with aviation team delivering
against plan
• Developing marine liability
account
• Prior year reserve releases of
$17.0m (2012: $8.9m)
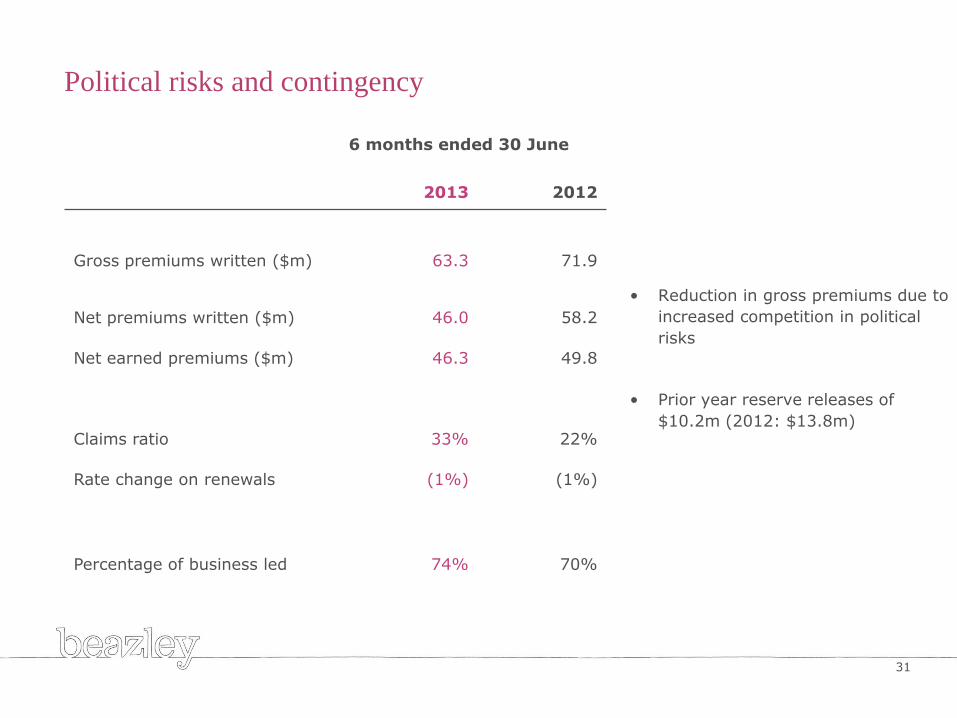
Political risks and contingency
• Reduction in gross premiums due to
increased competition in political
risks
• Prior year reserve releases of
$10.2m (2012: $13.8m)
6 months ended 30 June
2013 2012
Gross premiums written ($m) 63.3 71.9
Net premiums written ($m) 46.0 58.2
Net earned premiums ($m) 46.3 49.8
Claims ratio 33% 22%
Rate change on renewals (1%) (1%)
Percentage of business led 74% 70%
31
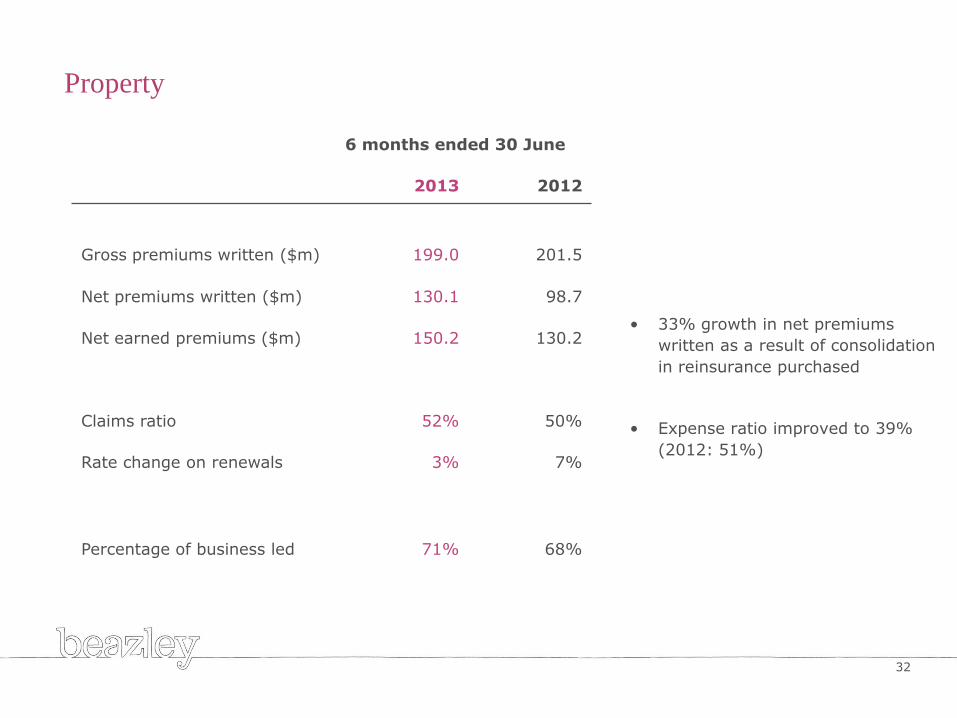
Property
• 33% growth in net premiums
written as a result of consolidation
in reinsurance purchased
• Expense ratio improved to 39%
(2012: 51%)
6 months ended 30 June
2013 2012
Gross premiums written ($m) 199.0 201.5
Net premiums written ($m) 130.1 98.7
Net earned premiums ($m) 150.2 130.2
Claims ratio 52% 50%
Rate change on renewals 3% 7%
Percentage of business led 71% 68%
32
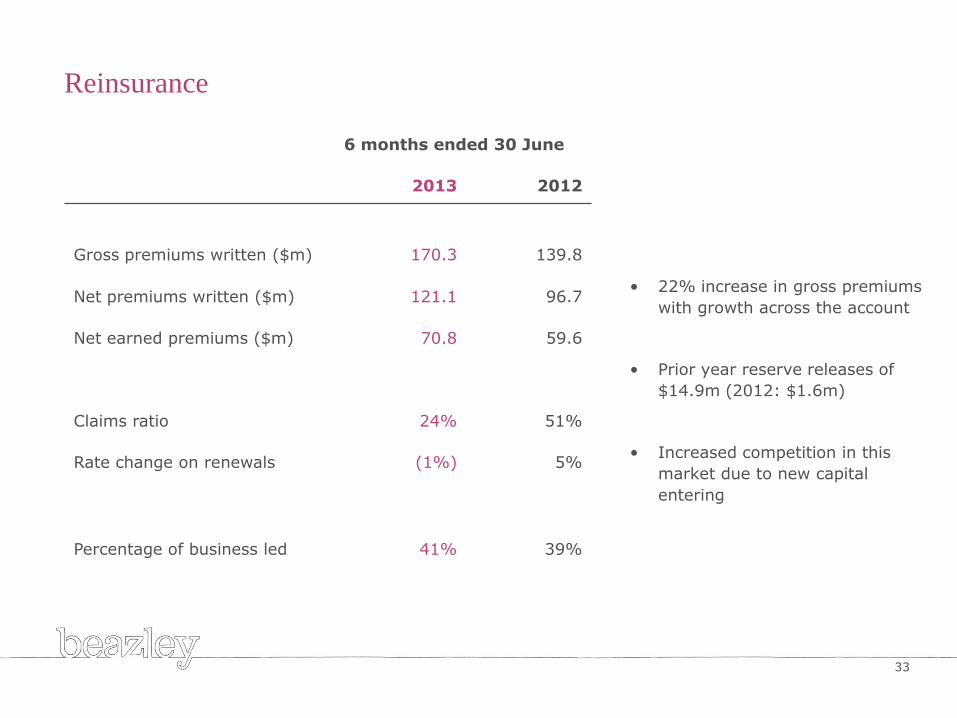
Reinsurance
• 22% increase in gross premiums
with growth across the account
• Prior year reserve releases of
$14.9m (2012: $1.6m)
• Increased competition in this
market due to new capital
entering
6 months ended 30 June
2013 2012
Gross premiums written ($m) 170.3 139.8
Net premiums written ($m) 121.1 96.7
Net earned premiums ($m) 70.8 59.6
Claims ratio 24% 51%
Rate change on renewals (1%) 5%
Percentage of business led 41% 39%
33
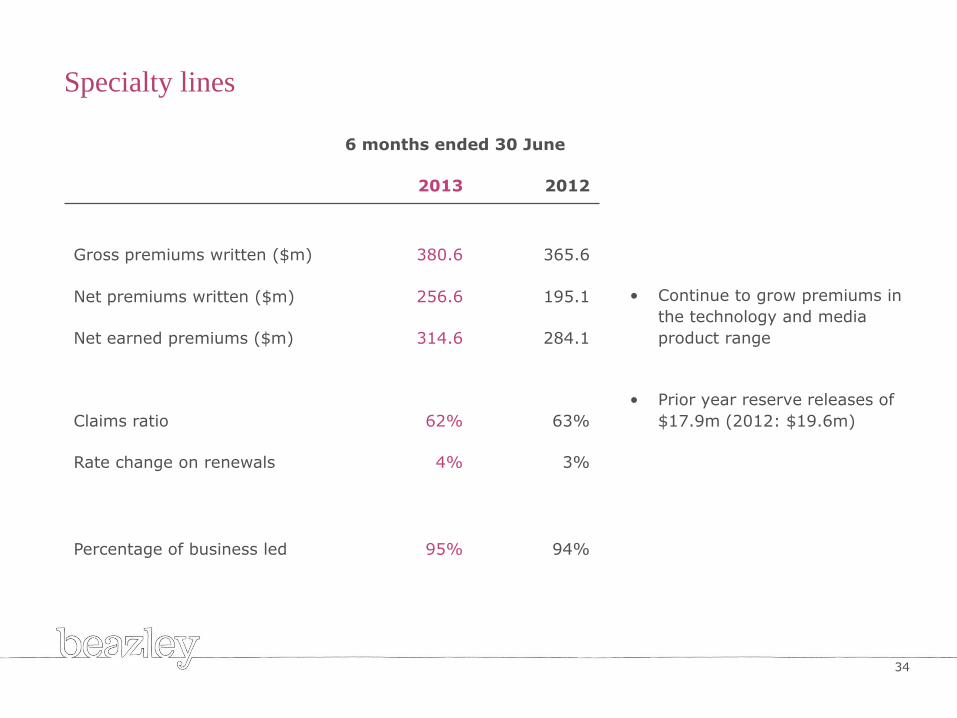
Specialty lines
• Continue to grow premiums in
the technology and media
product range
• Prior year reserve releases of
$17.9m (2012: $19.6m)
6 months ended 30 June
2013 2012
Gross premiums written ($m) 380.6 365.6
Net premiums written ($m) 256.6 195.1
Net earned premiums ($m) 314.6 284.1
Claims ratio 62% 63%
Rate change on renewals 4% 3%
Percentage of business led 95% 94%
34