Embed Size (px)
Citation preview

August 2015
About Credit Suisse – A brief presentation

Disclaimer
August 2015 2
Cautionary statement regarding forward-looking statements
This presentation contains forward-looking statements that involve inherent risks and uncertainties, and we might not be able to achieve the predictions, forecasts, projections and other outcomes we describe or imply in forward-looking statements. A number of important factors could cause results to differ materially from the plans, objectives, expectations, estimates and intentions we express in these forward-looking statements, including those we identify in
"Risk Factors" in our Annual Report on Form 20-F for the fiscal year ended December 31, 2014 and in "Cautionary statement regarding forward-looking information" in our second quarter financial report 2015 filed with the US Securities and Exchange Commission, and in other public filings and press
releases. We do not intend to update these forward-looking statements except as may be required by applicable law.
Statement regarding non-GAAP financial measures
This presentation also contains non-GAAP financial measures, including adjusted cost run-rates. Information needed to reconcile such non-GAAP financial measures to the most directly comparable measures under US GAAP can be found in the presentation to investors slides for the second quarter 2015, which is available on our website at credit-suisse.com.
Statement regarding capital, liquidity and leverage
As of January 1, 2013, Basel 3 was implemented in Switzerland along with the Swiss “Too Big to Fail” legislation and regulations thereunder. As of January 1, 2015, the Bank for International Settlements (BIS) leverage ratio framework, as issued by the Basel Committee on Banking Supervision (BCBS), was implemented in Switzerland by FINMA. Our related disclosures are in accordance with our interpretation of such requirements, including relevant assumptions. Changes in the interpretation of these requirements in Switzerland or in any of our assumptions or estimates could result in different numbers from those shown in this presentation. Capital and ratio numbers for periods prior to 2013 are based on estimates, which are calculated as if the Basel 3 framework had been in place in Switzerland during such periods.
Unless otherwise noted, leverage exposure is based on the BIS leverage ratio framework and consists of period-end balance sheet assets and prescribed regulatory adjustments. Leverage amounts for 4Q14, which are presented in order to show meaningful comparative information, are based on estimates which
are calculated as if the BIS leverage ratio framework had been implemented in Switzerland at such time. Beginning in 2015, the Swiss leverage ratio is calculated as Swiss total capital, divided by period-end leverage exposure. The look-through BIS tier 1 leverage ratio and CET1 leverage ratio are calculated as look-through BIS tier 1 capital and CET1 capital, respectively, divided by end-period leverage exposure. Leverage exposure target assumes constant USD/CHF and EUR/CHF exchange rates equal to those at the end of 2Q15.
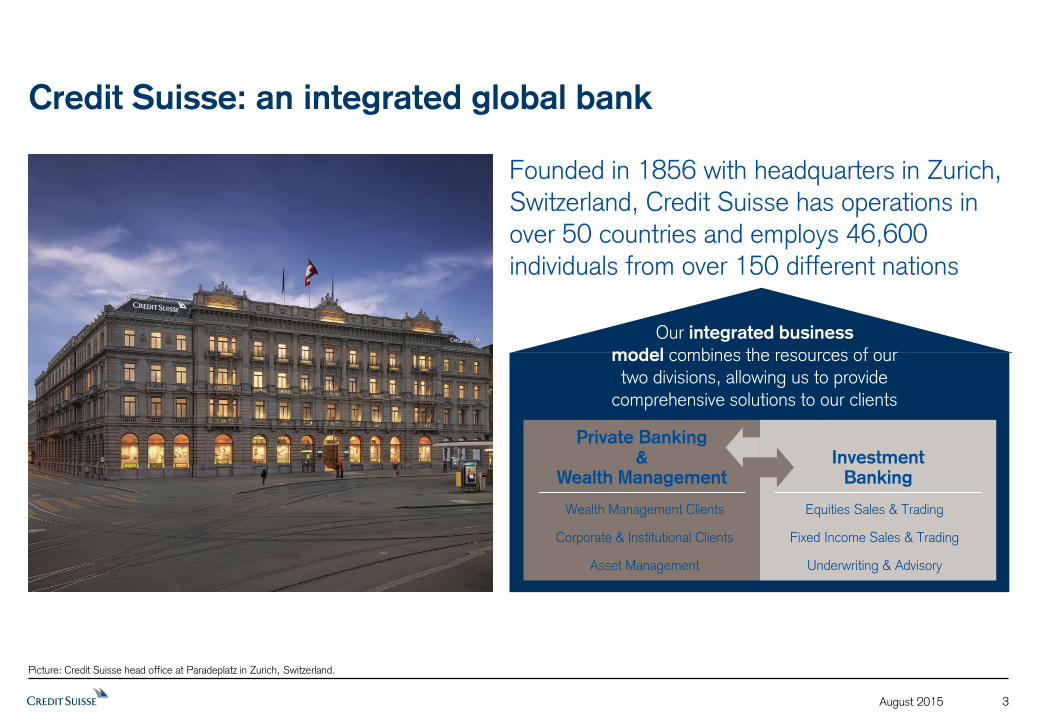
Credit Suisse: an integrated global bank
August 2015 3
Founded in 1856 with headquarters in Zurich, Switzerland, Credit Suisse has operations in over 50 countries and employs 46,600 individuals from over 150 different nations
Our integrated business
model combines the resources of our two divisions, allowing us to provide
comprehensive solutions to our clients
Picture: Credit Suisse head office at Paradeplatz in Zurich, Switzerland.
Private Banking &
Wealth Management
Investment
Banking
Equities Sales & Trading
Fixed Income Sales & Trading
Underwriting & Advisory
Wealth Management Clients
Corporate & Institutional Clients
Asset Management

Sound capital foundation and capital ratios (on a look-through basis)
Solid financial performance and
strong asset gathering momentum1
A balanced business portfolio4
Net revenues
Credit Suisse Group: facts & figures
August 2015 4
CET1 = Common equity tier 1. RWA = Risk-weighted assets. 1 Core results. 2 In 4Q13, we created non-strategic units within the Private Banking & Wealth Management and Investment Banking divisions and separated non-strategic items in the Corporate Center. For further information, see our 2014 annual report. 3 Return on equity for strategic results calculated by dividing annualized strategic net income by average strategic shareholders' equity (derived by deducting 10% of non-strategic RWA from reported shareholders’ equity). 4 Reported Core results, excluding Corporate Center. 5 Full-time equivalents. 6 Relate to senior unsecured debt and are subject to change without notice. Latest rating action on June 9, 2015.
Strategic results2 in CHF bn (in/end of) 6M15 2014 2013 2012
Net revenues 13.3 25.1 25.5 25.4
Pre-tax income 3.6 6.8 7.2 6.3
Return on equity3 13% 12% 13% not
applicable
Total reported results in CHF bn
Net revenues 13.6 25.8 25.2 23.3
Pre-tax income 3.2 3.2 3.5 1.9
Net income att. to shareholders 2.1 1.9 2.3 1.3
Net new assets 31.2 28.2 32.1 10.8
Assets under management 1,356 1,377 1,282 1,251
Private Banking &
Wealth Management
Investment Banking
Switzerland
Americas
EMEA
Asia Pacific
22%
35%
27%
16% 6M15
Number of employees5 end 2Q15
19,800
26,500 Private Banking &
Wealth Management
Investment Banking
46,600 Corporate Center
300
Basel 3 total eligible capital in CHF bn 45.9 46.9 40.2 not
applicable
Basel 3 CET1 ratio in % 10.3 10.1 10.0 8.0
Swiss leverage ratio in % 4.3 4.1 not
applicable
not
applicable
53%
47%
6M15
Strong senior credit ratings6 Credit Suisse AG (the Bank)
Short- Long- term term Outlook
Moody’s P-1 A1
S&P A-1 A
Fitch Ratings F1 A
Stable
Stable
Stable

August 2015 5
CHF
1,346 bn
Assets under management1 as of end 2Q15
Assets under management in WMC business, as of end 2Q15
221
278
1,660 1,010 540 520
Number of relationship managers within WMC business, as of end 2Q15
Private Banking & Wealth Management
Switzerland Americas
EMEA
Asia
Pacific
Total
3,730
Wealth Management
Clients
Asset Management
Corporate &
Institutional Clients
Rounding differences may occur. WMC = Wealth Management Clients. EMEA = Europe, Middle East and Africa. UHNWI = Ultra-high-net-worth individuals: total wealth > CHF 250 mn or AuM > CHF 50 mn. 1 Strategic assets under management. Assumes assets managed across businesses relate to strategic businesses only.
Strategic results in CHF bn (in/end of) 6M15 2014 2013 2012
Net revenues 6.1 12.1 12.4 12.3
Pre-tax income 1.9 3.7 3.6 3.4
Cost/income ratio 67% 68% 70% 72%
Products & services
We offer comprehensive advice and a broad range of
financial solutions to private, corporate and
institutional clients
Clients
We advise and manage portfolios, mutual funds and
other investment vehicles for private clients,
corporates, institutions and governments
Strategy
Deliver tailor-made and best-in-
class financial solutions, building on
our structured advisory process
Further increase market share in
Switzerland across client segments
Reallocate resources and capital to
capture growth, particularly in
emerging markets and UHNWI
segment
Reposition select onshore mature
markets and further grow select
profitable onshore businesses
33%
22%
18%
CHF
848 bn
27%
848
Net new assets in WMC business
(from 2011 through end 2Q15)
11% 51%
15%
CHF
118 bn
23%
Wealth
Management
Clients
Corporate &
Institutional
Clients
Asset
Management
Strategic businesses
Switzerland
Americas
EMEA
Asia Pacific
Switzerland
Americas
EMEA
Asia Pacific

August 2015 6
Investment Banking
Strategic results in CHF bn (in/end of) 6M15 2014 2013 2012
Net revenues 7.2 13.1 13.1 13.3
Pre-tax income 2.0 3.7 3.9 3.5
Cost/income ratio 72% 71% 70% 74%
Return on regulatory capital1 17% 17% 17% -
Strategy
Focusing on client-driven and
capital-efficient businesses
Continue transformation of Fixed
Income business to achieve
strong and sustainable returns
Maintain market-leading and
highly scalable Equities franchise
Continue to win significant
mandates/gain wallet share in
underwriting and M&A
Enhanced efficiency through
substantial cost reductions
1 Return on regulatory capital is calculated using income after tax denominated in USD and assumes tax rates of 30% in 2Q15, 1Q15 and 2014, 28% in 2013 and 25% in 2012 and capital allocated based on average of 10% of average risk-weighted assets and 3% of average leverage exposure for 2Q15 and 1Q15 and 2.4% of average leverage exposure for periods prior to 2015. 2 2011 and 2012 risk-weighted assets are presented to show meaningful comparative information and based on estimates, which are calculated as if the Basel 3 framework had been in place in Switzerland during such periods. 3 Figures reflect risk-weighted assets transfer from Investment Banking to Private Banking & Wealth Management.
Strategic net revenue details in CHF bn
13.3 13.1
Debt and equity underwriting, advisory & other fees
Fixed income sales and trading
Equity sales and trading
46% 40%
32%
37%
24% 25%
Other revenues
324
167
2Q 3Q 4Q 1Q 2Q 3Q 4Q 1Q 2Q 3Q 4Q 1Q 2Q 3Q 4Q 1Q 2Q
(48)%
Basel 3 risk-weighted assets in USD bn
(including non-strategic unit)
20112 20122 20133
Products & services
Our suite of products and services includes global
securities sales, trading and execution, prime
brokerage and capital raising and advisory services,
as well as comprehensive investment research
Clients
Corporations, governments, institutional investors,
including hedge funds, and private individuals
Integrated model
Work closely with Private Banking & Wealth
Management to provide clients with customized
financial solutions
2012 2013
(2)% (2)%
6M15
7.2
44%
37%
21%
(2)%
20143
2014
13.1
42%
35%
26%
(3)%
2015

August 2015 7
Centers of Excellence (CoEs) Our Centers of Excellence support our operations and are essential in the implementation of our strategy. Wroclaw in Poland, Mumbai and Pune in India and Raleigh-Durham in the US are home to our CoEs. At year-end 2014, they accounted for 17% of our global workforce.
With our local presence and global approach, we are well-positioned to respond to changing
client needs and market trends, while coordinating our activities on a cross-divisional basis
Switzerland
Europe, Middle
East and Africa
204 branches
Americas
Asia Pacific
All information for or as of year-end 2014, as applicable, unless noted otherwise. UHNWI = Ultra-high-net-worth individuals: total wealth > CHF 250 mn or AuM > CHF 50 mn. 1 In Swiss Francs. Reported Core results, excluding Corporate Center.
51 offices
42 offices
25 offices
37%
22%
24%
17%
6.8 bn
5.7 bn
9.5 bn
3.2 bn
27%
22%
38%
13%
Employees Pre-tax income1 Net revenues1
2.3 bn
0.4 bn
0.4 bn
0.9 bn
60%
9%
9%
22%
17,100
9,900
10,900
7,900

Credit Suisse1 key performance indicators (KPIs)
Key performance indicators
August 2015 8
1 Core results. 2 Source: Bloomberg. Total shareholder return (TSR) is calculated as equal to the appreciation or depreciation of a particular share, plus any dividends, over a given period, expressed as a percentage of the share’s value at the beginning of the period. 3 Comprises Bank of America, Barclays, BNP Paribas, Citigroup, Deutsche Bank, Goldman Sachs, HSBC, JPMorgan Chase, Morgan Stanley, Nomura, Société Générale and UBS. The total shareholder return of this peer group is calculated as a simple, unweighted average of the return reported by Bloomberg for each of the members of the peer group. 4 Includes the previously announced CHF 1,618 mn charge relating to the final settlement of all outstanding US cross-border matters. 5 Long-term net new asset growth target. 6 2013 through 2015 net new assets growth target. 7 Includes outflows from a single low margin mandate in 2012. 8 Includes outflows relating to the change of management of funds from Hedging Griffo to a new venture in Brazil, Verde Asset Management, in which we have a significant investment.
Target 6M15 2014 2013 2012
Collaboration revenues
18% to 20%
of net revenues 15% 17% 18% 19%
Target superior TSR2 vs. peers
Credit Suisse 5% (6)% 26% 5%
Peer group3 10% (1)% 34% 53%
Return on equity above 15% 10% 4% 6% 4%
Cost/income ratio below 70% 76% 87%4 85% 91%
Look-through CET1 ratio 11% 10.3% 10.1% 10.0% -
Our KPIs are targets to be achieved over a three to five year period across market cycles.
Our KPIs are assessed annually
as part of our normal planning process and may be revised to reflect our strategic plan, the regulatory environment and market and industry trends.
Divisional and operational businesses KPIs
Cost/income ratio
Private Banking & Wealth
Management
3% 3% 4%
4%
2012 2013 2014 6M15
6%5
Asset Management
(3%)
5%
1%
10%
2012 2013 2014 6M15
6%
Net new assets growth rate
Wealth Management Clients
Investment Banking
74% 70% 71% 72%
2012 2013 2014 6M15
70%
target
7
3% to
4%6
84% 86% 85%
Strategic
70% 68% 67%
2012 2013 2014 6M15
65%
71% 75% 83%4
Strategic
8
70%
78%
August 2015 9
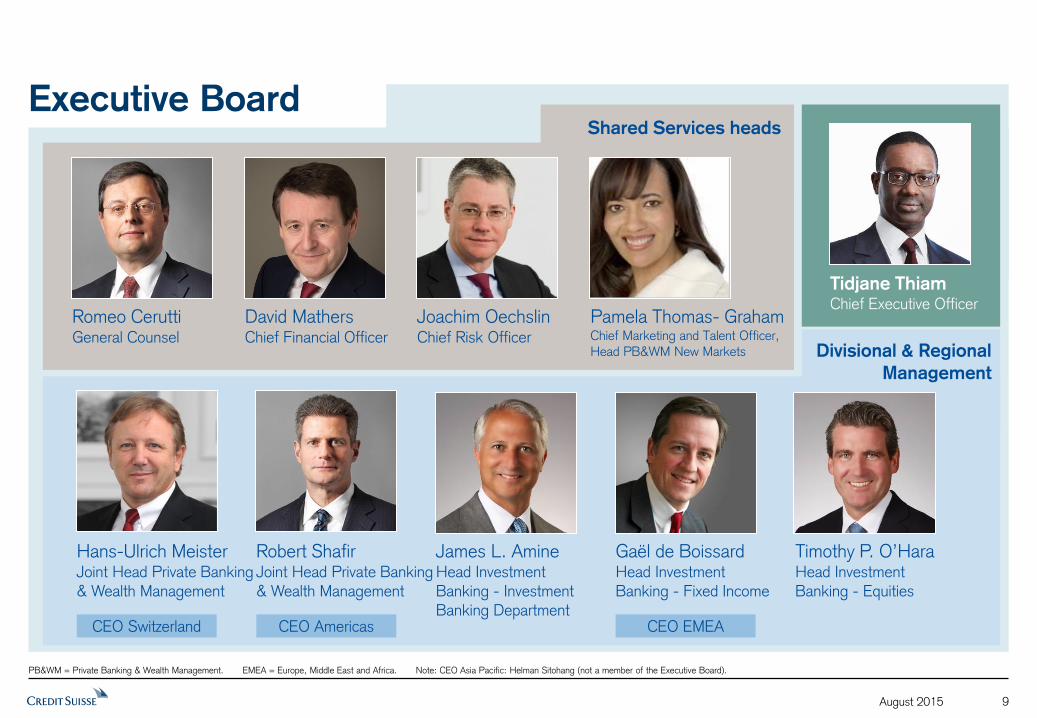
PB&WM = Private Banking & Wealth Management. EMEA = Europe, Middle East and Africa. Note: CEO Asia Pacific: Helman Sitohang (not a member of the Executive Board).
Executive Board
Tidjane Thiam
Chief Executive Officer
Divisional & Regional
Management
James L. Amine Head Investment
Banking - Investment Banking Department
Robert Shafir Joint Head Private Banking
& Wealth Management
Hans-Ulrich Meister Joint Head Private Banking
& Wealth Management
Gaël de Boissard Head Investment
Banking - Fixed Income
CEO Switzerland
David Mathers Chief Financial Officer
Pamela Thomas- Graham Chief Marketing and Talent Officer,
Head PB&WM New Markets
Romeo Cerutti General Counsel
Joachim Oechslin Chief Risk Officer
Shared Services heads
Timothy P. O’Hara Head Investment
Banking - Equities
CEO Americas CEO EMEA

August 2015 10
Urs Rohner Chairman,
Chairman of the Chairman's
and Governance Committee
Jassim Bin Hamad J.J. Al Thani
Chairman’s and Governance Committee Audit Committee Compensation Committee Risk Committee
Iris Bohnet
Seraina Maag
Jean Lanier Chairman
Compensation
Committee
Kai S. Nargolwala
Severin Schwan
John Tiner Chairman Audit
Committee
Noreen Doyle Vice-Chair and Lead
Independent Director
Andreas N. Koopmann
Members of the:
Richard E. Thornburgh Vice-Chair and
Chairman Risk
Committee
Sebastian Thrun
Board of Directors
August 2015 11
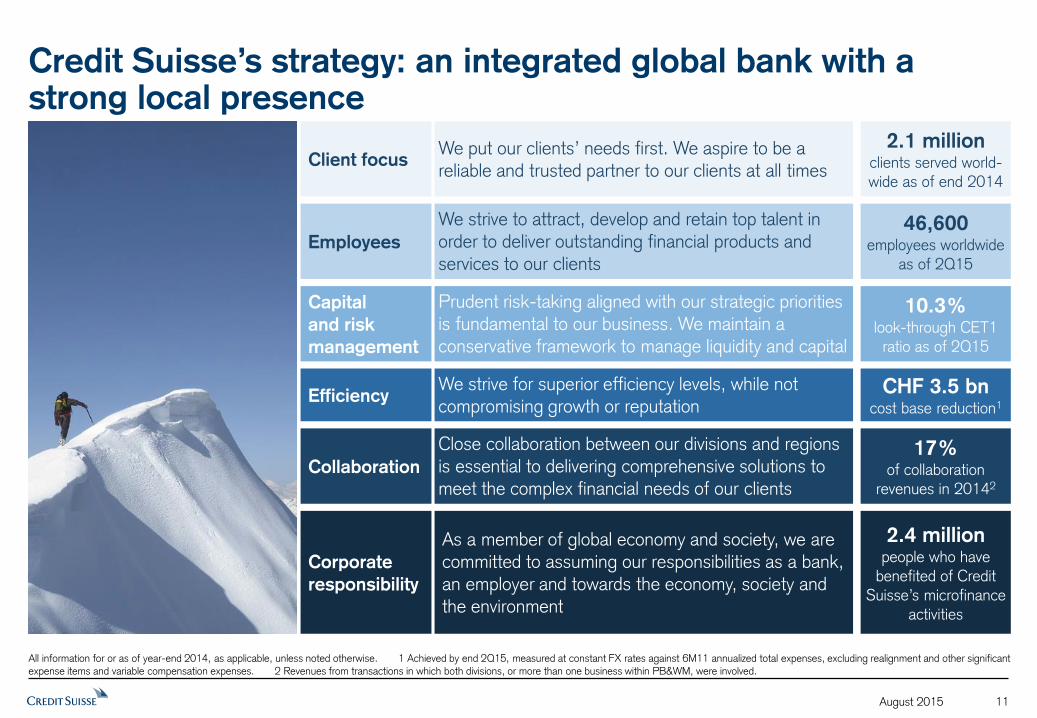
Credit Suisse’s strategy: an integrated global bank with a strong local presence
Client focus We put our clients’ needs first. We aspire to be a reliable and trusted partner to our clients at all times
Employees
We strive to attract, develop and retain top talent in order to deliver outstanding financial products and services to our clients
Capital
and risk
management
Prudent risk-taking aligned with our strategic priorities is fundamental to our business. We maintain a conservative framework to manage liquidity and capital
Efficiency We strive for superior efficiency levels, while not compromising growth or reputation
Corporate
responsibility
As a member of global economy and society, we are committed to assuming our responsibilities as a bank, an employer and towards the economy, society and the environment
2.1 million clients served world-wide as of end 2014
46,600 employees worldwide
as of 2Q15
10.3% look-through CET1 ratio as of 2Q15
CHF 3.5 bn cost base reduction1
All information for or as of year-end 2014, as applicable, unless noted otherwise. 1 Achieved by end 2Q15, measured at constant FX rates against 6M11 annualized total expenses, excluding realignment and other significant expense items and variable compensation expenses. 2 Revenues from transactions in which both divisions, or more than one business within PB&WM, were involved.
Collaboration
Close collaboration between our divisions and regions is essential to delivering comprehensive solutions to meet the complex financial needs of our clients
17% of collaboration
revenues in 20142
2.4 million people who have
benefited of Credit Suisse’s microfinance
activities

Responsibility
in Banking
Corporate Responsibility at Credit Suisse: our responsible approach
to business is a key factor in determining our long-term success
August 2015 12
All information for or as of year-end 2014, as applicable, unless noted otherwise.
transactions or client relationships were assessed for potential environmental
and social risks
Business Conduct Behaviors
were introduced to guide our employees in
their daily work and to help reduce the
potential for operational or conduct losses
is our volume of assets under management with high social and environmental benefits
571 10 CHF 8,974 mn
Responsibility
in Economy
and Society is Credit Suisse’s volume of
loans outstanding in Switzerland
hours were dedicated to skills-based voluntary work by our
employees
is the value of goods, services and licenses purchased from
suppliers globally
around CHF 156 bn 73,468 over CHF 6 bn
Responsibility
as an
Employer
of all vacancies were filled through internal appointments
individuals from over 150 different nations work at Credit
Suisse
young talents are taking part in our training programs in
Switzerland
42% 45,800 1,200
Responsibility
for the
Environment
gigawatt-hours of energy were saved globally as a result of increasing our
server virtualization rate to 60% worldwide over the past 4 years
hours of video conferencing were used as an alternative to
business travel, helping to reduce our CO2 emissions
employees were trained in environmental management
49 173,362 1,084

Credit Suisse with a diverse international shareholder base
August 2015
1 Through July 22, 2015. 2 One American Depositary Share represents one common share. 3 Share ownership of at least 3% as per latest available notification to the SIX Swiss Exchange. 4 Harris Associates L.P.’s position includes the reportable position (4.21% shareholding) of Harris Associates Investment Trust, which is managed by Harris Associates L.P., as published by the SIX on November 26, 2014. 5 Dodge & Cox’s position includes the reportable position (3.03% shareholding) of Dodge & Cox International Stock Fund, which is managed by Dodge & Cox, as published by the SIX on June 11, 2014. 6 Source: IPREO.
13
Shareholder base6 as of end 1Q15
Switzerland
North America
Europe
Other (predominantly Middle East)
14%
10%
16%
48%
9%
83%
8%
Institutional investors
Private investors
Other investors
United Kingdom & Ireland
12%
Credit Suisse shares are listed on the SIX Swiss Exchange and on the New York Stock Exchange in the form of American Depositary Shares2
Since January 1, 2009 Credit Suisse shares outperformed the EURO STOXX Banks index by 20 percentage points
Olayan Group 6.7%
Qatar Holding LLC 5.2%
Harris Associates L.P.4 5.2%
Norges Bank 5.0%
Dodge & Cox5 5.0%
Franklin Resources Inc. 4.2%
BlackRock, Inc. 3.0%
Capital Group Companies, Inc. 3.0%
Share ownership
Significant shareholders3
0
10
20
30
40
50
60
70
Jan. 2009 Jan. 2010 Jan. 2011 Jan. 2012 Jan. 2013 Jan. 2014 Jan. 2015
EURO STOXX Banks index (rebased as of January 1, 2009)
Credit Suisse (CSGN VX)
Share price development from 2009 through 20151 in CHF