Embed Size (px)
Citation preview

DEMOGRAPHIC FEATURES OF INDIA
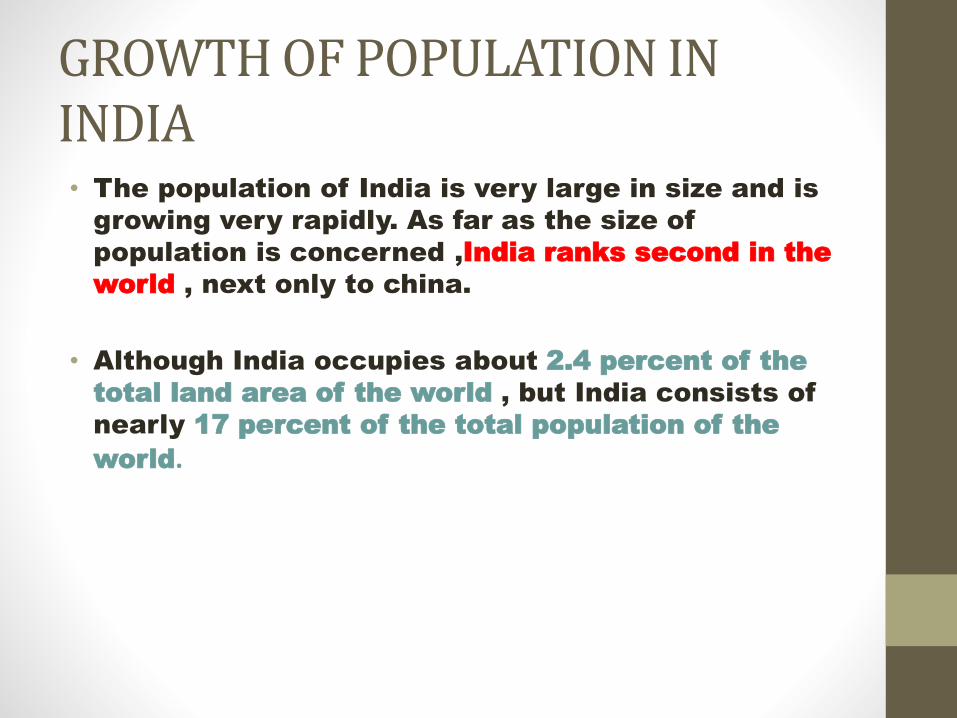
GROWTH OF POPULATION IN INDIA• The population of India is very large in size and is
growing very rapidly. As far as the size of
population is concerned ,India ranks second in the
world , next only to china.
• Although India occupies about 2.4 percent of the
total land area of the world , but India consists of
nearly 17 percent of the total population of the
world.
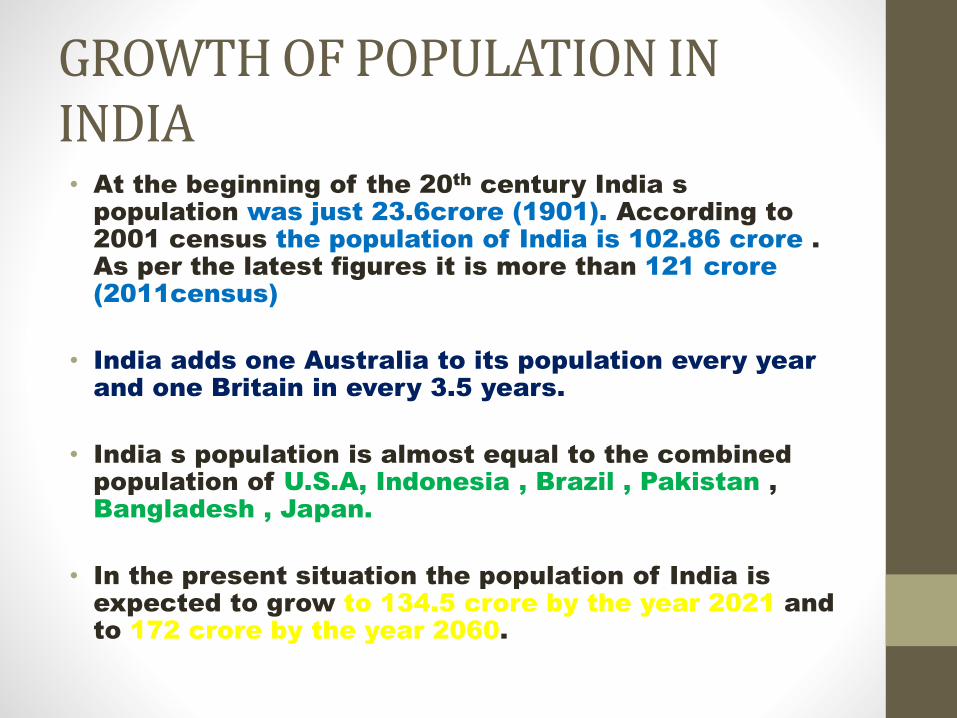
GROWTH OF POPULATION IN INDIA• At the beginning of the 20
thcentury India s
population was just 23.6crore (1901). According to
2001 census the population of India is 102.86 crore .
As per the latest figures it is more than 121 crore
(2011census)
• India adds one Australia to its population every year
and one Britain in every 3.5 years.
• India s population is almost equal to the combined
population of U.S.A, Indonesia , Brazil , Pakistan ,
Bangladesh , Japan.
• In the present situation the population of India is
expected to grow to 134.5 crore by the year 2021 and
to 172 crore by the year 2060.
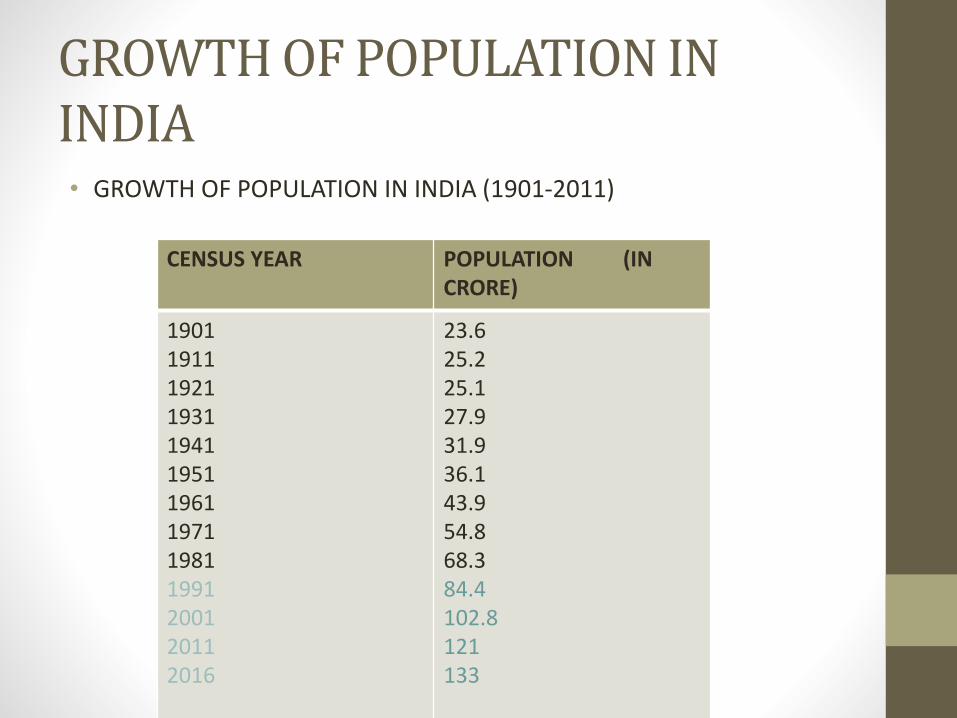
GROWTH OF POPULATION IN INDIA• GROWTH OF POPULATION IN INDIA (1901-2011)
CENSUS YEAR POPULATION (IN CRORE)
1901191119211931194119511961197119811991200120112016
23.625.225.127.931.936.143.954.868.384.4102.8121133

COMPOSITION OF INDIA ,S POPULATIONThe composition of population of a country reveals
some truths about
1.AGE STRUCTURE
2.SEX-RATIO
3.RURAL-URBAN DISTRIBUTION
4.DENSITY OF POPULATION
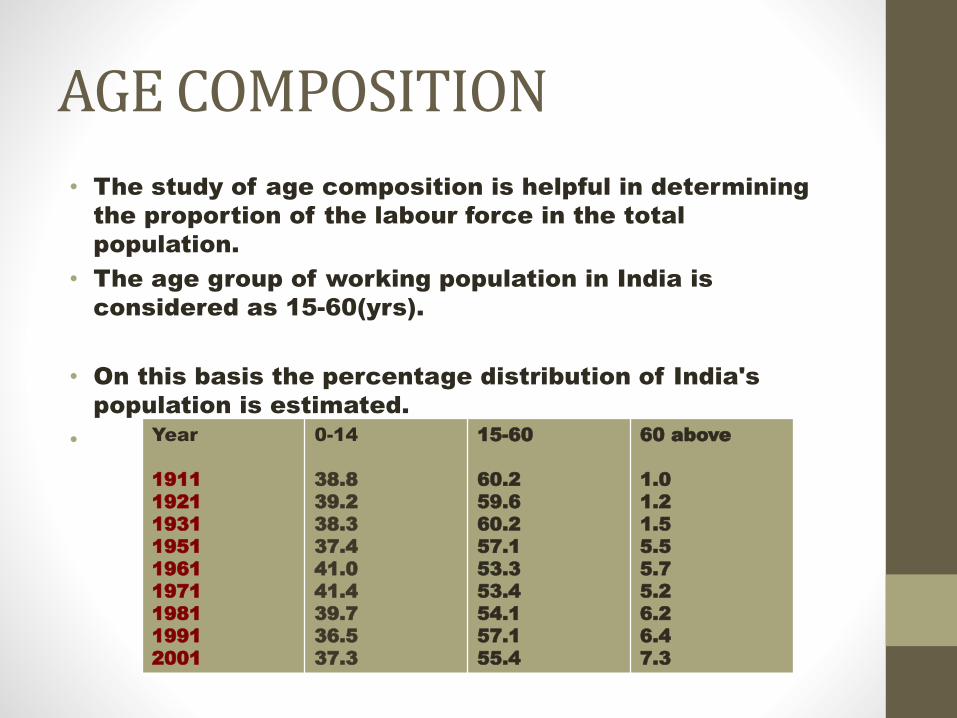
AGE COMPOSITION
• The study of age composition is helpful in determining
the proportion of the labour force in the total
population.
• The age group of working population in India is
considered as 15-60(yrs).
• On this basis the percentage distribution of India's
population is estimated.
• age groupYear
1911
1921
1931
1951
1961
1971
1981
1991
2001
0-14
38.8
39.2
38.3
37.4
41.0
41.4
39.7
36.5
37.3
15-60
60.2
59.6
60.2
57.1
53.3
53.4
54.1
57.1
55.4
60 above
1.0
1.2
1.5
5.5
5.7
5.2
6.2
6.4
7.3

AGE COMPOSITION
• The two important points can be noted in regard
to the age composition of India's population. They
are
• 1.india is a young nation in the literal sense of the
term. More than half the India's population
consists of young people.
• 2.The age distribution indicates that every one
person, on an average has to earn for himself and
for one dependent also. this is because the
dependency ratio is high in India.

SEX COMPOSITION
Sex ratio is a powerful indicator of the social health of any
society conveys a great deal about the state of gender
relations.
Sex ratio refers to the number of females per thousand males.
the sex ratio composition gives the ratio of women to men in
the total population and reflects the relative chances of
survival of women.
The sex ratio in India is against to female population .in fact
two significant things can be observed in the sex distribution
of population in India .they are
1.There is a higher ratio of males in the population
2.There is a rising tendency towards masculinity.
the proportion of females per 1000 males has fallen from 972 in
1901 to 933 in 2001 and 940 in 2011.
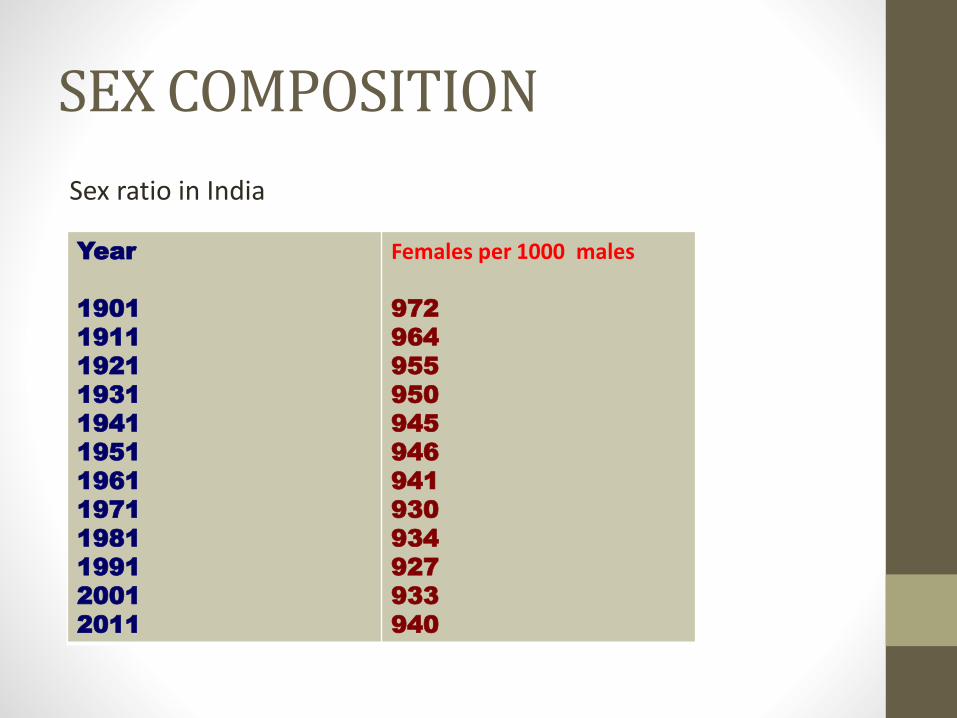
SEX COMPOSITION
Sex ratio in India
Year
1901
1911
1921
1931
1941
1951
1961
1971
1981
1991
2001
2011
Females per 1000 males
972
964
955
950
945
946
941
930
934
927
933
940
SEX COMPOSITION
• Over all trend is that sex ratio in India is the lowest in
the world and is a reflection of the gender disparity.
This continuo's decline in sex ratio in the country is
mainly due to:
• 1.Female selective termination of pregnancy.
• 2.Increase in the proportion of male selective migrants
from other countries.
• 3.Reduction in foetal wastage resulting in a decline in
female-male ratio at birth .
• 4.Increased discrimination of females in providing the
minimum nutrition's access to health and other
amenities
• 5.Passion for male child etc .
SEX COMPOSITION
. Among the various states of India, Kerala and
Pondicherry recorded a higher proportion of females i.e.
1,084 and 1,038 respectively in 2011 per 1000 males.
. In the states like Andhra Pradesh , Tamil Nadu , Orissa
,Karnataka , the number of females per 1000 males is
comparatively higher than that of all India ratio.
. States which have recorded a lower ration than the
national average include 1. Rajasthan 2. Bihar 3. Uttar
Pradesh 4. Haryana and 5. Assam .

SEX RATIO IN MAJOR STATES OF INDIA
STATE
KERALA
HIMACHAL
PRADESH
ANDHARA
PRADESH
TAMILNADU
ORISSA
KARNATAKA
MAHARASTRA
GUJARAT
ASSAM
WEST BENGAL
RAJASTHAN
BIHAR
PUNJAB
UTTARA
PRADESH
HARAYANA
1931
1022
897
987
1021
1067
965
947
945
874
890
907
994
815
904
844
1961
1022
938
981
992
1001
959
936
940
869
878
908
994
854
909
868
1991
1040
996
972
972
972
960
936
936
925
917
913
912
888
882
874
2001
1058
970
978
986
972
964
922
921
932
934
922
921
874
898
861
2011
1084
974
992
995
978
968
925
918
954
947
926
916
893
908
877

RURAL-URBAN COMPOSITION• The rural urban composition of India's population
reflects on the pattern of living of country's population.
• As a matter of fact, the ratio of rural-urban population of
a country. As the industries get momentum , ratio of
urban population go on increasing. As India is
predominantly agricultural country ,ratio of urban
population is less as compared to rural population.
• Relative growth of rural and urban population
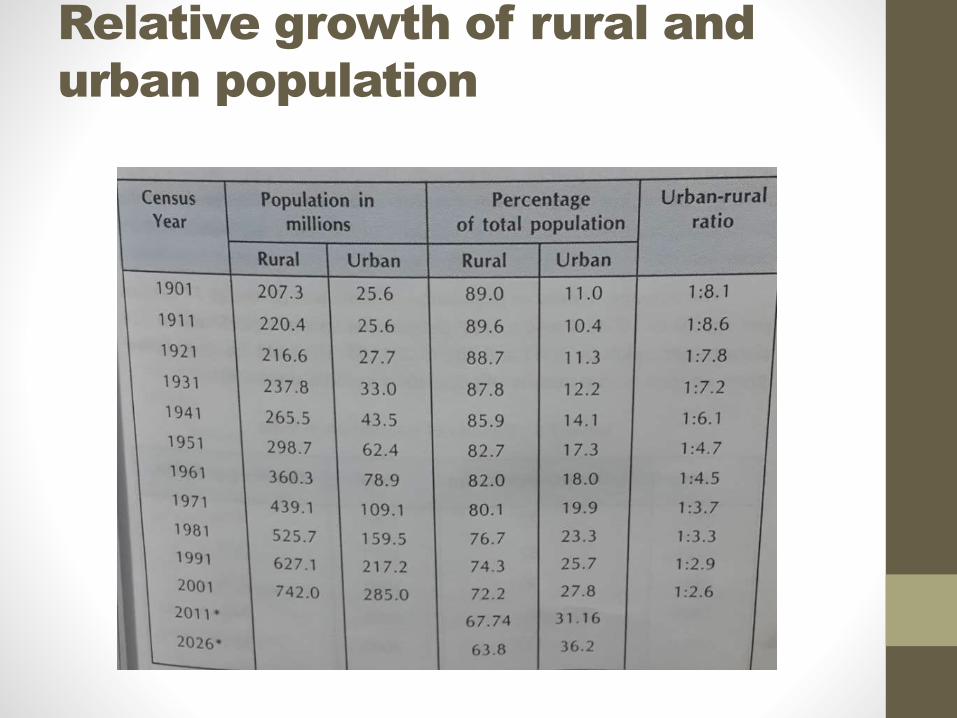
Relative growth of rural and
urban population

Density of population
• The term density of population implies the average number
of persons living per square km.
• In the other words density of population refers to the
average number of persons living per square km of area
within the territory of the country.
• Density of population = total population
------------------------------------
total area
.Density of population is considered as one of the important
demographic features of the population of a country.
. It helps to determine the magnitude of the burden that land
is being called upon to carry and determine the future
potential growth.

Density of population
YEAR DENSITY PER
SQ.KM
YEAR DENSITY PER
SQ.KM
1901 77 1961 142
1921 81 1971 177
1931 90 1981 216
1941 103 1991 278
1951 117 2001 324

Density of population