Embed Size (px)
Citation preview

2007a n n u a l r e p o r t

We experienced a challenging year at Dillard’s in 2007. Following a record-breaking performance in 2006,we were optimistic that we would deliver continued notable improvement in 2007. We simply did not achieve the level of sales necessary to make that happen.We did, however, underscore our commitment toour shareholders during the year by repurchasing $111.6 million of Class A Common Stock and closing nine under-performing stores. At the same time, we worked to maintain appropriate control over inventory levels and expenses, as the year progressed with increasingly sluggish macroeconomic conditions.
It is relatively easy for a retailer to cite challenging macroeconomic factors in a time of poor operational performance. The more diffi cult task lies in self-assessment and in moving forward with a clear visionfor improvement. At Dillard’s, we must be great atwhat we do in all circumstances.
Moving ahead, we will work to set Dillard’s apart inthe marketplace by executing further improvements toour merchandise mix. We believe strengthening our appeal to aspirational and contemporary shoppers will redefi ne Dillard’s as a revered national brand with a completely new attitude. Accordingly, we will seek tobuild and nurture solid relationships with vendors who offer upscale, highly regarded product while working to fi nd that next hot brand. We will support this endeavor with our ‘Dillard’s – The Style of Your Life.” branding campaign to share the fashion excitement and educate consumers about the bold new look of Dillard’s.
Additionally, we will work to respond faster to replenishing top-selling product, while utilizing our information systems and distribution network to better match in-stock merchandise with high demand location by location.
Clearly, at Dillard’s, our success lies primarily in effective execution of our merchandising initiatives. However, we must improve our fi nancial position, as well, by taking appropriate steps with under-performing stores and facilities as we did in 2007. To date in 2008, we have announced six such store closures. We will continueto evaluate our store base in 2008, aggressively addressing under-performing stores and facilitieswhere appropriate.
We completed our $200 million share repurchase program in the fall of 2007 with the purchase of $111.6 million of Class A Common Stock. Immediately,our board of directors approved another $200 million authorization. In 2008, we will actively seek out opportunities to repurchase shares as conditions permit.
Regardless of the changes and challenges around us,our mission remains to provide each and every person who visits Dillard’s the best customer care anywhere. Our customers demand a compelling assortment of fashion complemented by exceptional customer service and presented in an attractive store. Accordingly, in 2007 we opened nine new stores in some of the nation’s most vibrant communities and in exciting centers where customers live, work and shop. To date in 2008, we have opened fi ve such locations with four on the horizon for the fall. We were also very pleased to have recently opened a brand new store in Biloxi, Mississippi replacing a store that was devastated by Hurricane Katrina in 2005.
In early 2008, we reached our 70th year anniversary of serving America’s communities with inspiring fashion and extraordinary value. Refl ection and celebration of this legacy is impossible without thanking our shareholders and associates for their noteworthy contributions to this effort. We look forward to a productive and rewarding 2008 for all.
Regards,
William Dillard, II Alex DillardChairman of the Board President& Chief Executive Offi cer
t o o u r s h a r e h o l d e r s

UNITED STATESSECURITIES AND EXCHANGE COMMISSION
WASHINGTON, D.C. 20549
FORM 10-K(Mark One)È ANNUAL REPORT PURSUANT TO SECTION 13 OR 15(d) OF THE SECURITIES EXCHANGE ACT OF
1934For the fiscal year ended February 2, 2008
OR‘ TRANSITION REPORT PURSUANT TO SECTION 13 OR 15(d) OF THE SECURITIES EXCHANGE ACT
OF 1934For the transition period from to .
Commission file number 1-6140
DILLARD’S, INC.(Exact name of registrant as specified in its charter)
DELAWARE 71-0388071(State or other jurisdiction (IRS Employer
of incorporation or organization) Identification Number)
1600 CANTRELL ROAD, LITTLE ROCK, ARKANSAS 72201(Address of principal executive office)
(Zip Code)
(501) 376-5200(Registrant’s telephone number, including area code)
Securities registered pursuant to Section 12(b) of the Act:Title of each Class Name of each exchange on which registered
Class A Common Stock New York Stock ExchangeSecurities registered pursuant to Section 12(g) of the Act:
NoneIndicate by check mark if the Registrant is a well-known seasoned issuer, as defined in Rule 405 of the Securities
Act. Yes È No ‘Indicate by check mark if the Registrant is not required to file reports pursuant to Section 13 or Section 15(d) of the
Act. Yes ‘ No ÈIndicate by check mark whether the Registrant (1) has filed all reports required to be filed by Section 13 or 15(d) of the
Securities Exchange Act of 1934 during the preceding 12 months (or for such shorter period that the registrant was required tofile such reports), and (2) has been subject to such filing requirements for the past 90 days. Yes È No ‘
Indicate by check mark if disclosure of delinquent filers pursuant to Item 405 of Regulation S-K is not contained herein,and will not be contained, to the best of Registrant's knowledge, in definitive proxy or information statements incorporated byreference in Part III of the Form 10-K or any amendment to this Form 10-K. È
Indicate by check mark whether the Registrant is a large accelerated filer, an accelerated filer, or a non-accelerated filer(See definition of “accelerated filer and large accelerated filer” in Exchange Act Rule 12b-2).
Large Accelerated Filer È Accelerated Filer ‘ Non-Accelerated Filer ‘ Smaller reporting company ‘Indicate by check mark whether the Registrant is a shell company (as defined in Exchange Act Rule
12-b-2). Yes ‘ No ÈState the aggregate market value of the voting and non-voting common equity held by non-affiliates of the Registrant as
of August 4, 2007: $1,868,526,448.Indicate the number of shares outstanding of each of the Registrant's classes of common stock as of March 1, 2008:
CLASS A COMMON STOCK, $0.01 par value . . . . . . . . . . . . . . . . . . . . . . . . . . . . . . . . . . . . . . . . . 71,155,347CLASS B COMMON STOCK, $0.01 par value . . . . . . . . . . . . . . . . . . . . . . . . . . . . . . . . . . . . . . . . . 4,010,929
DOCUMENTS INCORPORATED BY REFERENCEPortions of the Proxy Statement for the Annual Meeting of Stockholders to be held May 17, 2008 (the “Proxy Statement”) areincorporated by reference into Part III.


TABLE OF CONTENTS
Page No.
PART IItem No.1. Business . . . . . . . . . . . . . . . . . . . . . . . . . . . . . . . . . . . . . . . . . . . . . . . . . . . . . . . . . . . . . . . . . . 11A. Risk Factors . . . . . . . . . . . . . . . . . . . . . . . . . . . . . . . . . . . . . . . . . . . . . . . . . . . . . . . . . . . . . . . 31B. Unresolved Staff Comments . . . . . . . . . . . . . . . . . . . . . . . . . . . . . . . . . . . . . . . . . . . . . . . . . . 62. Properties . . . . . . . . . . . . . . . . . . . . . . . . . . . . . . . . . . . . . . . . . . . . . . . . . . . . . . . . . . . . . . . . . 63. Legal Proceedings . . . . . . . . . . . . . . . . . . . . . . . . . . . . . . . . . . . . . . . . . . . . . . . . . . . . . . . . . . 64. Submission of Matters to a Vote of Security Holders . . . . . . . . . . . . . . . . . . . . . . . . . . . . . . . 6
PART II5. Market for Registrant’s Common Equity, and Related Matters and Issuer Purchases of
Equity Securities . . . . . . . . . . . . . . . . . . . . . . . . . . . . . . . . . . . . . . . . . . . . . . . . . . . . . . . . . . . 86. Selected Financial Data . . . . . . . . . . . . . . . . . . . . . . . . . . . . . . . . . . . . . . . . . . . . . . . . . . . . . . 107. Management’s Discussion and Analysis of Financial Condition and Results of
Operations . . . . . . . . . . . . . . . . . . . . . . . . . . . . . . . . . . . . . . . . . . . . . . . . . . . . . . . . . . . . . . . . 127A. Quantitative and Qualitative Disclosures about Market Risk . . . . . . . . . . . . . . . . . . . . . . . . . 298. Financial Statements and Supplementary Data . . . . . . . . . . . . . . . . . . . . . . . . . . . . . . . . . . . . 299. Changes in and Disagreements with Accountants on Accounting and Financial
Disclosure . . . . . . . . . . . . . . . . . . . . . . . . . . . . . . . . . . . . . . . . . . . . . . . . . . . . . . . . . . . . . . . . . 299A. Controls and Procedures . . . . . . . . . . . . . . . . . . . . . . . . . . . . . . . . . . . . . . . . . . . . . . . . . . . . . . 299B. Other Information . . . . . . . . . . . . . . . . . . . . . . . . . . . . . . . . . . . . . . . . . . . . . . . . . . . . . . . . . . . 30
PART III10. Directors and Executive Officers of the Registrant . . . . . . . . . . . . . . . . . . . . . . . . . . . . . . . . . 3111. Executive Compensation . . . . . . . . . . . . . . . . . . . . . . . . . . . . . . . . . . . . . . . . . . . . . . . . . . . . . 3112. Security Ownership of Certain Beneficial Owners and Management and Related
Stockholder Matters . . . . . . . . . . . . . . . . . . . . . . . . . . . . . . . . . . . . . . . . . . . . . . . . . . . . . . . . . 3113. Certain Relationships and Related Transactions . . . . . . . . . . . . . . . . . . . . . . . . . . . . . . . . . . . 3114. Principal Accountant Fees and Services . . . . . . . . . . . . . . . . . . . . . . . . . . . . . . . . . . . . . . . . . 31
PART IV15. Exhibits . . . . . . . . . . . . . . . . . . . . . . . . . . . . . . . . . . . . . . . . . . . . . . . . . . . . . . . . . . . . . . . . . . . 32


PART IITEM 1. BUSINESS.
General
Dillard's, Inc. (the “Company”, “we”, “us”, “our” or “Registrant”) ranks among the nation’s largest apparel andhome furnishing retailers. Our Company, originally founded in 1938 by William T. Dillard, was incorporated inDelaware in 1964. As of February 2, 2008, we operated 326 Dillard’s stores offering a wide selection ofmerchandise including fashion apparel for women, men and children, accessories, cosmetics, home furnishings andother consumer goods. The following table summarizes the percentage of net sales by each major product line:
Percentage of Net Sales
Fiscal2007
Fiscal2006
Fiscal2005
Cosmetics . . . . . . . . . . . . . . . . . . . . . . . . . . . . . . . . . . . . . . . . . . . . . . . . . . . . . 15% 15% 15%Ladies’ Apparel and Accessories . . . . . . . . . . . . . . . . . . . . . . . . . . . . . . . . . . . 37 36 36Juniors’ and Children’s Apparel . . . . . . . . . . . . . . . . . . . . . . . . . . . . . . . . . . . . 9 10 10Men’s Apparel and Accessories . . . . . . . . . . . . . . . . . . . . . . . . . . . . . . . . . . . . 18 18 18Shoes . . . . . . . . . . . . . . . . . . . . . . . . . . . . . . . . . . . . . . . . . . . . . . . . . . . . . . . . . 13 13 12Home and Other . . . . . . . . . . . . . . . . . . . . . . . . . . . . . . . . . . . . . . . . . . . . . . . . 8 8 9
Total . . . . . . . . . . . . . . . . . . . . . . . . . . . . . . . . . . . . . . . . . . . . . . . . . . . . . . . . . . 100% 100% 100%
Our store base is diversified, with the character and culture of the community served determining the size offacility and, to a large extent, the merchandise mix presented. Most stores are located in suburban shoppingmalls. Our customers may also purchase merchandise on-line at our website, www.dillards.com, which featureson-line gift registries and a variety of other services. We operate retail department stores located primarily in thesouthwest, southeast and midwest regions of the United States. The stores are located in 29 states, with 53 storeslocated in the western region, 123 stores in the eastern region and 150 stores in the central region.
We conduct our retail merchandise business under highly competitive conditions. Although we are a largeregional department store, we have numerous competitors at the national and local level that compete with ourindividual stores, including specialty, off-price, discount, internet, and mail-order retailers. Competition ischaracterized by many factors including location, reputation, assortment, advertising, price, quality, service andcredit availability. We believe that our stores are in a strong competitive position with regard to each of thesefactors. In an effort to strengthen this position, we will continue to make notable changes to our merchandisemix, positioning our stores toward a more upscale and contemporary tone to attract new customers who areseeking exciting statements in fashion. At the same time, we will work to maintain valued relationships with ourexisting loyal customer base by continuing to provide updated fashion choices, dependable quality, reliableservice and measurable value. Our expanded selections of more upscale and contemporary choices include, butare not limited to, Dillard’s improved lines of exclusive brand merchandise such as Antonio Melani, Gianni Bini,Roundtree & Yorke and Daniel Cremieux. Other retailers may compete for customers on some or all of thesefactors, or on other factors, and may be perceived by some potential customers as being better aligned with theirparticular preferences. The Company's earnings depend to a significant extent on the results of operations for thelast quarter of its fiscal year. Due to holiday buying patterns, sales for that period average approximatelyone-third of annual sales.
We purchase merchandise from many suppliers, none of which accounted for more than 5% of our netpurchases during 2007. We have no long-term purchase commitments or arrangements with any of our suppliers,and we do not believe we are dependent on any one supplier. We consider our relationships with our suppliers tobe strong and mutually beneficial.
Our merchandising, sales promotion, and store operating support functions are conducted in multiplelocations. Our back office sales support functions for the Company, such as accounting, product development,store planning and information technology, are centralized.
1

We have developed a knowledge of each of our trade areas and customer bases for our stores. Thisknowledge is gained through our regional merchandising structure in conjunction with store visits by seniormanagement and merchandising personnel complemented by the use of on-line merchandise information. Wewill continue to use existing technology and research to edit assortments by store to meet the specific preference,taste and size requirements of each local operating area.
Certain departments in our stores are licensed to independent companies in order to provide high qualityservice and merchandise where specialization, focus and expertise are critical. The licensed departments vary bystore to complement our own merchandising departments. The principal licensed departments are fine jewelryand an upscale women’s apparel vendor in certain stores. The terms of the license agreements typically rangebetween three and five years with one year renewals and require the licensee to pay for fixtures and provide itsown employees. We regularly evaluate the performance of the licensed departments and require compliance withestablished customer service guidelines.
In November 2004, the Company sold substantially all of the assets of its Dillard’s proprietary credit card(“proprietary card”) business to GE Consumer Finance (“GE”). These assets included the proprietary cardaccount balances owned by the Dillard’s Credit Card Master Trust, which previously owned and securitized theaccounts receivable generated by the proprietary card accounts.
As a result of the transaction and pursuant to a long-term marketing and servicing alliance with an initial term often years, GE establishes and owns proprietary card accounts for our customers, retains the benefits and risksassociated with the ownership of the accounts, provides key customer service functions, including new accountopenings, transaction authorization, billing adjustments and customer inquiries, receives the finance charge income andincurs the bad debts associated with those accounts. Pursuant to the long-term marketing and servicing alliance, wereceive on-going cash compensation from GE based upon the portfolio earnings. With the sale, we became a morefocused retailer and used the proceeds generated from the sale and ongoing compensation to strengthen our balancesheet and return value to our shareholders. Further pursuant to this agreement, we have no continuing involvementother than to honor the proprietary cards in our stores. Although not obligated to a specific level of marketingcommitment, we participate in the marketing of the proprietary cards and accept payments on the proprietary cards inour stores as a convenience to customers who prefer to pay in person rather than by mailing their payments to GE.
We seek to expand the number and use of the proprietary cards by, among other things, providing incentivesto sales associates to open new credit accounts, which generally can be opened while a customer is visiting oneof our stores. Customers who open accounts are rewarded with certificates for discounts on later purchases.Proprietary card customers are sometimes offered private shopping nights, direct mail catalogs, special discounts,and advance notice of sale events. GE has created various loyalty programs that reward customers for frequencyand volume of proprietary card usage.
Our fiscal year ends on the Saturday nearest January 31 of each year. Fiscal years 2007, 2006 and 2005ended on February 2, 2008, February 3, 2007 and January 28, 2006, respectively. Fiscal year 2006 included 53weeks, and fiscal years 2007 and 2005 included 52 weeks.
For additional information with respect to our business, reference is made to information contained under theheadings “Net sales,” “Net income,” “Total assets” and “Number of employees-average,” under item 6 hereof.
The information contained on our website is not incorporated by reference into this Form 10-K and shouldnot be considered to be a part of this Form 10-K. Our annual report on Form 10-K, quarterly reports on Form10-Q, current reports on Form 8-K, statements of changes in beneficial ownership of securities on Form 4 andamendments to those reports filed or furnished pursuant to Section 13(a) or 15(d) of the Exchange Act areavailable free of charge (as soon as reasonably practicable after we electronically file such material with, orfurnish it to, the SEC) on the Dillard’s, Inc. website:
www.dillards.com
2

We have adopted a Code of Business Conduct and Corporate Governance Guidelines, as required by thelisting standards of the New York Stock Exchange and the rules of the SEC. We have posted on our website ourCode of Conduct, Corporate Governance Guidelines, Social Accountability Policy and committee charters for theAudit Committee of the Board of Directors and the Stock Option and Executive Compensation Committee.
Our corporate offices are located at 1600 Cantrell Road, Little Rock, Arkansas 72201, telephone:501-376-5200.
ITEM 1A.RISK FACTORS.
The risks described in Item 1A, Risk Factors, in this Annual Report on Form 10-K for the year endedFebruary 2, 2008, could materially and adversely affect our business, financial condition and results ofoperations. The risk factors discussed below do not identify all risks that we face because our business operationscould also be affected by additional factors that are not presently known to us or that we currently consider to beimmaterial to our operations.
The Company cautions that forward-looking statements, as such term is defined in the Private SecuritiesLitigation Reform Act of 1995, contained in this Annual Report on Form 10-K are based on estimates,projections, beliefs and assumptions of management at the time of such statements and are not guarantees offuture performance. The Company disclaims any obligation to update or revise any forward-looking statementsbased on the occurrence of future events, the receipt of new information, or otherwise. Forward-lookingstatements of the Company involve risks and uncertainties and are subject to change based on various importantfactors. Actual future performance, outcomes and results may differ materially from those expressed in forward-looking statements made by the Company and its management as a result of a number of risks, uncertainties andassumptions.
The retail merchandise business is highly competitive, and that competition could lower revenues, marginsand market share.
We conduct our retail merchandise business under highly competitive conditions. Although we are a largeregional department store, we have numerous competitors at the national and local level that compete with ourindividual stores, including specialty, off-price, discount, internet and mail-order retailers. Competition ischaracterized by many factors including location, reputation, fashion, merchandise assortment, advertising, price,quality, service and credit availability. We anticipate intense competition will continue to focus on pricing. Someof our competitors have substantially larger marketing budgets, which may provide them with a competitiveadvantage. If we are unable to maintain our competitive position, we could experience downward pressure onprices, lower demand for products, reduced margins, the inability to take advantage of new businessopportunities and the loss of market share.
Changes in economic, market and other conditions could adversely affect our operating results.
The retail merchandise business is affected by changes in international, national, regional, and localeconomic conditions, consumer preferences and spending patterns, demographic trends, consumer confidence,consumer credit availability, weather, traffic patterns, the type, number and location of competing stores, and theeffects of war or terrorist activities and any governmental responses thereto. Factors such as inflation, apparelcosts, labor and benefit costs, legal claims, and the availability of management and hourly employees also affectstore operations and administrative expenses. Our ability to finance new store development, improvements andadditions to existing stores, and the acquisition of stores from competitors is affected by economic conditions,including interest rates and other government policies impacting land and construction costs and the availabilityof borrowed funds.
3

Current store locations may become less desirable, and desirable new locations may not be available for areasonable price, if at all.
The success of any store depends substantially upon its location. There can be no assurance that currentlocations will continue to be desirable as demographic patterns change. Neighborhood or economic conditionswhere stores are located could decline in the future, thus resulting in potentially reduced sales in those locations.If we cannot obtain desirable locations at reasonable prices our cost structure will increase and our revenues willbe adversely affected.
Ownership and leasing of significant amounts of real estate exposes us to possible liabilities and losses.
We own the land and building, or lease the land and/or the building, for all of our stores. Accordingly, weare subject to all of the risks associated with owning and leasing real estate. In particular, the value of the assetscould decrease, and their costs could increase, because of changes in the investment climate for real estate,demographic trends and supply or demand for the use of the store, which may result from competition fromsimilar stores in the area, as well as liability for environmental conditions. We generally cannot cancel theseleases. If an existing or future store is not profitable, and we decide to close it, we may be committed to performcertain obligations under the applicable lease including, among other things, paying the base rent for the balanceof the lease term. In addition, as each of the leases expires, we may be unable to negotiate renewals, either oncommercially acceptable terms or at all, which could cause us to close stores in desirable locations. If an existingowned store is not profitable, and we decide to close it, we may be required to record an impairment charge and/or exit costs associated with the disposal of the store. We may not be able to close an unprofitable owned storedue to an existing operating covenant which may cause us to operate the location at a loss and prevent us fromfinding a more desirable location. We have approximately 95 stores along the Gulf and Atlantic coasts that arenot covered by third party insurance but are self-insured for property and merchandise losses related to “namedstorms”; therefore, repair and replacement costs will be borne by us for damage to any of these stores from“named storms”.
We rely on third party suppliers to obtain materials and provide production facilities from which we sourceour merchandise.
We may experience supply problems such as unfavorable pricing or untimely delivery of merchandise. Theprice and availability of materials from suppliers can be adversely affected by factors outside of our control suchas increased worldwide demand. Further, our suppliers who also serve the retail industry may experiencefinancial difficulties due to a downturn in the industry. These supplier risks may have a material adverse effecton our business and results of operations.
We intend to evaluate acquisitions, joint ventures and other strategic initiatives, any of which could distractmanagement or otherwise have a negative effect on revenues, costs and stock price.
Our future success may depend on opportunities to buy or obtain rights to other businesses or technologiesthat could complement, enhance or expand our current business or products or that might otherwise offer growthopportunities. In particular, we intend to evaluate potential mergers, acquisitions, joint venture investments,strategic initiatives, alliances, vertical integration opportunities and divestitures. Our attempt to engage in thesetransactions may expose us to various inherent risks, including:
• assessing the value, future growth potential, strengths, weaknesses, contingent and other liabilities andpotential profitability of acquisition candidates;
• the potential loss of key personnel of an acquired business;
• the ability to achieve projected economic and operating synergies;
• difficulties successfully integrating, operating, maintaining and managing newly acquired operations oremployees;
4

• difficulties maintaining uniform standards, controls, procedures and policies;
• unanticipated changes in business and economic conditions affecting an acquired business;
• the possibility of impairment charges if an acquired business performs below expectations; and
• the diversion of management’s attention from the existing business to integrate the operations andpersonnel of the acquired or combined business or to implement the strategic initiative.
Our annual and quarterly financial results may fluctuate depending on various factors, many of which arebeyond our control, and if we fail to meet the expectations of securities analysts or investors, our share pricemay decline.
Our sales and operating results can vary from quarter to quarter and year to year depending on variousfactors, many of which are beyond our control. Certain events and factors may directly and immediately decreasedemand for our products. If customer demand decreases rapidly, our results of operations would also declineprecipitously. These events and factors include:
• variations in the timing and volume of our sales;
• sales promotions by us or our competitors;
• changes in average same-store sales and customer visits;
• variations in the price, availability and shipping costs of supplies;
• seasonal effects on demand for our products;
• changes in competitive and economic conditions generally;
• changes in the cost or availability of material or labor; and
• weather and acts of God.
Litigation from customers, employees and others could harm our reputation and impact operating results.
Class action lawsuits have been filed, and may continue to be filed, from customers alleging discrimination.We are also susceptible to claims filed by customers alleging responsibility for injury suffered during a visit to astore. Further, we may be subject to other claims in the future based on, among other things, employeediscrimination, harassment, wrongful termination and wage issues, including those relating to overtimecompensation. These types of claims, as well as other types of lawsuits to which we are subject to from time to time,can distract management’s attention from core business operations and/or negatively impact operating results.
Catastrophic events may disrupt our business.
Unforeseen events, including war, terrorism and other international conflicts, public health issues, and naturaldisasters such as earthquakes, hurricanes or other adverse weather and climate conditions, whether occurring in theUnited States or abroad, could disrupt our operations, disrupt international trade and supply chain efficiencies,suppliers or customers, or result in political or economic instability. These events could result in property losses,reduce demand for our products or make it difficult or impossible to receive products from suppliers.
Variations in the amount of vendor advertising allowances received could adversely impact our operatingresults.
We receive vendor advertising allowances that are a strategic part of our advertising program. If vendoradvertising allowances were substantially reduced or eliminated, we would likely consider other methods ofadvertising as well as the volume and frequency of our product advertising, which could increase/decrease ourexpenditures and/or revenue.
5

If we do not maintain the security of customer-related information, we could damage our reputation withcustomers, incur substantial additional costs and become subject to litigation.
As do most retailers, we receive certain personal information about our customers. In addition, our onlineoperations at www.dillards.com depend upon the secure transmission of confidential information over publicnetworks, including information permitting cashless payments. A compromise of our security systems that resultsin customer personal information being obtained by unauthorized persons could adversely affect our reputationwith our customers and others, as well as our operations, results of operations, financial condition and liquidity,and could result in litigation against us or the imposition of penalties. In addition, a security breach could requirethat we expend significant additional resources related to our information security systems and could result in adisruption of our operations, particularly our online sales operations.
ITEM 1B.UNRESOLVED STAFF COMMENTS.
None.
ITEM 2. PROPERTIES.
All of our stores are owned or leased from third parties. Our third-party store leases typically provide forrental payments based on a percentage of net sales with a guaranteed minimum annual rent. In general, theCompany pays the cost of insurance, maintenance and real estate taxes related to the leases.
The following table summarizes the number of retail stores owned or operated by us and the percentage oftotal store area represented by each listed category at February 2, 2008:
Number ofstores
% of totalstore square
footage
Owned stores . . . . . . . . . . . . . . . . . . . . . . . . . . . . . . . . . . . . . . . . . . 247 77.0 %Leased stores . . . . . . . . . . . . . . . . . . . . . . . . . . . . . . . . . . . . . . . . . . 48 13.1 %Owned building on leased land . . . . . . . . . . . . . . . . . . . . . . . . . . . . 19 6.4 %Partly owned and partly leased . . . . . . . . . . . . . . . . . . . . . . . . . . . . 12 3.5 %
326 100.0 %
At February 2, 2008, we had eight regional distribution facilities located throughout the United States ofwhich we own six and lease two from third parties. Our principal executive offices are approximately 300,000square feet located in Little Rock, Arkansas. Additional information is contained in Notes 1, 3, 13, 14 and 15 of“Notes to Consolidated Financial Statements,” in Item 8 hereof, and reference is made to information containedunder the headings “Number of stores” and “Gross square footage,” under Item 6 hereof.
ITEM 3. LEGAL PROCEEDINGS.
From time to time, we are involved in litigation relating to claims arising out of our operations in the normalcourse of business. Such issues may relate to litigation with customers, employment related lawsuits, class actionlawsuits, purported class action lawsuits and actions brought by governmental authorities. As of April 2, 2008, weare not a party to any legal proceedings that, individually or in the aggregate, are reasonably expected to have amaterial adverse effect on our business, results of operations, financial condition or cash flows. However, the resultsof these matters cannot be predicted with certainty, and an unfavorable resolution of one or more of these matterscould have a material adverse effect on our business, results of operations, financial condition or cash flows.
ITEM 4. SUBMISSION OF MATTERS TO A VOTE OF SECURITY HOLDERS.
No matter was submitted to a vote of security holders during the fourth quarter of the year endedFebruary 2, 2008.
6

Executive Officers of the Company
The following table lists the names and ages of all Executive Officers of the Registrant, the nature of anyfamily relationship between them and all positions and offices with the Registrant presently held by each personnamed. All of the Executive Officers listed below have been in managerial positions with the registrant for morethan five years.
Name Age Position & Office Family Relationship
William Dillard, II . . . . . . . . . . . 63 Director; Chief Executive Officer NoneAlex Dillard . . . . . . . . . . . . . . . . 58 Director; President Brother of William Dillard, IIMike Dillard . . . . . . . . . . . . . . . . 56 Director; Executive Vice President Brother of William Dillard, IIG. Kent Burnett . . . . . . . . . . . . . . 63 Vice President NoneDrue Corbusier . . . . . . . . . . . . . . 61 Director; Executive Vice President Sister of William Dillard, IIJames I. Freeman . . . . . . . . . . . . 58 Director; Senior Vice President;
Chief Financial OfficerNone
Steven K. Nelson . . . . . . . . . . . . 50 Vice President NoneRobin Sanderford . . . . . . . . . . . . 61 Vice President NonePaul J. Schroeder . . . . . . . . . . . . . 60 Vice President; General Counsel NoneBurt Squires . . . . . . . . . . . . . . . . 58 Vice President NoneJulie A. Taylor . . . . . . . . . . . . . . 56 Vice President NoneDavid Terry . . . . . . . . . . . . . . . . . 59 Vice President None
7

PART II
ITEM 5. MARKET FOR REGISTRANT’S COMMON EQUITY, AND RELATEDMATTERS ANDISSUER PURCHASES OF EQUITY SECURITIES.
The Company’s Class A Common Stock trades on the New York Stock Exchange under the Ticker Symbol“DDS”. No public market currently exists for the Class B Common Stock.
The high and low sales prices of the Company’s Class A Common Stock, and dividends declared on eachclass of common stock, for each quarter of fiscal 2007 and 2006 are presented in the table below:
2007 2006Dividendsper Share
High Low High Low 2007 2006
First . . . . . . . . . . . . . . . . . . . . . . . . . . . . . . . . . . . . . . . . . . . . $35.82 $31.70 $26.79 $24.23 $0.04 $0.04Second . . . . . . . . . . . . . . . . . . . . . . . . . . . . . . . . . . . . . . . . . . 39.90 25.62 32.04 25.42 0.04 0.04Third . . . . . . . . . . . . . . . . . . . . . . . . . . . . . . . . . . . . . . . . . . . 26.40 19.68 33.63 29.94 0.04 0.04Fourth . . . . . . . . . . . . . . . . . . . . . . . . . . . . . . . . . . . . . . . . . . 21.73 14.93 36.09 28.74 0.04 0.04
While the Company expects to continue its cash dividend policy during fiscal 2008, all subsequentdividends will be reviewed quarterly and declared by the board of directors.
As of March 1, 2008, there were 3,740 holders of record of the Company's Class A Common Stock and 8holders of record of the Company’s Class B Common Stock.
In November 2007, the Company announced that the Board of Directors authorized the repurchase of up to$200 million of its Class A Common Stock. The plan has no expiration date, and remaining availability pursuantto the Company’s share repurchase program is $200 million as of February 2, 2008. There were no issuerpurchases of equity securities during the fourth quarter of 2007.
8

Company Performance
For each of the last five fiscal years, the graph below compares the cumulative total returns on theCompany’s Class A Common Stock, the Standard & Poor’s 500 Index and the Standard & Poor’sSupercomposite Department Stores Index. The cumulative total return on the Company’s Class A CommonStock assumes $100 invested in such stock on February 2, 2003 and assumes reinvestment of dividends.
Do
llars
Dillard S&P 500 S&P Supercomposite Dept. Strs
Stock Performance Graph
2003 2004 2005 2006 2007$0
$50
$100
$150
$200
$250
$300
2002 2003 2004 2005 2006 2007
Dillard’s, Inc. . . . . . . . . . . . . . . . . . . . . . . . . . . . . $100.00 $114.40 $176.28 $176.44 $239.62 $141.53S&P 500 . . . . . . . . . . . . . . . . . . . . . . . . . . . . . . . . 100.00 134.68 141.88 158.42 181.81 178.47S&P Supercomposite Department Stores . . . . . . . 100.00 139.71 164.18 196.15 284.53 184.11
9

ITEM 6. SELECTED FINANCIAL DATA.
The selected financial data set forth should be read in conjunction with the Company’s consolidated auditedfinancial statements and notes thereto and the other information contained elsewhere in this report.
2007 2006* 2005 2004 2003
(Dollars in thousands of dollars, except per share data)
Net sales . . . . . . . . . . . . . . . . . . . . . . . . $ 7,207,417 $ 7,636,056 $ 7,551,697 $ 7,522,060 $ 7,594,460Percent change . . . . . . . . . . . . . . . . -6% 1% 0% -1% -4%
Cost of sales . . . . . . . . . . . . . . . . . . . . . 4,786,655 5,032,351 5,014,021 5,017,765 5,170,173Percent of sales . . . . . . . . . . . . . . . 66.4% 65.9% 66.4% 66.7% 68.1%
Interest and debt expense, net . . . . . . . . 91,556 87,642 105,570 139,056 181,065Income before income taxes and equityin earnings of joint ventures . . . . . . . 60,518 253,842 125,791 175,832 7,904
Income taxes . . . . . . . . . . . . . . . . . . . . . 13,010 20,580 14,300 66,885 6,650Equity in earnings of joint ventures . . . 6,253 12,384 9,994 8,719 8,090Net income . . . . . . . . . . . . . . . . . . . . . . 53,761 245,646 121,485 117,666 9,344Per diluted common share
Net income . . . . . . . . . . . . . . . . . . 0.68 3.05 1.49 1.41 0.11Dividends . . . . . . . . . . . . . . . . . . . 0.16 0.16 0.16 0.16 0.16Book value (3) . . . . . . . . . . . . . . . . 33.45 32.19 29.43 27.85 26.79
Average number of dilutedsharesoutstanding . . . . . . . . . . . . . . . 79,103,423 80,475,210 81,660,619 83,739,431 83,899,974
Accounts receivable (1) . . . . . . . . . . . . . 10,880 10,508 12,523 9,651 1,232,456Merchandise inventories . . . . . . . . . . . . 1,779,279 1,772,150 1,802,695 1,733,033 1,632,377Property and equipment (3) . . . . . . . . . . 3,190,444 3,146,626 3,147,623 3,169,476 3,197,469Total assets (3) . . . . . . . . . . . . . . . . . . . 5,338,129 5,396,735 5,505,639 5,680,301 6,411,097Long-term debt (1) . . . . . . . . . . . . . . . . 760,165 956,611 1,058,946 1,322,824 1,855,065Capital lease obligations . . . . . . . . . . . . 25,739 28,328 31,806 20,182 17,711Deferred income taxes (3) . . . . . . . . . . . 436,541 448,770 475,007 505,473 617,236Guaranteed preferred beneficialinterests in the Company’ssubordinated debentures . . . . . . . . . . 200,000 200,000 200,000 200,000 200,000
Total stockholders’ equity (3) . . . . . . . . 2,514,111 2,579,789 2,333,377 2,317,533 2,237,097Number of employees – average . . . . . . 49,938 51,385 52,056 53,035 53,598Gross square footage (in thousands) . . . . 56,300 56,500 56,400 56,300 56,000Number of stores
Opened . . . . . . . . . . . . . . . . . . . . . 9 8 9 8 5Closed (2) . . . . . . . . . . . . . . . . . . . 11 10 8 7 10
Total – end of year . . . . . . . . . . . . . . . . 326 328 330 329 328
* 53 weeks
(1) During fiscal 2004, the Company sold its private label credit card business to GE Consumer Finance for$1.1 billion, which included the assumption of $400 million of long-term securitization liabilities.
(2) One store in Biloxi, Mississippi, not in operation during fiscal 2007 and fiscal 2006 due to the hurricanes of2005 and included in the 2006 closed store totals, was re-opened in early fiscal 2008.
(3) As discussed in Note 2 of the Notes to Consolidated Financial Statements, the Company has restated itsConsolidated Balance Sheet and Statement of Stockholders’ Equity as of February 3, 2007 and ConsolidatedStatement of Stockholders’ Equity as of January 28, 2006.
10
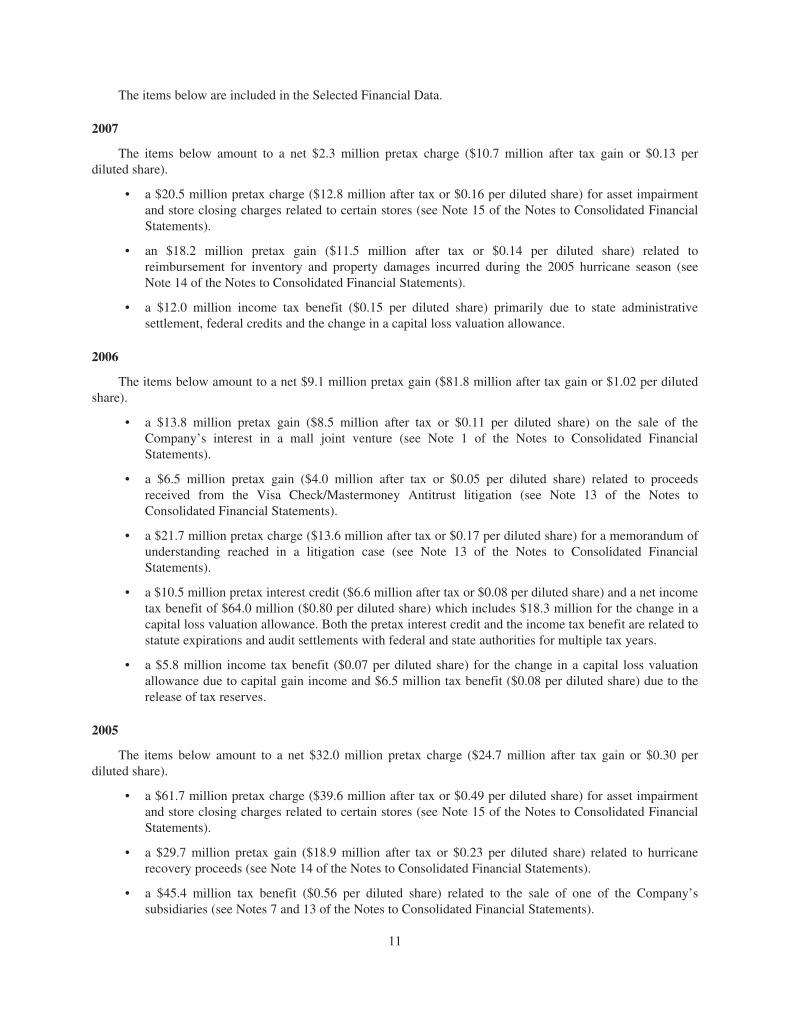
The items below are included in the Selected Financial Data.
2007
The items below amount to a net $2.3 million pretax charge ($10.7 million after tax gain or $0.13 perdiluted share).
• a $20.5 million pretax charge ($12.8 million after tax or $0.16 per diluted share) for asset impairmentand store closing charges related to certain stores (see Note 15 of the Notes to Consolidated FinancialStatements).
• an $18.2 million pretax gain ($11.5 million after tax or $0.14 per diluted share) related toreimbursement for inventory and property damages incurred during the 2005 hurricane season (seeNote 14 of the Notes to Consolidated Financial Statements).
• a $12.0 million income tax benefit ($0.15 per diluted share) primarily due to state administrativesettlement, federal credits and the change in a capital loss valuation allowance.
2006
The items below amount to a net $9.1 million pretax gain ($81.8 million after tax gain or $1.02 per dilutedshare).
• a $13.8 million pretax gain ($8.5 million after tax or $0.11 per diluted share) on the sale of theCompany’s interest in a mall joint venture (see Note 1 of the Notes to Consolidated FinancialStatements).
• a $6.5 million pretax gain ($4.0 million after tax or $0.05 per diluted share) related to proceedsreceived from the Visa Check/Mastermoney Antitrust litigation (see Note 13 of the Notes toConsolidated Financial Statements).
• a $21.7 million pretax charge ($13.6 million after tax or $0.17 per diluted share) for a memorandum ofunderstanding reached in a litigation case (see Note 13 of the Notes to Consolidated FinancialStatements).
• a $10.5 million pretax interest credit ($6.6 million after tax or $0.08 per diluted share) and a net incometax benefit of $64.0 million ($0.80 per diluted share) which includes $18.3 million for the change in acapital loss valuation allowance. Both the pretax interest credit and the income tax benefit are related tostatute expirations and audit settlements with federal and state authorities for multiple tax years.
• a $5.8 million income tax benefit ($0.07 per diluted share) for the change in a capital loss valuationallowance due to capital gain income and $6.5 million tax benefit ($0.08 per diluted share) due to therelease of tax reserves.
2005
The items below amount to a net $32.0 million pretax charge ($24.7 million after tax gain or $0.30 perdiluted share).
• a $61.7 million pretax charge ($39.6 million after tax or $0.49 per diluted share) for asset impairmentand store closing charges related to certain stores (see Note 15 of the Notes to Consolidated FinancialStatements).
• a $29.7 million pretax gain ($18.9 million after tax or $0.23 per diluted share) related to hurricanerecovery proceeds (see Note 14 of the Notes to Consolidated Financial Statements).
• a $45.4 million tax benefit ($0.56 per diluted share) related to the sale of one of the Company’ssubsidiaries (see Notes 7 and 13 of the Notes to Consolidated Financial Statements).
11

2004
The items below amount to a net $64.5 million pretax gain ($42.1 million after tax or $0.50 per dilutedshare).
• a pretax gain of $83.9 million ($53.7 million after tax or $0.64 per diluted share) pertaining to theCompany’s sale of its private label credit card business to GE Consumer Finance.
• a $19.4 million pretax charge ($11.6 million after tax or $0.14 per diluted share) for asset impairmentand store closing charges related to certain stores.
2003
The items below amount to a net $18.6 million pretax charge ($12.8 million after tax or $0.15 per dilutedshare).
• a $43.7 million pretax charge ($28.9 million after tax or $0.34 per diluted share) for asset impairmentand store closing charges related to certain stores.
• a call premium resulting in additional interest expense of $15.6 million ($10.0 million after tax or$0.12 per diluted share) associated with a $125.9 million call of debt.
• a pretax gain of $15.6 million ($10.0 million after tax or $0.12 per diluted share) pertaining to theCompany’s sale of its interest in Sunrise Mall and its associated center in Brownsville, Texas.
• a pretax gain of $12.3 million ($7.9 million after tax or $0.09 per diluted share) recorded due to theresolution of certain liabilities originally recorded in conjunction with the purchase of MercantileStores Company, Inc.
• an $8.7 million pretax gain ($5.6 million after tax or $0.07 per diluted share) related to the sale ofcertain store properties.
• $4.1 million ($2.6 million after tax or $0.03 per diluted share) received from the Internal RevenueService as a result of the Company’s filing of an interest-netting claim related to previously settled taxyears.
ITEM 7. MANAGEMENT’S DISCUSSION AND ANALYSIS OF FINANCIAL CONDITION ANDRESULTS OF OPERATIONS.
EXECUTIVE OVERVIEW
Dillard’s, Inc. operates 326 retail department stores in 29 states. Our stores are located in suburban shoppingmalls and open-air lifestyle centers and offer a broad selection of fashion apparel and home furnishings. We offeran appealing and attractive assortment of merchandise to our customers at a fair price. We offer national brandmerchandise as well as our exclusive brand merchandise. We seek to enhance our income by maximizing the saleof this merchandise to our customers by promoting and advertising our merchandise and by making our stores anattractive and convenient place for our customers to shop.
Fundamentally, our business model is to offer the customer a compelling price/value relationship throughthe combination of high quality, fashionable products and services at a competitive price. We seek to deliver ahigh level of profitability and cash flow by:
• maximizing the effectiveness of our pricing and brand awareness;
• minimizing costs through leveraging our centralized overhead expense structure without sacrificingservice to our customers;
• sourcing goods from both domestic and foreign enterprises;
• reinvesting operating cash flows into store growth, and distribution initiatives, and improving productquality in our exclusive brands;
12

• returning profits to shareholders through dividends and share repurchases;
• continuing to offer access to credit services and financial products to our customers through our long-term marketing and servicing alliance with GE Consumer Finance (“GE”); and
• closing under-performing stores where appropriate.
The consumer retail sector is extremely competitive. Many different retail establishments compete for ourcustomers’ business. These include other department stores, specialty retailers, discounters, internet and mailorder retailers.
In accordance with the National Retail Federation fiscal reporting calendar, the 2007 and 2005 reportingperiods presented and discussed below ended February 2, 2008 and January 28, 2006, respectively, and eachcontained 52 weeks. The corresponding 2006 reporting period ended February 3, 2007 contained 53 weeks. Forcomparability purposes, where noted, some of the information discussed below is based upon comparison of the52 weeks ended February 2, 2008 and January 28, 2006 to the corresponding period ended January 27, 2007.
Trends and uncertainties
We have identified the following key uncertainties whose fluctuations may have a material effect on ouroperating results.
• Cash flow—Cash from operating activities is a primary source of liquidity that is adversely affectedwhen the industry faces market driven challenges and new and existing competitors seek areas ofgrowth to expand their businesses.
• Pricing—If our customers do not purchase our merchandise offerings in sufficient quantities, werespond by taking markdowns. If we have to reduce our prices, the cost of goods sold on our incomestatement will correspondingly rise, thus reducing our income.
• Success of brand—The success of our exclusive brand merchandise is dependent upon customerfashion preferences.
• Store growth—Our growth is dependent on a number of factors which could prevent the opening ofnew stores, such as identifying suitable markets and locations.
• Sourcing—Store merchandise is dependent upon adequate and stable availability of materials andproduction facilities from which the Company sources its merchandise.
2008 Estimates
A summary of estimates on key financial measures for fiscal 2008 is shown below. There have been nochanges in the estimates for 2008 since the Company released its fourth quarter earnings on March 19, 2008.
2008Estimated
2007Actual
(In millions of dollars)
Depreciation . . . . . . . . . . . . . . . . . . . . . . . . . . . . . . . . . . . . . . . . . . . . . . $285 $299Rental expense . . . . . . . . . . . . . . . . . . . . . . . . . . . . . . . . . . . . . . . . . . . . 62 60Interest and debt expense, net . . . . . . . . . . . . . . . . . . . . . . . . . . . . . . . . . 92 92Capital expenditures . . . . . . . . . . . . . . . . . . . . . . . . . . . . . . . . . . . . . . . . 215 396
General
Net sales. Net sales includes sales of comparable stores and non-comparable stores. Comparable store salesinclude sales for those stores which were in operation for a full period in both the current month and thecorresponding month for the prior year. Non-comparable store sales include sales in the current fiscal year from
13

stores opened during the previous fiscal year before they are considered comparable stores, sales from new storesopened in the current fiscal year and sales in the previous fiscal year for stores that were closed in the currentfiscal year.
Service charges and other income. Service charges and other income include income generated throughthe long-term marketing and servicing alliance between the Company and GE. Other income relates to rentalincome, shipping and handling fees and net lease income on leased departments.
Cost of sales. Cost of sales include the cost of merchandise sold (net of purchase discounts), bankcard fees,freight to the distribution centers, employee and promotional discounts, non-specific vendor allowances anddirect payroll for salon personnel.
Advertising, selling, administrative and general expenses. Advertising, selling, administrative andgeneral expenses include buying, occupancy, selling, distribution, warehousing, store and corporate expenses(including payroll and employee benefits), insurance, employment taxes, advertising, management informationsystems, legal and other corporate level expenses. Buying expenses consist of payroll, employee benefits andtravel for design, buying and merchandising personnel.
Depreciation and amortization. Depreciation and amortization expenses include depreciation andamortization on property and equipment.
Rentals. Rentals include expenses for store leases and data processing and equipment rentals.
Interest and debt expense, net. Interest and debt expense includes interest, net of interest income, relatingto the Company’s unsecured notes, mortgage notes, the Guaranteed Beneficial Interests in the Company’ssubordinated debentures, gains and losses on note repurchases, amortization of financing costs, call premiumsand interest on capital lease obligations.
Gain on disposal of assets. Gain on disposal of assets includes the net gain or loss on the sale or disposal ofproperty and equipment and joint ventures.
Asset impairment and store closing charges. Asset impairment and store closing charges consist of write-downs to fair value of under-performing properties and exit costs associated with the closure of certain stores.Exit costs include future rent, taxes and common area maintenance expenses from the time the stores are closed.
Equity in earnings of joint ventures. Equity in earnings of joint ventures includes the Company’s portionof the income or loss of the Company’s unconsolidated joint ventures.
Critical Accounting Policies and Estimates
The Company’s accounting policies are more fully described in Note 1 of Notes to Consolidated FinancialStatements. As disclosed in Note 1 of Notes to Consolidated Financial Statements, the preparation of financialstatements in conformity with accounting principles generally accepted in the United States of America(“GAAP”) requires management to make estimates and assumptions about future events that affect the amountsreported in the consolidated financial statements and accompanying notes. Since future events and their effectscannot be determined with absolute certainty, actual results will differ from those estimates. The Companyevaluates its estimates and judgments on an ongoing basis and predicates those estimates and judgments onhistorical experience and on various other factors that are believed to be reasonable under the circumstances.Actual results will differ from these under different assumptions or conditions.
Management of the Company believes the following critical accounting policies, among others, affect itsmore significant judgments and estimates used in preparation of the Consolidated Financial Statements.
14

Merchandise inventory. Approximately 98% of the inventories are valued at lower of cost or market usingthe retail last-in, first-out (“LIFO”) inventory method. Under the retail inventory method (“RIM”), the valuationof inventories at cost and the resulting gross margins are calculated by applying a calculated cost to retail ratio tothe retail value of inventories. RIM is an averaging method that is widely used in the retail industry due to itspracticality. Additionally, it is recognized that the use of RIM will result in valuing inventories at the lower ofcost or market if markdowns are currently taken as a reduction of the retail value of inventories. Inherent in theRIM calculation are certain significant management judgments including, among others, merchandise markon,markups, and markdowns, which significantly impact the ending inventory valuation at cost as well as theresulting gross margins. Management believes that the Company’s RIM provides an inventory valuation whichresults in a carrying value at the lower of cost or market. The remaining 2% of the inventories are valued at lowerof cost or market using the specific identified cost method. A 1% change in markdowns would have impacted netincome by approximately $18 million for the year ended February 2, 2008.
Revenue recognition. The Company recognizes revenue upon the sale of merchandise to its customers, netof anticipated returns. The provision for sales returns is based on historical evidence of our return rate. Werecorded an allowance for sales returns of $6.8 million and $7.2 million as of February 2, 2008 and February 3,2007, respectively. Adjustments to earnings resulting from revisions to estimates on our sales return provisionhave been insignificant for the years ended February 2, 2008, February 3, 2007 and January 28, 2006.
Prior to the sale of its credit card business to GE, finance charge revenue earned on customer accountsserviced by the Company under its proprietary credit card (“proprietary card”) program was recognized in theperiod in which it was earned. Beginning November 1, 2004, the Company’s share of income earned under thelong-term marketing and servicing alliance is included as a component of service charges and other income. TheCompany received income of approximately $119 million, $125 million and $105 million from GE in 2007, 2006and 2005, respectively. Further pursuant to this agreement, the Company has no continuing involvement otherthan to honor the proprietary cards in its stores. Although not obligated to a specific level of marketingcommitment, the Company participates in the marketing of the proprietary cards and accepts payments on theproprietary cards in its stores as a convenience to customers who prefer to pay in person rather than by mailingtheir payments to GE.
Merchandise vendor allowances. The Company receives concessions from its merchandise vendorsthrough a variety of programs and arrangements, including co-operative advertising, payroll reimbursements andmargin maintenance programs.
Cooperative advertising allowances are reported as a reduction of advertising expense in the period in whichthe advertising occurred. If vendor advertising allowances were substantially reduced or eliminated, theCompany would likely consider other methods of advertising as well as the volume and frequency of our productadvertising, which could increase or decrease our expenditures. Similarly, we are not able to assess the impact ofvendor advertising allowances on creating additional revenues, as such allowances do not directly generaterevenue for our stores.
Payroll reimbursements are reported as a reduction of payroll expense in the period in which thereimbursement occurred. All other merchandise vendor allowances are recognized as a reduction of costpurchases when received. Accordingly, a reduction or increase in vendor concessions has an inverse impact oncost of sales and/or selling and administrative expenses. The amounts recognized as a reduction in cost of saleshave not varied significantly over the past three fiscal years.
Insurance accruals. The Company’s consolidated balance sheets include liabilities with respect to self-insuredworkers’ compensation (with a self-insured retention of $4 million per claim) and general liability (with a self-insured retention of $1 million per claim) claims. The Company estimates the required liability of such claims,utilizing an actuarial method, based upon various assumptions, which include, but are not limited to, our historicalloss experience, projected loss development factors, actual payroll and other data. The required liability is also
15

subject to adjustment in the future based upon the changes in claims experience, including changes in the number ofincidents (frequency) and changes in the ultimate cost per incident (severity). As of February 2, 2008 and February 3,2007, insurance accruals of $55.8 million and $54.5 million, respectively, were recorded in trade accounts payableand accrued expenses and other liabilities. Adjustments resulting from changes in historical loss trends have reducedexpenses during the years ended February 2, 2008 and February 3, 2007, partially due to new Company programsthat have helped decrease both the number and cost of claims. Further, we do not anticipate any significant change inloss trends, settlements or other costs that would cause a significant change in our earnings. A 10% change in ourself-insurance reserve would have affected net earnings by $3.5 million for the fiscal year ended February 2, 2008.
Finite-lived assets. The Company’s judgment regarding the existence of impairment indicators is based onmarket and operational performance. We assess the impairment of long-lived assets, primarily fixed assets,whenever events or changes in circumstances indicate that the carrying value may not be recoverable. Factors weconsider important which could trigger an impairment review include the following:
• Significant changes in the manner of our use of assets or the strategy for our overall business;
• Significant negative industry or economic trends; or
• Store closings.
The Company performs an analysis of the anticipated undiscounted future net cash flows of the relatedfinite-lived assets. If the carrying value of the related asset exceeds the undiscounted cash flows, the carryingvalue is reduced to its fair value. Various factors including future sales growth and profit margins are included inthis analysis. To the extent these future projections or the Company’s strategies change, the conclusion regardingimpairment may differ from the current estimates.
Goodwill. The Company evaluates goodwill annually as of the last day of the fourth quarter and wheneverevents and changes in circumstances suggest that the carrying amount may not be recoverable from its estimatedfuture cash flows. To the extent these future projections or our strategies change, the conclusion regardingimpairment may differ from the current estimates.
Estimates of fair value are primarily determined using projected discounted cash flows and are based on ourbest estimate of future revenue and operating costs and general market conditions. These estimates are subject toreview and approval by senior management. This approach uses significant assumptions, including projectedfuture cash flows, the discount rate reflecting the risk inherent in future cash flows and a terminal growth rate.
Income taxes. Temporary differences arising from differing treatment of income and expense items for taxand financial reporting purposes result in deferred tax assets and liabilities that are recorded on the balance sheet.These balances, as well as income tax expense, are determined through management’s estimations, interpretationof tax law for multiple jurisdictions and tax planning. If the Company’s actual results differ from estimatedresults due to changes in tax laws, new store locations or tax planning, the Company’s effective tax rate and taxbalances could be affected. As such these estimates may require adjustment in the future as additional factsbecome known or as circumstances change.
The Financial Accounting Standards Board issued Interpretation No. 48, Accounting for Uncertainty inIncome Taxes—an Interpretation of FASB Statement No. 109 (“FIN 48”) effective for fiscal years beginning afterDecember 15, 2006. The Company adopted the new requirement as of February 4, 2007 with the cumulativeeffects recorded as an adjustment to retained earnings as of the beginning of the period of $0.8 million. TheCompany classifies interest expense and penalties relating to income tax in the financial statements as income taxexpense. The total amount of unrecognized tax benefits as of the date of adoption was $27.6 million, of which$17.8 million would, if recognized, affect the effective tax rate. The total amount of accrued interest and penaltyas of the date of adoption was $13.7 million. The total amount of unrecognized tax benefits as of February 2,2008 was $25.4 million, of which $16.9 million would, if recognized, affect the effective tax rate. The totalamount of accrued interest and penalties as of February 2, 2008 was $8.8 million.
16

The Company is currently being examined by the Internal Revenue Service for the fiscal tax years 2003through 2005. The Company is also under examination by various state and local taxing jurisdictions for variousfiscal years. The tax years that remain subject to examination for major tax jurisdictions are fiscal tax years 2003and forward, with the exception of fiscal 1997 through 2002 amended state and local tax returns related to thereporting of federal audit adjustments.
The Company has taken positions in certain taxing jurisdictions for which it is reasonably possible that thetotal amounts of unrecognized tax benefits may decrease within the next twelve months. The possible decreasecould result from the finalization of the Company’s federal and various state income tax audits. The Company’sfederal income tax audit uncertainties primarily relate to research and development credits, while various stateincome tax audit uncertainties primarily relate to income from intangibles. The estimated range of the reasonablypossible uncertain tax benefit decrease in the next twelve months is between $1 million and $5 million.
Discount rate. The discount rate that the Company utilizes for determining future pension obligations is basedon the Citigroup High Grade Corporate Yield Curve on its annual measurement date and is matched to the futureexpected cash flows of the benefit plans by annual periods. The discount rate had increased to 6.30% as ofFebruary 2, 2008 from 5.90% as of February 3, 2007. We believe that these assumptions have been appropriate andthat, based on these assumptions, the pension liability of $114 million is appropriately stated as of February 2, 2008;however, actual results may differ materially from those estimated and could have a material impact on ourconsolidated financial statements. A further 50 basis point change in the discount rate would generate an experiencegain or loss of approximately $8.0 million. We adopted SFAS No. 158, Employer's Accounting for Defined BenefitPension and Other Postretirement Plans—an amendment of FASB Statements No. 87, 88, 106, and 132(R) as ofFebruary 3, 2007 (see Note 9 in the Notes to Consolidated Financial Statements). The Company expects to make acontribution to the pension plan of approximately $4.0 million in fiscal 2008. The Company expects pensionexpense to be approximately $12.2 million in fiscal 2008 with a liability of $122.0 million at January 31, 2009.
RESULTS OF OPERATIONS
The following table sets forth the results of operations and percentage of net sales, for the periods indicated:
For the years ended
February 2, 2008 February 3, 2007 January 28, 2006
Amount% of
Net Sales Amount% of
Net Sales Amount% of
Net Sales
(in millions of dollars)
Net sales . . . . . . . . . . . . . . . . . . . . . . . . . . . . . . . . $7,207.4 100.0% $7,636.1 100.0% $7,551.7 100.0%Service charges and other income . . . . . . . . . . . . 163.4 2.3 174.0 2.3 142.9 1.9
7,370.8 102.3 7,810.1 102.3 7,694.6 101.9
Cost of sales . . . . . . . . . . . . . . . . . . . . . . . . . . . . . 4,786.7 66.4 5,032.4 65.9 5,014.0 66.4Advertising, selling, administrative and generalexpenses . . . . . . . . . . . . . . . . . . . . . . . . . . . . . . 2,065.3 28.7 2,096.0 27.5 2,041.5 27.0
Depreciation and amortization . . . . . . . . . . . . . . . 298.9 4.2 301.2 3.9 301.9 4.0Rentals . . . . . . . . . . . . . . . . . . . . . . . . . . . . . . . . . 60.0 0.8 55.5 0.7 47.5 0.6Interest and debt expense, net . . . . . . . . . . . . . . . 91.5 1.3 87.6 1.2 105.6 1.4Gain on disposal of assets . . . . . . . . . . . . . . . . . . (12.6) (0.2) (16.4) (0.2) (3.4) —Asset impairment and store closing charges . . . . 20.5 0.3 — — 61.7 0.8
Income before income taxes and equity inearnings of joint ventures . . . . . . . . . . . . . . . . 60.5 0.8 253.8 3.3 125.8 1.7
Income taxes . . . . . . . . . . . . . . . . . . . . . . . . . . . . 13.0 0.2 20.6 0.3 14.3 0.2Equity in earnings of joint ventures . . . . . . . . . . . 6.3 0.1 12.4 0.2 10.0 0.1
Net income . . . . . . . . . . . . . . . . . . . . . . . . . . . . . . $ 53.8 0.7% $ 245.6 3.2% $ 121.5 1.6%
17

Sales
The percent change by category in the Company’s sales for the past two years is as follows:
Percent Change
Fiscal2007-2006
Fiscal2007-2006*
Fiscal2006-2005
Fiscal2006-2005**
Cosmetics . . . . . . . . . . . . . . . . . . . . . . . . (5.0)% (3.7)% 1.3% 0.0%Ladies’ Apparel and Accessories . . . . . . (3.8) (2.2) 1.2 (0.5)Juniors’ and Children’s Apparel . . . . . . . (10.6) (9.2) (5.9) (7.3)Men’s Apparel and Accessories . . . . . . . (7.8) (5.6) 3.3 1.0Shoes . . . . . . . . . . . . . . . . . . . . . . . . . . . . (1.7) (0.2) 4.2 2.6Home and Other . . . . . . . . . . . . . . . . . . . (10.3) (8.9) (0.3) (1.8)
* Percent change based on 52 weeks ended February 2, 2008 and 52 weeks ended January 27, 2007.
** Percent changed based on 52 weeks ended January 27, 2007 and 52 weeks ended January 28, 2006.
The percent change by region in the Company’s sales for the past two years is as follows:
Percent Change
Fiscal2007-2006
Fiscal2007-2006*
Fiscal2006-2005
Fiscal2006-2005**
Eastern . . . . . . . . . . . . . . . . . . . . . . . . . . . (6.8)% (5.3)% 0.4% (1.2)%Central . . . . . . . . . . . . . . . . . . . . . . . . . . . (4.9) (3.2) 0.8 (0.9)Western . . . . . . . . . . . . . . . . . . . . . . . . . . (5.3) (3.7) 3.9 2.2
* Percent change based on 52 weeks ended February 2, 2008 and 52 weeks ended January 27, 2007.
** Percent change based on 52 weeks ended January 27, 2007 and 52 weeks ended January 28, 2006.
Sales decreased 6% during the 52 weeks ended February 2, 2008 compared to the 53 weeks endedFebruary 3, 2007 in both total and comparable stores. Sales declined 4% during the 52 weeks ended February 2,2008 compared to the 52 weeks ended January 27, 2007, and comparable store sales decreased 5% for the same52-week periods. During fiscal 2007, all categories experienced sales declines with the most significant declinesnoted in the juniors’ and children’s apparel and home and other categories while sales in the shoes category werenearly flat. All regions also experienced sales declines during fiscal 2007 while sales in the Central and Westernregions outperformed the sales in the Eastern region.
Sales increased 1% for the 53 weeks ended February 3, 2007 compared to the 52 weeks ended January 28,2006, and comparable store sales were unchanged on a percentage basis for the same periods. Sales declined 1%for the 52 weeks ended January 27, 2007 compared to the 52 weeks ended January 28, 2006 in both total andcomparable stores. During the 52 weeks ended January 27, 2007, sales were strongest in shoes with salesincreases also noted in the men’s apparel and accessories category. In the same 52-week period, sales were flat incosmetics while sales declined in the remaining merchandising categories with a significant decrease noted injuniors’ and children’s apparel. During the 52 weeks ended January 27, 2007, sales were strongest and increasedin the Western region while sales declined in the Central and Eastern regions.
During the year ended January 28, 2006, Hurricane Katrina, Hurricane Rita and Hurricane Wilma interruptedoperations in approximately 60 of the Company's stores for varying amounts of time. We are not able to determinewith any degree of certainty the impact that these hurricanes had on our results of operations. Property andmerchandise losses in the affected stores were covered by insurance. Our insurance coverage did not includebusiness interruption but did include a provision for reimbursement of the loss of inventory in excess of the carryingcost value. Our insurance coverage also covered losses sustained on damaged stores at replacement value. One storein Biloxi, Mississippi, not in operation during fiscal 2006 and 2007, re-opened in March 2008.
18

Sales penetration of exclusive brand merchandise for the fiscal years 2007, 2006 and 2005 was 24.2%,23.8% and 24.0% of total net sales, respectively.
Service Charges and Other Income
Dollar Change Percent Change
2007 2006 2005 2007-2006 2006-2005 2007-2006 2006-2005
(in millions of dollars)
Leased department income . . . . . . . . . . . $ 13.0 $ 10.4 $ 8.5 $ 2.6 $ 1.9 25.0% 22.4%Income from GE marketing andservicing alliance . . . . . . . . . . . . . . . . 118.8 124.6 104.8 (5.8) 19.8 (4.7) 18.9
Visa Check/Mastermoney Antitrustsettlement proceeds . . . . . . . . . . . . . . . — 6.5 — (6.5) 6.5 (100.0) —
Other . . . . . . . . . . . . . . . . . . . . . . . . . . . . 31.6 32.5 29.6 (0.9) 2.9 (2.8) 9.8
Total . . . . . . . . . . . . . . . . . . . . . . . . $163.4 $174.0 $142.9 $(10.6) $31.1 (6.1)% 21.8%
2007 Compared to 2006
Service charges and other income is composed primarily of income from the Company’s marketing andservicing alliance with GE Consumer Finance (“GE”). This marketing and servicing alliance began onNovember 1, 2004 in conjunction with the sale of our credit card business to GE and included income of $118.8million in fiscal 2007 compared to income of $124.6 million for fiscal 2006. This decrease of $5.8 million wasdue primarily to an increase in account write-offs.
Other items included in other income in fiscal 2007 included income of $13.0 million from leaseddepartments compared to $10.4 million of leased department income in fiscal 2006 due to the increased salesperformance of one of our leased departments.
2006 Compared to 2005
Service charges and other income included income from the marketing and servicing alliance with GE of$124.6 million in fiscal 2006 compared to income of $104.8 million for fiscal 2005. This increase of $19.8million was due primarily to an increase in finance charges due to higher receivable balances caused by aslowing in the rate of customers’ payments as a result of a change in payment terms by GE.
Other items included in other income in fiscal 2006 included $6.5 million of proceeds received from theVisa Check/Mastermoney Antitrust litigation settlement and income of $10.4 million from leased departmentscompared to $8.5 million of leased department income in fiscal 2005.
Cost of Sales
2007 Compared to 2006
Cost of sales as a percentage of sales increased to 66.4% of sales during fiscal 2007 from 65.9% during fiscal2006. Included in cost of sales during fiscal 2007 was a $4.1 million gain related to reimbursement for merchandiselosses incurred during the 2005 hurricane season. Exclusive of this gain, cost of sales as a percentage of sales was66.5% of sales during fiscal 2007. The gross margin decline of 60 basis points of sales was primarily driven byhigher markdowns as the Company responded to lackluster sales performance in an effort to maintain appropriateinventory control. The higher markdown activity was partially offset by higher markups. Total inventory atFebruary 2, 2008 compared to February 3, 2007 remained flat while inventory in comparable stores decreased 1%between the periods. All merchandise categories experienced declines in gross margin with the exception of men’sapparel and accessories which was up only slightly. The weakest performance was noted in the home and othercategory, which significantly exceeded the Company’s average decline for the year.
19

2006 Compared to 2005
Cost of sales as a percentage of sales decreased to 65.9% during fiscal 2006 compared with 66.4% for fiscal2005, resulting in gross margin improvement of 50 basis points of sales. Included in gross margin for fiscal 2005is a $29.7 million hurricane recovery gain related to insurance settlements received covering losses incurred inthe 2005 hurricane season. Excluding the effect of the hurricane gain which had an impact of 40 basis points ofsales, gross margin improved 90 basis points of sales as a result of lower levels of markdowns partially offset bylower markups during the year ended February 3, 2007 compared to the year ended January 28, 2006. Grossmargins were higher in cosmetics, ladies’ apparel and accessories, juniors’ and children’s apparel and shoescompared to the prior year with lower gross margins noted in men’s apparel and accessories and home and othercategories.
Expenses
2007 Compared to 2006
Advertising, selling, administrative and general (“SG&A”) increased to 28.7% of sales during fiscal 2007from 27.5% in fiscal 2006 while total dollars decreased by $30.7 million. Aside from the lack of sales leverage,the dollars decreased between the two periods primarily as a result of a $21.7 million charge in the prior year fora preliminary settlement agreement reached in a lawsuit filed on behalf of a putative class of former MercantileStores Pension Plan participants. This decrease was further enhanced by a decrease in payroll expense of $17.6million (primarily due to the addition of the 53rd week of fiscal 2006) and advertising savings of $7.8 million (aswe continue to reposition our advertising efforts toward the most appropriate media sources to reach our targetedcustomers) partially offset by an increase in services purchased of $11.0 million (as a result of increases in legaland transportation costs).
Depreciation and amortization expense decreased $2.3 million during fiscal 2007 to $298.9 million from$301.2 million in fiscal 2006. This decrease was primarily due to the addition of the 53rd week of fiscal 2006.
Rental expense increased to $60.0 million in fiscal 2007 or 0.8% of sales compared to $55.5 million or 0.7%of sales in fiscal 2006. This increase of $4.5 million was a result of higher equipment rent compared to the prioryear partially offset by a decline in the number of leased stores.
Interest and debt expense, net, increased to $91.5 million in fiscal 2007 compared to $87.6 million in fiscal2006. This increase of $3.9 million was primarily due to an interest credit in the prior year of $10.5 millionrelated to statute expirations and audit settlements with federal and state tax authorities for multiple tax years.Exclusive of this interest credit, net interest and debt expense decreased $6.6 million in fiscal 2007 compared tofiscal 2006 mainly due to lower weighted average total debt in the current year of $1.1 billion compared to $1.2billion in the prior year as well as an increase in capitalized interest of $2.0 million between the same periods.These decreases were partially offset by a decrease in investment income of $5 million in fiscal 2007 comparedto fiscal 2006.
Gain on disposal of assets decreased $3.8 million for the year ended February 2, 2008 to $12.6 millioncompared to $16.4 million for the prior year. The decrease was primarily due a pretax gain of $13.5 millionrecognized in the prior year related to the sale of the Company’s interest in the Yuma Palms joint venture for$20.0 million. The decrease between the periods was further enhanced by the Company’s sale of properties inLongmont, Colorado and Richardson, Texas in fiscal 2007 for $5.8 million, resulting in a net loss of $2.5 millionon the sales. These decreases were partially offset by a $14.1 million pretax gain recognized in the current yearrelating to hurricane recovery for two stores damaged by the hurricanes of 2005 as the Company completed thecleanup of the damaged locations during fiscal 2007.
Asset impairment and store closing charges were $20.5 million or 0.3% of sales during fiscal 2007. No assetimpairment and store closing charges were recorded during fiscal 2006. The 2007 charges consist of a write-off
20

of goodwill on one store of $2.6 million that was closed during the year, an accrual for future rent, property taxand utility payments on two stores of $1.0 million that were also closed during the year and a write-down ofproperty and equipment on 14 stores of $16.9 million that were closed, scheduled to close or impaired based onthe inability of the stores’ estimated future cash flows to sustain their carrying value. A breakdown of the assetimpairment and store closing charges for fiscal 2007 follows:
Number ofLocations
ImpairmentAmount
(in thousands of dollars)
Store closed in prior year . . . . . . . . . . . . . . . . . . . . . . . . . . . . . . . . . . . . . . . . . 1 $ 687Stores closed in fiscal 2007 . . . . . . . . . . . . . . . . . . . . . . . . . . . . . . . . . . . . . . . 4 3,647Stores to close in fiscal 2008 . . . . . . . . . . . . . . . . . . . . . . . . . . . . . . . . . . . . . . 5 5,083Stores impaired based on cash flows . . . . . . . . . . . . . . . . . . . . . . . . . . . . . . . . 6 9,113Non-operating facility . . . . . . . . . . . . . . . . . . . . . . . . . . . . . . . . . . . . . . . . . . . 1 1,970
Total . . . . . . . . . . . . . . . . . . . . . . . . . . . . . . . . . . . . . . . . . . . . . . . . . . . . . 17 $20,500
2006 Compared to 2005
Advertising, selling, administrative and general (“SG&A”) expenses increased to 27.5% of sales for fiscal2006 compared to 27.0% for fiscal 2005. During fiscal 2006, SG&A expenses increased $54.5 million primarilybecause of increases in payroll expense of $45.4 million, utilities expense of $12.0 million, and a $21.7 millioncharge for the Mercantile Stores Pension Plan settlement agreement. These increases were partially offset bysavings in advertising expenses of $23.3 million. The increase in payroll expense was due to an increase inincentive compensation to store managers, merchants and management due to improved company performanceduring fiscal 2006 as well as the addition of the 53rd week in fiscal 2006. The increase in utility expense was aresult of higher utility rates compared to the prior year in addition to the 53rd week in fiscal 2006. The savings inadvertising expense was mainly due to the repositioning of our advertising efforts toward the most appropriatemedia sources to reach our targeted customers.
Depreciation and amortization expense decreased slightly to 3.9% of sales for fiscal 2006 compared to 4.0%of sales in fiscal 2005.
Rental expense as a percentage of net sales was 0.7% for the year ended February 3, 2007 compared to 0.6%for the same period in fiscal 2005. The increase of $8.0 million in rental expense during fiscal 2006 was a resultof higher equipment rent compared to the prior year partially offset by a decline in the number of leased stores.
Interest and debt expense, net, decreased to 1.2% of sales for fiscal 2006 compared to 1.4% of sales forfiscal 2005 as a result of lower debt levels and due to an interest credit of $10.5 million related to statuteexpirations and audit settlements with federal and state tax authorities for multiple tax years. Interest and debtexpense declined $18.0 million during fiscal 2006. Average debt outstanding declined approximately $179million in fiscal 2006. The Company had maturities and repurchases of $200.2 million on various notes andmortgages during 2006.
During 2006, the Company sold its interest in a joint venture, Yuma Palms, for $20.0 million, andrecognized a gain of $13.5 million which is included in gain on disposal of assets.
No asset impairment and store closing charges were recorded during fiscal 2006 compared to $61.7 millionor 0.8% of sales recorded during fiscal 2005. The fiscal 2005 charge included a write-down to fair value forcertain under-performing properties. Included in asset impairment and store closing charges is a pretax loss onthe disposition of all the outstanding capital stock of an indirect wholly-owned subsidiary in the amount of $40.1million. The Company realized an income tax benefit of $45.4 million for the year ended January 28, 2006related to the sale of the subsidiary’s stock. The charge also consists of a write-down of goodwill on one store of
21

$1.0 million, an accrual for future rent, property tax and utility payments on four stores of $3.7 million and awrite-down of property and equipment on nine stores in the amount of $16.9 million. A breakdown of the assetimpairment and store closing charges for fiscal 2005 is as follows:
Number ofLocations
ImpairmentAmount
(in thousands of dollars)
Stores closed during fiscal 2005 . . . . . . . . . . . . . . . . . . . . . . . . . . . . . . . . . . . 5 $ 8,729Stores impaired based on cash flows . . . . . . . . . . . . . . . . . . . . . . . . . . . . . . . . 9 12,899Wholly-owned subsidiary . . . . . . . . . . . . . . . . . . . . . . . . . . . . . . . . . . . . . . . . 7 40,106
Total . . . . . . . . . . . . . . . . . . . . . . . . . . . . . . . . . . . . . . . . . . . . . . . . . . . . . 21 $61,734
Income Taxes
The federal and state income tax rates for fiscal 2007, 2006 and 2005, inclusive of equity in earnings of jointventures, were 19.5%, 7.7% and 10.5%, respectively.
During the year ended February 2, 2008, the Company recorded an income tax benefit relating to a netdecrease in FIN 48 liabilities of approximately $5.9 million, a recognition of tax benefits of approximately $1.7million for the change in a capital loss valuation allowance due to capital gain income, approximately $1.3million for a reduction in state tax liabilities due to a restructuring that occurred during this period andapproximately $3.3 million due to federal tax credits. During fiscal 2007, the IRS continued an examination ofthe Company’s federal income tax returns for fiscal years 2003 through 2005. The Company is also underexamination by various state and local taxing jurisdictions for various fiscal years.
During the year ended February 3, 2007, income taxes included a $57.2 million reduction of reserves forvarious federal and state tax contingencies, a $3.5 million increase in deferred liabilities due to an increase in thestate effective tax rate, and a $24.4 million tax benefit related to the decrease in a capital loss valuation allowancedue to capital gain income.
LIQUIDITY AND CAPITAL RESOURCES
Financial Position Summary
2007 2006DollarChange
PercentChange
(in thousands of dollars)
Cash and cash equivalents . . . . . . . . . . . . . . . . . . . . . . . . . . . . . . $ 88,912 $ 193,994 $(105,082) (54.2)%Other short-term borrowings . . . . . . . . . . . . . . . . . . . . . . . . . . . . 195,000 — 195,000 —Current portion of long-term debt . . . . . . . . . . . . . . . . . . . . . . . . 196,446 100,635 95,811 95.2Long-term debt . . . . . . . . . . . . . . . . . . . . . . . . . . . . . . . . . . . . . . . 760,165 956,611 (196,446) (20.5)Guaranteed Beneficial Interests . . . . . . . . . . . . . . . . . . . . . . . . . . 200,000 200,000 — —Stockholders’ equity . . . . . . . . . . . . . . . . . . . . . . . . . . . . . . . . . . . 2,514,111 2,579,789 (65,678) (2.5)
Current ratio . . . . . . . . . . . . . . . . . . . . . . . . . . . . . . . . . . . . . . . . . 1.64 2.10Debt to capitalization . . . . . . . . . . . . . . . . . . . . . . . . . . . . . . . . . . 35.0% 32.8%
The Company’s current non-operating priorities for its use of cash are:
• Strategic investments to enhance the value of existing properties;
• Construction of new stores;
22
• Investment in high-return capital projects, particularly in investments in technology to improvemerchandising and distribution, reduce costs, to improve efficiencies or to help the Company betterserve its customers;
• Debt reduction;
• Stock repurchase plan; and
• Dividend payments to shareholders.
Cash flows for the three fiscal years ended were as follows:
Percent Change
2007 2006 2005 2007-2006 2006-2005
(in thousands of dollars)
Operating Activities . . . . . . . . . . . . . . . . . . . . . . . . . . $ 254,449 $ 360,582 $ 369,142 (29.4)% (2.3)%Investing Activities . . . . . . . . . . . . . . . . . . . . . . . . . . . (331,987) (266,345) (297,608) (24.7) 10.5Financing Activities . . . . . . . . . . . . . . . . . . . . . . . . . . (27,544) (200,083) (269,942) 86.2 25.9
Total Cash Used . . . . . . . . . . . . . . . . . . . . . . . . . $(105,082) $(105,846) $(198,408)
Operating Activities
The primary source of the Company’s liquidity is cash flows from operations. Due to the seasonality of theCompany’s business, it has historically realized a significant portion of the cash flows from operating activitiesduring the second half of the fiscal year. Retail sales are the key operating cash component providing 97.8% oftotal revenues over the past two years.
GE Consumer Finance (“GE”) owns and manages the Company’s private label credit card business under along-term marketing and servicing alliance (“alliance”) that expires in fiscal 2014. The alliance provides for certainpayments to be made by GE to the Company, including a revenue sharing and marketing reimbursement. The cashflows that the Company receives under this alliance have been greater than the net cash flows provided by theCompany’s credit business prior to its sale to GE in 2004 due to quicker cash receipts. The Company receivedincome of approximately $119 million and $125 million from GE in fiscal 2007 and 2006. While the Company doesnot expect future cash flows under this alliance to vary significantly from historical levels, future amounts aredifficult to predict. The amount the Company receives is dependent on the level of sales on GE accounts, the levelof balances carried on the GE accounts by GE customers, payment rates on GE accounts, finance charge rates andother fees on GE accounts, the level of credit losses for the GE accounts as well as GE’s funding costs.
Operating cash inflows also include revenue and reimbursements from the long-term marketing andservicing alliance with GE and cash distributions from joint ventures. Operating cash outflows include paymentsto vendors for inventory, services and supplies, payments to employees, and payments of interest and taxes.
Net cash flows from operations were $254.4 million for fiscal 2007 versus $360.6 million for fiscal 2006.Net income, as adjusted for non-cash items, was $140 million lower in fiscal 2007 than in fiscal 2006 primarilyas a result of lower net income. Operating cash flows from changes in operating assets and liabilities werepositively impacted by $28 million in fiscal 2007 versus fiscal 2006, mainly due to the changes in current assetsthat were impacted by the hurricane insurance receivable from the prior year for inventory and property damagesincurred during the 2005 hurricane season and the receipt of related proceeds in the current year.
We received insurance proceeds of $5.9 million and $83.4 million during fiscal 2007 and 2005, respectively,related to the hurricane damaged inventory. Combined with the hurricane insurance proceeds recorded ininvesting activities, the Company recorded related gains in fiscal 2007 of $14.1 million and $4.1 million in gainon disposal of assets and cost of sales, respectively. The Company recorded a related gain of $29.7 million in2005 in cost of sales.
23

Investing Activities
Cash inflows from investing activities generally include proceeds from sales of property and equipment andjoint ventures. Investment cash outflows generally include payments for capital expenditures such as propertyand equipment.
Capital expenditures were $396.3 million for 2007. These expenditures consisted primarily of theconstruction of new stores, remodeling of existing stores and investments in technology equipment and software.Store openings and closures during fiscal 2007 were:
New Locations—Fiscal 2007 City Square Feet
Eastland Mall . . . . . . . . . . . . . . . . . . . . . . . . Evansville, Indiana 180,000Stones River Mall* . . . . . . . . . . . . . . . . . . . . Murfreesboro, Tennessee 145,000Alamance Crossing . . . . . . . . . . . . . . . . . . . . Burlington, North Carolina 126,000Stonebriar Centre . . . . . . . . . . . . . . . . . . . . . Frisco, Texas 200,000Ashley Park . . . . . . . . . . . . . . . . . . . . . . . . . . Newnan, Georgia 162,000Hill Country Galleria . . . . . . . . . . . . . . . . . . West Austin, Texas 145,000Fallen Timbers* . . . . . . . . . . . . . . . . . . . . . . Toledo, Ohio 155,000Santan Village . . . . . . . . . . . . . . . . . . . . . . . . Gilbert, Arizona 155,000Promenade at Casa Grande . . . . . . . . . . . . . . Casa Grande, Arizona 98,000
Total new square footage . . . . . . . . . . . 1,366,000
Closed Locations—Fiscal 2007 City Square Feet
Stones River Mall* . . . . . . . . . . . . . . . . . . . . Murfreesboro, Tennessee 110,000Shively Center . . . . . . . . . . . . . . . . . . . . . . . . Louisville, Kentucky 156,000Midway Mall . . . . . . . . . . . . . . . . . . . . . . . . . Elyria, Ohio 158,000Crestwood Plaza . . . . . . . . . . . . . . . . . . . . . . St. Louis, Missouri 170,000Bellevue Mall . . . . . . . . . . . . . . . . . . . . . . . . Nashville, Tennessee 170,000Southwyck Shopping Center* . . . . . . . . . . . Toledo, Ohio 180,000Eastland Mall (clearance center) . . . . . . . . . Tulsa, Oklahoma 160,000Southwest Center . . . . . . . . . . . . . . . . . . . . . Dallas, Texas 160,000National Hills Shopping Center . . . . . . . . . . Augusta, Georgia 88,000Tallahassee Mall . . . . . . . . . . . . . . . . . . . . . . Tallahassee, Florida 170,000Ashtabula Mall . . . . . . . . . . . . . . . . . . . . . . . Ashtabula, Ohio 70,000
Total closed square footage . . . . . . . . . 1,592,000
* replacement store
One location in Biloxi, Mississippi that was closed during fiscal 2006 as a result of Hurricane Katrina wasstill under reconstruction during fiscal 2007. This store re-opened in March 2008 as planned.
Capital expenditures for 2008 are expected to be approximately $215 million. These expenditures includethe openings of nine locations, in addition to the store that re-opened in Biloxi, Mississippi, totalingapproximately 1.3 million square feet. Historically, we have financed such capital expenditures with cash flowfrom operations. We expect that we will continue to finance capital expenditures in this manner during fiscal2008.
We received insurance proceeds of $16.1 million, $27.8 million and $26.7 million during fiscal 2007, 2006and 2005, respectively, for the construction of property and fixtures for stores damaged during the 2005hurricane season.
24

We have approximately 95 stores along the Gulf and Atlantic coasts that will not be covered by third partyinsurance but will rather be self-insured for property and merchandise losses related to “named storms” in fiscal2008. Therefore, repair and replacement costs will be borne by us for damage to any of these stores from “namedstorms” in fiscal 2008. We have created early response teams to assess and coordinate cleanup efforts shouldsome stores be impacted by storms. We have also redesigned certain store features to lessen the impact of stormsand have equipment available to assist in the efforts to ready the stores for normal operations.
During fiscal 2007, 2006 and 2005, we received proceeds from the sale of property and equipment of $48.2million, $6.5 million and $103.6 million, respectively, and recorded a related loss in operating activities of $1.5million for fiscal 2007 and related gains of $2.6 million and $3.4 million for fiscal 2006 and 2005, respectively.During 2005, we received cash proceeds of $14.0 million and a $3.0 million promissory note from the sale of asubsidiary and also received $14.1 million as a return of capital from a joint venture.
Financing Activities
Our primary source of cash inflows from financing activities is our $1.2 billion revolving credit facility.Financing cash outflows generally include the repayment of borrowings under the revolving credit facility, therepayment of mortgage notes or long-term debt, the payment of dividends and the purchase of treasury stock.
Revolving Credit Agreement. At February 2, 2008, we maintained a $1.2 billion revolving credit facility(“credit agreement”) with JPMorgan Chase Bank (“JPMorgan”) as agent for various banks, secured by theinventory of Dillard’s, Inc. operating subsidiaries. The credit agreement expires December 12, 2012. Borrowingsunder the credit agreement accrue interest at either JPMorgan’s Base Rate minus 0.5% or LIBOR plus 1.0%(4.14% at February 2, 2008) subject to certain availability thresholds as defined in the credit agreement.Availability for borrowings and letter of credit obligations under the credit agreement is limited to 85% of theinventory of certain Company subsidiaries (approximately $1.0 billion at February 2, 2008). At February 2, 2008,borrowings of $195 million were outstanding and letters of credit totaling $72.5 million were issued under thisfacility leaving unutilized availability under the facility of $768 million. There are no financial covenantrequirements under the credit agreement provided availability exceeds $100 million. We pay an annualcommitment fee to the banks of 0.25% of the committed amount less outstanding borrowings and letters ofcredit. Weighted average borrowings during fiscal 2007 were $108.3 million compared to $10.6 million duringfiscal 2006.
Long-term Debt. At February 2, 2008, the Company had $957 million of unsecured notes and a mortgagenote outstanding. The unsecured notes bear interest at rates ranging from 6.30% to 9.50% with due dates from2008 through 2028, and the mortgage note bears interest at 9.25% with a due date of 2013. No notes wererepurchased during 2007 compared to repurchases of $1.7 million of outstanding, unsecured notes during fiscal2006. We reduced our net level of outstanding debt and capital leases during 2007 by $104.3 million compared toa reduction of $205.9 million in 2006. The decline in total debt for 2007 was due to regular maturities of anoutstanding note and mortgage. The 2006 reduction was due to both maturities and repurchases of variousoutstanding notes and mortgages. Maturities of long-term debt over the next five years are $196 million, $25million, $1 million, $57 million and $56 million.
Stock Repurchase. During 2006, the Company repurchased 133,500 shares for $3.3 million under the 2005stock repurchase plan (“2005 plan”) which was approved by the board of directors in May 2005 and authorizedthe repurchase of up to $200 million of its Class A Common Stock. During 2007, the Company repurchased5.2 million shares under the 2005 plan for $111.6 million which completed the authorization under this plan.
In November 2007, the Company’s Board of Directors authorized a new share repurchase plan under whichthe Company may repurchase up to $200 million of its Class A common stock. The new open-endedauthorization permits the Company to repurchase its Class A common stock in the open market or throughprivately negotiated transactions.
25

Guaranteed Beneficial Interests in the Company’s Subordinated Debentures. The Company has $200million liquidation amount of 7.5% Capital Securities, due August 1, 2038 representing the beneficial ownershipinterest in the assets of Dillard’s Capital Trust I, a consolidated entity of the Company.
Fiscal 2008
During fiscal 2008, the Company expects to finance its capital expenditures and its working capitalrequirements including required debt repayments and stock repurchases, if any, from cash on hand, cash flowsgenerated from operations and utilization of the credit facility. The peak borrowings incurred under the creditfacilities were $430 million during 2007 and are expected to be approximately $550 million during fiscal 2008.The Company attributes the increase to the maturity of a $100 million note outstanding occurring during the peakborrowing season. Depending on conditions in the capital markets and other factors, the Company will from timeto time consider possible financing transactions, the proceeds of which could be used to refinance currentindebtedness or other corporate purposes.
OFF-BALANCE-SHEET ARRANGEMENTS
The Company has not created, and is not party to, any special-purpose or off-balance-sheet entities for thepurpose of raising capital, incurring debt or operating the Company’s business. The Company does not have anyarrangements or relationships with entities that are not consolidated into the financial statements that arereasonably likely to materially affect the Company’s liquidity or the availability of capital resources.
CONTRACTUAL OBLIGATIONS AND COMMERCIAL COMMITMENTS
To facilitate an understanding of the Company’s contractual obligations and commercial commitments, thefollowing data is provided:
PAYMENTS DUE BY PERIOD
TotalLess than1 year 1-3 years 3-5 years
More than5 years
(in thousands of dollars)
Contractual ObligationsLong-term debt . . . . . . . . . . . . . . . . . . . . . . . . . . $ 956,611 $ 196,446 $ 25,490 $113,043 $ 621,632Interest on long-term debt . . . . . . . . . . . . . . . . . . 752,247 62,209 110,554 100,627 478,857Guaranteed beneficial interests in theCompany’s subordinated debentures . . . . . . . 200,000 — — — 200,000
Interest on guaranteed beneficial interests in theCompany’s subordinated debentures . . . . . . . 457,356 14,918 29,918 30,164 382,356
Other short-term borrowings . . . . . . . . . . . . . . . . 195,000 195,000 — — —Capital lease obligations, including interest . . . . 41,243 4,684 7,197 17,296 12,066Defined benefit plan payments . . . . . . . . . . . . . . 113,715 3,961 10,254 10,450 89,050Purchase obligations (1) . . . . . . . . . . . . . . . . . . . 1,524,916 1,524,916 — — —Operating leases (2) . . . . . . . . . . . . . . . . . . . . . . . 255,691 56,065 87,339 79,144 33,143
Total contractual cash obligations (3) (4) . . . . . . $4,496,779 $2,058,199 $270,752 $350,724 $1,817,104
(1) The Company’s purchase obligations principally consist of purchase orders for merchandise and storeconstruction commitments. Amounts committed under open purchase order for merchandise inventoryrepresent $1.4 billion of the purchase obligations, of which a significant portion are cancelable withoutpenalty prior to a date that precedes the vendor’s scheduled shipment date.
(2) The operating leases included in the above table do not include contingent rent based upon sales volume,which represented approximately 10% of minimum lease obligations in fiscal 2007.
26

(3) The total liability for Financial Accounting Standards Board (FASB) Interpretation No. 48, Accounting forUncertainty in Income Taxes (FIN 48) uncertain tax positions is approximately $34.2 million, including tax,penalty and interest (refer to Note 7 to the consolidated financial statements). We are not able to reasonablyestimate the timing of future cash flows and have excluded these liabilities from the table above; however,at this time, we do not expect a significant payment relating to these obligations within the next year.
(4) Other long-term liabilities consist of workers’ compensation and general liability insurance reserves. We areunable to reasonably estimate the timing of future cash flows for the remaining balance and have excludedthis in the table above.
AMOUNT OF COMMITMENT EXPIRATION PER PERIOD
TotalAmountsCommitted Within 1 year 2-3 years 4-5 years
After 5years
(in thousands of dollars)
Other Commercial Commitments$1.2 billion line of credit, none outstanding (1) . . . . . . . . . $ — $ — $ — $— $—Standby letters of credit . . . . . . . . . . . . . . . . . . . . . . . . . . . 66,025 63,025 3,000 — —Import letters of credit . . . . . . . . . . . . . . . . . . . . . . . . . . . . 6,512 6,512 — — —
Total commercial commitments . . . . . . . . . . . . . . . . . . . . . $72,537 $69,537 $3,000 $— $—
(1) Availability under the credit facility is limited to 85% of the inventory of certain Company subsidiaries(approximately $1.0 billion at February 2, 2008) which has not been reduced by outstanding short-termborrowings of $195.0 million or outstanding letters of credit of $72.5 million.
NEW ACCOUNTING PRONOUNCEMENTS
In December 2007, the Financial Accounting Standards Board (“FASB”) issued the Statement of FinancialAccounting Standards (“SFAS”) No. 141(R), Business Combinations (“SFAS 141(R)”). SFAS 141(R)'s objectiveis to improve the relevance, representational faithfulness, and comparability of the information that a reportingentity provides in its financial reports about a business combination and its effects. SFAS 141(R) appliesprospectively to business combinations for which the acquisition date is on or after December 31, 2008. Weexpect that the adoption of SFAS 141(R) will not have a material impact on our consolidated financialstatements.
In December 2007, the FASB issued the SFAS No. 160, Noncontrolling Interest in Consolidated FinancialStatements (“SFAS 160”). SFAS 160's objective is to improve the relevance, comparability, and transparency ofthe financial information that a reporting entity provides in its consolidated financial statements by establishingaccounting and reporting standards for the noncontrolling interest in a subsidiary and for the deconsolidation of asubsidiary. SFAS 160 will be effective for fiscal years and interim periods within those fiscal years, beginning onor after December 15, 2008. We expect that the adoption of SFAS 160 will not have a material impact on ourconsolidated financial statements.
In February 2007, the FASB issued SFAS No. 159, The Fair Value Option for Financial Assets andFinancial Liabilities—Including an amendment of FASB Statement No. 115 (“SFAS 159”). This statementpermits entities to choose to measure many financial instruments and certain other items at fair value. SFAS 159is effective at the beginning of an entity’s first fiscal year that begins after November 15, 2007. We expect thatthe adoption of SFAS 159 will not have a material impact on our consolidated financial statements.
In September 2006, the FASB issued SFAS No. 157, Fair Value Measurements (“SFAS 157”). Thisstatement defines fair value, establishes a framework for measuring fair value in generally accepted accountingprinciples, and expands disclosures about fair value measurements. This statement applies under other
27

accounting pronouncements that require or permit fair value measurements, the FASB having concluded in thoseother accounting pronouncements that fair value is the relevant measurement attribute. This statement is effectivefor financial assets and liabilities in financial statements issued for fiscal years beginning after November 15,2007. It is effective for non-financial assets and liabilities in financial statements issued for fiscal years beginningafter November 15, 2008. We expect that the adoption of SFAS 157 will not have a material impact on ourconsolidated financial statements.
In December 2007, the Securities and Exchange Commission (“SEC”) issued Staff Accounting Bulletin(“SAB”) No. 110 to extend the use of “simplified method” for estimating the expected terms of “plain vanilla”employee stock options for the awards valuation. The method was initially allowed under SAB 107 incontemplation of the adoption of SFAS 123(R) to expense the compensation cost based on the awards grant datefair value. SAB 110 does not provide an expiration date for the use of the method. However, as more externalinformation about exercise behavior will be available over time, it is expected that this method will not be usedwhen more relevant information is available.
In February 2008, the FASB issued FSP SFAS 157-2, Effective Date for FASB Statement No. 157. This FSPpermits the delayed application of SFAS 157 for all nonrecurring fair value measurements of nonfinancial assetsand nonfinancial liabilities until fiscal years beginning after November 15, 2008. The Company has chosen toadopt SFAS 157 in accordance with the guidance of FSP SFAS 157-2 as stated above.
FORWARD-LOOKING INFORMATION
This report contains certain forward-looking statements. The following are or may constitute forwardlooking statements within the meaning of the Private Securities Litigation Reform Act of 1995: (a) Words suchas “may,” “will,” “could,” “believe,” “expect,” “future,” “potential,” “anticipate,” “intend,” “plan,” “estimate,”“continue,” or the negative or other variations thereof, and (b) statements regarding matters that are not historicalfacts. The Company cautions that forward-looking statements contained in this report are based on estimates,projections, beliefs and assumptions of management and information available to management at the time of suchstatements and are not guarantees of future performance. The Company disclaims any obligation to update orrevise any forward-looking statements based on the occurrence of future events, the receipt of new information,or otherwise. Forward-looking statements of the Company involve risks and uncertainties and are subject tochange based on various important factors. Actual future performance, outcomes and results may differmaterially from those expressed in forward-looking statements made by the Company and its management as aresult of a number of risks, uncertainties and assumptions, including the matters described under the caption“Risk Factors” above. Representative examples of those factors include (without limitation) general retailindustry conditions and macro-economic conditions; economic and weather conditions for regions in which theCompany’s stores are located and the effect of these factors on the buying patterns of the Company’s customers,including the effect of changes in changes in prices and availability of oil and natural gas; the impact ofcompetitive pressures in the department store industry and other retail channels including specialty, off-price,discount, internet, and mail-order retailers; changes in consumer spending patterns, debt levels and their ability tomeet credit obligations; adequate and stable availability of materials, production facilities and labor from whichthe Company sources its merchandise; changes in operating expenses, including employee wages, commissionstructures and related benefits; system failures or data security; possible future acquisitions of store propertiesfrom other department store operators; the continued availability of financing in amounts and at the termsnecessary to support the Company’s future business; fluctuations in LIBOR and other base borrowing rates;potential disruption from terrorist activity and the effect on ongoing consumer confidence; epidemic, pandemicor other public health issues; potential disruption of international trade and supply chain efficiencies; worldconflict and the possible impact on consumer spending patterns and other economic and demographic changes ofsimilar or dissimilar nature.
28

ITEM 7A.QUANTITATIVE AND QUALITATIVE DISCLOSURES ABOUTMARKET RISK.
The table below provides information about the Company’s obligations that are sensitive to changes ininterest rates. The table presents maturities of the Company’s long-term debt and Guaranteed Beneficial Interestsin the Company’s Subordinated Debentures along with the related weighted-average interest rates by expectedmaturity dates.
Expected Maturity Date (fiscal year) 2008 2009 2010 2011 2012 Thereafter Total Fair Value
(in thousands of dollars)Long-term debt . . . . . . . . . . . . . . . . . . . . . . . $196,446 $24,653 $837 $56,667 $56,376 $621,632 $956,611 $835,833Average fixed interest rate . . . . . . . . . . . . . . . 6.5% 9.5% 9.3% 9.1% 7.9% 7.3% 7.3%Guaranteed Beneficial Interests in theCompany’s Subordinated Debentures . . . . $ — $ — $— $ — $ — $200,000 $200,000 $166,240
Average interest rate . . . . . . . . . . . . . . . . . . . — % — % — % — % — % 7.5% 7.5%
The Company is exposed to market risk from changes in the interest rates under its $1.2 billion revolvingcredit facility. Outstanding balances under this facility bear interest at a variable rate based on JPMorgan’s BaseRate minus 0.5% or LIBOR plus 1.0%. The Company had average borrowings of $108.3 million during fiscal2007. Based on the average amount outstanding during fiscal 2007, a 100 basis point change in interest rateswould result in an approximate $1.1 million annual change to interest expense.
ITEM 8. FINANCIAL STATEMENTS AND SUPPLEMENTARY DATA.
The consolidated financial statements of the Company and notes thereto are included in this reportbeginning on page F-1.
ITEM 9. CHANGES IN AND DISAGREEMENTSWITH ACCOUNTANTS ON ACCOUNTING ANDFINANCIAL DISCLOSURE.
None.
ITEM 9A.CONTROLS AND PROCEDURES.
The Company maintains “disclosure controls and procedures,” as such term is defined in Rules 13a-15e and15d-15e of the Securities Exchange Act of 1934, as amended (the “Exchange Act”), that are designed to ensurethat information required to be disclosed in the Company’s reports, pursuant to the Exchange Act, is recorded,processed, summarized and reported within the time periods specified in the SEC’s rules and forms, and thatsuch information is accumulated and communicated to the Company’s management, including its ChiefExecutive Officer and Chief Financial Officer, as appropriate, to allow timely decisions regarding the requireddisclosures. In designing and evaluating the disclosure controls and procedures, management recognized that anycontrols and procedures, no matter how well-designed and operated, can provide only reasonable assurances ofachieving the desired control objectives, and management necessarily was required to apply its judgment inevaluating the cost-benefit relationship of possible controls and procedures.
As of February 2, 2008, the Company carried out an evaluation, with the participation of Company’smanagement, including William Dillard, II, Chairman of the Board of Directors and Chief Executive Officer(principal executive officer) and James I. Freeman, Senior Vice-President and Chief Financial Officer (principalfinancial officer), of the effectiveness of the Company’s “disclosure controls and procedures” pursuant toSecurities Exchange Act Rule 13a-15. Based on their evaluation, the principal executive officer and principalfinancial officer concluded that the Company’s disclosure controls and procedures are effective at the reasonableassurance level.
Management’s report on internal control over financial reporting and the attestation report of Deloitte &Touche LLP, the Company’s independent registered public accounting firm, on management’s assessment ofinternal control over financial reporting is incorporated herein by reference from pages F-3 and F-4 of this report.
29

William Dillard, II, Chairman of the Board of Directors and Chief Executive Officer, has certified to theNew York Stock Exchange that he is not aware of any violations by the Company of the exchange’s corporategovernance listing standards. Attached as an exhibit to this annual report is the certification of Mr. Dillardrequired under Section 302 of the Sarbanes-Oxley Act of 2002 regarding the quality of the Company’s publicdisclosures.
Changes in Internal Control over Financial Reporting
Except for the implementation of a control over the calculation and review of equity earnings of CDIContractors LLC, a 50%-owned, equity method joint venture investment of the Company that constructs storesfor the Company, there were no changes in the Company’s internal controls over financial reporting that occurredduring the quarter ended February 2, 2008 to which this report relates that have materially affected, or arereasonably likely to materially affect, the Company’s internal control over financial reporting.
ITEM 9B.OTHER INFORMATION.
None.
30

PART III
ITEM 10. DIRECTORS AND EXECUTIVE OFFICERS OF THE REGISTRANT.
A. Directors of the Registrant
Information regarding directors of the Registrant is incorporated herein by reference under the heading“Nominees for Election as Directors” and under the heading “Section 16(a) Beneficial Ownership ReportingCompliance” in the Proxy Statement.
B. Executive Officers of the Registrant
Information regarding executive officers of the Registrant is incorporated herein by reference to Part I ofthis report under the heading “Executive Officers of the Company.” Reference additionally is made to theinformation under the heading “Section 16(a) Beneficial Ownership Reporting Compliance” in the ProxyStatement, which information is incorporated herein by reference.
The Company’s Board of Directors has adopted a Company Code of Conduct that applies to all Companyemployees including the Company’s Directors, CEO and senior financial officers. The current version of suchCode of Conduct is available free of charge on Dillard’s, Inc. website, www.dillards.com, and is available inprint to any shareholder who requests copies by contacting Julie J. Bull, Director of Investor Relations, at theCompany's principal executive offices set forth above.
ITEM 11. EXECUTIVE COMPENSATION.
Information regarding executive compensation and compensation of directors is incorporated herein byreference to the information beginning under the heading “Compensation of Directors and Executive Officers”and concluding under the heading “Compensation of Directors” in the Proxy Statement.
ITEM 12. SECURITY OWNERSHIP OF CERTAIN BENEFICIAL OWNERS ANDMANAGEMENTAND RELATED STOCKHOLDERMATTERS.
Equity Compensation Plan Information
Number of securities to beissued upon exercise ofoutstanding options
Weighted averageexercise prices of
outstanding options
Number of securitiesavailable for futureissuance under equitycompensation plans
Equity compensation plansapproved by shareholders . . . . . 5,376,375 $25.92 6,195,445
Total . . . . . . . . . . . . . . . . . . . 5,376,375 $25.92 6,195,445
Additional Information regarding security ownership of certain beneficial owners and management isincorporated herein by reference to the information under the heading “Principal Holders of Voting Securities” andunder the heading “Security Ownership of Management” and continuing through footnote 12 in the Proxy Statement.
ITEM 13. CERTAIN RELATIONSHIPS AND RELATED TRANSACTIONS.
Information regarding certain relationships and related transactions is incorporated herein by reference tothe information under the heading “Certain Relationships and Transactions” in the Proxy Statement.
ITEM 14. PRINCIPAL ACCOUNTANT FEES AND SERVICES.
Information regarding principal accountant fees and services is incorporated herein by reference to theinformation under the heading “Independent Accountant Fees” in the Proxy Statement.
31

PART IV
ITEM 15. EXHIBITS.
(a)(1) and (2) Financial Statements
An “Index of Financial Statements” has been filed as a part of this Report beginning on page F-1 hereof.
(a)(3) Exhibits and Management Compensatory Plans
An “Exhibit Index” has been filed as a part of this Report beginning on page E-1 hereof and is hereinincorporated by reference.
32

SIGNATURES
Pursuant to the requirements of Section 13 or 15(d) of the Securities Exchange Act of 1934, the Registranthas duly caused this report to be signed on its behalf by the undersigned, thereunto duly authorized.
DILLARD’S, INC.Registrant
/S/ JAMES I. FREEMAN
Date: April 2, 2008
James I. Freeman,Senior Vice President and Chief Financial Officer
(Principal Financial and Accounting Officer)
Pursuant to the requirements of the Securities Exchange Act of 1934, this report has been signed below bythe following persons on behalf of the Registrant and in the capacity and on the date indicated.
/S/ ROBERT C. CONNOR /S/ DRUE CORBUSIER
Robert C. ConnorDirector
Drue CorbusierExecutive Vice President and Director
/S/ WILL D. DAVIS /S/ WILLIAM DILLARD, IIWill D. Davis
DirectorWilliam Dillard, II
Chairman of the Board andChief Executive Officer
(Principal Executive Officer)
/S/ ALEX DILLARD /S/ MIKE DILLARD
Alex DillardPresident and Director
Mike DillardExecutive Vice President and Director
/S/ JAMES I. FREEMAN /S/ JOHN PAUL HAMMERSCHMIDT
James I. FreemanSenior Vice President and
Chief Financial Officer and Director
John Paul HammerschmidtDirector
/S/ PETER R. JOHNSON /S/ WARREN A. STEPHENSPeter R. Johnson
DirectorWarren A. Stephens
Director
/S/ WILLIAM H. SUTTON /S/ J.C. WATTS, JR.William H. Sutton
DirectorJ.C. Watts, Jr.
Director
Date: April 2, 2008
33


INDEX OF FINANCIAL STATEMENTS AND FINANCIAL STATEMENT SCHEDULEDILLARD’S, INC. AND SUBSIDIARIES
Year Ended February 2, 2008
Page
Report of Independent Registered Public Accounting Firm . . . . . . . . . . . . . . . . . . . . . . . . . . . . . . . . . . . . F-2Management’s Report on Internal Control over Financial Reporting . . . . . . . . . . . . . . . . . . . . . . . . . . . . . F-3Report of Independent Registered Public Accounting Firm . . . . . . . . . . . . . . . . . . . . . . . . . . . . . . . . . . . . F-4Consolidated Balance Sheets – February 2, 2008 and February 3, 2007 (as Restated) . . . . . . . . . . . . . . . F-6Consolidated Statements of Operations – Fiscal years ended February 2, 2008, February 3, 2007, andJanuary 28, 2006 . . . . . . . . . . . . . . . . . . . . . . . . . . . . . . . . . . . . . . . . . . . . . . . . . . . . . . . . . . . . . . . . . . .
F-7
Consolidated Statements of Stockholders’ Equity and Comprehensive Income (Loss) – Fiscal yearsended February 2, 2008, February 3, 2007 (as Restated), and January 28, 2006 (as Restated) . . . . . . .
F-8
Consolidated Statements of Cash Flows – Fiscal years ended February 2, 2008, February 3, 2007, andJanuary 28, 2006 . . . . . . . . . . . . . . . . . . . . . . . . . . . . . . . . . . . . . . . . . . . . . . . . . . . . . . . . . . . . . . . . . . .
F-9
Notes to Consolidated Financial Statements – Fiscal years ended February 2, 2008, February 3, 2007,and January 28, 2006 . . . . . . . . . . . . . . . . . . . . . . . . . . . . . . . . . . . . . . . . . . . . . . . . . . . . . . . . . . . . . . . .
F-10
F-1

REPORT OF INDEPENDENT REGISTERED PUBLIC ACCOUNTING FIRM
To the Stockholders and Board of Directors of Dillard’s, Inc.Little Rock, Arkansas
We have audited the accompanying consolidated balance sheets of Dillard’s, Inc. and subsidiaries (the“Company”) as of February 2, 2008 and February 3, 2007, and the related consolidated statements of operations,stockholders’ equity and comprehensive income (loss), and cash flows for each of the three years in the periodended February 2, 2008. These financial statements are the responsibility of the Company’s management. Ourresponsibility is to express an opinion on these financial statements based on our audits.
We conducted our audits in accordance with the standards of the Public Company Accounting OversightBoard (United States). Those standards require that we plan and perform the audit to obtain reasonable assuranceabout whether the financial statements are free of material misstatement. An audit includes examining, on a testbasis, evidence supporting the amounts and disclosures in the financial statements. An audit also includesassessing the accounting principles used and significant estimates made by management, as well as evaluatingthe overall financial statement presentation. We believe that our audits provide a reasonable basis for ouropinion.
In our opinion, such consolidated financial statements present fairly, in all material respects, the financialposition of Dillard’s, Inc. and subsidiaries as of February 2, 2008 and February 3, 2007, and the results of theiroperations and their cash flows for each of the three years in the period ended February 2, 2008, in conformitywith accounting principles generally accepted in the United States of America.
As discussed in Note 1 to the Notes to Consolidated Financial Statements, (1) the Company adoptedFinancial Accounting Standards Board Interpretation No. 48, Accounting for Uncertainty in Income Taxes,effective February 4, 2007, (2) the Company adopted Statement of Financial Accounting Standards No. 158,Employers’ Accounting for Defined Benefit Pension and Other Postretirement Plans, relating to the recognitionand related disclosure provisions, effective February 3, 2007, and (3) the Company adopted Statement ofFinancial Accounting Standards No. 123(R), Share-Based Payment, as revised, effective January 29, 2006.
We have also audited, in accordance with the standards of the Public Company Accounting Oversight Board(United States), the Company’s internal control over financial reporting as of February 2, 2008, based on thecriteria established in Internal Control—Integrated Framework issued by the Committee of SponsoringOrganizations of the Treadway Commission and our report dated April 2, 2008 expressed an unqualified opinionon the Company’s internal control over financial reporting.
/s/ DELOITTE & TOUCHE LLP
Deloitte & Touche LLPNew York, New YorkApril 2, 2008
F-2

MANAGEMENT’S REPORT ON INTERNAL CONTROL OVER FINANCIAL REPORTING
The financial statements, financial analysis and all other information in this Annual Report on Form 10-Kwere prepared by management, who is responsible for their integrity and objectivity and for establishing andmaintaining adequate internal controls over financial reporting.
The Company’s internal control over financial reporting is designed to provide reasonable assuranceregarding the reliability of financial reporting and the preparation of financial statements for external purposes inaccordance with accounting principles generally accepted in the United States of America. The Company’sinternal control over financial reporting includes those policies and procedures that:
i. pertain to the maintenance of records that, in reasonable detail, accurately and fairly reflect thetransactions and dispositions of assets of the Company;
ii. provide reasonable assurance that transactions are recorded as necessary to permit preparation offinancial statements in accordance with generally accepted accounting principles, and that receipts andexpenditures of the Company are being made only in accordance with authorizations of managementand directors of the Company; and
iii. provide reasonable assurance regarding prevention or timely detection of unauthorized acquisition, useor dispositions of the Company’s assets that could have a material effect on the financial statements.
There are inherent limitations in the effectiveness of any internal control, including the possibility of humanerror and the circumvention or overriding of controls. Accordingly, even effective internal controls can provideonly reasonable assurances with respect to financial statement preparation. Further, because of changes inconditions, the effectiveness of internal controls may vary over time.
Management assessed the design and effectiveness of the Company’s internal control over financialreporting as of February 2, 2008. In making this assessment, management used the criteria set forth by theCommittee of Sponsoring Organizations of the Treadway Commission (“COSO”) in Internal Control—Integrated Framework. Based on management’s assessment using those criteria, it believes that, as of February 2,2008, the Company’s internal control over financial reporting is effective.
Deloitte & Touche LLP, an independent registered public accounting firm, has audited the financialstatements of the Company for the fiscal years ended February 2, 2008, February 3, 2007, and January 28, 2006and has attested to management’s assertion regarding the effectiveness of the Company’s internal control overfinancial reporting as of February 2, 2008. Their report is presented on the following page. The independentregistered public accountants and internal auditors advise management of the results of their audits and makerecommendations to improve the system of internal controls. Management evaluates the audit recommendationsand takes appropriate action.
F-3

REPORT OF INDEPENDENT REGISTERED PUBLIC ACCOUNTING FIRM
To the Stockholders and Board of Directors of Dillard’s, Inc.Little Rock, Arkansas
We have audited Dillard’s, Inc. and its subsidiaries’ (the “Company’s”) internal control over financialreporting as of February 2, 2008 based on criteria established in Internal Control—Integrated Framework issuedby the Committee of Sponsoring Organizations of the Treadway Commission. The Company’s management isresponsible for maintaining effective internal control over financial reporting and for its assessment of theeffectiveness of internal control over financial reporting, included in the accompanying Management’s Report onInternal Control over Financial Reporting. Our responsibility is to express an opinion on the Company’s internalcontrol over financial reporting based on our audit.
We conducted our audit in accordance with the standards of the Public Company Accounting OversightBoard (United States). Those standards require that we plan and perform the audit to obtain reasonable assuranceabout whether effective internal control over financial reporting was maintained in all material respects. Ouraudit included obtaining an understanding of internal control over financial reporting, assessing the risk that amaterial weakness exists, testing and evaluating the design and operating effectiveness of internal control basedon that risk, and performing such other procedures as we considered necessary in the circumstances. We believethat our audit provides a reasonable basis for our opinion.
A company’s internal control over financial reporting is a process designed by, or under the supervision of,the company’s principal executive and principal financial officers, or persons performing similar functions, andeffected by the company’s board of directors, management, and other personnel to provide reasonable assuranceregarding the reliability of financial reporting and the preparation of financial statements for external purposes inaccordance with generally accepted accounting principles. A company’s internal control over financial reportingincludes those policies and procedures that (1) pertain to the maintenance of records that, in reasonable detail,accurately and fairly reflect the transactions and dispositions of the assets of the company; (2) provide reasonableassurance that transactions are recorded as necessary to permit preparation of financial statements in accordancewith generally accepted accounting principles, and that receipts and expenditures of the company are being madeonly in accordance with authorizations of management and directors of the company; and (3) provide reasonableassurance regarding prevention or timely detection of unauthorized acquisition, use, or disposition of thecompany’s assets that could have a material effect on the financial statements.
Because of the inherent limitations of internal control over financial reporting, including the possibility ofcollusion or improper management override of controls, material misstatements due to error or fraud may not beprevented or detected on a timely basis. Also, projections of any evaluation of the effectiveness of the internalcontrol over financial reporting to future periods are subject to the risk that the controls may become inadequatebecause of changes in conditions, or that the degree of compliance with the policies or procedures maydeteriorate.
In our opinion, the Company maintained, in all material respects, effective internal control over financialreporting as of February 2, 2008, based on the criteria established in Internal Control—Integrated Frameworkissued by the Committee of Sponsoring Organizations of the Treadway Commission.
We have also audited, in accordance with the standards of the Public Company Accounting Oversight Board(United States), the consolidated balance sheets as of February 2, 2008 and February 3, 2007 and the relatedconsolidated statements of operations, stockholders’ equity and comprehensive income (loss) and cash flows foreach of the three years in the period ended February 2, 2008 of the Company, and our report dated April 2, 2008
F-4
expressed an unqualified opinion and included an explanatory paragraph regarding the Company’s adoption ofFinancial Accounting Standards Board Interpretation No. 48, Accounting for Uncertainty in Income Taxes,effective February 4, 2007.
/s/ DELOITTE & TOUCHE LLP
Deloitte & Touche LLPNew York, New YorkApril 2, 2008
F-5

CONSOLIDATED BALANCE SHEETS
February 2,2008
February 3,2007
(As restated,see Note 2)
Dollars in ThousandsAssets
Current assets:Cash and cash equivalents . . . . . . . . . . . . . . . . . . . . . . . . . . . . . . . . . . . . . . . . . . . . $ 88,912 $ 193,994Accounts receivable . . . . . . . . . . . . . . . . . . . . . . . . . . . . . . . . . . . . . . . . . . . . . . . . . 10,880 10,508Merchandise inventories . . . . . . . . . . . . . . . . . . . . . . . . . . . . . . . . . . . . . . . . . . . . . 1,779,279 1,772,150Other current assets . . . . . . . . . . . . . . . . . . . . . . . . . . . . . . . . . . . . . . . . . . . . . . . . . 66,117 71,194
Total current assets . . . . . . . . . . . . . . . . . . . . . . . . . . . . . . . . . . . . . . . . . . . . . . 1,945,188 2,047,846
Property and equipment:Land and land improvements . . . . . . . . . . . . . . . . . . . . . . . . . . . . . . . . . . . . . . . . . . 83,346 89,451Buildings and leasehold improvements . . . . . . . . . . . . . . . . . . . . . . . . . . . . . . . . . . 3,117,292 2,931,244Furniture, fixtures and equipment . . . . . . . . . . . . . . . . . . . . . . . . . . . . . . . . . . . . . . 1,969,343 2,160,190Buildings under construction . . . . . . . . . . . . . . . . . . . . . . . . . . . . . . . . . . . . . . . . . . 96,057 56,856Buildings and equipment under capital leases . . . . . . . . . . . . . . . . . . . . . . . . . . . . . 48,910 48,910Less accumulated depreciation and amortization . . . . . . . . . . . . . . . . . . . . . . . . . . . (2,124,504) (2,140,025)
3,190,444 3,146,626
Goodwill . . . . . . . . . . . . . . . . . . . . . . . . . . . . . . . . . . . . . . . . . . . . . . . . . . . . . . . . . . . . . . 31,912 34,511Other assets . . . . . . . . . . . . . . . . . . . . . . . . . . . . . . . . . . . . . . . . . . . . . . . . . . . . . . . . . . . 170,585 167,752
Total assets . . . . . . . . . . . . . . . . . . . . . . . . . . . . . . . . . . . . . . . . . . . . . . . . . . . . . . . . . . . . $ 5,338,129 $ 5,396,735
Liabilities and stockholders’ equityCurrent liabilities:
Trade accounts payable and accrued expenses . . . . . . . . . . . . . . . . . . . . . . . . . . . . $ 753,309 $ 797,806Current portion of long-term debt . . . . . . . . . . . . . . . . . . . . . . . . . . . . . . . . . . . . . . 196,446 100,635Current portion of capital lease obligations . . . . . . . . . . . . . . . . . . . . . . . . . . . . . . . 2,613 3,679Other short-term borrowings . . . . . . . . . . . . . . . . . . . . . . . . . . . . . . . . . . . . . . . . . . 195,000 —Federal and state income taxes including current deferred taxes . . . . . . . . . . . . . . . 36,802 74,995
Total current liabilities . . . . . . . . . . . . . . . . . . . . . . . . . . . . . . . . . . . . . . . . . . . 1,184,170 977,115
Long-term debt . . . . . . . . . . . . . . . . . . . . . . . . . . . . . . . . . . . . . . . . . . . . . . . . . . . . . . . . . 760,165 956,611
Capital lease obligations . . . . . . . . . . . . . . . . . . . . . . . . . . . . . . . . . . . . . . . . . . . . . . . . . . 25,739 28,328
Other liabilities . . . . . . . . . . . . . . . . . . . . . . . . . . . . . . . . . . . . . . . . . . . . . . . . . . . . . . . . . 217,403 206,122
Deferred income taxes . . . . . . . . . . . . . . . . . . . . . . . . . . . . . . . . . . . . . . . . . . . . . . . . . . . 436,541 448,770
Operating leases and commitmentsGuaranteed preferred beneficial interests in the Company’s subordinated
debentures . . . . . . . . . . . . . . . . . . . . . . . . . . . . . . . . . . . . . . . . . . . . . . . . . . . . . . . . . . . 200,000 200,000
Stockholders’ equity:Common stock, Class A – 116,445,495 and 116,217,645 shares issued;
71,155,347 and 76,130,196 shares outstanding . . . . . . . . . . . . . . . . . . . . . . . . . . 1,165 1,162Common stock, Class B (convertible) – 4,010,929 shares issued and
outstanding . . . . . . . . . . . . . . . . . . . . . . . . . . . . . . . . . . . . . . . . . . . . . . . . . . . . . . 40 40Additional paid-in capital . . . . . . . . . . . . . . . . . . . . . . . . . . . . . . . . . . . . . . . . . . . . . 778,987 772,560Accumulated other comprehensive loss . . . . . . . . . . . . . . . . . . . . . . . . . . . . . . . . . . (22,211) (21,229)Retained earnings . . . . . . . . . . . . . . . . . . . . . . . . . . . . . . . . . . . . . . . . . . . . . . . . . . . 2,680,690 2,640,224Less treasury stock, at cost, Class A– 45,290,148 and 40,087,449 shares . . . . . . . . (924,560) (812,968)
Total stockholders’ equity . . . . . . . . . . . . . . . . . . . . . . . . . . . . . . . . . . . . . . . . 2,514,111 2,579,789
Total liabilities and stockholders’ equity . . . . . . . . . . . . . . . . . . . . . . . . . . . . . . . . . . . . . $ 5,338,129 $ 5,396,735
See notes to consolidated financial statements.
F-6

CONSOLIDATED STATEMENTS OF OPERATIONS
Years Ended
February 2,2008
February 3,2007
January 28,2006
Dollars in Thousands, Except Per Share Data
Net sales . . . . . . . . . . . . . . . . . . . . . . . . . . . . . . . . . . . . . . . . . . . . . . . . . . $7,207,417 $7,636,056 $7,551,697Service charges and other income . . . . . . . . . . . . . . . . . . . . . . . . . . . . . . . 163,389 174,011 142,948
7,370,806 7,810,067 7,694,645
Cost of sales . . . . . . . . . . . . . . . . . . . . . . . . . . . . . . . . . . . . . . . . . . . . . . . 4,786,655 5,032,351 5,014,021Advertising, selling, administrative and general expenses . . . . . . . . . . . . 2,065,288 2,096,018 2,041,481Depreciation and amortization . . . . . . . . . . . . . . . . . . . . . . . . . . . . . . . . . 298,927 301,147 301,864Rentals . . . . . . . . . . . . . . . . . . . . . . . . . . . . . . . . . . . . . . . . . . . . . . . . . . . . 59,987 55,480 47,538Interest and debt expense, net . . . . . . . . . . . . . . . . . . . . . . . . . . . . . . . . . . 91,556 87,642 105,570Gain on disposal of assets . . . . . . . . . . . . . . . . . . . . . . . . . . . . . . . . . . . . . (12,625) (16,413) (3,354)Asset impairment and store closing charges . . . . . . . . . . . . . . . . . . . . . . . 20,500 — 61,734
Income before income taxes and equity in earnings of joint ventures . . . 60,518 253,842 125,791Income taxes . . . . . . . . . . . . . . . . . . . . . . . . . . . . . . . . . . . . . . . . . . . 13,010 20,580 14,300Equity in earnings of joint ventures . . . . . . . . . . . . . . . . . . . . . . . . . 6,253 12,384 9,994
Net income . . . . . . . . . . . . . . . . . . . . . . . . . . . . . . . . . . . . . . . . . . . . . . . . $ 53,761 $ 245,646 $ 121,485
Earnings per common share:Basic . . . . . . . . . . . . . . . . . . . . . . . . . . . . . . . . . . . . . . . . . . . . . . . . . $ 0.69 $ 3.09 $ 1.49Diluted . . . . . . . . . . . . . . . . . . . . . . . . . . . . . . . . . . . . . . . . . . . . . . . . 0.68 3.05 1.49
See notes to consolidated financial statements.
F-7

CONSOLIDATED STATEMENTS OF STOCKHOLDERS’ EQUITY ANDCOMPREHENSIVE INCOME (LOSS)
Common Stock AdditionalPaid-inCapital
AccumulatedOther
Comprehen-sive Loss
RetainedEarnings
TreasuryStock TotalClass A Class B
Dollars in Thousands, Except Per Share DataBalance, January 29, 2005, as restatedSee Note 2 . . . . . . . . . . . . . . . . . . . . . . . . . $1,146 $ 40 $739,620 $(13,333) $2,298,829 $(708,769)$2,317,533
Net income . . . . . . . . . . . . . . . . . . . . . . — — — — 121,485 — 121,485Minimum pension liability adjustment,net of tax of $698 . . . . . . . . . . . . . . . — — — (1,241) — — (1,241)
Total comprehensive income . . . . . . . . 120,244Issuance of 655,858 shares under stockoption plan . . . . . . . . . . . . . . . . . . . . 7 — 9,448 — — — 9,455
Purchase of 4,567,100 shares oftreasury stock . . . . . . . . . . . . . . . . . . — — — — — (100,868) (100,868)
Cash dividends declared:Common stock, $0.16 per share . . . . . . — — — — (12,987) — (12,987)
Balance, January 28, 2006, as restatedSee Note 2 . . . . . . . . . . . . . . . . . . . . . . . . . 1,153 40 749,068 (14,574) 2,407,327 (809,637) 2,333,377
Net income . . . . . . . . . . . . . . . . . . . . . . — — — 245,646 — 245,646Minimum pension liability adjustment,net of tax of $153 . . . . . . . . . . . . . . . — — — 266 — — 266
Total comprehensive income . . . . . . . . 245,912Adoption of FAS 158, net of tax of$3,995 . . . . . . . . . . . . . . . . . . . . . . . . (6,921) (6,921)
Issuance of 980,263 shares under stockoption and stock bonus plans . . . . . . 9 — 23,492 — — — 23,501
Purchase of 133,500 shares of treasurystock . . . . . . . . . . . . . . . . . . . . . . . . . — — — — — (3,331) (3,331)
Cash dividends declared:Common stock, $0.16 per share . . . . . . — — — — (12,749) — (12,749)
Balance, February 3, 2007, as restatedSee Note 2 . . . . . . . . . . . . . . . . . . . . . . . . . 1,162 40 772,560 (21,229) 2,640,224 (812,968) 2,579,789
Net income . . . . . . . . . . . . . . . . . . . . . . — — — 53,761 — 53,761Change in unrecognized losses andprior service cost related to pensionplans, net of tax of $567 . . . . . . . . . . — — — (982) — — (982)
Total comprehensive income . . . . . . . . 52,779Issuance of 227,850 shares under stockoption and stock bonus plans . . . . . . 3 — 6,427 — — — 6,430
Purchase of 5,202,699 shares oftreasury stock . . . . . . . . . . . . . . . . . . — — — — — (111,592) (111,592)
Cumulative effect of accountingchange related to adoption ofFIN 48 . . . . . . . . . . . . . . . . . . . . . . . . — — — — (803) — (803)
Cash dividends declared:Common stock, $0.16 per share . . . . . . — — — — (12,492) — (12,492)
Balance, February 2, 2008 . . . . . . . . . . . . . . $1,165 $ 40 $778,987 $(22,211) $2,680,690 $(924,560)$2,514,111
See notes to consolidated financial statements.
F-8

CONSOLIDATED STATEMENTS OF CASH FLOWS
Years Ended
February 2,2008
February 3,2007
January 28,2006
Dollars in ThousandsOperating activities:Net income . . . . . . . . . . . . . . . . . . . . . . . . . . . . . . . . . . . . . . . . . . . . . . . . . . . . . . . . . . $ 53,761 $ 245,646 $ 121,485
Adjustments to reconcile net income to net cash provided by operatingactivities:
Depreciation and amortization of property and deferred financing cost . . . . . . . 300,859 303,256 304,376Share-based compensation . . . . . . . . . . . . . . . . . . . . . . . . . . . . . . . . . . . . . . . . . . 77 1,002 —Excess tax benefits from share-based compensation . . . . . . . . . . . . . . . . . . . . . . (325) (5,251) —Deferred income taxes . . . . . . . . . . . . . . . . . . . . . . . . . . . . . . . . . . . . . . . . . . . . . (2,399) (32,807) (32,862)Gain on sale of joint venture . . . . . . . . . . . . . . . . . . . . . . . . . . . . . . . . . . . . . . . . . — (13,810) —(Gain) loss on disposal of property and equipment . . . . . . . . . . . . . . . . . . . . . . . 1,484 (2,603) (3,354)Asset impairment and store closing charges . . . . . . . . . . . . . . . . . . . . . . . . . . . . . 20,500 — 61,734Gain from hurricane insurance proceeds . . . . . . . . . . . . . . . . . . . . . . . . . . . . . . . (18,181) — (29,715)Proceeds from hurricane insurance . . . . . . . . . . . . . . . . . . . . . . . . . . . . . . . . . . . . 5,881 — 83,398Changes in operating assets and liabilities:(Increase) decrease in accounts receivable . . . . . . . . . . . . . . . . . . . . . . . . . . . . (372) 2,015 (2,872)(Increase) decrease in merchandise inventories . . . . . . . . . . . . . . . . . . . . . . . . (7,129) 30,545 (123,345)(Increase) decrease in other current assets . . . . . . . . . . . . . . . . . . . . . . . . . . . . (7,366) (60,283) 17,138Increase in other assets . . . . . . . . . . . . . . . . . . . . . . . . . . . . . . . . . . . . . . . . . . . (4,243) (2,421) (6,201)Decrease in trade accounts payable and accrued expenses, other liabilitiesand income taxes . . . . . . . . . . . . . . . . . . . . . . . . . . . . . . . . . . . . . . . . . . . . . . (88,098) (104,707) (20,640)
Net cash provided by operating activities . . . . . . . . . . . . . . . . . . . . . . . . . . . . . . . . . . . 254,449 360,582 369,142
Investing activities:Purchase of property and equipment . . . . . . . . . . . . . . . . . . . . . . . . . . . . . . . . . . (396,337) (320,640) (456,078)Proceeds from sale of property and equipment . . . . . . . . . . . . . . . . . . . . . . . . . . 48,249 6,479 103,637Proceeds from hurricane insurance . . . . . . . . . . . . . . . . . . . . . . . . . . . . . . . . . . . . 16,101 27,826 26,708Proceeds from sale of joint venture . . . . . . . . . . . . . . . . . . . . . . . . . . . . . . . . . . . — 19,990 —Proceeds from sale of subsidiary . . . . . . . . . . . . . . . . . . . . . . . . . . . . . . . . . . . . . — — 14,000Return of capital from joint venture . . . . . . . . . . . . . . . . . . . . . . . . . . . . . . . . . . . — — 14,125
Net cash used in investing activities . . . . . . . . . . . . . . . . . . . . . . . . . . . . . . . . . . . . . . . (331,987) (266,345) (297,608)
Financing activities:Principal payments on long-term debt and capital lease obligations . . . . . . . . . . (104,291) (205,907) (163,919)Payment on line of credit fees and expenses . . . . . . . . . . . . . . . . . . . . . . . . . . . . (522) (595) (1,623)Cash dividends paid . . . . . . . . . . . . . . . . . . . . . . . . . . . . . . . . . . . . . . . . . . . . . . . (12,492) (12,749) (12,987)Proceeds from issuance of common stock . . . . . . . . . . . . . . . . . . . . . . . . . . . . . . 6,028 17,248 9,455Excess tax benefits from share-based compensation . . . . . . . . . . . . . . . . . . . . . . 325 5,251 —Purchase of treasury stock . . . . . . . . . . . . . . . . . . . . . . . . . . . . . . . . . . . . . . . . . . (111,592) (3,331) (100,868)Increase in short-term borrowings . . . . . . . . . . . . . . . . . . . . . . . . . . . . . . . . . . . . 195,000 — —
Net cash used in financing activities . . . . . . . . . . . . . . . . . . . . . . . . . . . . . . . . . . . . . . (27,544) (200,083) (269,942)
Decrease in cash and cash equivalents . . . . . . . . . . . . . . . . . . . . . . . . . . . . . . . . . . . . . (105,082) (105,846) (198,408)Cash and cash equivalents, beginning of year . . . . . . . . . . . . . . . . . . . . . . . . . . . . . . . 193,994 299,840 498,248
Cash and cash equivalents, end of year . . . . . . . . . . . . . . . . . . . . . . . . . . . . . . . . . . . . $ 88,912 $ 193,994 $ 299,840
Non-cash transactions:Tax benefit from exercise of stock options . . . . . . . . . . . . . . . . . . . . . . . . . . . . . . $ — $ — $ 3,683Capital lease transactions . . . . . . . . . . . . . . . . . . . . . . . . . . . . . . . . . . . . . . . . . . . — — 19,518(Prepaid) accrued capital expenditures . . . . . . . . . . . . . . . . . . . . . . . . . . . . . . . . . (516) 10,052 23,351Note received from sale of subsidiary . . . . . . . . . . . . . . . . . . . . . . . . . . . . . . . . . — — 3,000
See notes to consolidated financial statements.
F-9

NOTES TO CONSOLIDATED FINANCIAL STATEMENTS
1. Description of Business and Summary of Significant Accounting Policies
Description of Business—Dillard’s, Inc. (the “Company”) operates retail department stores locatedprimarily in the Southeastern, Southwestern and Midwestern areas of the United States. The Company’s fiscalyear ends on the Saturday nearest January 31 of each year. Fiscal years 2007, 2006 and 2005 ended onFebruary 2, 2008, February 3, 2007 and January 28, 2006, respectively. Fiscal year 2006 included 53 weeks andfiscal years 2007 and 2005 included 52 weeks.
Consolidation—The accompanying consolidated financial statements include the accounts of Dillard’s, Inc.and its wholly owned subsidiaries. Intercompany accounts and transactions are eliminated in consolidation.Investments in and advances to joint ventures in which the Company has a 50% ownership interest are accountedfor by the equity method.
Use of Estimates—The preparation of financial statements in conformity with accounting principlesgenerally accepted in the United States of America requires management to make estimates and assumptions thataffect the reported amounts of assets and liabilities and disclosure of contingent assets and liabilities at the dateof the financial statements and the reported amounts of revenues and expenses during the reporting period.Significant estimates include inventories, sales return, self-insured accruals, future cash flows for impairmentanalysis, pension discount rate and taxes. Actual results could differ from those estimates.
Seasonality—The Company’s business is highly seasonal, and historically the Company has realized asignificant portion of its sales, net income and cash flow in the second half of the fiscal year, attributable to theimpact of the back-to-school selling season in the third quarter and the holiday selling season in the fourthquarter. Additionally, working capital requirements fluctuate during the year, increasing in the third quarter inanticipation of the holiday season.
Guarantees—The Company accounts for certain guarantees in accordance with FASB InterpretationNo. 45, Guarantor’s Accounting and Disclosure Requirements for Guarantees, Including Indirect Guarantees ofIndebtedness to Others, an Interpretation of FASB Statements No. 5, 57 and 107 and a Rescission of FASBInterpretation No. 34 (“FIN 45”). FIN 45 elaborates on the disclosures to be made by a guarantor in its interimand annual financial statements about its obligations under guarantees issued. FIN 45 also clarifies that aguarantor is required to recognize, at inception of a guarantee, a liability for the fair value of certain obligationsundertaken. The Company recognized a liability related to indebtedness incurred by certain joint ventures as ofJanuary 28, 2006. No guarantees existed as of February 2, 2008 or February 3, 2007.
Cash Equivalents—The Company considers all highly liquid investments with an original maturity of threemonths or less when purchased to be cash equivalents. The Company considers receivables from charge cardcompanies as cash equivalents because they settle the balances within two to three days.
Accounts Receivable—Accounts receivable primarily consists of the monthly settlement with GE forDillard’s share of revenue from the long-term marketing and servicing alliance.
Merchandise Inventories—The retail last-in, first-out (“LIFO”) inventory method is used to valuemerchandise inventories. At February 2, 2008 and February 3, 2007, the LIFO cost of merchandise wasapproximately equal to the first-in, first-out (“FIFO”) cost of merchandise.
Property and Equipment—Property and equipment owned by the Company is stated at cost, which includesrelated interest costs incurred during periods of construction, less accumulated depreciation and amortization.Capitalized interest was $6.3 million, $4.4 million and $6.1 million in fiscal 2007, 2006 and 2005, respectively. Forfinancial reporting purposes, depreciation is computed by the straight-line method over estimated useful lives:
Buildings and leasehold improvements . . . . . . . . . . . . . . . . . . . . . . . . . . . . . . . . . . . . . . 20 - 40 yearsFurniture, fixtures and equipment . . . . . . . . . . . . . . . . . . . . . . . . . . . . . . . . . . . . . . . . . . 3 -10 years
F-10
Properties leased by the Company under lease agreements which are determined to be capital leases arestated at an amount equal to the present value of the minimum lease payments during the lease term, lessaccumulated amortization. The properties under capital leases and leasehold improvements under operatingleases are amortized on the straight-line method over the shorter of their useful lives or the related lease terms.The provision for amortization of leased properties is included in depreciation and amortization expense.
Included in property and equipment as of February 2, 2008 are assets held for sale in the amount of $6.8million. During fiscal 2007, the Company realized losses on the disposal of property and equipment of $1.5million. During fiscal 2006 and 2005, the Company realized gains on the disposal of property and equipment of$2.6 million and $3.4 million, respectively.
Depreciation expense on property and equipment was $299 million, $301 million and $302 million for fiscal2007, 2006 and 2005, respectively.
Long-Lived Assets Excluding Goodwill—The Company follows SFAS No. 144, Accounting for theImpairment or Disposal of Long-Lived Assets, which requires impairment losses to be recorded on long-livedassets used in operations when indicators of impairment are present and the undiscounted cash flows estimated tobe generated by those assets are less than the assets’ carrying amount. In the evaluation of the fair value andfuture benefits of long-lived assets, the Company performs an analysis of the anticipated undiscounted future netcash flows of the related long-lived assets. This analysis is performed at the store unit level. If the carrying valueof the related asset exceeds the undiscounted cash flows, the carrying value is reduced to its fair value which isbased on real estate values or expected discounted future cash flows. Various factors including future salesgrowth and profit margins are included in this analysis. Management believes at this time that the carrying valueand useful lives continue to be appropriate, after recognizing the impairment charges recorded in fiscal 2007 and2005, as disclosed in Note 15.
Goodwill—The Company follows SFAS No. 142, Goodwill and Other Intangible Assets, which requiresthat goodwill be reviewed for impairment annually or more frequently if certain indicators arise. The Companytests for goodwill impairment annually as of the last day of the fourth quarter using the two-step processprescribed in SFAS No. 142. The Company identifies its reporting units under SFAS No. 142 at the store unitlevel. The fair value of these reporting units are estimated using the expected discounted future cash flows andmarket values of related businesses, where appropriate. Management believes at this time that the carrying valuecontinues to be appropriate, recognizing the impairment charges recorded in fiscal 2007 and 2005 as disclosed inNotes 3 and 15.
Other Assets—Other assets include investments in joint ventures accounted for by the equity method.These joint ventures, which consist of malls and a general contracting company that constructs Dillard’s storesand other commercial buildings, had carrying values of $100 million and $98 million at February 2, 2008 andFebruary 3, 2007, respectively. The malls are located in Toledo, Ohio; Denver, Colorado and Bonita Springs,Florida. The Company received $14.1 million as a return of capital from a joint venture during fiscal 2005. TheCompany recorded a $13.8 million pretax gain during the year ended February 3, 2007 for the sale of its interestin the Yuma Palms joint venture for $20.0 million.
Vendor Allowances—The Company receives concessions from its vendors through a variety of programsand arrangements, including cooperative advertising and margin maintenance programs. The Company hasagreements in place with each vendor setting forth the specific conditions for each allowance or payment. Theseagreements range in periods from a few days to up to a year. If the payment is a reimbursement for costsincurred, it is offset against those related costs; otherwise, it is treated as a reduction to the cost of themerchandise.
For cooperative advertising programs, the Company generally offsets the allowances against the relatedadvertising expense when incurred. Many of these programs require proof-of-advertising to be provided to thevendor to support the reimbursement of the incurred cost. Programs that do not require proof-of-advertising are
F-11

monitored to ensure that the allowance provided by each vendor is a reimbursement of costs incurred to advertisefor that particular vendor. If the allowance exceeds the advertising costs incurred on a vendor-specific basis, thenthe excess allowance from the vendor is recorded as a reduction of merchandise cost for that vendor.
Margin maintenance allowances are credited directly to cost of purchased merchandise in the period earnedaccording to the agreement with the vendor.
The accounting policies described above are in compliance with Emerging Issues Task Force 02-16,Accounting by a Customer (Including a Reseller) for Certain Considerations Received from a Vendor.
Insurance Accruals—The Company’s consolidated balance sheets include liabilities with respect to self-insured workers’ compensation and general liability claims. The Company estimates the required liability of suchclaims, utilizing an actuarial method, based upon various assumptions, which include, but are not limited to, ourhistorical loss experience, projected loss development factors, actual payroll and other data. The required liabilityis also subject to adjustment in the future based upon the changes in claims experience, including changes in thenumber of incidents (frequency) and changes in the ultimate cost per incident (severity).
Operating Leases—The Company leases retail stores, office space and equipment under operating leases.Most store leases contain construction allowance reimbursements by landlords, rent holidays, rent escalationclauses and/or contingent rent provisions. The Company recognizes the related rental expense on a straight-linebasis over the lease term and records the difference between the amounts charged to expense and the rent paid asa deferred rent liability.
To account for construction allowance reimbursements from landlords and rent holidays, the Companyrecords a deferred rent liability included in trade accounts payable and accrued expenses and other liabilities onthe consolidated balance sheets and amortizes the deferred rent over the lease term, as a reduction to rent expenseon the consolidated income statements. For leases containing rent escalation clauses, the Company recordsminimum rent expense on a straight-line basis over the lease term on the consolidated income statement. Thelease term used for lease evaluation includes renewal option periods only in instances in which the exercise of theoption period can be reasonably assured and failure to exercise such options would result in an economic penalty.
Revenue Recognition—The Company recognizes revenue at the “point of sale.” Allowance for salesreturns are recorded as a component of net sales in the period in which the related sales are recorded.
GE Consumer Finance (“GE”) owns and manages Dillard’s proprietary credit cards (“proprietary cards”) undera long-term marketing and servicing alliance (“alliance”) that expires in fiscal 2014. The Company’s share ofincome earned under the alliance with GE is included as a component of service charges and other income. TheCompany received income of approximately $119 million, $125 million and $105 million from GE in fiscal 2007,2006 and 2005, respectively. Further pursuant to this agreement, the Company has no continuing involvement otherthan to honor the proprietary cards in its stores. Although not obligated to a specific level of marketing commitment,the Company participates in the marketing of the proprietary cards and accepts payments on the proprietary cards inits stores as a convenience to customers who prefer to pay in person rather than by mailing their payments to GE.Amounts received for providing these services are included in the amounts disclosed above.
Gift Card Revenue Recognition—The Company establishes a liability upon the sale of a gift card. Theliability is relieved and revenue is recognized when gift cards are redeemed for merchandise and for estimatedbreakage. The Company uses a homogeneous pool to recognize gift card breakage and will recognize incomeover the period when the likelihood of the gift card being redeemed is remote and the Company determines that itdoes not have a legal obligation to remit the value of unredeemed gift cards to the relevant jurisdiction asabandoned property. The Company determined gift card breakage income based upon historical redemptionpatterns. At that time, the Company will recognize breakage income over the performance period for those giftcards (i.e. 60 months). As of February 2, 2008 and February 3, 2007, gift card liabilities of $76.9 million and$74.9 million, respectively, were included in trade accounts payable and accrued expenses and other liabilities.
F-12

Advertising—Advertising and promotional costs, which include newspaper, television, radio and othermedia advertising, are expensed as incurred and were $197 million, $205 million and $229 million, net ofcooperative advertising reimbursements of $67.1 million, $67.1 million and $57.8 million for fiscal years 2007,2006 and 2005, respectively.
Income Taxes—Income taxes are accounted for in accordance with Statement of Financial AccountingStandards No. 109, Accounting for Income Taxes (“SFAS No. 109”). Under SFAS No. 109, income taxes arerecognized for the amount of taxes payable for the current year and deferred tax assets and liabilities for thefuture tax consequence of events that have been recognized differently in the financial statements than for taxpurposes. Deferred tax assets and liabilities are established using statutory tax rates and are adjusted for tax ratechanges. Effective at the beginning of the first quarter of fiscal 2007, we adopted FASB Interpretation No. 48,Accounting for Uncertainty in Income Taxes (“FIN 48”). This interpretation clarifies the accounting foruncertainty in income tax recognized in an entity’s financial statements in accordance with SFAS No. 109. FIN48 requires companies to determine whether it is “more likely than not” that a tax position will be sustained uponexamination by the appropriate taxing authorities before any part of the benefit can be recorded in the financialstatements. For those tax positions where it is “not more likely than not” that a tax benefit will be sustained, notax benefit is recognized. Where applicable, associated interest and penalties are also recorded.
Shipping and Handling—In accordance with Emerging Issues Task Force (“EITF”) 00-10, Accounting forShipping and Handling Fees and Costs, the Company records shipping and handling reimbursements in ServiceCharges and Other Income. The Company records shipping and handling costs in cost of sales.
Stock-Based Compensation—On January 29, 2006, the first day of our 2006 fiscal year, the Companyadopted the provisions of Statement of Financial Accounting Standards No. 123(R), Share-Based Payment(“SFAS 123(R)”), a revision of SFAS No. 123, Accounting for Stock-Based Compensation, as interpreted bySEC Staff Accounting Bulletin No. 107. Under SFAS 123(R), all forms of share-based payment to employeesand directors, including stock options, must be treated as compensation and recognized in the income statement.Previous to the adoption of SFAS 123(R), the Company accounted for stock options under the provisions ofAccounting Principles Board Opinion No. 25, Accounting for Stock Issued to Employees, and, accordingly, didnot recognize compensation expense in our consolidated financial statements.
Retirement Benefit Plans—The Company’s retirement benefit plan costs are accounted for using actuarialvaluations required by SFAS No. 87, Employers' Accounting for Pensions, and SFAS No. 106, Employers'Accounting for Postretirement Benefits Other Than Pensions. The Company adopted SFAS No. 158, Employer’sAccounting for Defined Benefit Pension and Other Postretirement Plans—an amendment of FASB StatementsNo. 87, 88, 106, and 132(R) (“SFAS 158”) as of February 3, 2007. SFAS 158 requires an entity to recognize thefunded status of its defined pension plans on the balance sheet and to recognize changes in the funded status thatarise during the period but are not recognized as components of net periodic benefit cost, within othercomprehensive income, net of income taxes.
Equity in Earnings of Joint Ventures—Equity in earnings of joint ventures includes the Company’sportion of the income or loss of the Company’s unconsolidated joint ventures.
Segment Reporting—The Company reports in a single operating segment—the operation of retaildepartment stores. Revenues from customers are derived from merchandise. The Company does not rely on anymajor customers as a source of revenue. The Company purchases merchandise from many suppliers, none ofwhich accounted for more than 5% of the Company’s net purchases during fiscal 2007.
F-13

The following table summarizes the percentage of net sales by each major product line:
Percentage of Net Sales
Fiscal2007
Fiscal2006
Fiscal2005
Cosmetics . . . . . . . . . . . . . . . . . . . . . . . . . . . . . . . . . . . . . . . . . . . . . . . . . . . . . 15% 15% 15%Ladies’ Apparel and Accessories . . . . . . . . . . . . . . . . . . . . . . . . . . . . . . . . . . . 37 36 36Juniors’ and Children’s Apparel . . . . . . . . . . . . . . . . . . . . . . . . . . . . . . . . . . . . 9 10 10Men’s Apparel and Accessories . . . . . . . . . . . . . . . . . . . . . . . . . . . . . . . . . . . . 18 18 18Shoes . . . . . . . . . . . . . . . . . . . . . . . . . . . . . . . . . . . . . . . . . . . . . . . . . . . . . . . . . 13 13 12Home and Other . . . . . . . . . . . . . . . . . . . . . . . . . . . . . . . . . . . . . . . . . . . . . . . . 8 8 9
Total . . . . . . . . . . . . . . . . . . . . . . . . . . . . . . . . . . . . . . . . . . . . . . . . . . . . . . . . . . 100% 100% 100%
New Accounting Pronouncements
In December 2007, the Financial Accounting Standards Board (“FASB”) issued the Statement of FinancialAccounting Standards (“SFAS”) No. 141(R), Business Combinations (“SFAS 141(R)”). SFAS 141(R)'s objective isto improve the relevance, representational faithfulness, and comparability of the information that a reporting entityprovides in its financial reports about a business combination and its effects. SFAS 141(R) applies prospectively tobusiness combinations for which the acquisition date is on or after December 31, 2008. We expect that the adoptionof SFAS 141(R) will not have a material impact on our consolidated financial statements.
In December 2007, the FASB issued the SFAS No. 160, Noncontrolling Interest in Consolidated FinancialStatements (“SFAS 160”). SFAS 160's objective is to improve the relevance, comparability, and transparency ofthe financial information that a reporting entity provides in its consolidated financial statements by establishingaccounting and reporting standards for the noncontrolling interest in a subsidiary and for the deconsolidation of asubsidiary. SFAS 160 will be effective for fiscal years and interim periods within those fiscal years, beginning onor after December 15, 2008. We expect that the adoption of SFAS 160 will not have a material impact on ourconsolidated financial statements.
In February 2007, the FASB issued SFAS No. 159, The Fair Value Option for Financial Assets andFinancial Liabilities—Including an amendment of FASB Statement No. 115 (“SFAS 159”). This statementpermits entities to choose to measure many financial instruments and certain other items at fair value. SFAS 159is effective at the beginning of an entity’s first fiscal year that begins after November 15, 2007. We expect thatthe adoption of SFAS 159 will not have a material impact on our consolidated financial statements.
In September 2006, the FASB issued SFAS No. 157, Fair Value Measurements (“SFAS 157”). This statementdefines fair value, establishes a framework for measuring fair value in generally accepted accounting principles, andexpands disclosures about fair value measurements. This statement applies under other accounting pronouncementsthat require or permit fair value measurements, the FASB having concluded in those other accountingpronouncements that fair value is the relevant measurement attribute. This statement is effective for financial assetsand liabilities in financial statements issued for fiscal years beginning after November 15, 2007. It is effective fornon-financial assets and liabilities in financial statements issued for fiscal years beginning after November 15, 2008.We expect that the adoption of SFAS 157 will not have a material impact on our consolidated financial statements.
In December 2007, the Securities and Exchange Commission (“SEC”) issued Staff Accounting Bulletin(“SAB”) No. 110 to extend the use of “simplified method” for estimating the expected terms of “plain vanilla”employee stock options for the awards valuation. The method was initially allowed under SAB 107 incontemplation of the adoption of SFAS 123(R) to expense the compensation cost based on the awards grant datefair value. SAB 110 does not provide an expiration date for the use of the method. However, as more externalinformation about exercise behavior will be available over time, it is expected that this method will not be usedwhen more relevant information is available.
F-14

In February 2008, the FASB issued FSP SFAS 157-2, Effective Date for FASB Statement No. 157. This FSPpermits the delayed application of SFAS 157 for all nonrecurring fair value measurements of nonfinancial assetsand nonfinancial liabilities until fiscal years beginning after November 15, 2008. The Company has chosen toadopt SFAS 157 in accordance with the guidance of FSP SFAS 157-2 as stated above.
2. Restatement
Subsequent to the issuance of the Company’s consolidated financial statements for the year ended February 3,2007, the Company identified an error in accounting for its share of the equity in earnings of CDI Contractors LLC(“CDI”), a 50%-owned, equity method joint venture investment of the Company that is also a general contractorthat constructs stores for the Company. In connection with a potential transfer of the other 50% shareholder’sinterest, the Company performed a review of CDI’s internal financial records. During this review process, theCompany discovered that CDI had recorded profit on the Company’s construction projects in excess of what CDIhad previously reported and which, therefore, was not properly eliminated. The cumulative impact on beginningretained earnings and stockholders’ equity as of January 29, 2005 of this error was a decrease of $7.2 million.
The following table reflects the effects of the restatement on the Statement of Stockholders’ Equity as ofJanuary 28, 2006 (in thousands):
January 28, 2006
As PreviouslyReported
RestatementAdjustments
AsRestated
Retained earnings . . . . . . . . . . . . . . . . . . . . . . . . . . . . . . . . $2,414,491 $(7,164) $2,407,327Total stockholders’ equity . . . . . . . . . . . . . . . . . . . . . . . . . . 2,340,541 (7,164) 2,333,377
The following table reflects the effects of the restatement on the Consolidated Balance Sheet and Statementof Stockholders’ Equity as of February 3, 2007 (in thousands):
February 3, 2007
As PreviouslyReported
RestatementAdjustments
AsRestated
Property and equipment . . . . . . . . . . . . . . . . . . . . . . . . . . . $3,157,906 $(11,280) $3,146,626Total assets . . . . . . . . . . . . . . . . . . . . . . . . . . . . . . . . . . . . . 5,408,015 (11,280) 5,396,735Deferred income taxes . . . . . . . . . . . . . . . . . . . . . . . . . . . . 452,886 (4,116) 448,770Retained earnings . . . . . . . . . . . . . . . . . . . . . . . . . . . . . . . . 2,647,388 (7,164) 2,640,224Total stockholders’ equity . . . . . . . . . . . . . . . . . . . . . . . . . . 2,586,953 (7,164) 2,579,789Total liabilities and stockholders’ equity . . . . . . . . . . . . . . 5,408,015 (11,280) 5,396,735
The Company’s net income for fiscal 2006 and 2005 was not materially impacted by this error; accordingly,a decrease of $2.9 million to correct the effect of the error on fiscal 2006 and 2005 was recorded in fiscal 2007.
3. Goodwill
The changes in the carrying amount of goodwill for the years ended February 2, 2008 and February 3, 2007are as follows (in thousands):
Goodwill balance at January 28, 2006 . . . . . . . . . . . . . . . . . . . . . . . . . . . . . . . . . . . $34,511Goodwill written off in fiscal 2006 . . . . . . . . . . . . . . . . . . . . . . . . . . . . . . . . . —
Goodwill balance at February 3, 2007 . . . . . . . . . . . . . . . . . . . . . . . . . . . . . . . . . . . $34,511Goodwill written off in fiscal 2007 . . . . . . . . . . . . . . . . . . . . . . . . . . . . . . . . . (2,599)
Goodwill balance at February 2, 2008 . . . . . . . . . . . . . . . . . . . . . . . . . . . . . . . . . . . $31,912
The goodwill write-off of $2.6 million during fiscal 2007 was for a store closed during the year where theprojected cash flows were unable to sustain the amount of goodwill.
F-15

4. Revolving Credit Agreement
At February 2, 2008, the Company maintained a $1.2 billion revolving credit facility (“credit agreement”)with JPMorgan Chase Bank (“JPMorgan”) as agent for various banks, secured by the inventory of Dillard’s, Inc.operating subsidiaries. The credit agreement expires December 12, 2012. Borrowings under the credit agreementaccrue interest at either JPMorgan’s Base Rate minus 0.5% or LIBOR plus 1.0% (4.14% at February 2, 2008)subject to certain availability thresholds as defined in the credit agreement. Availability for borrowings and letterof credit obligations under the credit agreement is limited to 85% of the inventory of certain Companysubsidiaries (approximately $1.0 billion at February 2, 2008). At February 2, 2008, borrowings of $195 millionwere outstanding and letters of credit totaling $72.5 million were issued under this credit agreement leavingunutilized availability under the facility of $768 million. There are no financial covenant requirements under thecredit agreement provided availability exceeds $100 million. The Company pays an annual commitment fee tothe banks of 0.25% of the committed amount less outstanding borrowings and letters of credit. The Company hadweighted-average borrowings of $108.3 million and $10.6 million during fiscal 2007 and 2006, respectively.
5. Long-Term Debt
Long-term debt consists of the following:
February 2, 2008 February 3, 2007
(in thousands of dollars)Unsecured notes
At rates ranging from 6.30% to 9.50%, due 2008through 2028 . . . . . . . . . . . . . . . . . . . . . . . . . . . . . $ 952,392 $1,052,392
Mortgage note, payable monthly through 2013 andbearing interest at a rate of 9.25% . . . . . . . . . . . . . . . . 4,219 4,854
956,611 1,057,246Current portion . . . . . . . . . . . . . . . . . . . . . . . . . . . . . . . . . (196,446) (100,635)
$ 760,165 $ 956,611
There are no financial covenants under the debt agreements. Building, land, and land improvements with acarrying value of $5.7 million at February 2, 2008 were pledged as collateral on the mortgage notes. Maturitiesof long-term debt over the next five years are $196 million, $25 million, $1 million, $57 million and $56 million.Outstanding letters of credit aggregated $72.5 million at February 2, 2008.
Net interest and debt expense consists of the following:
Fiscal2007
Fiscal2006
Fiscal2005
(in thousands of dollars)Long-term debt:
Interest . . . . . . . . . . . . . . . . . . . . . . . . . . . . . . . . . . $82,037 $ 99,644 $104,003Loss on early retirement of long-term debt . . . . . . — — 478Amortization of debt expense . . . . . . . . . . . . . . . . 1,932 2,274 2,826
83,969 101,918 107,307Interest on capital lease obligations . . . . . . . . . . . . . . . . 2,319 1,817 2,138Revolving credit facility expenses . . . . . . . . . . . . . . . . . 9,387 3,721 3,442Investment interest income . . . . . . . . . . . . . . . . . . . . . . (4,119) (9,314) (7,317)Interest on income tax settlement . . . . . . . . . . . . . . . . . . — (10,500) —
$91,556 $ 87,642 $105,570
Interest paid during fiscal 2007, 2006 and 2005 was approximately $96.2 million, $123.3 million and $113.7million, respectively.
F-16

6. Trade Accounts Payable and Accrued Expenses
Trade accounts payable and accrued expenses consist of the following:
February 2, 2008 February 3, 2007
(in thousands of dollars)Trade accounts payable . . . . . . . . . . . . . . . . . . . . . . . . . . $565,215 $581,908Accrued expenses:
Taxes, other than income . . . . . . . . . . . . . . . . . . . . . 58,477 72,723Salaries, wages, and employee benefits . . . . . . . . . . 46,248 58,386Liability to customers . . . . . . . . . . . . . . . . . . . . . . . . 61,599 59,581Interest . . . . . . . . . . . . . . . . . . . . . . . . . . . . . . . . . . . 11,097 11,388Rent . . . . . . . . . . . . . . . . . . . . . . . . . . . . . . . . . . . . . . 6,027 8,828Other . . . . . . . . . . . . . . . . . . . . . . . . . . . . . . . . . . . . . 4,646 4,992
$753,309 $797,806
7. Income Taxes
The provision for federal and state income taxes is summarized as follows:
Fiscal2007
Fiscal2006
Fiscal2005
(in thousands of dollars)Current:
Federal . . . . . . . . . . . . . . . . . . . . . . . . . . . . . . . . . . . $24,977 $ 47,509 $ 47,629State . . . . . . . . . . . . . . . . . . . . . . . . . . . . . . . . . . . . . (9,568) 5,878 (467)
15,409 53,387 47,162
Deferred:Federal . . . . . . . . . . . . . . . . . . . . . . . . . . . . . . . . . . . (4,914) (35,338) (39,290)State . . . . . . . . . . . . . . . . . . . . . . . . . . . . . . . . . . . . . 2,515 2,531 6,428
(2,399) (32,807) (32,862)
$13,010 $ 20,580 $ 14,300
A reconciliation between the Company’s income tax provision and income taxes using the federal statutoryincome tax rate is presented below:
Fiscal2007
Fiscal2006
Fiscal2005
(in thousands of dollars)Income tax at the statutory federal rate (inclusive ofequity in earnings of joint ventures) . . . . . . . . . . . . . . $23,370 $ 93,179 $ 47,525
State income taxes, net of federal benefit (inclusive ofequity in earnings of joint ventures) . . . . . . . . . . . . . . 1,585 5,591 1,870
Net changes in FIN 48 liabilities /reserves (5,867) (57,236) —Tax benefit of federal credits . . . . . . . . . . . . . . . . . . . . . . (3,340) — —Nondeductible goodwill write off . . . . . . . . . . . . . . . . . . 933 — 344Changes in cash surrender value of life insurancepolicies . . . . . . . . . . . . . . . . . . . . . . . . . . . . . . . . . . . . . (914) — —
Tax benefit of state restructuring . . . . . . . . . . . . . . . . . . . (1,331) — —Changes in tax rate . . . . . . . . . . . . . . . . . . . . . . . . . . . . . — 3,451 5,469Benefit of capital loss carrybacks . . . . . . . . . . . . . . . . . . — — (45,415)Changes in valuation allowance . . . . . . . . . . . . . . . . . . . (1,733) (24,408) —Other . . . . . . . . . . . . . . . . . . . . . . . . . . . . . . . . . . . . . . . . 307 3 4,507
$13,010 $ 20,580 $ 14,300
F-17

During the year ended February 2, 2008, the Company recorded an income tax benefit relating to a netdecrease in FIN 48 liabilities of approximately $5.9 million, a recognition of tax benefits of approximately $1.7million for the change in a capital loss valuation allowance due to capital gain income, approximately $1.3million for a reduction in state tax liabilities due to a restructuring that occurred during this period andapproximately $3.3 million due to federal tax credits. In fiscal 2007, the Company achieved a settlement with astate taxing jurisdiction which necessitated changes in the FIN 48 liabilities.
During the year ended February 3, 2007, the Company recorded an income tax benefit relating to a $57.2million reduction of reserves for various federal and state tax contingencies, a $3.5 million increase in deferredliabilities due to an increase in the state effective tax rate and a $24.4 million tax benefit related to the decrease ina capital loss valuation allowance due to capital gain income. In fiscal 2006, the Company achieved a settlementwith the Internal Revenue Service (“IRS”) concerning the issues raised in their examinations of the Company’sfederal tax returns for fiscal years 1997 through 2002, thereby allowing the applicable statute of limitations forthese periods to close prior to February 3, 2007. The settlement of these examinations necessitated changes inreserves and changes in capital loss valuation allowance due to capital gain income.
During the year ended January 28, 2006, income taxes included a $5.8 million reduction of reserves forvarious federal and state tax contingencies, a $10.4 million increase of reserves for various federal and state taxcontingencies, a net $5.5 million increase in deferred liabilities due to an increase in the state effective rate offsetby a decrease reflecting the impact of tax law changes in the State of Ohio, and a $45.4 million tax benefit relatedto the sale of a subsidiary of the Company.
Deferred income taxes reflect the net tax effects of temporary differences between the carrying amounts ofassets and liabilities for financial reporting purposes and the amounts used for income tax purposes. TheCompany’s estimated federal and state income tax rate, inclusive of equity in earnings of joint ventures, was19.5% in fiscal 2007, 7.7% in fiscal 2006 and 10.5% in fiscal 2005. Significant components of the Company’sdeferred tax assets and liabilities as of February 2, 2008 and February 3, 2007 are as follows:
February 2, 2008 February 3, 2007
(in thousands of dollars)
Property and equipment bases and depreciationdifferences . . . . . . . . . . . . . . . . . . . . . . . . . . . . . . . . . . $ 522,718 $ 516,431
Joint venture bases differences . . . . . . . . . . . . . . . . . . . . . 28,745 26,277Differences between book and tax bases of inventory . . . 59,384 52,246Other . . . . . . . . . . . . . . . . . . . . . . . . . . . . . . . . . . . . . . . . . 6,978 10,495
Total deferred tax liabilities . . . . . . . . . . . . . . . . . . . 617,825 605,449
Accruals not currently deductible . . . . . . . . . . . . . . . . . . . (94,462) (103,048)Capital loss carryforwards . . . . . . . . . . . . . . . . . . . . . . . . (226,961) (228,741)Net operating loss carryforwards . . . . . . . . . . . . . . . . . . . (161,795) (155,792)State income taxes . . . . . . . . . . . . . . . . . . . . . . . . . . . . . . (10,053) —Other . . . . . . . . . . . . . . . . . . . . . . . . . . . . . . . . . . . . . . . . . (11,566) (417)
Total deferred tax assets . . . . . . . . . . . . . . . . . . . . . . (504,837) (487,998)Capital loss valuation allowance . . . . . . . . . . . . . . . . . . . 226,961 228,741Net operating loss valuation allowance . . . . . . . . . . . . . . 129,574 126,297
Net deferred tax assets . . . . . . . . . . . . . . . . . . . . . . . (148,302) (132,960)
Net deferred tax liabilities . . . . . . . . . . . . . . . . . . . . $ 469,523 $ 472,489
At February 2, 2008, the Company had a deferred tax asset of approximately $227 million related to a capitalloss carryforward that could be utilized to reduce the tax liabilities of future years. This carryforward will expire in2011. The deferred asset attributable to the capital loss carryforward has been reduced by a valuation allowance of$227 million due to the uncertainty of future capital gains necessary to utilize the capital loss carryforward.
F-18

At February 2, 2008, the Company had a deferred tax asset related to state net operating loss carryforwardsof approximately $162 million that could be utilized to reduce the tax liabilities of future years. Thesecarryforwards will expire between 2008 and 2028. A portion of the deferred asset attributable to state netoperating loss carryforwards was reduced by a valuation allowance of approximately $129.5 million for thelosses of various members of the affiliated group in states that require separate company filings.
Deferred tax assets and liabilities are presented as follows in the accompanying consolidated balance sheets:
February 2, 2008 February 3, 2007
(in thousands of dollars)
Net deferred tax liabilities-noncurrent . . . . . . . . . . . . . . . $436,541 $448,770Net deferred tax liabilities-current . . . . . . . . . . . . . . . . . . 32,982 23,719
Net deferred tax liabilities . . . . . . . . . . . . . . . . . . . . $469,523 $472,489
The Financial Accounting Standards Board issued Interpretation No. 48, Accounting for Uncertainty inIncome Taxes—an Interpretation of FASB Statement No. 109 (“FIN 48”) effective for fiscal years beginning afterDecember 15, 2006. The Company adopted the new requirement as of February 4, 2007 with the cumulativeeffects recorded as an adjustment to retained earnings as of the beginning of the period of $0.8 million. TheCompany classifies interest expense and penalties relating to income tax in the financial statements as income taxexpense. The total amount of unrecognized tax benefits as of the date of adoption was $27.6 million, of which$17.8 million would, if recognized, affect the effective tax rate. The total amount of accrued interest and penaltyas of the date of adoption was $13.7 million. The total amount of unrecognized tax benefits as of February 2,2008 was $25.4 million, of which $16.9 million would, if recognized, affect the effective tax rate. The totalamount of accrued interest and penalties as of February 2, 2008 was $8.8 million.
A reconciliation of the beginning and ending amount of unrecognized tax benefits is as follows:
(in thousands of dollars)
Unrecognized tax benefits at February 4, 2007 . . . . . . . . . . . . . . . . . . $ 27,639Gross increases—tax positions in prior period . . . . . . . . . . . . . . 8,659Gross decreases—tax positions in prior period . . . . . . . . . . . . . . (10,372)Gross increases—current period tax positions . . . . . . . . . . . . . . . 2,083Settlements . . . . . . . . . . . . . . . . . . . . . . . . . . . . . . . . . . . . . . . . . . (2,538)Lapse of statute of limitations . . . . . . . . . . . . . . . . . . . . . . . . . . . (56)
Unrecognized tax benefits at February 2, 2008 . . . . . . . . . . . . . . . . . . $ 25,415
The Company is currently being examined by the Internal Revenue Service for the fiscal tax years 2003through 2005. The Company is also under examination by various state and local taxing jurisdictions for variousfiscal years. The tax years that remain subject to examination for major tax jurisdictions are fiscal tax years 2003and forward, with the exception of fiscal 1997 through 2002 amended state and local tax returns related to thereporting of federal audit adjustments.
The Company has taken positions in certain taxing jurisdictions for which it is reasonably possible that thetotal amounts of unrecognized tax benefits may decrease within the next twelve months. The possible decreasecould result from the finalization of the Company’s federal and various state income tax audits. The Company’sfederal income tax audit uncertainties primarily relate to research and development credits, while various stateincome tax audit uncertainties primarily relate to income from intangibles. The estimated range of the reasonablypossible uncertain tax benefit decrease in the next twelve months is between $1 million and $5 million.
Income taxes paid during fiscal 2007, 2006 and 2005 were approximately $69.8 million, $110.1 million and$98.7 million, respectively.
F-19

8. Guaranteed Preferred Beneficial Interests in the Company’s Subordinated Debentures
Guaranteed preferred beneficial interests in the Company’s subordinated debentures are comprised of $200million liquidation amount of 7.5% Capital Securities, due August 1, 2038 (the “Capital Securities”) representingbeneficial ownership interest in the assets of Dillard’s Capital Trust I, a consolidated entity of the Company.
Holders of the Capital Securities are entitled to receive cumulative cash distributions, payable quarterly, atthe annual rate of 7.5% of the liquidation amount of $25 per Capital Security. The subordinated debentures arethe sole assets of the Trust, and the Capital Securities are subject to mandatory redemption upon repayment ofthe subordinated debentures. The Company’s obligations under the debentures and related agreements, takentogether, provides a full and unconditional guarantee of payments due on the Capital Securities.
9. Benefit Plans
The Company has a retirement plan with a 401(k)-salary deferral feature for eligible employees. Under theterms of the plan, eligible employees may contribute up to the lesser of $15,500 ($20,500 if at least 50 years ofage) or 75% of eligible pay. Eligible employees with one year of service, who elect to participate in the plan,receive a Company matching contribution. Company matching contributions are calculated on the eligibleemployee's first 6% of elective deferrals with the first 1% being matched 100% and the next 5% being matched50%. The Company matching contributions are used to purchase Class A Common Stock of the Company for thebenefit of the employee. The terms of the plan provide a two-year vesting schedule for the Company matchingcontribution portion of the plan. The Company incurred benefit plan expense of $14 million, $13 million and $13million for fiscal 2007, 2006 and 2005, respectively.
The Company has a nonqualified defined benefit plan for its officers. The plan is noncontributory andprovides benefits based on years of service and compensation during employment. Pension expense isdetermined using various actuarial cost methods to estimate the total benefits ultimately payable and allocatesthis cost to service periods. The pension plan is unfunded. The actuarial assumptions used to calculate pensioncosts are reviewed annually.
The Company’s retirement benefit plan costs are accounted for using actuarial valuations required by SFASNo. 87, Employers’ Accounting for Pensions and SFAS No. 158, Employer’s Accounting for Defined BenefitPension and Other Postretirement Plans—an amendment of FASB Statements No. 87, 88, 106, and 132(R)(“SFAS 158”). SFAS 158 requires an entity to recognize the funded status of its defined pension benefit plan onthe balance sheet and to recognize changes in the funded status, that arise during the period but are notrecognized as components of net periodic benefit cost, within accumulated other comprehensive loss, net ofincome taxes.
F-20

The accumulated benefit obligations (“ABO”), change in projected benefit obligation (“PBO”), change inplan assets, funded status, and reconciliation to amounts recognized in the consolidated balance sheets are asfollows:
February 2,2008
February 3,2007
(in thousands of dollars)
Change in benefit obligation:Benefit obligation at beginning of year . . . . . . . . . . . . . . . . . . . . . $ 105,025 $ 98,884
Service cost . . . . . . . . . . . . . . . . . . . . . . . . . . . . . . . . . . . . . . . 2,069 2,181Interest cost . . . . . . . . . . . . . . . . . . . . . . . . . . . . . . . . . . . . . . . 6,002 5,396Actuarial loss . . . . . . . . . . . . . . . . . . . . . . . . . . . . . . . . . . . . . 4,246 2,224Benefits paid . . . . . . . . . . . . . . . . . . . . . . . . . . . . . . . . . . . . . . (3,627) (3,660)
Benefit obligation at end of year . . . . . . . . . . . . . . . . . . . . . . . . . . $ 113,715 $ 105,025
Change in plan assets:Fair value of plan assets at beginning of year . . . . . . . . . . . . . . . . $ — $ —
Employer contribution . . . . . . . . . . . . . . . . . . . . . . . . . . . . . . 3,627 3,660Benefits paid . . . . . . . . . . . . . . . . . . . . . . . . . . . . . . . . . . . . . . (3,627) (3,660)
Fair value of plan assets at end of year . . . . . . . . . . . . . . . . . . . . . . $ — $ —
Funded status (benefit obligation less plan assets) . . . . . . . . . . . . . $(113,715) $(105,025)Unamortized prior service costs . . . . . . . . . . . . . . . . . . . . . . . — —Unrecognized net actuarial loss . . . . . . . . . . . . . . . . . . . . . . . — —Intangible asset . . . . . . . . . . . . . . . . . . . . . . . . . . . . . . . . . . . . — —Unrecognized net loss . . . . . . . . . . . . . . . . . . . . . . . . . . . . . . . — —
Accrued benefit cost . . . . . . . . . . . . . . . . . . . . . . . . . . . . . . . . . . . . $(113,715) $(105,025)
Benefit obligation in excess of plan assets . . . . . . . . . . . . . . . . . . . $(113,715) $(105,025)
Amounts recognized in the balance sheets:Accrued benefit liability . . . . . . . . . . . . . . . . . . . . . . . . . $(113,715) $(105,025)Intangible asset . . . . . . . . . . . . . . . . . . . . . . . . . . . . . . . . — —Accumulated other comprehensive loss . . . . . . . . . . . . . — —
Net amount recognized . . . . . . . . . . . . . . . . . . . . . . . . . . . . . . . . . . $(113,715) $(105,025)
Accumulated benefit obligation at end of year . . . . . . . . . . . . . . . . $(103,948) $ (97,211)
Accrued benefit liability is included in other liabilities. Accumulated other comprehensive loss, net of taxbenefit, is included in stockholders’ equity.
The estimated actuarial loss and prior service cost for the nonqualified defined benefit plans that will beamortized from accumulated other comprehensive loss into net periodic benefit cost over the next fiscal yearapproximate $2 million and $600 thousand, respectively.
Pretax amounts recognized in accumulated other comprehensive loss for fiscal 2007 consisted of netactuarial losses and prior service cost of $31.6 million and $3.2 million, respectively. The pretax amountsrecognized in accumulated other comprehensive loss for fiscal 2006 consisted of net actuarial losses and priorservice cost of $29.4 million and $3.9 million, respectively. The pretax amounts recognized in accumulated othercomprehensive loss for fiscal 2005 consisted of net actuarial losses of $22.8 million.
The discount rate that the Company utilizes for determining future pension obligations is based on theCitigroup High Grade Corporate Yield Curve on its annual measurement date as of the end of each fiscal year
F-21

and is matched to the future expected cash flows of the benefit plans by annual periods. The discount ratedetermined on this basis had increased to 6.3% as of February 2, 2008 from 5.9% as of February 3, 2007.Weighted average assumptions are as follows:
Fiscal2007
Fiscal2006
Fiscal2005
Discount rate-net periodic pension cost . . . . . . . . . . . . . . . . . . . . . . . . . . . . . . 5.90% 5.60% 5.50%Discount rate-benefit obligations . . . . . . . . . . . . . . . . . . . . . . . . . . . . . . . . . . . 6.30% 5.90% 5.60%Rate of compensation increases . . . . . . . . . . . . . . . . . . . . . . . . . . . . . . . . . . . . 4.00% 4.00% 4.00%
The components of net periodic benefit costs are as follows:
Fiscal2007
Fiscal2006
Fiscal2005
(in thousands of dollars)
Components of net periodic benefit costs:Service cost . . . . . . . . . . . . . . . . . . . . . . . . . . . . . . . . . . . . . . . . . . . . . . . . . . . . $ 2,069 $ 2,181 $1,993Interest cost . . . . . . . . . . . . . . . . . . . . . . . . . . . . . . . . . . . . . . . . . . . . . . . . . . . . 6,002 5,396 4,756Net actuarial gain (loss) . . . . . . . . . . . . . . . . . . . . . . . . . . . . . . . . . . . . . . . . . . . 2,070 2,016 1,570Amortization of prior service cost . . . . . . . . . . . . . . . . . . . . . . . . . . . . . . . . . . . 626 627 627
Net periodic benefit costs . . . . . . . . . . . . . . . . . . . . . . . . . . . . . . . . . . . . . . . . . . . . . . $10,767 $10,220 $8,946
The estimated future benefits payments for the nonqualified benefit plan are as follows:
(in thousands of dollars)
Fiscal Year2008 . . . . . . . . . . . . . . . . . . . . . . . . . . . . . . . . . . . . . . . . . . . . . . . . . . . . . . . $ 3,9612009 . . . . . . . . . . . . . . . . . . . . . . . . . . . . . . . . . . . . . . . . . . . . . . . . . . . . . . . 5,2442010 . . . . . . . . . . . . . . . . . . . . . . . . . . . . . . . . . . . . . . . . . . . . . . . . . . . . . . . 5,0102011 . . . . . . . . . . . . . . . . . . . . . . . . . . . . . . . . . . . . . . . . . . . . . . . . . . . . . . . 4,8962012 . . . . . . . . . . . . . . . . . . . . . . . . . . . . . . . . . . . . . . . . . . . . . . . . . . . . . . . 5,5542013-2017 . . . . . . . . . . . . . . . . . . . . . . . . . . . . . . . . . . . . . . . . . . . . . . . . . . 33,435
Total payments for next ten fiscal years . . . . . . . . . . . . . . . . . . . . . . . . . . . . . . . $58,100
10. Stockholders’ Equity
Capital stock is comprised of the following:
TypeParValue
SharesAuthorized
Preferred (5% cumulative) . . . . . . . . . . . . . . . . . . . . . . . . . . . . . . . $100.00 5,000Additional preferred . . . . . . . . . . . . . . . . . . . . . . . . . . . . . . . . . . . . $ 0.01 10,000,000Class A, common . . . . . . . . . . . . . . . . . . . . . . . . . . . . . . . . . . . . . . $ 0.01 289,000,000Class B, common . . . . . . . . . . . . . . . . . . . . . . . . . . . . . . . . . . . . . . $ 0.01 11,000,000
Holders of Class A are empowered as a class to elect one-third of the members of the Board of Directors,and the holders of Class B are empowered as a class to elect two-thirds of the members of the Board of Directors.Shares of Class B are convertible at the option of any holder thereof into shares of Class A at the rate of oneshare of Class B for one share of Class A.
On March 2, 2002, the Company adopted a shareholder rights plan under which the Board of Directorsdeclared a dividend of one preferred share purchase right for each outstanding share of the Company’s CommonStock, which includes both the Company’s Class A and Class B Common Stock, payable on March 18, 2002 to
F-22

the shareholders of record on that date. Each right, which is not presently exercisable, entitles the holder topurchase one one-thousandth of a share of Series A Junior Participating Preferred Stock for $70 per oneone-thousandth of a share of Preferred Stock, subject to adjustment. In the event that any person acquires 15% ormore of the outstanding shares of common stock, each holder of a right (other than the acquiring person orgroup) will be entitled to receive, upon payment of the exercise price, shares of Class A common stock having amarket value of two times the exercise price. The rights will expire, unless extended, redeemed or exchanged bythe Company, on March 2, 2012.
Share Repurchase Programs
2007 Plan
In November 2007, the Company’s board of directors authorized a new share repurchase plan under whichthe Company may repurchase up to $200 million of its Class A common stock. The new open-endedauthorization permits the Company to repurchase its Class A common stock in the open market or throughprivately negotiated transactions. No repurchases have been made under this plan as of February 2, 2008.
2005 Plan
During 2005, the Company repurchased 3.9 million shares for $85 million under the 2005 stock repurchaseplan (“2005 plan”) which was approved by the board of directors in May 2005 and authorized the repurchase ofup to $200 million of its Class A Common Stock. During 2006, the Company repurchased 133,500 shares for $3million under the 2005 plan. During 2007, the Company repurchased 5.2 million shares under the 2005 plan for$112 million which completed the authorization under this plan.
2000 Plan
During 2005, the Company repurchased approximately 665,000 shares for $16 million, which completed theremaining authorized repurchase of Class A Common Stock under the Company’s $200 million programapproved by the board of directors in May of 2000.
11. Earnings per Share
In accordance with SFAS No. 128, Earnings Per Share, basic earnings per share has been computed basedupon the weighted average of Class A and Class B common shares outstanding. Diluted earnings per share giveseffect to outstanding stock options.
Earnings per common share has been computed as follows:
Fiscal 2007 Fiscal 2006 Fiscal 2005
Basic Diluted Basic Diluted Basic Diluted
(in thousands of dollars, except per share data)
Net earnings available for per-sharecalculation . . . . . . . . . . . . . . . . . . . . . . . . . $53,761 $53,761 $245,646 $245,646 $121,485 $121,485
Average shares of common stockoutstanding . . . . . . . . . . . . . . . . . . . . . . . . 78,406 78,406 79,603 79,603 81,504 81,504
Stock options . . . . . . . . . . . . . . . . . . . . . . . . . — 697 — 872 — 157
Total average equivalent shares . . . . . . . . . . 78,406 79,103 79,603 80,475 81,504 81,661
Per Share of Common Stock:Net income . . . . . . . . . . . . . . . . . . . . . . . . . . $ 0.69 $ 0.68 $ 3.09 $ 3.05 $ 1.49 $ 1.49
F-23

Total stock options outstanding were 5,376,375, 5,915,269 and 8,319,953 at February 2, 2008, February 3,2007, and January 28, 2006, respectively. Of these, options to purchase 5,376,375 and 4,548,816 shares ofClass A Common Stock at prices ranging from $24.01 to $30.47 and $24.01 to $29.99 per share were outstandingin fiscal 2007 and fiscal 2005, respectively, but were not included in the computation of diluted earnings pershare because the exercise price of the options exceeds the average market price and would have beenantidilutive. No options outstanding were excluded in the computation of diluted earnings per share for fiscal2006 as none were antidilutive.
12. Stock Options
The Company has various stock option plans that provide for the granting of options to purchase shares ofClass A Common Stock to certain key employees of the Company. Exercise and vesting terms for optionsgranted under the plans are determined at each grant date. All options were granted at not less than fair marketvalue at dates of grant. At the end of fiscal 2007, 6,195,445 shares were available for grant under the plans and11,571,820 shares of Class A Common Stock were reserved for issuance under the stock option plans.
Upon adoption of SFAS No. 123(R) as of January 29, 2006, the Company elected to continue to value itsshare-based payment transactions using a Black-Scholes option pricing model, which was previously used by theCompany for purposes of preparing the pro forma disclosures under SFAS No. 123. Under the provisions ofSFAS No. 123(R), stock-based compensation expense recognized during the period is based on the portion of theshare-based payment awards that are ultimately expected to vest. Accordingly, stock-based compensationexpense recognized in fiscal 2007 and fiscal 2006 has been reduced for estimated forfeitures. SFAS No. 123(R)requires forfeitures to be estimated at the time of grant and revised, if necessary, in subsequent periods if actualforfeitures differ from those estimates. Compensation expense for stock option awards granted on or afterJanuary 29, 2006 will be expensed using a straight-line single option method, which is the same attributionmethod that was used by the Company for purposes of its pro forma disclosures under SFAS No. 123.
The following table illustrates the effect on net income and earnings per share if the Company had appliedthe fair value recognition provisions of SFAS No. 123 to options granted under the Company’s stock optionplans in all periods presented. For purposes of this pro forma disclosure, the value of options is estimated usingthe Black-Scholes option-pricing model and amortized to expense over the options’ vesting periods.
Fiscal 2005
(in thousandsof dollars,except pershare data)
Net income:As reported . . . . . . . . . . . . . . . . . . . . . . . . . . . . . . . . . . . . . . . . . . . . . . . . . $121,485
Add: Total stock bonus expense, net of tax . . . . . . . . . . . . . . . . . . . . 1,716Add: Stock-based employee compensation expense included inreported net income, net of tax . . . . . . . . . . . . . . . . . . . . . . . . . . . . —
Deduct: Total stock-based employee compensation expensedetermined under fair value based method, net of tax . . . . . . . . . . (32,421)
Deduct: Total stock bonus expense, net of tax . . . . . . . . . . . . . . . . . . (1,716)
Pro forma . . . . . . . . . . . . . . . . . . . . . . . . . . . . . . . . . . . . . . . . . . . . . . . . . . $ 89,064
Basic earnings per share:As reported . . . . . . . . . . . . . . . . . . . . . . . . . . . . . . . . . . . . . . . . . . . . . . . . . $ 1.49Pro forma . . . . . . . . . . . . . . . . . . . . . . . . . . . . . . . . . . . . . . . . . . . . . . . . . . 1.09
Diluted earnings per share:As reported . . . . . . . . . . . . . . . . . . . . . . . . . . . . . . . . . . . . . . . . . . . . . . . . . $ 1.49Pro forma . . . . . . . . . . . . . . . . . . . . . . . . . . . . . . . . . . . . . . . . . . . . . . . . . . 1.09
F-24

The fair value of each option grant is estimated on the date of each grant using the Black-Scholes option-pricing model with the following weighted-average assumptions:
Fiscal2007
Fiscal2006
Fiscal2005
Risk-free interest rate . . . . . . . . . . . . . . . . . . . . . . . . . . . . . . . . . . . . . . . . . . . . — — 4.30%Expected option life (years) . . . . . . . . . . . . . . . . . . . . . . . . . . . . . . . . . . . . . . . — — 5.0Expected volatility . . . . . . . . . . . . . . . . . . . . . . . . . . . . . . . . . . . . . . . . . . . . . . . — — 42.3%Expected dividend yield . . . . . . . . . . . . . . . . . . . . . . . . . . . . . . . . . . . . . . . . . . — — 0.62%
There were no stock options granted during fiscal 2007 and 2006. The fair values generated by the Black-Scholes model may not be indicative of the future benefit, if any, that may be received by the option holder.
Stock option transactions are summarized as follows:
Fiscal 2007
Fixed Options Shares
WeightedAverage
Exercise Price
Outstanding, beginning of year . . . . . . . . . . . . . . . . . . . . . . . . . . . . . . . . . 5,915,269 $25.88Granted . . . . . . . . . . . . . . . . . . . . . . . . . . . . . . . . . . . . . . . . . . . . . . . . . . . . — —Exercised . . . . . . . . . . . . . . . . . . . . . . . . . . . . . . . . . . . . . . . . . . . . . . . . . . (179,575) 24.35Forfeited . . . . . . . . . . . . . . . . . . . . . . . . . . . . . . . . . . . . . . . . . . . . . . . . . . . (359,319) 26.12
Outstanding, end of year . . . . . . . . . . . . . . . . . . . . . . . . . . . . . . . . . . . . . . 5,376,375 $25.92
Options exercisable at year-end . . . . . . . . . . . . . . . . . . . . . . . . . . . . . . . . . 5,356,375 $25.92
Weighted-average fair value of options granted during the year . . . . . . . $ —
The following table summarizes information about stock options outstanding at February 2, 2008:
Options Outstanding Options Exercisable
Range of Exercise PricesOptions
Outstanding
Weighted-AverageRemaining
Contractual Life (Yrs.)Weighted-AverageExercise Price
OptionsExercisable
Weighted-AverageExercise Price
$24.01 - $24.73 . . . . . . . . . . 98,781 1.76 $24.18 78,781 $24.23$25.74 - $25.74 . . . . . . . . . . 3,925,000 7.98 25.74 3,925,000 25.74$25.95 - $30.47 . . . . . . . . . . 1,352,594 1.80 26.55 1,352,594 26.55
5,376,375 6.31 $25.92 5,356,375 $25.92
The intrinsic value of stock options exercised during the years ended February 2, 2008, February 3, 2007and January 28, 2006 was approximately $1.8 million, $14.4 million and $10.2 million, respectively. AtFebruary 2, 2008, the intrinsic value of outstanding stock options and exercisable stock options was $0.
The Company had non-vested options outstanding of 20,000 shares as of February 2, 2008. The non-vestedoptions outstanding as of February 2, 2008 had a weighted-average grant date fair value of $10.05 per share. Alloptions exercised are issued out of authorized shares.
F-25

13. Leases and Commitments
Rental expense consists of the following:
Fiscal2007
Fiscal2006
Fiscal2005
(in thousands of dollars)
Operating leases:Buildings:
Minimum rentals . . . . . . . . . . . . . . . . . . . . . . . . $25,798 $29,640 $30,611Contingent rentals . . . . . . . . . . . . . . . . . . . . . . . 5,997 6,558 6,775
Equipment . . . . . . . . . . . . . . . . . . . . . . . . . . . . . . . . . 28,192 19,282 10,152
$59,987 $55,480 $47,538
Contingent rentals on certain leases are based on a percentage of annual sales in excess of specifiedamounts. Other contingent rentals are based entirely on a percentage of sales.
The future minimum rental commitments as of February 2, 2008 for all noncancelable leases for buildingsand equipment are as follows:
Fiscal YearOperatingLeases
CapitalLeases
(in thousands of dollars)
2008 . . . . . . . . . . . . . . . . . . . . . . . . . . . . . . . . . . . . . . . . . . . . . . . . . . 56,065 4,6842009 . . . . . . . . . . . . . . . . . . . . . . . . . . . . . . . . . . . . . . . . . . . . . . . . . . 50,014 3,6282010 . . . . . . . . . . . . . . . . . . . . . . . . . . . . . . . . . . . . . . . . . . . . . . . . . . 37,325 3,5692011 . . . . . . . . . . . . . . . . . . . . . . . . . . . . . . . . . . . . . . . . . . . . . . . . . . 45,026 3,5092012 . . . . . . . . . . . . . . . . . . . . . . . . . . . . . . . . . . . . . . . . . . . . . . . . . . 34,118 13,787After 2012 . . . . . . . . . . . . . . . . . . . . . . . . . . . . . . . . . . . . . . . . . . . . . 33,143 12,066
Total minimum lease payments . . . . . . . . . . . . . . . . . . . . . . . . . . . . . $255,691 41,243
Less amount representing interest . . . . . . . . . . . . . . . . . . . . . . . . . . . (12,892)
Present value of net minimum lease payments (of which $2,613 iscurrently payable) . . . . . . . . . . . . . . . . . . . . . . . . . . . . . . . . . . . . . $ 28,351
Renewal options from three to 25 years exist on the majority of leased properties. At February 2, 2008, theCompany is committed to incur costs of approximately $153 million to acquire, complete and furnish certainstores and equipment.
During 2005, the Company sold and leased back certain corporate aircraft resulting in proceeds of $59.4million. These leases, which are accounted for under SFAS No. 13, Accounting for Leases, are classified as eitheroperating or capital, as appropriate, and are included in the tables above. The leases have seven-year terms. TheCompany recorded a capital lease obligation of $17.2 million related to certain aircraft noted above. Theremaining leases were recorded as operating leases and included in rent expense.
During 2005, the Company completed the disposition of all of the outstanding capital stock of an indirectwholly-owned subsidiary of the Company. The proceeds from the sale consist of $14 million in cash and a $3million promissory note. In connection with the transaction, various subsidiaries of the Company entered into anoperating lease agreement with the purchaser whereby they agreed to lease each of the properties for a term of 20years. The minimum future payments under the lease are $58 thousand per month and are included in the tableabove.
F-26

We were a member of a class of a settled lawsuit against Visa U.S.A. Inc. (“Visa”) and MasterCardInternational Incorporated (“MasterCard”). The Visa Check/MasterMoney Antitrust litigation settlement becamefinal on June 1, 2005. The settlement provided $3.05 billion in compensatory relief by Visa and MasterCard to befunded over a fixed period of time to respective Settlement Funds. We received and recorded $6.5 million ($4.0million after tax) as our share of the proceeds from the settlement during year ended February 3, 2007. Thisamount was recorded in service charges and other income.
On July 29, 2002, a Class Action Complaint (followed on December 13, 2004 by a Second Amended ClassAction Complaint) was filed in the United States District Court for the Southern District of Ohio against theCompany, the Mercantile Stores Pension Plan (the “Plan”) and the Mercantile Stores Pension Committee (the“Committee”) on behalf of a putative class of former Plan participants. The complaint alleged that certain actionsby the Plan and the Committee violated the Employee Retirement Income Security Act of 1974, as amended(“ERISA”), as a result of amendments made to the Plan that allegedly were either improper and/or ineffectiveand as a result of certain payments made to certain beneficiaries of the Plan that allegedly were improperlycalculated and/or discriminatory on account of age. The Second Amended Complaint did not specify anyliquidated amount of damages sought and sought recalculation of certain benefits paid to putative class members.
During fiscal 2006, the Company signed a memorandum of understanding and recorded additional expenseof $21.7 million in SG&A to settle the case. The settlement became final in early April 2007. During the yearended February 2, 2008, the Company paid this settlement. The litigation continues between the Company andthe Plan’s actuarial firm over the Company’s cross claim against the actuarial firm seeking reimbursement for thesettlement and additional damages.
Various other legal proceedings, in the form of lawsuits and claims, which occur in the normal course ofbusiness, are pending against the Company and its subsidiaries. In the opinion of management, disposition ofthese matters is not expected to materially affect the Company's financial position, cash flows or results ofoperations.
14. Insurance Proceeds
During the year ended January 28, 2006, Hurricane Katrina, Hurricane Rita and Hurricane Wilmainterrupted operations in approximately 60 of the Company’s stores for varying amounts of time. Ten storessuffered damage to either merchandise or property related to the hurricanes. One store in the New Orleans areawas permanently closed. A store in Biloxi, Mississippi was closed throughout the remainder of fiscal 2005 andremained closed for clean-up and reconstruction until its re-opening in March 2008.
Property and merchandise losses in the affected stores were covered by insurance. Insurance proceeds of$22.0 million, $27.8 million and $110.1 million were received during fiscal 2007, 2006 and 2005, respectively.The Company recorded related gains in fiscal 2007 of $14.1 million and $4.1 million in gain on disposal of assetsand cost of sales, respectively. The Company recorded a related gain of $29.7 million in 2005 in cost of sales.
15. Asset Impairment and Store Closing Charges
During fiscal 2007, the Company recorded a pretax charge of $20.5 million for asset impairment and storeclosing costs. The charge consists of a write-off of goodwill on one store of $2.6 million, an accrual for futurerent, property tax and utility payments on two stores of $1.0 million and a write-down of property and equipmenton 14 stores for $16.9 million.
There were no asset impairment and store closing charges for fiscal 2006.
During fiscal 2005, the Company recorded a pretax charge of $61.7 million for asset impairment and storeclosing costs. Included in asset impairment and store closing charges is a pretax loss on the disposition of all the
F-27

outstanding capital stock of an indirect wholly-owned subsidiary in the amount of $40.1 million. The charge alsoconsists of a write-down of goodwill on one store of $1.0 million, an accrual for future rent, property tax andutility payments on four stores of $3.7 million and a write-down of property and equipment on nine stores in theamount of $16.9 million
A breakdown of the asset impairment and store closing charges follows:
Fiscal 2007 Fiscal 2006 Fiscal 2005
Number ofLocations
ImpairmentAmount
Number ofLocations
ImpairmentAmount
Number ofLocations
ImpairmentAmount
(in thousands of dollars)
Stores closed in previous fiscal year . . . . 1 $ 687 — $— — $ —Stores closed in current fiscal year . . . . . 4 3,647 — — 5 8,729Stores to close in next fiscal year . . . . . . 5 5,083 — — — —Stores impaired based on cash flows . . . . 6 9,113 — — 9 12,899Wholly-owned subsidiary . . . . . . . . . . . . — — — — 7 40,106Non-operating facility . . . . . . . . . . . . . . . 1 1,970 — — — —
Total . . . . . . . . . . . . . . . . . . . . . . . . . 17 $20,500 — $— 21 $61,734
Following is a summary of the activity in the reserve established for asset impairment and store closingcharges:
Balance,beginningof year Charges
CashPayments
Balance,end ofyear
(in thousands of dollars)
Fiscal 2007Rent, property taxes and utilities . . . . . . . . . . . . . . . . . . . . . . . . . . . . $3,406 $1,100 $1,726 $2,780
Fiscal 2006Rent, property taxes and utilities . . . . . . . . . . . . . . . . . . . . . . . . . . . . 4,281 — 875 3,406
Fiscal 2005Rent, property taxes and utilities . . . . . . . . . . . . . . . . . . . . . . . . . . . . 2,905 3,703 2,327 4,281
The reserve is recorded in trade accounts payable and accrued expenses and other liabilities
16. Fair Value Disclosures
The estimated fair values of financial instruments which are presented herein have been determined by theCompany using available market information and appropriate valuation methodologies. However, considerablejudgment is required in interpreting market data to develop estimates of fair value. Accordingly, the estimatespresented herein are not necessarily indicative of amounts the Company could realize in a current marketexchange.
The fair value of the Company’s long-term debt and guaranteed preferred beneficial interests in theCompany’s subordinated debentures is based on market prices or dealer quotes (for publicly traded unsecurednotes) and on discounted future cash flows using current interest rates for financial instruments with similarcharacteristics and maturity (for bank notes and mortgage notes).
The fair value of the Company’s cash and cash equivalents and trade accounts receivable approximates theircarrying values at February 2, 2008 and February 3, 2007 due to the short-term maturities of these instruments.The fair values of the Company’s long-term debt at February 2, 2008 and February 3, 2007 were $835 millionand $1.06 billion, respectively. The carrying value of the Company’s long-term debt at February 2, 2008 and
F-28

February 3, 2007 was $957 million and $1.06 billion, respectively. The fair value of the guaranteed preferredbeneficial interests in the Company’s subordinated debentures at February 2, 2008 and February 3, 2007 was$166 million and $198 million, respectively. The carrying value of the guaranteed preferred beneficial interestsin the Company’s subordinated debentures at February 2, 2008 and February 3, 2007 was $200 million.
17. Quarterly Results of Operations (unaudited)
Fiscal 2007, Three Months Ended
May 5 August 4 November 3 February 2
(in thousands of dollars, except per share data)
Net sales . . . . . . . . . . . . . . . . . . . . . . . . . . . . . . . . . . . . . . . $1,762,954 $1,648,533 $1,633,443 $2,162,487Gross profit . . . . . . . . . . . . . . . . . . . . . . . . . . . . . . . . . . . . . 636,863 519,854 562,782 701,263Net income (loss) . . . . . . . . . . . . . . . . . . . . . . . . . . . . . . . . 42,924 (25,166) (11,341) 47,344Diluted earnings per share:Net income (loss) . . . . . . . . . . . . . . . . . . . . . . . . . . . . . . . . $ 0.53 $ (0.31) $ (0.15) $ 0.63
Fiscal 2006, Three Months Ended
April 29 July 29 October 28 February 3
(in thousands of dollars, except per share data)
Net sales . . . . . . . . . . . . . . . . . . . . . . . . . . . . . . . . . . . . . . . $1,835,309 $1,685,477 $1,719,321 $2,395,949Gross profit . . . . . . . . . . . . . . . . . . . . . . . . . . . . . . . . . . . . . 655,872 563,204 601,008 783,621Net income . . . . . . . . . . . . . . . . . . . . . . . . . . . . . . . . . . . . . 61,319 15,727 13,609 154,991Diluted earnings per share:Net income . . . . . . . . . . . . . . . . . . . . . . . . . . . . . . . . . . . . . $ 0.77 $ 0.20 $ 0.17 $ 1.90
Total of quarterly earnings per common share may not equal the annual amount because net income percommon share is calculated independently for each quarter.
Quarterly information for fiscal 2007 and fiscal 2006 includes the following items:
First Quarter
2007
• a $4.1 million pretax gain ($2.6 million after tax or $0.03 per diluted share) related to reimbursementfor inventory damages incurred during the 2005 hurricane season.
Second Quarter
2007
• a $3.1 million pretax gain ($1.9 million after tax or $0.02 per diluted share) related to reimbursementfor inventory and property damages incurred during the 2005 hurricane season.
2006
• a $13.5 million pretax gain ($8.5 million after tax or $0.11 per diluted share) on the sale of theCompany’s interest in a mall joint venture.
• a $6.5 million pretax gain ($4.0 million after tax or $0.05 per diluted share) related to proceedsreceived from the Visa Check/Mastermoney Antitrust litigation.
• a $21.7 million pretax charge ($13.6 million after tax or $0.17 per diluted share) for a memorandum ofunderstanding reached in a litigation case.
F-29

• a $5.8 million income tax benefit ($0.07 per diluted share) for the change in a capital loss valuationallowance due to capital gain income and $6.5 million income tax benefit ($0.08 per diluted share) dueto the release of tax reserves.
Third Quarter
2007
• a $3.7 million pretax charge ($2.3 million after tax or $0.03 per diluted share) for asset impairment andstore closing charges related to a future lease obligation on a store closed during the third quarter of2007 and the write-off of goodwill for a store planned to close during the fourth quarter of 2007.
• an $11.1 million pretax gain ($7.0 million after tax or $0.09 per diluted share) related to reimbursementfor property damages incurred during the 2005 hurricane season as the Company completed thecleanup of the damaged location during the year.
Fourth Quarter
2007
• a $16.1 million pretax charge ($10.1 million after tax or $0.13 per diluted share) for asset impairmentand store closing charges related to certain stores.
• a $10.3 million income tax benefit ($0.14 per diluted share) primarily due to state administrativesettlement, federal credits and the change in a capital loss valuation allowance.
2006
• a $10.5 million pretax interest credit ($6.6 million after tax or $0.08 per diluted share) and a net incometax benefit of $64.0 million ($0.80 per diluted share) which includes $18.3 million for the change in acapital loss valuation allowance. Both the pretax interest credit and the income tax benefit are related tostatute expirations and audit settlements with federal and state authorities for multiple tax years.
F-30
EXHIBIT INDEX
Number Description
*3(a) Restated Certificate of Incorporation (Exhibit 3 to Form 10-Q for the quarter ended August 1, 1992in 1-6140).
*3(b) By-Laws as currently in effect (Exhibit 4.2 to Form S-8 filed November 27, 2007 in 333-147636).
*4(a) Indenture between the Registrant and Chemical Bank, Trustee, dated as of October 1, 1985 (Exhibit(4) in 2-85556).
*4(b) Indenture between the Registrant and Chemical Bank, Trustee, dated as of October 1, 1986 (Exhibit(4) in 33-8859).
*4(c) Indenture between Registrant and Chemical Bank, Trustee, dated as of April 15, 1987 (Exhibit 4.3 in33-13534).
*4(d) Indenture between Registrant and Chemical Bank, Trustee, dated as of May 15, 1988, assupplemented (Exhibit 4 in 33-21671, Exhibit 4.2 in 33-25114 and Exhibit 4(c) to Current Report onForm 8-K dated September 26, 1990 in 1-6140).
*4(e) Rights Agreement between Dillard’s, Inc. and Registrar and Transfer Company, as Rights Agent(Exhibit 4.1 to Form 8-K dated as of March 2, 2002 in 1-6140).
**10(a) Retirement Contract of William Dillard dated March 8, 1997 (Exhibit 10(a) to Form 10-K for thefiscal year ended February 1, 1997 in 1-6140).
**10(b) 1998 Incentive and Nonqualified Stock Option Plan (Exhibit 10(b) to Form 10-K for the fiscal yearended January 30, 1999 in 1-6140).
**10(c) Amended and Restated Corporate Officers Non-Qualified Pension Plan (Exhibit 10.1 to Form 8-Kdated as of November 17, 2007 in 1-6140).
**10(d) Senior Management Cash Bonus Plan (Exhibit 10(d) to Form 10-K for the fiscal year ended January28, 1995 in 1-6140).
**10(e) 2000 Incentive and Nonqualified Stock Option Plan (Exhibit 10(e) to Form 10-K for the fiscal yearended February 3, 2001 in 1-6140).
*10(f) Second Amendment to Amended and Restated Credit Agreement among Dillard’s, Inc. andJPMorgan Chase Bank (Exhibit 10 to Form 8-K dated June 3, 2005 in 1-6140).
*10(g) Purchase, Sale and Servicing Transfer Agreement among GE Capital Consumer Card Co., GeneralElectric Capital Corporation, Dillards, Inc. and Dillard National Bank (Exhibit 2.1 to Form 8-K datedas of August 12, 2004 in 1-6140).
*10(h) Private Label Credit Card Program Agreement between Dillards, Inc. and GE Capital ConsumerCard Co. (Exhibit 10.1 to Form 8-K dated as of August 12, 2004 in 1-6140).
*10(i) Third Amendment to Amended and Restated Credit Agreement between Dillard’s, Inc. andJPMorgan Chase Bank, N.A. as agent for a syndicate of lenders (Exhibit 10.1 to Form 8-K datedJune 12, 2006 in File No. 1-6140).
*10(j) Fourth Amendment to Amended and Restated Credit Agreement between Dillard’s, Inc. andJPMorgan Chase Bank, N.A. as agent for a syndicate of lenders (Exhibit 10.2 to Form 8-K datedJune 12, 2006 in File No. 1-6140).
*10(k) Fifth Amendment to Amended and Restated Credit Agreement between Dillard’s, Inc. and JPMorganChase Bank, N.A. as agent for a syndicate of lenders (Exhibit 10.1 to Form 8-K dated May 4, 2007 inFile No. 1-6140).
E-1

Number Description
12 Statement re: Computation of Ratio of Earnings to Fixed Charges.
21 Subsidiaries of Registrant.
23 Consent of Independent Registered Public Accounting Firm.
31(a) Certification of Chief Executive Officer Pursuant to Section 302 of the Sarbanes-Oxley Act of 2002.
31(b) Certification of Chief Financial Officer Pursuant to Section 302 of the Sarbanes-Oxley Act of 2002.
32(a) Certification of Chief Executive Officer Pursuant to Section 906 of the Sarbanes-Oxley Act of 2002(18 U.S.C. 1350).
32(b) Certification of Chief Financial Officer Pursuant to Section 906 of the Sarbanes-Oxley Act of 2002(18 U.S.C. 1350).
* Incorporated by reference as indicated.
** A management contract or compensatory plan or arrangement required to be filed as an exhibit to this reportpursuant to Item 14(c) of Form 10-K.
E-2


2007a n n u a l r e p o r t
Robert C. Connor ~ Investments ~ Dallas, TexasDrue Corbusier ~ Executive Vice President of Dillard’s, Inc.Will D. Davis ~ Partner with Heath, Davis & McCalla, Attorneys ~ Austin, TexasAlex Dillard ~ President of Dillard’s, Inc.Mike Dillard ~ Executive Vice President of Dillard’s, Inc.William Dillard, II ~ Chairman of the Board & Chief Executive Offi cer of Dillard’s, Inc.James I. Freeman ~ Senior Vice President & Chief Financial Offi cer of Dillard’s, Inc.John Paul Hammerschmidt ~ Retired Member of Congress ~ Harrison, ArkansasPeter R. Johnson ~ Chairman & Chief Executive Offi cer of PRJ Holdings, Inc. ~ San Francisco, CaliforniaWarren A. Stephens ~ President & Chief Executive Offi cer of Stephens Inc., Co-Chairman of SF Holding Corp. ~ Little Rock, ArkansasWilliam H. Sutton ~ Of Counsel, Friday, Eldredge & Clark, Attorneys ~ Little Rock, ArkansasJ.C. Watts, Jr. ~ Former Member of Congress & Chairman of J.C. Watts Companies ~ Washington, D.C.
board of directors
William Dillard, II ~ Chief Executive Offi cerAlex Dillard ~ PresidentMike Dillard ~ Executive Vice PresidentDrue Corbusier ~ Executive Vice PresidentJames I. Freeman ~ Senior Vice President & Chief Financial Offi cerPaul J. Schroeder, Jr. ~ Vice President & General Counsel
corporate organization
Tony BolteKent BurnettJames W. Cherry, Jr.Randal L. HankinsWilliam L. Holder, Jr.Chris JohnsonDenise MahaffySteven K. Nelson
Michael E. PriceChristine RowellSidney A. SandersBurt SquiresPhillip R. WattsKent WileyRichard B. WilleySherrill E. Wise
vice presidents
Presidents, Regional Merchandising:Drue CorbusierMike DillardRobin SanderfordJulie A. TaylorDavid Terry
General Merchandise Managers:Lynn ConnerMark KillingsworthJeff MennAnthony MenzieLisa M. RobySandra SteinbergBob ThompsonTom WardKeith WhiteRonald Wiggins
regional vice presidents – merchandising
W.R. Appleby, IITom BolinLarry CailteuxDebra DumasMark GastmanWalter C. GrammerMarva HarrellGene D. Heil
William H. HiteDan W. JensenMike LitchfordBrant MusgraveZeina T. NassarGrizelda ReederLinda Sholtis-TuckerAlan Steinberg
regional vice presidents – storesVice Presidents, Merchandising:Joseph P. BrennanNeil ChristensenWilliam T. Dillard, IIIChristine A. FerrariMike McNiffTerry SmithJames D. StockmanLloyd Keith Tidmore
Vice Presidents:Les ChandlerGianni DuarteAnn FranzkeRichard MooreKay White
corporate merchandising product development

Dillard’s, Inc. ranks among the nation’s largest fashion apparel and home furnishings retailers
with annual revenues exceeding $7.3 billion. The Company focuses on delivering maximum fashion
and value to its shoppers by offering compelling apparel and home selections complemented
by exceptional customer care. Dillard’s stores offer a broad selection of merchandise and feature
products from both national and exclusive brand sources. The Company operates 326 Dillard’s
locations spanning 29 states, all with one nameplate — Dillard’s.
financial and other informationCopies of financial documents and other company information such as Dillard’s, Inc. reports on Form 10-Kand 10-Q and other reports filed with the Securities and Exchange Commission are available by contacting:
Dillard’s, Inc.Investor Relations1600 Cantrell RoadLittle Rock, Arkansas 72201501.376.5544E-mail: [email protected]
Financial reports, press releases and other Company information are available on the Dillard’s, Inc. Web site: www.dillards.com
Individuals or securities analysts with questions regarding Dillard’s, Inc. may contact:
Julie J. BullDirector of Investor Relations1600 Cantrell RoadLittle Rock, Arkansas 72201Telephone: 501.376.5965Fax: 501.376.5917E-mail: [email protected]
transfer agent and registrarRegistered shareholders should address communications regarding address changes, lost certificates, and other administrative matters to the Company’s Transfer Agent and Registrar:
Registrar and Transfer Company10 Commerce DriveCranford, New Jersey 07016-3572Telephone: 800.368.5948E-mail: [email protected] site: www.rtco.com
Please refer to Dillard’s, Inc. on all correspondence and have available yourname as printed on your stock certificate, your Social Security number, your address and phone number.
corporate headquarters1600 Cantrell RoadLittle Rock, Arkansas 72201
mailing addressPost Office Box 486Little Rock, Arkansas 72203Telephone: 501.376.5200Fax: 501.376.5917
listingNew York Stock Exchange,Ticker Symbol “DDS”
on the coverThe look, feel and craftsmanshipof “Real Luxuries” are shown in this handbag by David and Scottiand featured in “Dillard’s – The Styleof Your Life.”
Cert no. SCS-COC-00648