Embed Size (px)
Citation preview
Positioned for the
2007 Annual Report
F u tu re
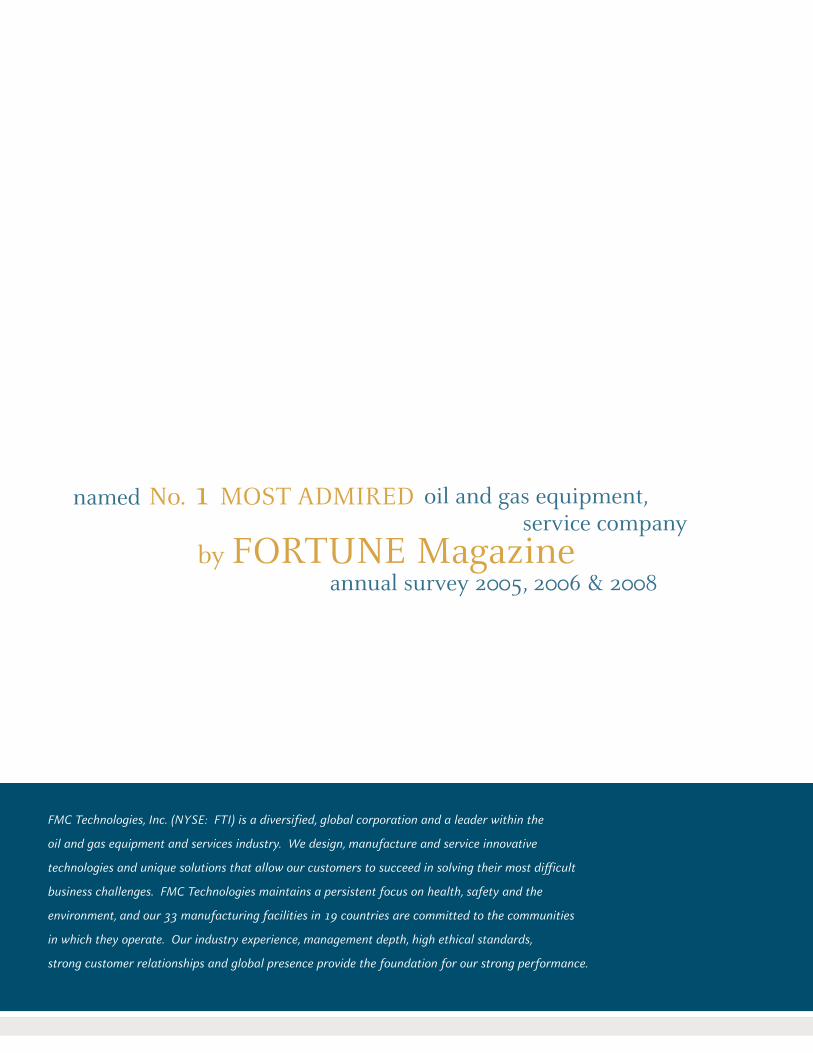
FMC Technologies, Inc. (NYSE: FTI) is a diversified, global corporation and a leader within the
oil and gas equipment and services industry. We design, manufacture and service innovative
technologies and unique solutions that allow our customers to succeed in solving their most difficult
business challenges. FMC Technologies maintains a persistent focus on health, safety and the
environment, and our 33 manufacturing facilities in 19 countries are committed to the communities
in which they operate. Our industry experience, management depth, high ethical standards,
strong customer relationships and global presence provide the foundation for our strong performance.
oil and gas equipment,
by FORTUNE Magazinenamed No. 1 MOST ADMIRED
annual survey 2005, 2006 & 2008
service company

FMC Technologies, Inc. Annual Report 2007
1
Company Profile 2
Financial Highlights 3
Letter to Employees & Shareholders 4
Operations Review 10
Technology & Innovation 16
Corporate Responsibility 24
Board of Directors & Officers 26
Glossary 28
Management’s Discussion & Analysis 29
Financial Statements 45
people, technology, growth
FMC Technologies, Inc. Annual Report 2007
2
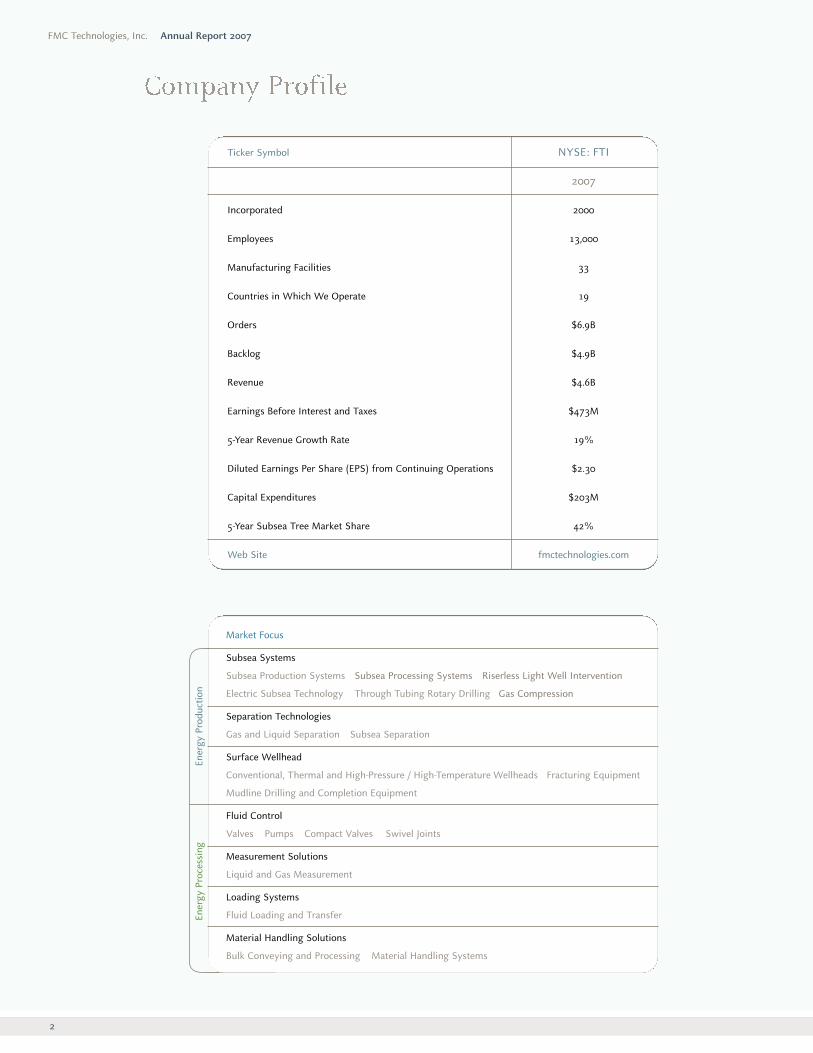
Ticker Symbol NYSE: FTI
2007
Incorporated 2000
Employees 13,000
Manufacturing Facilities 33
Countries in Which We Operate 19
Orders $6.9B
Backlog $4.9B
Revenue $4.6B
Earnings Before Interest and Taxes $473M
5-Year Revenue Growth Rate 19%
Diluted Earnings Per Share (EPS) from Continuing Operations $2.30
Capital Expenditures $203M
5-Year Subsea Tree Market Share 42%
Web Site fmctechnologies.com
Ener
gy P
rodu
ctio
nEn
ergy
Pro
cess
ing
Market Focus
Subsea Systems
Subsea Production Systems Subsea Processing Systems Riserless Light Well Intervention
Electric Subsea Technology Through Tubing Rotary Drilling Gas Compression
Separation Technologies
Gas and Liquid Separation Subsea Separation
Surface Wellhead
Conventional, Thermal and High-Pressure / High-Temperature Wellheads Fracturing Equipment
Mudline Drilling and Completion Equipment
Fluid Control
Valves Pumps Compact Valves Swivel Joints
Measurement Solutions
Liquid and Gas Measurement
Loading Systems
Fluid Loading and Transfer
Material Handling Solutions
Bulk Conveying and Processing Material Handling Systems
FMC Technologies, Inc. Financial Highlights
3
(1) All share information has been adjusted for the two-for-one stock split on August 31, 2007.(2) Net debt consists of short-term debt, long-term debt and the current portion of long-term debt, less cash and cash equivalents.(3) Order backlog is calculated as the estimated sales value of unfilled, confirmed customer orders at the reporting date.
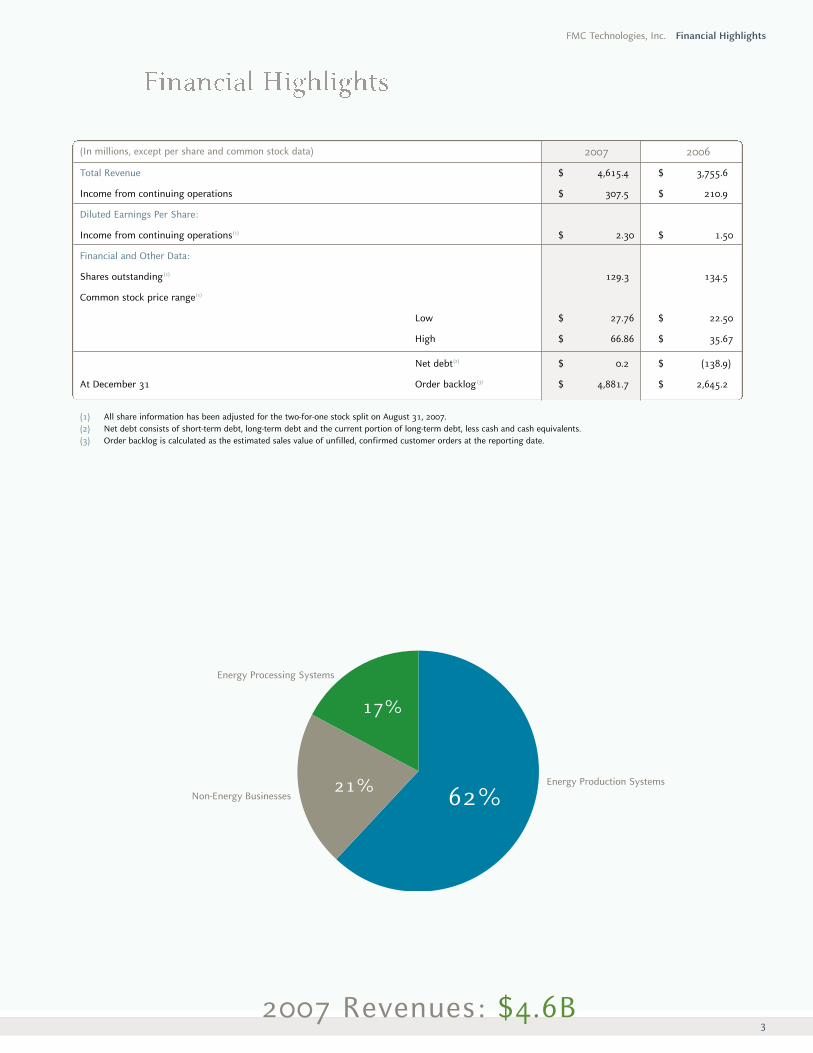
62%
17%
Energy Production Systems
Energy Processing Systems
Non-Energy Businesses21%
2007 2006
Total Revenue $ 4,615.4 $ 3,755.6
Income from continuing operations $ 307.5 $ 210.9
Diluted Earnings Per Share:
Income from continuing operations(1) $ 2.30 $ 1.50
Financial and Other Data:
Shares outstanding (1) 129.3 134.5
Common stock price range(1)
Low $ 27.76 $ 22.50
High $ 66.86 $ 35.67
Net debt(2) $ 0.2 $ (138.9)
At December 31 Order backlog (3) $ 4,881.7 $ 2,645.2
(In millions, except per share and common stock data)
2007 Revenues: $4.6B
’01 ’02 ’03 ’04 ’05 ’06 ’07
5.0
4.5
4.0
3.5
3.0
2.5
2.0
1.5
1.0
.5
0.0
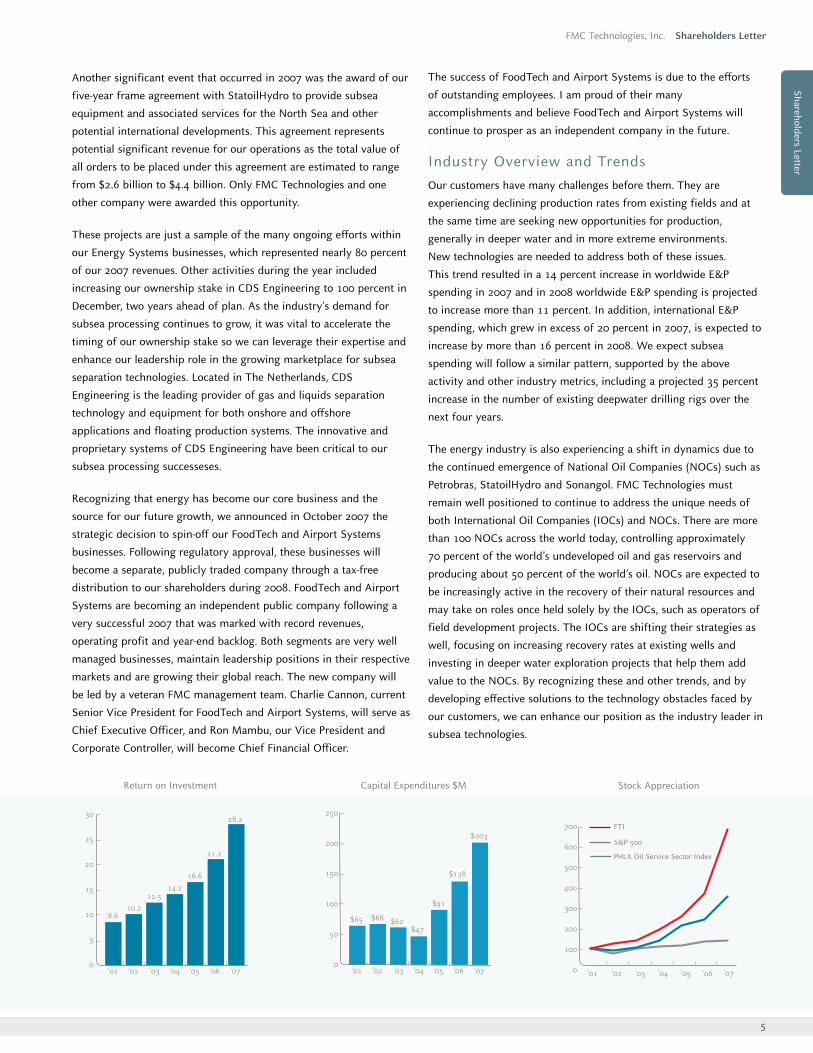
$1.8 $1.9$2.2
$2.5
$3.1
$3.8
$4.6
FMC Technologies, Inc. Annual Report 2007
4
FMC Technologies had an outstanding 2007, recording our sixth
consecutive year of sales and earnings gains. Sales for the year
increased 23 percent to $4.6 billion and earnings per share from
continuing operations rose 53 percent to a split-adjusted $2.30. Our
growth was driven by a talented, worldwide employee base that now
exceeds 13,000 individuals. FMC Technologies accomplished a
number of firsts during 2007, most importantly, the deployment of
our subsea separation technology at the Tordis field in the
Norwegian North Sea. In addition, shareholders were rewarded with
the first-ever stock split in FMC’s history as a public company.
Our continued growth during 2007 included the receipt of the largest
subsea order in our history. We also began the process of
spinning-off our FoodTech and Airport Systems businesses so we can
remain focused on providing technology solutions for the energy
industry. It was, indeed, a remarkable journey in my first year as
your President and Chief Executive Officer.
Our Growth in 2007
• Total company backlog increased to a record $4.9 billion.
• Subsea backlog increased to $3.9 billion.
• Energy Production Systems revenue grew 28 percent to
$2.9 billion.
• Energy Processing Systems revenue increased 14 percent to
$768 million.
• FoodTech and Airport Systems generated revenue of
$593 million and $384 million, respectively.
Inbound $B Revenue $B Adjusted EPS from Continuing Operations (1)
Our SuccessesOur advanced technologies and
strong customer relationships
resulted in record inbound
orders during 2007. Among the
projects awarded to FMC last
year was Total’s Pazflor project,
located offshore Angola. Valued at
approximately $980 million in
revenue, Pazflor is our largest subsea
project award received to date.
Pazflor is the fourth subsea separation
project announced within our industry
in the last two years, and FMC has
been the recipient of all of these
projects, which are located in four
major deepwater basins across the
globe. We are very honored to have
been awarded all four contracts and
believe our selection is the result of
our advanced technologies and our
position as the subsea pioneer and subsea leader in our industry. In
addition to Total’s Pazflor project, our subsea processing technologies
will also be utilized in Shell’s BC-10 project in Brazil, Shell’s Perdido
project in the Gulf of Mexico and StatoilHydro’s Tordis project in the
Norwegian North Sea. Our people and innovative technological
developments have truly set us apart in our industry. Our valued
customers recognize this and rely upon us every day. These
capabilities will continue to drive our successes as our customers
continue to focus on deepwater developments.
$2.1 $1.9$2.3
$3.0$3.5
$4.5
$6.97.0
6.0
5.0
4.0
3.0
2.0
1.0
0’01 ’02 ’03 ’04 ’05 ’06 ’07 ’01 ’02 ’03 ’04 ’05 ’06 ’07
$.38 $.41$.52
$.73
$1.00
$1.50
$2.302.5
2.0
1.5
1.0
0.5
0.0
* Before the cumulative effect of accounting changes (1) See reconciliation of non-GAAP measure on page 81.
*
Shar
ehol
ders
Let
ter
FMC Technologies, Inc. Shareholders Letter
5
Another significant event that occurred in 2007 was the award of our
five-year frame agreement with StatoilHydro to provide subsea
equipment and associated services for the North Sea and other
potential international developments. This agreement represents
potential significant revenue for our operations as the total value of
all orders to be placed under this agreement are estimated to range
from $2.6 billion to $4.4 billion. Only FMC Technologies and one
other company were awarded this opportunity.
These projects are just a sample of the many ongoing efforts within
our Energy Systems businesses, which represented nearly 80 percent
of our 2007 revenues. Other activities during the year included
increasing our ownership stake in CDS Engineering to 100 percent in
December, two years ahead of plan. As the industry’s demand for
subsea processing continues to grow, it was vital to accelerate the
timing of our ownership stake so we can leverage their expertise and
enhance our leadership role in the growing marketplace for subsea
separation technologies. Located in The Netherlands, CDS
Engineering is the leading provider of gas and liquids separation
technology and equipment for both onshore and offshore
applications and floating production systems. The innovative and
proprietary systems of CDS Engineering have been critical to our
subsea processing successeses.
Recognizing that energy has become our core business and the
source for our future growth, we announced in October 2007 the
strategic decision to spin-off our FoodTech and Airport Systems
businesses. Following regulatory approval, these businesses will
become a separate, publicly traded company through a tax-free
distribution to our shareholders during 2008. FoodTech and Airport
Systems are becoming an independent public company following a
very successful 2007 that was marked with record revenues,
operating profit and year-end backlog. Both segments are very well
managed businesses, maintain leadership positions in their respective
markets and are growing their global reach. The new company will
be led by a veteran FMC management team. Charlie Cannon, current
Senior Vice President for FoodTech and Airport Systems, will serve as
Chief Executive Officer, and Ron Mambu, our Vice President and
Corporate Controller, will become Chief Financial Officer.
The success of FoodTech and Airport Systems is due to the efforts
of outstanding employees. I am proud of their many
accomplishments and believe FoodTech and Airport Systems will
continue to prosper as an independent company in the future.
Industry Overview and TrendsOur customers have many challenges before them. They are
experiencing declining production rates from existing fields and at
the same time are seeking new opportunities for production,
generally in deeper water and in more extreme environments.
New technologies are needed to address both of these issues.
This trend resulted in a 14 percent increase in worldwide E&P
spending in 2007 and in 2008 worldwide E&P spending is projected
to increase more than 11 percent. In addition, international E&P
spending, which grew in excess of 20 percent in 2007, is expected to
increase by more than 16 percent in 2008. We expect subsea
spending will follow a similar pattern, supported by the above
activity and other industry metrics, including a projected 35 percent
increase in the number of existing deepwater drilling rigs over the
next four years.
The energy industry is also experiencing a shift in dynamics due to
the continued emergence of National Oil Companies (NOCs) such as
Petrobras, StatoilHydro and Sonangol. FMC Technologies must
remain well positioned to continue to address the unique needs of
both International Oil Companies (IOCs) and NOCs. There are more
than 100 NOCs across the world today, controlling approximately
70 percent of the world’s undeveloped oil and gas reservoirs and
producing about 50 percent of the world’s oil. NOCs are expected to
be increasingly active in the recovery of their natural resources and
may take on roles once held solely by the IOCs, such as operators of
field development projects. The IOCs are shifting their strategies as
well, focusing on increasing recovery rates at existing wells and
investing in deeper water exploration projects that help them add
value to the NOCs. By recognizing these and other trends, and by
developing effective solutions to the technology obstacles faced by
our customers, we can enhance our position as the industry leader in
subsea technologies.
Return on Investment Capital Expenditures $M Stock Appreciation
’01 ’02 ’03 ’04 ’05 ’06 ’07
8.610.2
12.514.2
16.6
21.2
28.230
25
20
15
10
5
0
700
600
500
400
300
200
100
0 ’01 ’02 ’03 ’04 ’05 ’06 ’07
FTI
S&P 500
PHLX Oil Service Sector Index
’01 ’02 ’03 ’04 ’05 ’06 ’07
$65 $68 $62$47
$91
$138
$203
250
200
150
100
50
0
Shareholders Letter

6
The demand for natural resources such as oil and gas is projected to
increase for the foreseeable future. In addition, a growing number of
other energy sources are also being pursued. These include heavy oil,
oil sands, shale oil, coalbed methane and tight gas. Development of,
and investment in, these hydrocarbon sources is expected to increase
as world demand grows. Our strategies position FMC to effectively
and profitably respond to these opportunities.
Shaping the FutureFMC’s management team has identified a number of strategies to
effectively respond to our customers’ needs and industry trends.
Four strategies in particular are key to shaping the future of our
company:
• Growing our energy business
• Developing future technologies
• Strengthening customer relationships
• Investing in our employees
Growing Our Energy BusinessesOur subsea products remain the largest and fastest growing segment
of our business and accounted for 49 percent of FMC’s total revenues
in 2007. Over the last five years, revenue in our subsea business has
increased at a 27 percent compound annualized growth rate (CAGR)
and we have clearly remained the market leader in the sector. The
subsea production market is forecast to continue its current growth
rate as customers venture into deeper water in search of
hydrocarbons and the complexity and sophistication of
equipment on the seabed increase.
Industry projections also suggest there will be a continued increase
in the construction and deployment of new deepwater drilling
vessels, or rigs. As these rigs are deployed and the ensuing field
completion activities progress, the result will be an expedited
demand for subsea products and systems. In fact, more than 75 new
rigs are expected to be delivered by 2011, further supporting growth
in the underlying subsea business.
Developing Future TechnologiesTo support the growth of our subsea energy businesses, we are
continually expanding our range of products and solutions. Two of
our most recent growth initiatives, Riserless Light Well Intervention
(RLWI) and Subsea Processing, which includes separation, boosting
and gas compression, have enhanced our existing portfolio of subsea
technologies and systems. We announced two new RLWI contracts
that will go into operation in 2008, one for StatoilHydro and one for
BP. These and other technologies have provided growth avenues
outside of our traditional subsea completion business. As a result,
FMC’s average order value per subsea well has more than doubled in
the last four years to approximately $19 million in 2007. We expect
that new technology developments will also contribute to growth in
areas outside the traditional subsea market.
Equally important to our growth is the continued development and
expansion of our surface wellhead and fluid control businesses. Our
surface wellhead business is driven by global drilling and completion
activity. Growth in this area has been enhanced by recent
acquisitions of businesses, including Netherlands-based VOS
Wellhead as well as the 2006 purchase of Canada-based Galaxy
thermal wellheads. Our surface wellhead business is also benefiting
from our investments in the development of specialized fracturing
rental equipment. FMC Technologies will continue to seek strategic
acquisitions as we look to expand our scope, improve our technology
focus and strengthen our position in key markets. Growth in the fluid
control market is driven by drilling activities, including pressure
pumping activities. We are fortunate to be the leading equipment
supplier to this market and will continue to focus on product
availability, technology and aftermarket services.
FMC Technologies, Inc. Annual Report 2007
6,000
8,000
10,000
12,000
14,000
20022001 2003 2004 2005 2006 2007
Employees
Shar
ehol
ders
Let
ter

7
We must maintain an appropriate manufacturing capacity to meet
the future equipment and technological needs of our customers.
Capital expenditures for 2007 were approximately $203 million,
primarily for the expansion and construction of new manufacturing
and service facilities across the globe as well as investments in RLWI
tools and equipment. Our subsea tree production capacity will
increase to approximately 335 trees by the end of 2008. This increase
in capacity will accommodate the expected demand levels we project
for our subsea products and systems. We will continue to assess the
need to add future capacity beyond this level.
Strengthening Customer RelationshipsWe achieved many successes with our customers during the past
year while solidifying our position as a global company with a
regional focus. Projects in the Gulf of Mexico, West Africa, the
North Sea and in deepwater offshore Australia and Brazil have
resulted from our relationship building and collaborative
technological developments. We will continue to add value and
provide technological expertise to our customers in 2008 while
differentiating ourselves from our competition.
We have strong relationships with all of our customers. We value the
trust and confidence they place in our people and our advanced
technologies. Subsea exploration is vital to our growth, to the
sustainability of our industry and to the success of our customers.
As the depths in which we operate continue to increase and become
more challenging, so too must the sophistication and complexity of
our technological solutions. FMC has demonstrated an unparalleled
ability to provide value-added products and services and to respond
to the unique needs of our customers. To expand upon our
leadership position in the industry, we must continue to execute
in the same manner.
We also continue to increase the level of local participation at our
facilities in the communities where we operate. We accomplish
added involvement in our deepwater projects through the hiring of
local employees and the use of local suppliers and other expertise
that exists in each region. By utilizing local businesses, we are able to
meet the expectations of our customers while infusing capital and
economic opportunities into the communities in which we operate.
Whether in Angola, Brazil, Malaysia, Nigeria, Norway or Russia, we
continue to set the standard for inclusiveness by working together
within our communities. For example, two recently announced
projects — Shell’s Gumusut-Kakap and Total’s Pazflor — will be
supported by local suppliers and new employees hired into our
operations in those regions. For Gumusut-Kakap, our Malaysian
facilities in Nusajaya and in Kuala Lumpur will provide local
manufacturing and project assistance, while Pazflor will be supported
by our base in Luanda, Angola. FMC Technologies is aligned across
its subsea businesses with interchangeable project management
processes, quality systems, engineering standards, supply
management, manufacturing/assembly practices and offshore
procedures. As a result, FMC is able to support its customers
seamlessly with solutions so they can successfully execute their
projects anywhere in the world.
Investing in Our EmployeesOur investments are not limited to acquisitions and facility
expansions. We understand that to maintain and widen our position
as the industry leader, we must continue to aggressively attract and
retain the most talented employees in the industry. Throughout our
organization — from engineering, manufacturing and project
management professionals to administrative and service personnel
— we must continue to hire individuals who are committed to
developing long-term customer relationships and innovative
investing in our employees
FMC Technologies, Inc. Shareholders Letter
Shareholders Letter
8
technological solutions. Our strong historical performance is
attributable to our talented employees and innovative technologies,
both of which will continue to drive our future growth.
We also recognize that education and training are necessary to
community development and individual successes. By partnering
with local educational institutions in many of the countries in which
we operate, we have laid the foundation to develop future managers
by exposing them to the skills and fundamentals of our industry.
FMC currently maintains recruiting partnerships and programs with
universities in Brazil, Norway, Russia, Scotland, Singapore and the
United States. In many of these partnerships, we even develop
curriculum and provide internship opportunities to students, offering
them a glimpse of the many facets of our industry.
Of particular note is Polytechnic University in St. Petersburg, Russia,
where FMC recently established a post-graduate Subsea Engineering
program. Russia possesses more gas reserves than any other country
in the world, and their government and its national gas company,
Gazprom, intend to develop fields located offshore in the Barents
Sea. By partnering with Polytechnic University, one of the most
respected technical schools in Russia, we are at the leading edge of
developing talent and having access to the best and brightest
engineers in Russia.
Going forward, we plan to expand that strategy to a broader
range of educational institutions as we believe the benefits and
opportunities are mutually beneficial to our industry and our current
and future employees.
Health, Safety and Environment (HSE)FMC understands that active participation in the areas of Health,
Safety and Environment means adapting a culture that is protective
of our people, our communities and the impact we have on the
environment.
FMC has a very commendable record of driving HSE focus in all we
do. We have made significant advances in workplace safety,
employee health and environmental protection. The statistics bear
this out, including record-setting performance in lost workday and
total recordable incident rates. In light of such excellence, it is also
imperative that we recognize the rapid pace at which our company is
growing, understanding that growth in itself presents a challenge.
We must then constantly educate and raise the accountability and
awareness of all our employees, by cultivating a sound HSE culture.
To enhance our HSE mindset, FMC has adopted four long-term
objectives:
• Maintain a consistent HSE focus
• Achieve an injury-free workplace
• Promote environmental stewardship
• Proactively manage high-risk activities
The start of a new year is always exciting, and I believe 2008 holds
great promise for FMC, its employees and its shareholders. I am
confident we will make great strides this year, facing each and every
challenge. By maintaining an HSE focus in all we do, we will meet
our objectives and finish this year as a safer and stronger company.
FMC Technologies, Inc. Annual Report 2007
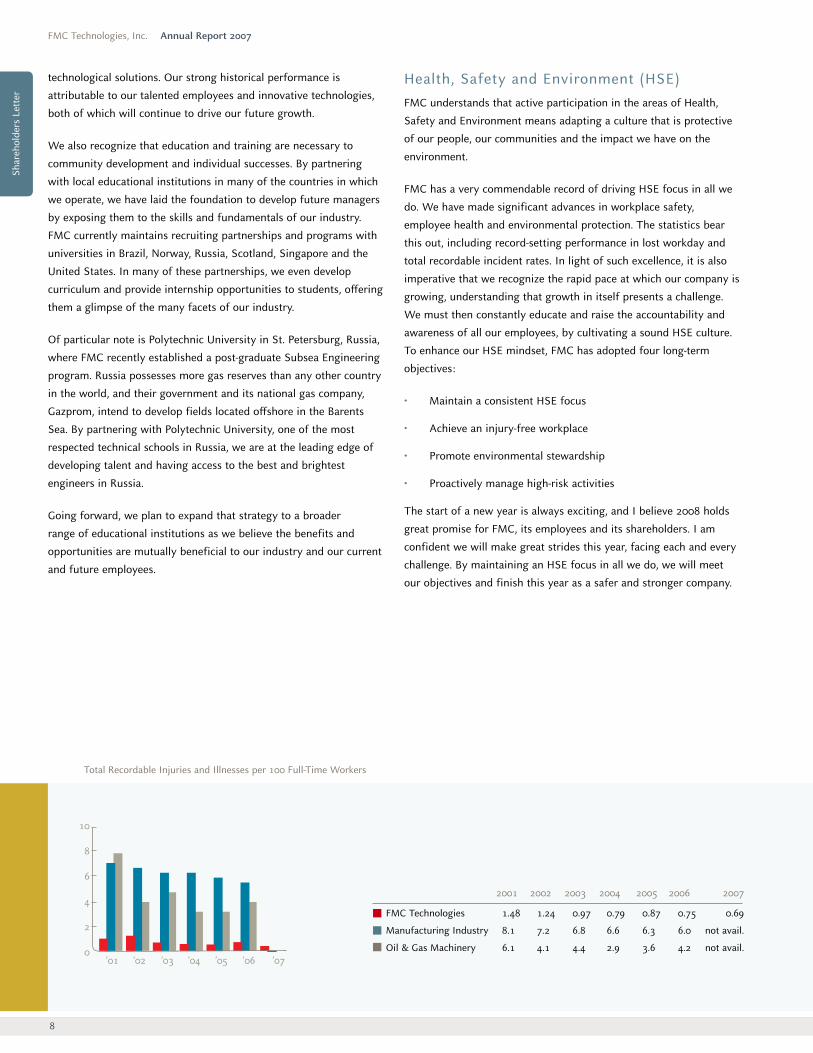
Total Recordable Injuries and Illnesses per 100 Full-Time Workers
’01 ’02 ’03 ’04 ’05 ’06 ’07
10
8
6
4
2
0
2001 2002 2003 2004 2005 2006 2007
FMC Technologies 1.48 1.24 0.97 0.79 0.87 0.75 0.69
Manufacturing Industry 8.1 7.2 6.8 6.6 6.3 6.0 not avail.
Oil & Gas Machinery 6.1 4.1 4.4 2.9 3.6 4.2 not avail.
Shar
ehol
ders
Let
ter
9
Peter D. KinnearPresident and CEOFMC Technologies, Inc.
FMC Technologies, Inc. Shareholders Letter
Positioned for the FutureDuring the course of fiscal 2007 we completed a seamless transition
in the company’s leadership by leveraging our breadth and depth of
management talent. That transition began at the start of 2007 with
the appointment of John Gremp to Executive Vice President of
Energy Systems. A 32-year FMC veteran with a wealth of experience
and industry knowledge, John now oversees our Energy Processing
and Energy Production divisions. Bob Potter, a 35-year FMC veteran,
was promoted to Senior Vice President of Energy Processing and
Global Surface Wellhead. Tore Halvorsen, a 28-year industry
veteran who has been with FMC since our purchase of Kongsberg
Offshore AS in 1993, was named Senior Vice President of Global
Subsea Production Systems.
As we embark on a new year, we also are saying farewell to
Mike Murray, Vice President of Human Resources and
Administration, who announced that he would retire from the
company in 2008 following a distinguished 35-year career.
From his first days as a Personnel Assistant up to his current role,
Mike has performed with the utmost dignity and professionalism
throughout his career. We wish him well in his retirement and thank
him for his many contributions over the years. Maryann Seaman
succeeds Mike as Vice President of Administration. Maryann brings a
wealth of knowledge and experience from her 21-year FMC career,
and she will continue to apply that knowledge while overseeing the
administration function, which includes Corporate Communications,
Human Resources, and Health, Safety and Environment.
Today, FMC Technologies is at the forefront of technical innovation
and we are recognized as the preeminent solutions provider for
many technical challenges throughout our industry. Our initiatives
and efforts have resulted in some significant achievements and many
future opportunities.
As we embark on a new year, I believe FMC Technologies remains at
a competitive advantage to continue to grow, add value to our
customers and provide a premium return to our shareholders.
We are a unique company, formed of the most talented professionals
in the industry. Our future successes are unlimited as long as we
continue serving our customers well and add value in all activities
that we perform.
HSE focus in all we do
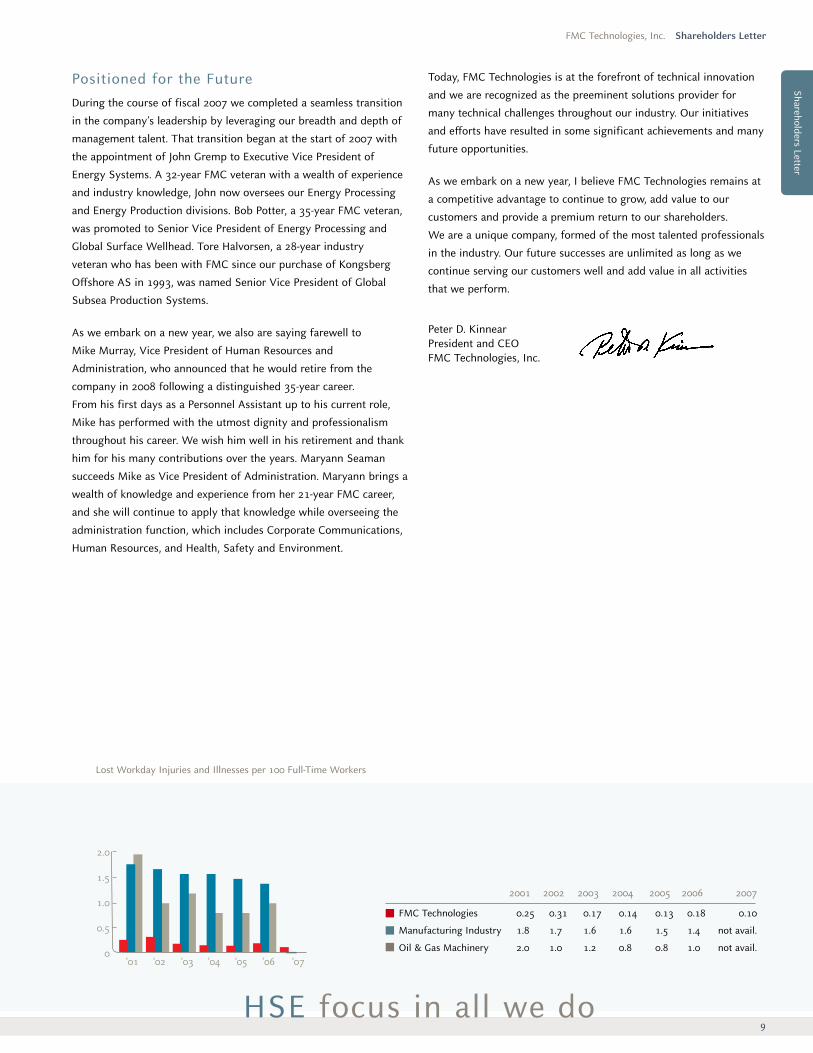
Lost Workday Injuries and Illnesses per 100 Full-Time Workers
’01 ’02 ’03 ’04 ’05 ’06 ’07
2.0
1.5
1.0
0.5
0
2001 2002 2003 2004 2005 2006 2007
FMC Technologies 0.25 0.31 0.17 0.14 0.13 0.18 0.10
Manufacturing Industry 1.8 1.7 1.6 1.6 1.5 1.4 not avail.
Oil & Gas Machinery 2.0 1.0 1.2 0.8 0.8 1.0 not avail.
Shareholders Letter
Subsea Trees
Guidelineless Trees
Subsea ManifoldsSubsea Trees
Subsea Templates
Subsea Systems
10
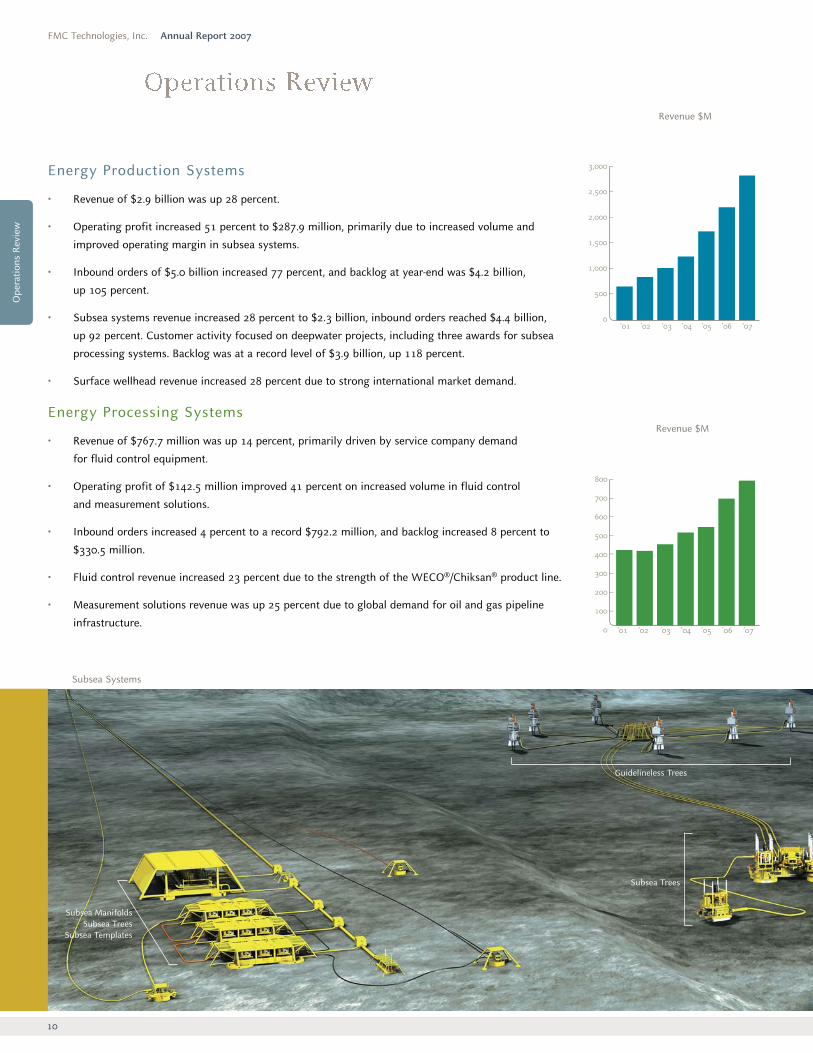
Revenue $M
Energy Production Systems
• Revenue of $2.9 billion was up 28 percent.
• Operating profit increased 51 percent to $287.9 million, primarily due to increased volume and
improved operating margin in subsea systems.
• Inbound orders of $5.0 billion increased 77 percent, and backlog at year-end was $4.2 billion,
up 105 percent.
• Subsea systems revenue increased 28 percent to $2.3 billion, inbound orders reached $4.4 billion,
up 92 percent. Customer activity focused on deepwater projects, including three awards for subsea
processing systems. Backlog was at a record level of $3.9 billion, up 118 percent.
• Surface wellhead revenue increased 28 percent due to strong international market demand.
Energy Processing Systems
• Revenue of $767.7 million was up 14 percent, primarily driven by service company demand
for fluid control equipment.
• Operating profit of $142.5 million improved 41 percent on increased volume in fluid control
and measurement solutions.
• Inbound orders increased 4 percent to a record $792.2 million, and backlog increased 8 percent to
$330.5 million.
• Fluid control revenue increased 23 percent due to the strength of the WECO®/Chiksan® product line.
• Measurement solutions revenue was up 25 percent due to global demand for oil and gas pipeline
infrastructure.
FMC Technologies, Inc. Annual Report 2007
’01 ’02 ’03 ’04 ’05 ’06 ’07
3,000
2,500
2,000
1,500
1,000
500
0
’01 ’02 ’03 ’04 ’05 ’06 ’07
800
700
600
500
400
300
200
100
0
Revenue $M
Ope
ratio
ns R
evie
w
Subsea Separation& Processing
RiserlessLight WellIntervention
Subsea Trees
FMC Technologies, Inc. Operations Review
11
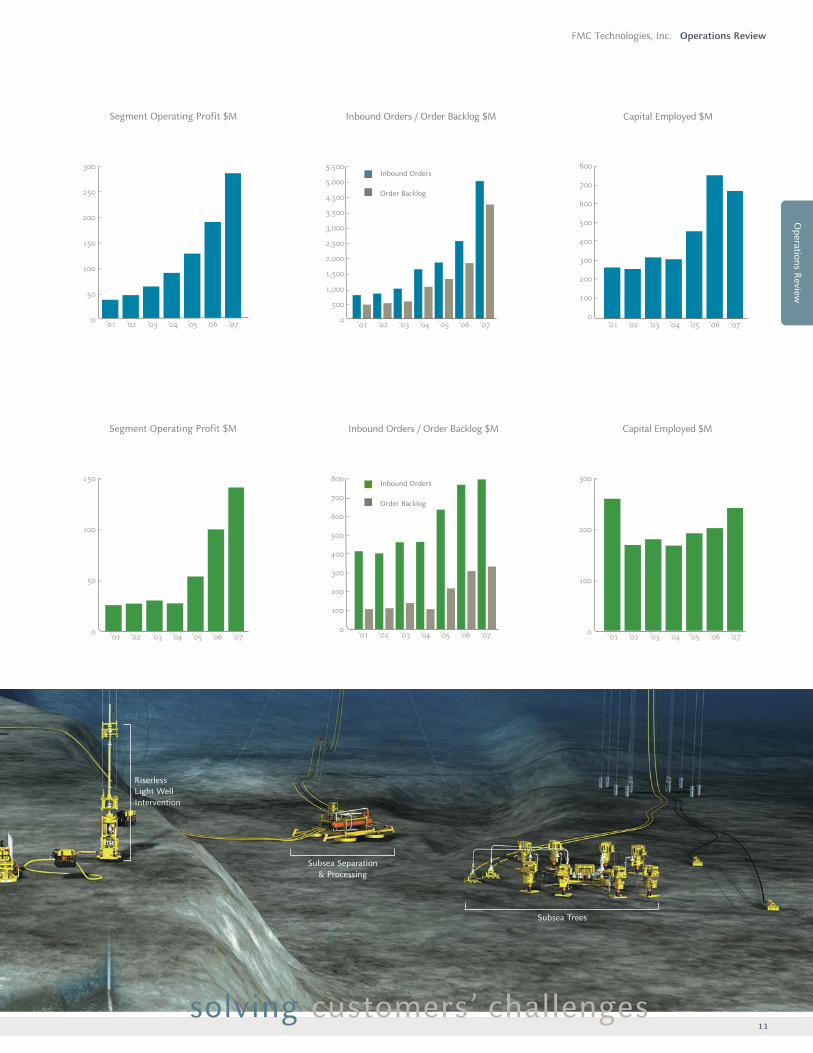
Segment Operating Profit $M Inbound Orders / Order Backlog $M Capital Employed $M
’01 ’02 ’03 ’04 ’05 ’06 ’07
300
250
200
150
100
50
0 ’01 ’02 ’03 ’04 ’05 ’06 ’07
5,500
5,000
4,500
3,500
3,000
2,500
2,000
1,500
1,000
500
0’01 ’02 ’03 ’04 ’05 ’06 ’07
800
700
600
500
400
300
200
100
0
’01 ’02 ’03 ’04 ’05 ’06 ’07
150
100
50
0 ’01 ’02 ’03 ’04 ’05 ’06 ’07
800
700
600
500
400
300
200
100
0’01 ’02 ’03 ’04 ’05 ’06 ’07
300
200
100
0
solving customers’ challenges
Segment Operating Profit $M Inbound Orders / Order Backlog $M Capital Employed $M
Inbound Orders
Order Backlog
Inbound Orders
Order Backlog
Operations Review
12
Our robust subsea business received orders for 232 subsea trees and
related technologies and services during the year. Among the major
subsea projects awarded to FMC Technologies in 2007:
• Norsk Hydro’s (now StatoilHydro) Ormen Lange extension, O2,
Vega and Vega South projects in the North Sea
• StatoilHydro’s Åsgard development in the North Sea
• Woodside Energy’s Vincent project offshore Australia
• Murphy Oil Corporation’s Azurite project offshore the Republic
of the Congo
• Chevron’s phase II of the Agbami project offshore Nigeria
• Petrobras’ Cascade and Chinook development in the
Gulf of Mexico and Plangas project offshore Brazil
• Pemex’s Cantarell project in the Gulf of Mexico
• Shell’s Perdido project in the Gulf of Mexico and
Gumusut-Kakap project offshore Malaysia
• Total’s Pazflor project offshore Angola
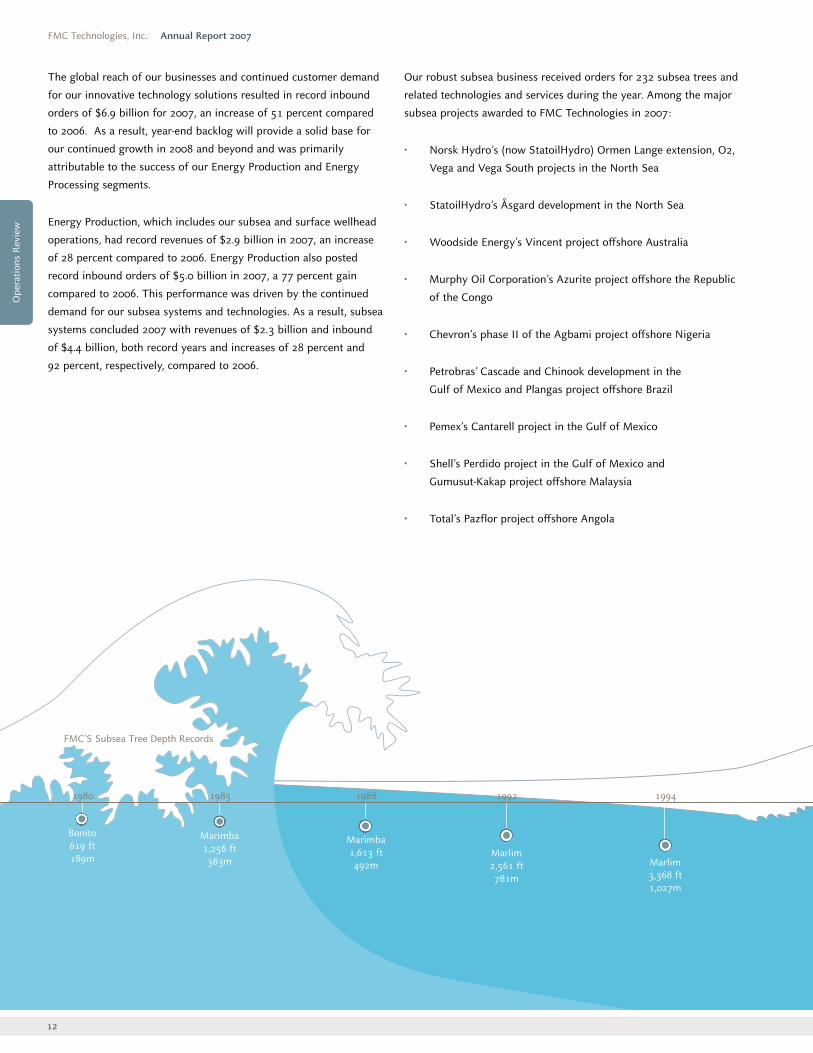
The global reach of our businesses and continued customer demand
for our innovative technology solutions resulted in record inbound
orders of $6.9 billion for 2007, an increase of 51 percent compared
to 2006. As a result, year-end backlog will provide a solid base for
our continued growth in 2008 and beyond and was primarily
attributable to the success of our Energy Production and Energy
Processing segments.
Energy Production, which includes our subsea and surface wellhead
operations, had record revenues of $2.9 billion in 2007, an increase
of 28 percent compared to 2006. Energy Production also posted
record inbound orders of $5.0 billion in 2007, a 77 percent gain
compared to 2006. This performance was driven by the continued
demand for our subsea systems and technologies. As a result, subsea
systems concluded 2007 with revenues of $2.3 billion and inbound
of $4.4 billion, both record years and increases of 28 percent and
92 percent, respectively, compared to 2006.
FMC’S Subsea Tree Depth Records
1985 1988 1992 1994
Bonito 619 ft189m
Marimba 1,256 ft383m
Marimba 1,613 ft492m Marlim
3,368 ft1,027m
1980
FMC Technologies, Inc. Annual Report 2007
Marlim 2,561 ft781m
Ope
ratio
ns R
evie
w
FMC Technologies, Inc. Operations Review
13
Sales within Energy Processing, which includes fluid control, loading
systems, measurement and material handling operations, continued
to benefit from increased exploration and drilling activities across the
globe. Sales for the year grew 14 percent to $767.7 million, while
operating profit increased 41 percent to $142.5 million for the year.
Energy Processing’s inbound orders grew to $792.2 million, while
backlog improved to $330.5 million, an 8 percent increase over 2006.
One of the most important events to occur in 2007 was the delivery
and start-up of our new separation technology. Tordis, the industry’s
first full-field commercial application for the subsea separation of oil,
water and sand, was delivered to StatoilHydro in the summer of
2007, and it was installed offshore in the fourth quarter.
While Tordis was being prepared for transport and installation last
fall, FMC also was awarded two additional subsea processing
contracts, Petrobras’ Cascade and Chinook development and
Total’s Pazflor project.
Valued at $200 million, the Cascade and Chinook award included
four horizontal subsea trees, three manifolds and control systems.
In addition, the project includes two subsea horizontal electric
submersible pumping (ESP) systems. The technology benefits the
project by providing the necessary pump pressure to allow
production to be boosted to the floating production, storage and
offloading (FPSO) vessel from its location on the ocean floor
8,500 feet (2,600 meters) below the surface.
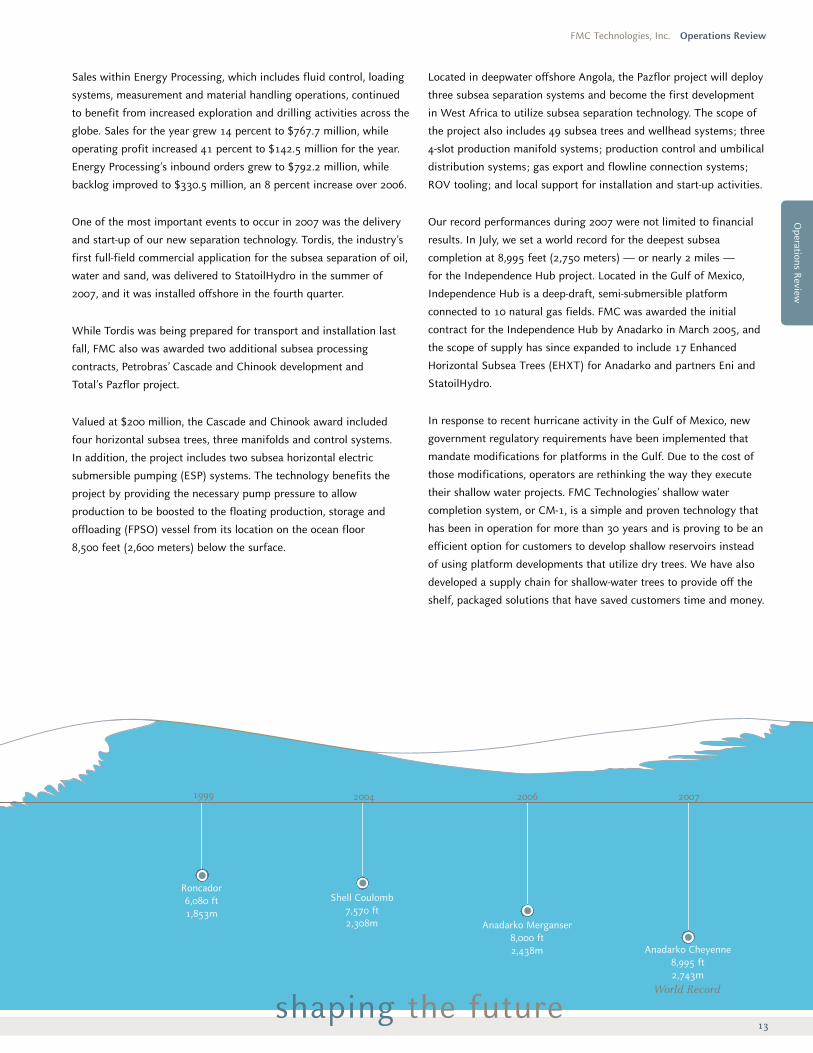
2004 2006
Shell Coulomb7,570 ft2,308m Anadarko Merganser
8,000 ft2,438m Anadarko Cheyenne
8,995 ft2,743m
World Record
20071999
Roncador6,080 ft1,853m
shaping the future
Located in deepwater offshore Angola, the Pazflor project will deploy
three subsea separation systems and become the first development
in West Africa to utilize subsea separation technology. The scope of
the project also includes 49 subsea trees and wellhead systems; three
4-slot production manifold systems; production control and umbilical
distribution systems; gas export and flowline connection systems;
ROV tooling; and local support for installation and start-up activities.
Our record performances during 2007 were not limited to financial
results. In July, we set a world record for the deepest subsea
completion at 8,995 feet (2,750 meters) — or nearly 2 miles —
for the Independence Hub project. Located in the Gulf of Mexico,
Independence Hub is a deep-draft, semi-submersible platform
connected to 10 natural gas fields. FMC was awarded the initial
contract for the Independence Hub by Anadarko in March 2005, and
the scope of supply has since expanded to include 17 Enhanced
Horizontal Subsea Trees (EHXT) for Anadarko and partners Eni and
StatoilHydro.
In response to recent hurricane activity in the Gulf of Mexico, new
government regulatory requirements have been implemented that
mandate modifications for platforms in the Gulf. Due to the cost of
those modifications, operators are rethinking the way they execute
their shallow water projects. FMC Technologies’ shallow water
completion system, or CM-1, is a simple and proven technology that
has been in operation for more than 30 years and is proving to be an
efficient option for customers to develop shallow reservoirs instead
of using platform developments that utilize dry trees. We have also
developed a supply chain for shallow-water trees to provide off the
shelf, packaged solutions that have saved customers time and money.
Operations Review
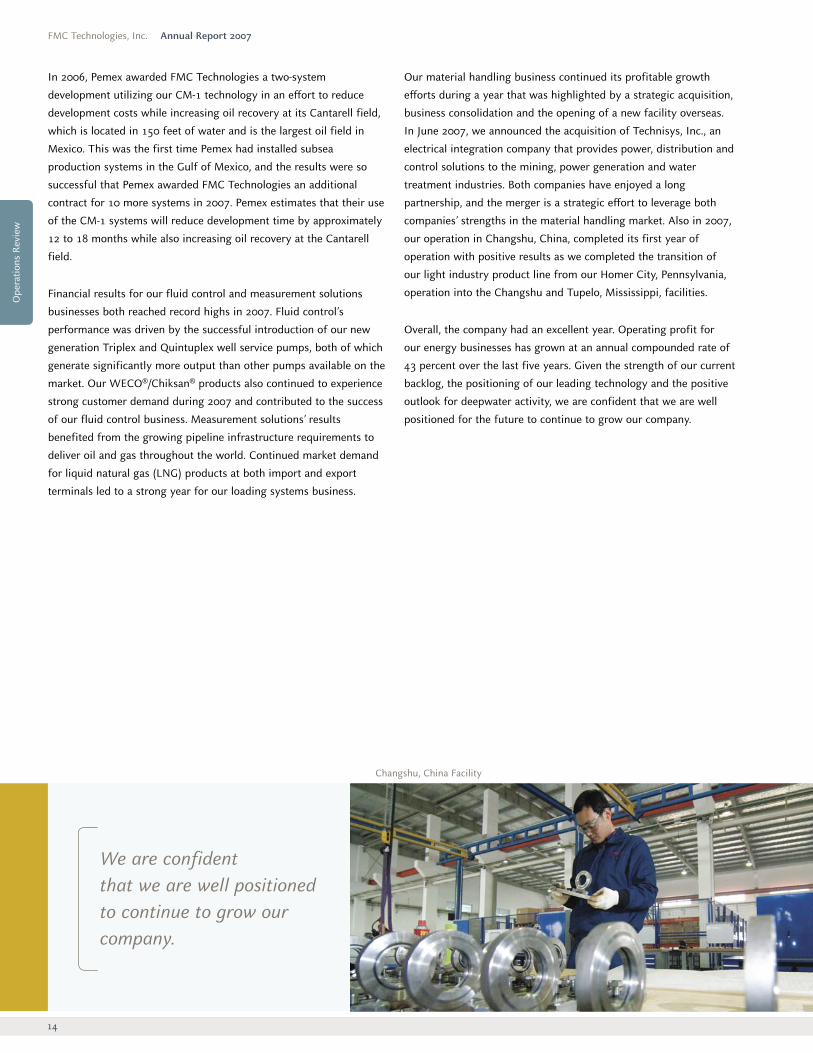
Changshu, China Facility
14
FMC Technologies, Inc. Annual Report 2007
In 2006, Pemex awarded FMC Technologies a two-system
development utilizing our CM-1 technology in an effort to reduce
development costs while increasing oil recovery at its Cantarell field,
which is located in 150 feet of water and is the largest oil field in
Mexico. This was the first time Pemex had installed subsea
production systems in the Gulf of Mexico, and the results were so
successful that Pemex awarded FMC Technologies an additional
contract for 10 more systems in 2007. Pemex estimates that their use
of the CM-1 systems will reduce development time by approximately
12 to 18 months while also increasing oil recovery at the Cantarell
field.
Financial results for our fluid control and measurement solutions
businesses both reached record highs in 2007. Fluid control’s
performance was driven by the successful introduction of our new
generation Triplex and Quintuplex well service pumps, both of which
generate significantly more output than other pumps available on the
market. Our WECO®/Chiksan® products also continued to experience
strong customer demand during 2007 and contributed to the success
of our fluid control business. Measurement solutions’ results
benefited from the growing pipeline infrastructure requirements to
deliver oil and gas throughout the world. Continued market demand
for liquid natural gas (LNG) products at both import and export
terminals led to a strong year for our loading systems business.
Our material handling business continued its profitable growth
efforts during a year that was highlighted by a strategic acquisition,
business consolidation and the opening of a new facility overseas.
In June 2007, we announced the acquisition of Technisys, Inc., an
electrical integration company that provides power, distribution and
control solutions to the mining, power generation and water
treatment industries. Both companies have enjoyed a long
partnership, and the merger is a strategic effort to leverage both
companies’ strengths in the material handling market. Also in 2007,
our operation in Changshu, China, completed its first year of
operation with positive results as we completed the transition of
our light industry product line from our Homer City, Pennsylvania,
operation into the Changshu and Tupelo, Mississippi, facilities.
Overall, the company had an excellent year. Operating profit for
our energy businesses has grown at an annual compounded rate of
43 percent over the last five years. Given the strength of our current
backlog, the positioning of our leading technology and the positive
outlook for deepwater activity, we are confident that we are well
positioned for the future to continue to grow our company.
We are confident that we are well positionedto continue to grow ourcompany.
Ope
ratio
ns R
evie
w
FMC Technologies, Inc. Operations Review
supporting customers worldwide15
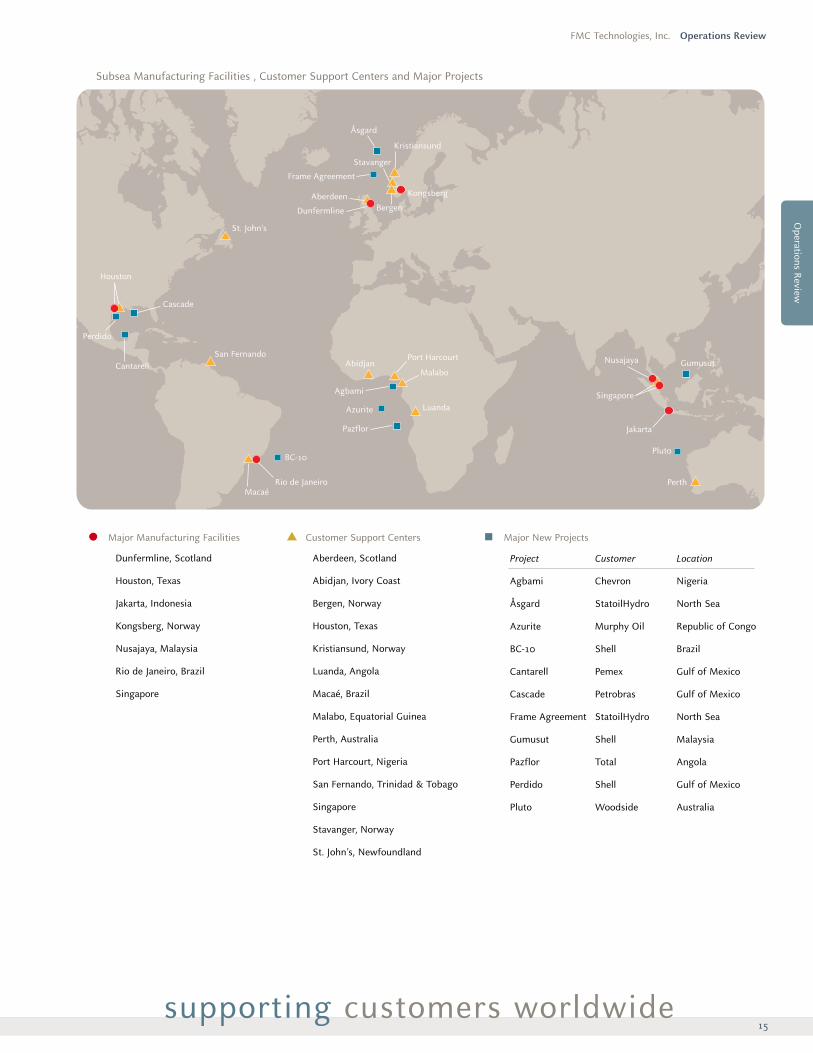
Dunfermline, Scotland
Houston, Texas
Jakarta, Indonesia
Kongsberg, Norway
Nusajaya, Malaysia
Rio de Janeiro, Brazil
Singapore
Major Manufacturing Facilities Customer Support Centers Major New Projects
Aberdeen, Scotland
Abidjan, Ivory Coast
Bergen, Norway
Houston, Texas
Kristiansund, Norway
Luanda, Angola
Macaé, Brazil
Malabo, Equatorial Guinea
Perth, Australia
Port Harcourt, Nigeria
San Fernando, Trinidad & Tobago
Singapore
Stavanger, Norway
St. John’s, Newfoundland
Project Customer Location
Agbami Chevron Nigeria
Åsgard StatoilHydro North Sea
Azurite Murphy Oil Republic of Congo
BC-10 Shell Brazil
Cantarell Pemex Gulf of Mexico
Cascade Petrobras Gulf of Mexico
Frame Agreement StatoilHydro North Sea
Gumusut Shell Malaysia
Pazflor Total Angola
Perdido Shell Gulf of Mexico
Pluto Woodside Australia
Agbami
Pazflor
BC-10
Cascade
Perdido
Pluto
Rio de JaneiroMacaé
San Fernando
Houston
St. John’s
Aberdeen
Dunfermline
Kristiansund
Stavanger
Bergen
Kongsberg
Luanda
AbidjanPort Harcourt
Malabo
Singapore
Nusajaya
Jakarta
Perth
Cantarell
Frame Agreement
Gumusut
Åsgard
Azurite
Operations Review
Subsea Manufacturing Facilities , Customer Support Centers and Major Projects
16
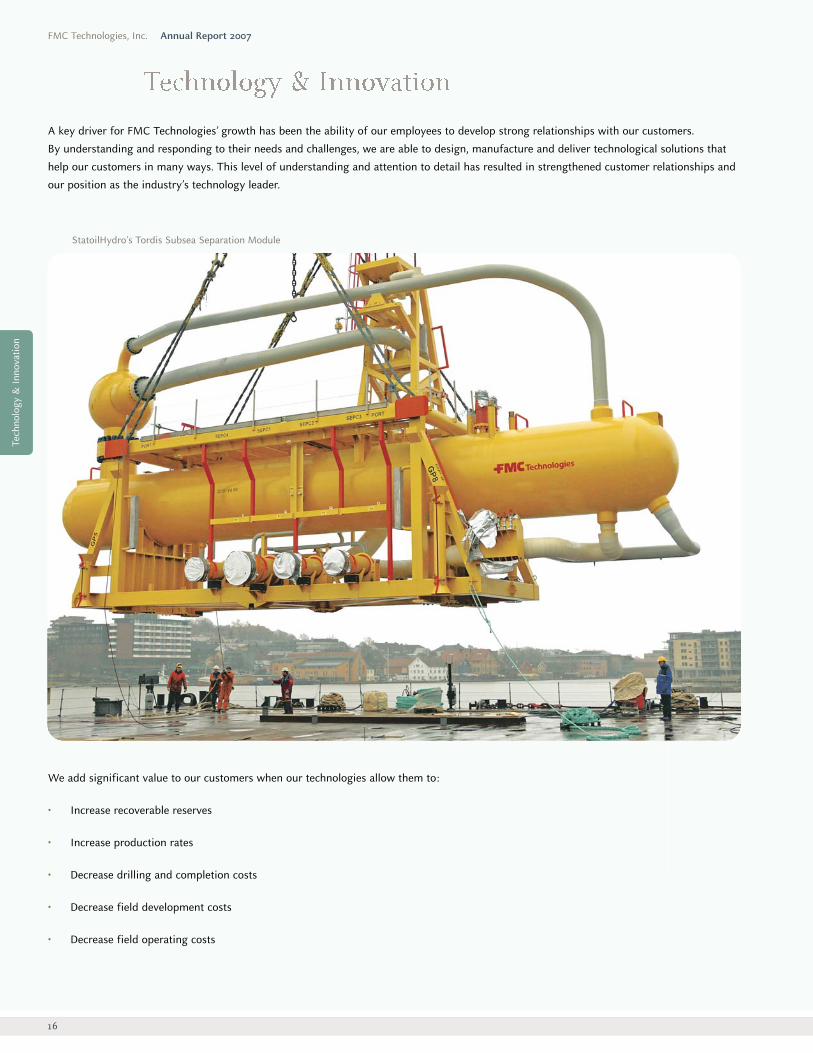
A key driver for FMC Technologies’ growth has been the ability of our employees to develop strong relationships with our customers.
By understanding and responding to their needs and challenges, we are able to design, manufacture and deliver technological solutions that
help our customers in many ways. This level of understanding and attention to detail has resulted in strengthened customer relationships and
our position as the industry’s technology leader.
FMC Technologies, Inc. Annual Report 2007
We add significant value to our customers when our technologies allow them to:
• Increase recoverable reserves
• Increase production rates
• Decrease drilling and completion costs
• Decrease field development costs
• Decrease field operating costs
StatoilHydro’s Tordis Subsea Separation Module
Tech
nolo
gy &
Inno
vatio
n
FMC Technologies, Inc. Shareholders Letter
17
FMC Technologies, Inc. Technology & Innovation
Our technology was first used with StatoilHydro’s Tordis project in
the North Sea, which began operation in January 2008. In this
application, the topside processing facilities could no longer handle
the increasing levels of water being produced from the subsea wells.
By developing a system to separate the oil, gas, water and sand on
the seabed, the excess water is now reinjected into the formation
instead of flowing to the surface. This reinjection allows
hydrocarbons to displace the water that once filled most of the
flowline and increases the hydrocarbon production rate. It also
overcomes back-pressure in the flowline through the use of a
multi-phase booster pump which increases the production rate and
the total recovery of hydrocarbons, extending the productivity and
life of the field.
Our subsea processing systems are also being used in new
developments for Shell, Petrobras and Total. Each of the
developments has different characteristics where separation and/or
boosting is essential for efficient production.
FMC has established multi-year, subsea system alliances with a
number of strategic customers. The first alliance began in the 1990s
with StatoilHydro. Two years later, we entered into technology
development agreements with StatoilHydro, Shell, Total and
ExxonMobil to develop advanced standards for subsea field
development. FMC Technologies committed to, and succeeded in
developing, innovative and cost-effective technical solutions that
served as the foundation for today’s subsea efforts in our industry.
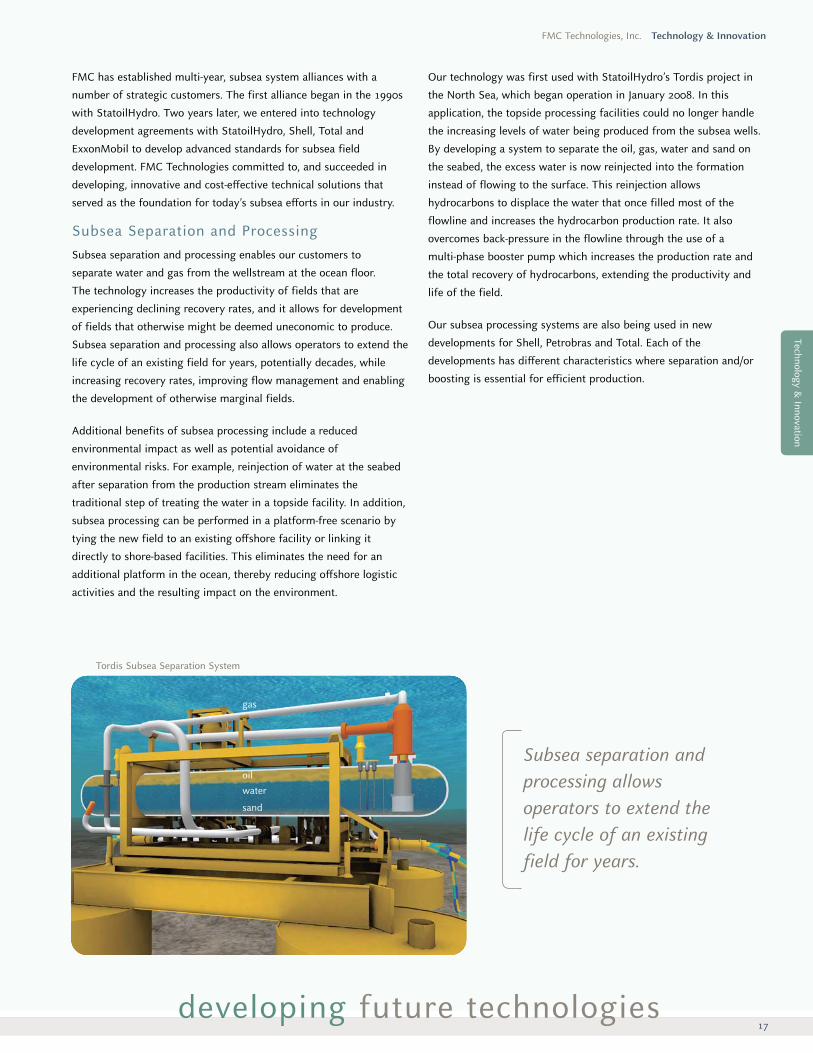
Subsea Separation and ProcessingSubsea separation and processing enables our customers to
separate water and gas from the wellstream at the ocean floor.
The technology increases the productivity of fields that are
experiencing declining recovery rates, and it allows for development
of fields that otherwise might be deemed uneconomic to produce.
Subsea separation and processing also allows operators to extend the
life cycle of an existing field for years, potentially decades, while
increasing recovery rates, improving flow management and enabling
the development of otherwise marginal fields.
Additional benefits of subsea processing include a reduced
environmental impact as well as potential avoidance of
environmental risks. For example, reinjection of water at the seabed
after separation from the production stream eliminates the
traditional step of treating the water in a topside facility. In addition,
subsea processing can be performed in a platform-free scenario by
tying the new field to an existing offshore facility or linking it
directly to shore-based facilities. This eliminates the need for an
additional platform in the ocean, thereby reducing offshore logistic
activities and the resulting impact on the environment.
Tordis Subsea Separation System
oilwater
sand
Subsea separation andprocessing allowsoperators to extend thelife cycle of an existingfield for years.
developing future technologies
gas
Technology & Innovation
Total’s Pazflor Project
18
Major projects in Brazil and in the Gulf of Mexico are both
characterized by ultra-deepwater and low reservoir pressure, which
require artificial lift with Electrical Submersible Pumps (ESPs) in
order to flow the hydrocarbons to the surface. To allow for
commercial development of both fields, subsea separation systems
are needed to separate the natural gas from the oil and water at the
seabed so that the oil and water can be pumped to the surface by the
ESPs, and to mitigate the risk of cavitation in the pumps.
Petrobras’ Cascade and Chinook fields in the Gulf of Mexico are
characterized by heavy oil and low reservoir pressure. The subsea
processing solution for this project will include ESPs mounted
horizontally at the seabed to boost production from the subsea wells.
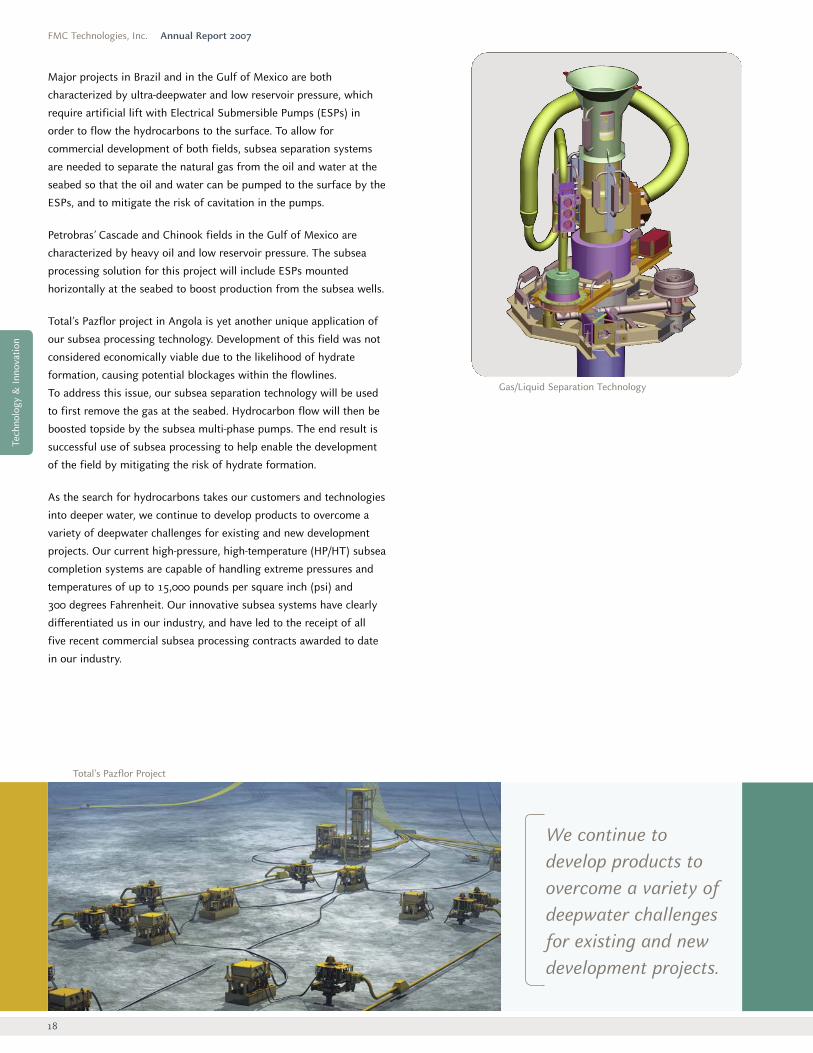
Total’s Pazflor project in Angola is yet another unique application of
our subsea processing technology. Development of this field was not
considered economically viable due to the likelihood of hydrate
formation, causing potential blockages within the flowlines.
To address this issue, our subsea separation technology will be used
to first remove the gas at the seabed. Hydrocarbon flow will then be
boosted topside by the subsea multi-phase pumps. The end result is
successful use of subsea processing to help enable the development
of the field by mitigating the risk of hydrate formation.
As the search for hydrocarbons takes our customers and technologies
into deeper water, we continue to develop products to overcome a
variety of deepwater challenges for existing and new development
projects. Our current high-pressure, high-temperature (HP/HT) subsea
completion systems are capable of handling extreme pressures and
temperatures of up to 15,000 pounds per square inch (psi) and
300 degrees Fahrenheit. Our innovative subsea systems have clearly
differentiated us in our industry, and have led to the receipt of all
five recent commercial subsea processing contracts awarded to date
in our industry.
FMC Technologies, Inc. Annual Report 2007
Gas/Liquid Separation Technology
We continue todevelop products toovercome a variety ofdeepwater challengesfor existing and newdevelopment projects.
Tech
nolo
gy &
Inno
vatio
n
19
Riserless Light Well InterventionsThe evolution of deepwater developments and subsea operations has
allowed energy companies to expand their exploration efforts to
satisfy worldwide demand for hydrocarbons. The environmental
conditions that characterize subsea exploration and development,
including harsh climates and extreme water depths, pose challenges
for operators as they search for economical solutions to complete,
produce, maintain and monitor subsea wells and trees. As the
number of subsea developments continues to increase and are placed
at depths of up to two miles, customers need cost-effective solutions
that allow them to properly maintain their subsea wells to ensure
optimum production levels.
Typically, subsea wells require “in the wellbore” intervention efforts
every five to seven years and often require the availability of a
deepwater rig to complete the work. Due to the limited availability of
offshore drilling rigs, intervention service for subsea wells occurs on
an infrequent basis. As a result, subsea wells can experience reduced
efficiency and productivity, resulting in lower production rates and
reduced reserve recoveries. As reservoir conditions in subsea wells
become more challenging, well maintenance will play a key role in
the viability of subsea completions.
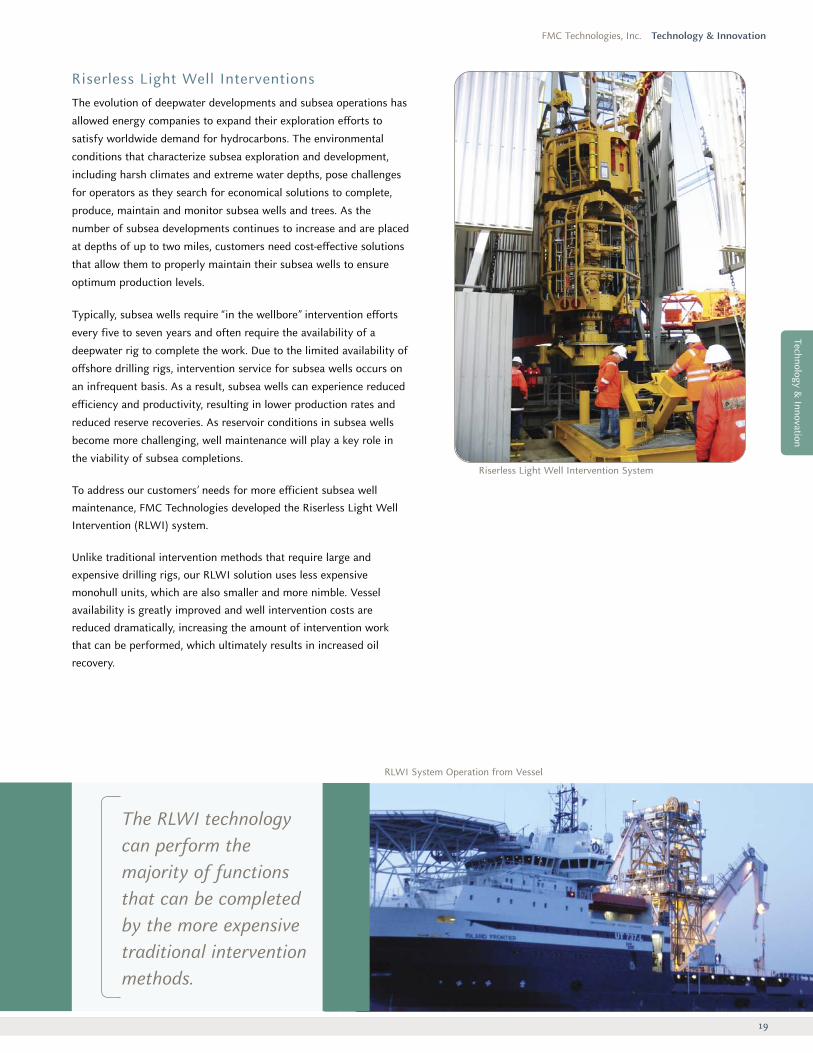
To address our customers’ needs for more efficient subsea wellmaintenance, FMC Technologies developed the Riserless Light WellIntervention (RLWI) system.
Unlike traditional intervention methods that require large andexpensive drilling rigs, our RLWI solution uses less expensivemonohull units, which are also smaller and more nimble. Vesselavailability is greatly improved and well intervention costs arereduced dramatically, increasing the amount of intervention workthat can be performed, which ultimately results in increased oilrecovery.
FMC Technologies, Inc. Technology & Innovation
RLWI System Operation from Vessel
The RLWI technology can perform the majority of functions that can be completed by the more expensivetraditional interventionmethods.
Riserless Light Well Intervention System
Technology & Innovation
20
In 2006, our first intervention system was deployed in the North Sea
for StatoilHydro and will be followed by two additional systems
during 2008. The RLWI system is operated from a dynamically
positioned monohull vessel using a subsea lubricator system directly
attached to the subsea well, rather than employing the traditional
means of a heavy and expensive workover riser with an offshore
drilling rig. The RLWI technology can perform the majority of tasks
that can be completed by the more expensive rig intervention
methods. This includes activities such as logging, plugging,
reperforating and gauge replacement as well as numerous other
operations.
Developing a solution for economic subsea well maintenance is the
principle driving force behind development of this technology.
When compared to conventional methods, RLWI technology can be
performed for approximately one-third of the cost. In addition, RLWI
is expected to increase oil recovery rates in many subsea
developments by ensuring that wells are maintained and operating at
peak efficiency. This combination of increased efficiency and lower
intervention costs allows our customers to produce more
economically from their subsea wells.
Subsea Controls TechnologyFMC Technologies has been an industry pioneer in the development
of electro-hydraulic control systems for more than 20 years. Today,
that focus on development has resulted in many economic,
operational and environmental benefits for our customers.
Our latest generation, the open architecture high capacity subsea
control and communication system, was launched during 2007 and is
being adopted by major operators across the globe. This system
features high speed communication of one gigabyte per second
(Gbps) and has broadband capability. This is more than 400,000
times faster than previous technology and can easily handle all well
data transmission requirements. The capacity and flexibility of the
new system accommodates emerging subsea control challenges such
as subsea separation and gas compression. In addition, the system
transmits downhole data at a volume and speed required by the
operator. The system contains standardized interfaces that offer
maximum flexibility for our customers to communicate with other
installed protocols. The technology is reverse-compatible with all
existing technology and eliminates obsolescence at the component
level, a challenge of increasing importance as fields experience
extended production life and aging subsea equipment.
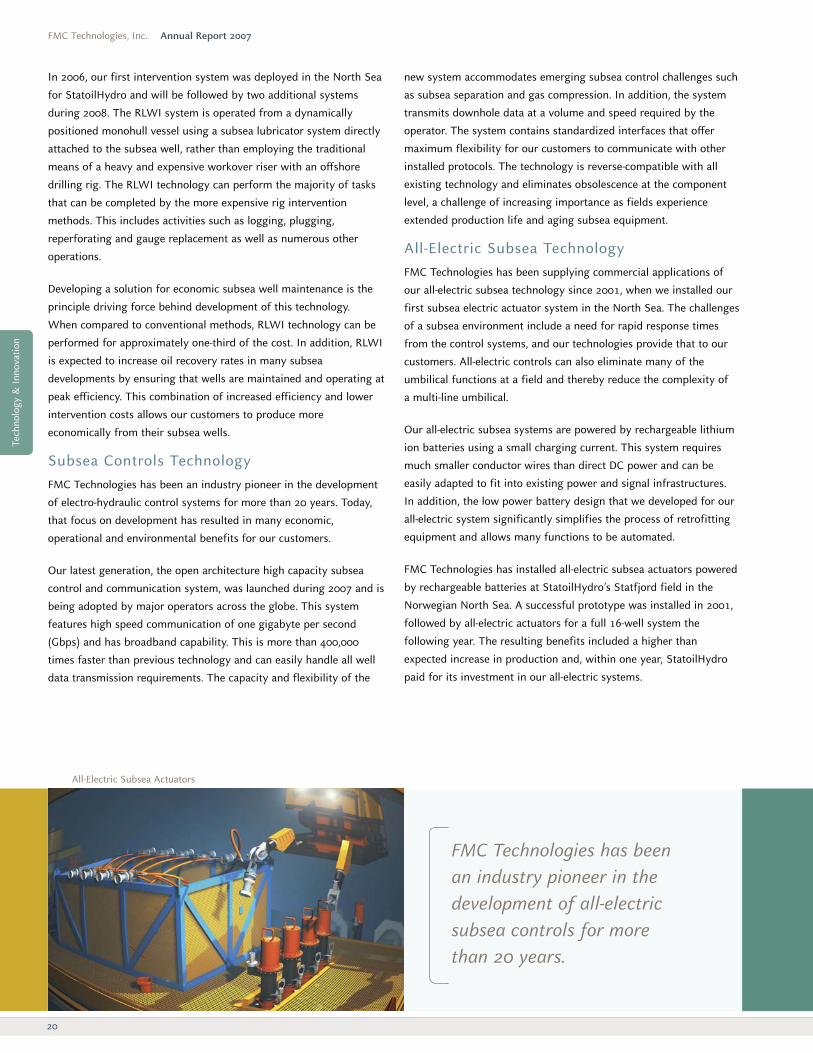
All-Electric Subsea TechnologyFMC Technologies has been supplying commercial applications of
our all-electric subsea technology since 2001, when we installed our
first subsea electric actuator system in the North Sea. The challenges
of a subsea environment include a need for rapid response times
from the control systems, and our technologies provide that to our
customers. All-electric controls can also eliminate many of the
umbilical functions at a field and thereby reduce the complexity of
a multi-line umbilical.
Our all-electric subsea systems are powered by rechargeable lithium
ion batteries using a small charging current. This system requires
much smaller conductor wires than direct DC power and can be
easily adapted to fit into existing power and signal infrastructures.
In addition, the low power battery design that we developed for our
all-electric system significantly simplifies the process of retrofitting
equipment and allows many functions to be automated.
FMC Technologies has installed all-electric subsea actuators powered
by rechargeable batteries at StatoilHydro’s Statfjord field in the
Norwegian North Sea. A successful prototype was installed in 2001,
followed by all-electric actuators for a full 16-well system the
following year. The resulting benefits included a higher than
expected increase in production and, within one year, StatoilHydro
paid for its investment in our all-electric systems.
FMC Technologies, Inc. Annual Report 2007
FMC Technologies has been an industry pioneer in thedevelopment of all-electricsubsea controls for morethan 20 years.
All-Electric Subsea Actuators
Tech
nolo
gy &
Inno
vatio
n
FMC Technologies, Inc. Technology & Innovation
21
The success was repeated in 2006 at StatoilHydro’s Norne field with
the installation of an all-electric system containing 21 all-electric
subsea manifold and choke valves. The strength and performance of
our technology continued its momentum in 2007 as new orders were
received for all-electric systems in Brazil and Australia and additional
systems in Norway. To date, over 100 subsea electric actuators have
been installed or ordered.
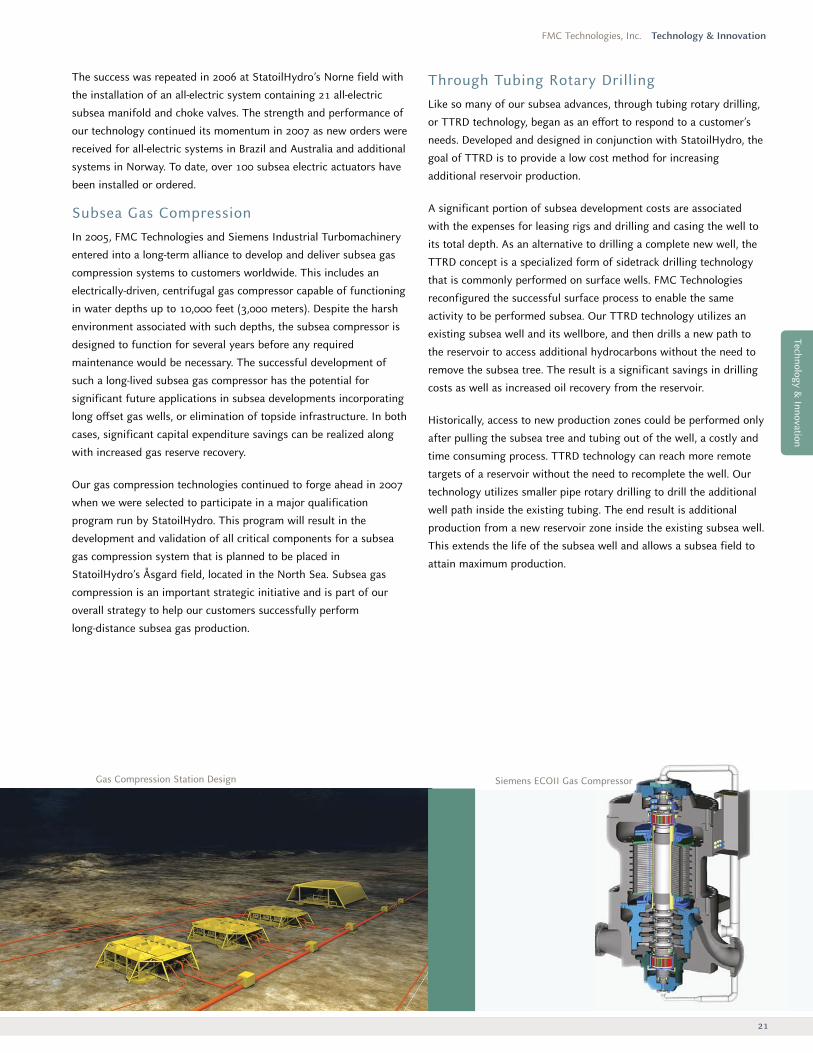
Subsea Gas CompressionIn 2005, FMC Technologies and Siemens Industrial Turbomachinery
entered into a long-term alliance to develop and deliver subsea gas
compression systems to customers worldwide. This includes an
electrically-driven, centrifugal gas compressor capable of functioning
in water depths up to 10,000 feet (3,000 meters). Despite the harsh
environment associated with such depths, the subsea compressor is
designed to function for several years before any required
maintenance would be necessary. The successful development of
such a long-lived subsea gas compressor has the potential for
significant future applications in subsea developments incorporating
long offset gas wells, or elimination of topside infrastructure. In both
cases, significant capital expenditure savings can be realized along
with increased gas reserve recovery.
Our gas compression technologies continued to forge ahead in 2007
when we were selected to participate in a major qualification
program run by StatoilHydro. This program will result in the
development and validation of all critical components for a subsea
gas compression system that is planned to be placed in
StatoilHydro’s Åsgard field, located in the North Sea. Subsea gas
compression is an important strategic initiative and is part of our
overall strategy to help our customers successfully perform
long-distance subsea gas production.
Gas Compression Station Design Siemens ECOII Gas Compressor
Through Tubing Rotary DrillingLike so many of our subsea advances, through tubing rotary drilling,
or TTRD technology, began as an effort to respond to a customer’s
needs. Developed and designed in conjunction with StatoilHydro, the
goal of TTRD is to provide a low cost method for increasing
additional reservoir production.
A significant portion of subsea development costs are associated
with the expenses for leasing rigs and drilling and casing the well to
its total depth. As an alternative to drilling a complete new well, the
TTRD concept is a specialized form of sidetrack drilling technology
that is commonly performed on surface wells. FMC Technologies
reconfigured the successful surface process to enable the same
activity to be performed subsea. Our TTRD technology utilizes an
existing subsea well and its wellbore, and then drills a new path to
the reservoir to access additional hydrocarbons without the need to
remove the subsea tree. The result is a significant savings in drilling
costs as well as increased oil recovery from the reservoir.
Historically, access to new production zones could be performed only
after pulling the subsea tree and tubing out of the well, a costly and
time consuming process. TTRD technology can reach more remote
targets of a reservoir without the need to recomplete the well. Our
technology utilizes smaller pipe rotary drilling to drill the additional
well path inside the existing tubing. The end result is additional
production from a new reservoir zone inside the existing subsea well.
This extends the life of the subsea well and allows a subsea field to
attain maximum production.
Technology & Innovation
22
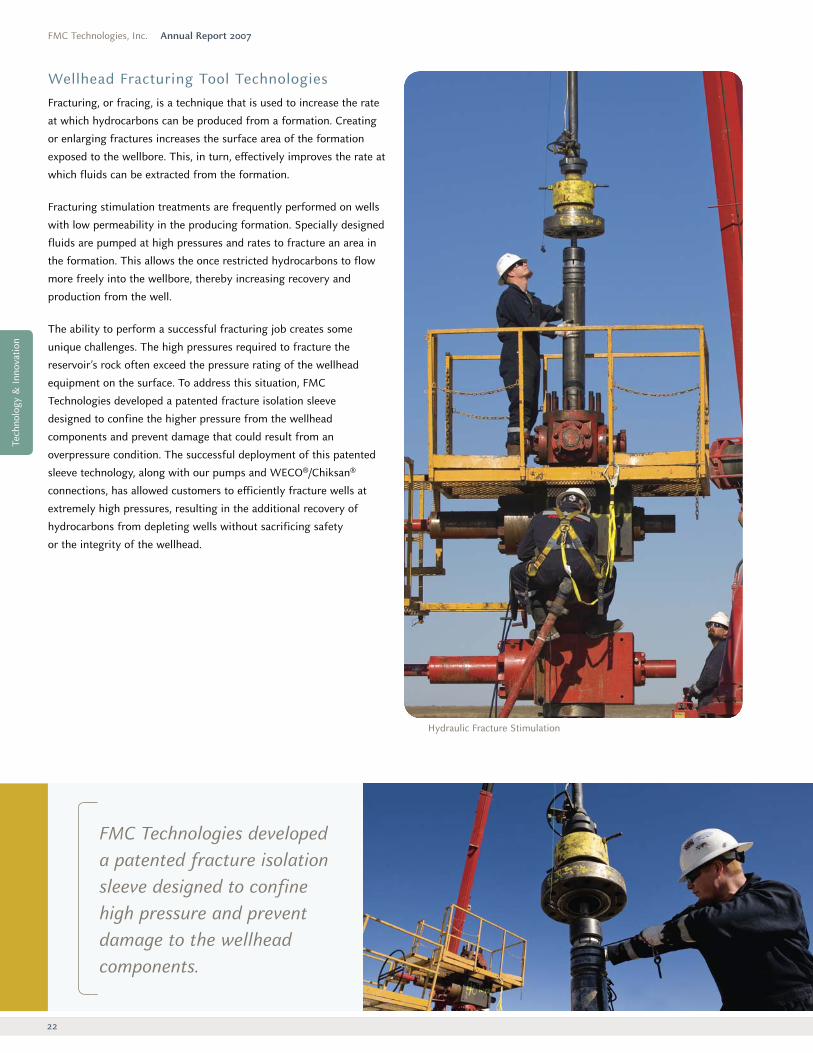
Wellhead Fracturing Tool TechnologiesFracturing, or fracing, is a technique that is used to increase the rate
at which hydrocarbons can be produced from a formation. Creating
or enlarging fractures increases the surface area of the formation
exposed to the wellbore. This, in turn, effectively improves the rate at
which fluids can be extracted from the formation.
Fracturing stimulation treatments are frequently performed on wells
with low permeability in the producing formation. Specially designed
fluids are pumped at high pressures and rates to fracture an area in
the formation. This allows the once restricted hydrocarbons to flow
more freely into the wellbore, thereby increasing recovery and
production from the well.
The ability to perform a successful fracturing job creates some
unique challenges. The high pressures required to fracture the
reservoir’s rock often exceed the pressure rating of the wellhead
equipment on the surface. To address this situation, FMC
Technologies developed a patented fracture isolation sleeve
designed to confine the higher pressure from the wellhead
components and prevent damage that could result from an
overpressure condition. The successful deployment of this patented
sleeve technology, along with our pumps and WECO®/Chiksan®
connections, has allowed customers to efficiently fracture wells at
extremely high pressures, resulting in the additional recovery of
hydrocarbons from depleting wells without sacrificing safety
or the integrity of the wellhead.
FMC Technologies, Inc. Annual Report 2007
FMC Technologies developeda patented fracture isolationsleeve designed to confinehigh pressure and preventdamage to the wellheadcomponents.
Hydraulic Fracture Stimulation
Tech
nolo
gy &
Inno
vatio
n
23
FMC Technologies, Inc. Technology & Innovation
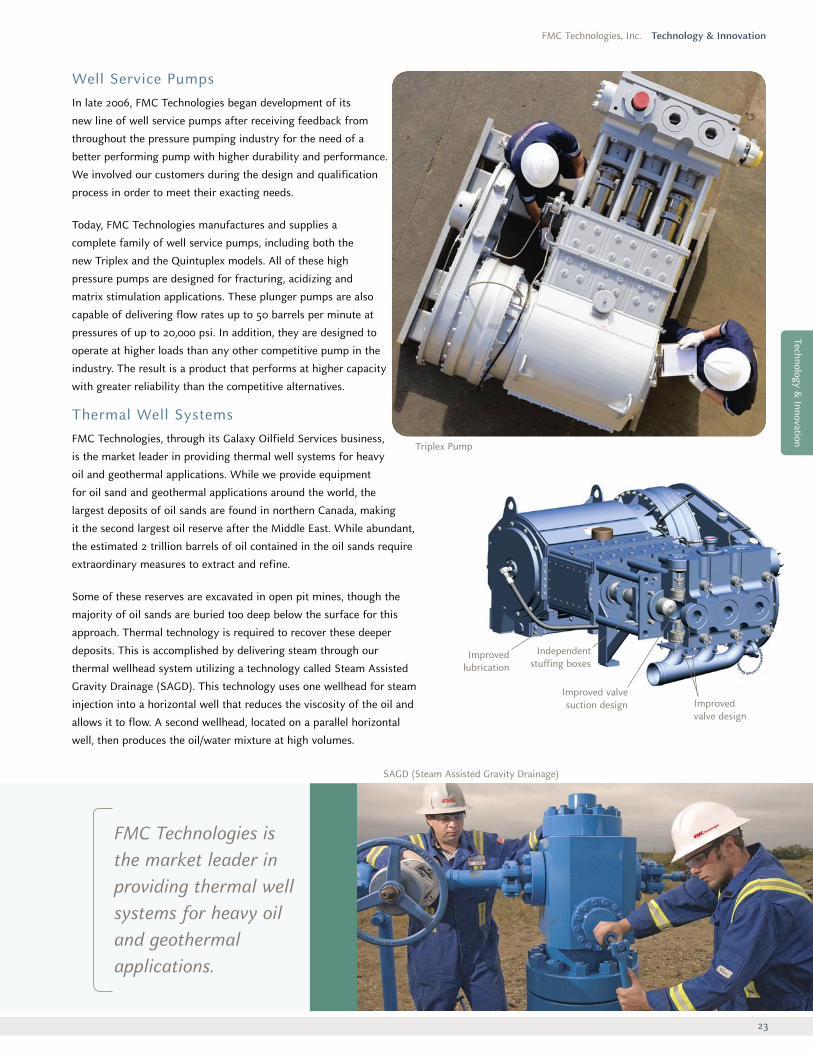
Improved lubrication
Improved valvesuction design
Independentstuffing boxes
Improvedvalve design
Well Service PumpsIn late 2006, FMC Technologies began development of its
new line of well service pumps after receiving feedback from
throughout the pressure pumping industry for the need of a
better performing pump with higher durability and performance.
We involved our customers during the design and qualification
process in order to meet their exacting needs.
Today, FMC Technologies manufactures and supplies a
complete family of well service pumps, including both the
new Triplex and the Quintuplex models. All of these high
pressure pumps are designed for fracturing, acidizing and
matrix stimulation applications. These plunger pumps are also
capable of delivering flow rates up to 50 barrels per minute at
pressures of up to 20,000 psi. In addition, they are designed to
operate at higher loads than any other competitive pump in the
industry. The result is a product that performs at higher capacity
with greater reliability than the competitive alternatives.
Thermal Well SystemsFMC Technologies, through its Galaxy Oilfield Services business,
is the market leader in providing thermal well systems for heavy
oil and geothermal applications. While we provide equipment
for oil sand and geothermal applications around the world, the
largest deposits of oil sands are found in northern Canada, making
it the second largest oil reserve after the Middle East. While abundant,
the estimated 2 trillion barrels of oil contained in the oil sands require
extraordinary measures to extract and refine.
Some of these reserves are excavated in open pit mines, though the
majority of oil sands are buried too deep below the surface for this
approach. Thermal technology is required to recover these deeper
deposits. This is accomplished by delivering steam through our
thermal wellhead system utilizing a technology called Steam Assisted
Gravity Drainage (SAGD). This technology uses one wellhead for steam
injection into a horizontal well that reduces the viscosity of the oil and
allows it to flow. A second wellhead, located on a parallel horizontal
well, then produces the oil/water mixture at high volumes.
Triplex Pump
SAGD (Steam Assisted Gravity Drainage)
FMC Technologies isthe market leader inproviding thermal wellsystems for heavy oiland geothermalapplications.
Technology & Innovation
24
Corporate Cit izenship
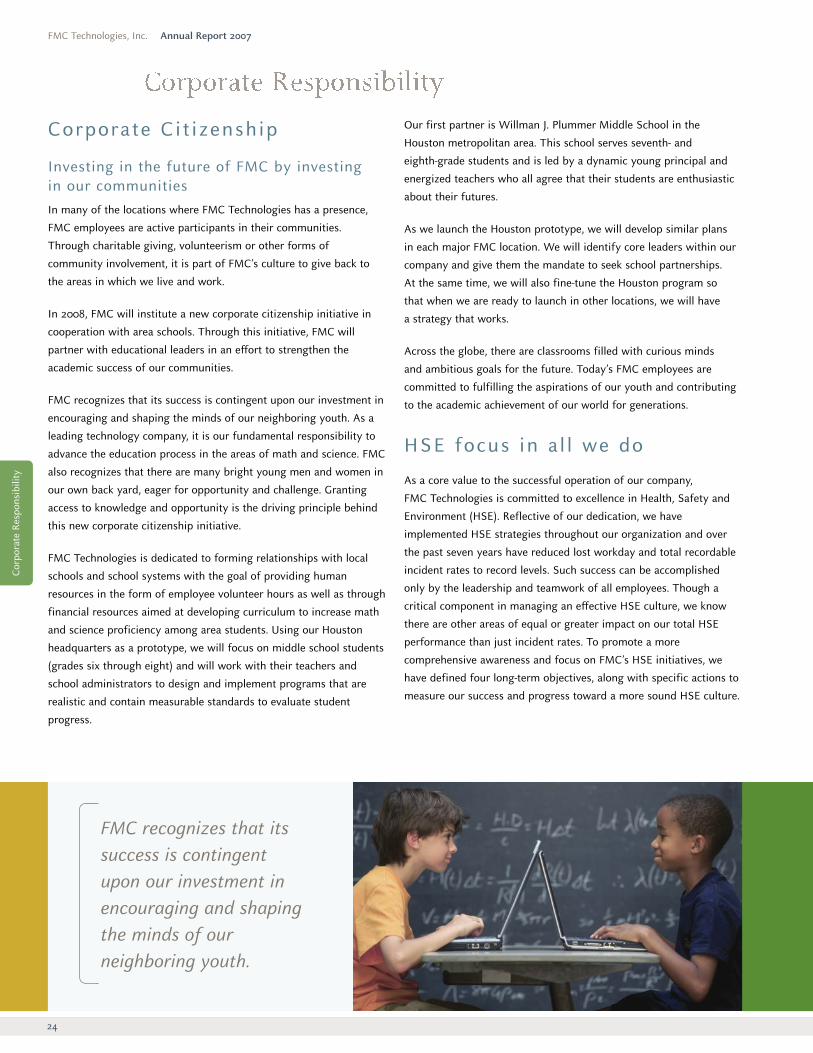
Investing in the future of FMC by investing in our communitiesIn many of the locations where FMC Technologies has a presence,
FMC employees are active participants in their communities.
Through charitable giving, volunteerism or other forms of
community involvement, it is part of FMC’s culture to give back to
the areas in which we live and work.
In 2008, FMC will institute a new corporate citizenship initiative in
cooperation with area schools. Through this initiative, FMC will
partner with educational leaders in an effort to strengthen the
academic success of our communities.
FMC recognizes that its success is contingent upon our investment in
encouraging and shaping the minds of our neighboring youth. As a
leading technology company, it is our fundamental responsibility to
advance the education process in the areas of math and science. FMC
also recognizes that there are many bright young men and women in
our own back yard, eager for opportunity and challenge. Granting
access to knowledge and opportunity is the driving principle behind
this new corporate citizenship initiative.
FMC Technologies is dedicated to forming relationships with local
schools and school systems with the goal of providing human
resources in the form of employee volunteer hours as well as through
financial resources aimed at developing curriculum to increase math
and science proficiency among area students. Using our Houston
headquarters as a prototype, we will focus on middle school students
(grades six through eight) and will work with their teachers and
school administrators to design and implement programs that are
realistic and contain measurable standards to evaluate student
progress.
Our first partner is Willman J. Plummer Middle School in the
Houston metropolitan area. This school serves seventh- and
eighth-grade students and is led by a dynamic young principal and
energized teachers who all agree that their students are enthusiastic
about their futures.
As we launch the Houston prototype, we will develop similar plans
in each major FMC location. We will identify core leaders within our
company and give them the mandate to seek school partnerships.
At the same time, we will also fine-tune the Houston program so
that when we are ready to launch in other locations, we will have
a strategy that works.
Across the globe, there are classrooms filled with curious minds
and ambitious goals for the future. Today’s FMC employees are
committed to fulfilling the aspirations of our youth and contributing
to the academic achievement of our world for generations.
HSE focus in a l l we do
As a core value to the successful operation of our company,
FMC Technologies is committed to excellence in Health, Safety and
Environment (HSE). Reflective of our dedication, we have
implemented HSE strategies throughout our organization and over
the past seven years have reduced lost workday and total recordable
incident rates to record levels. Such success can be accomplished
only by the leadership and teamwork of all employees. Though a
critical component in managing an effective HSE culture, we know
there are other areas of equal or greater impact on our total HSE
performance than just incident rates. To promote a more
comprehensive awareness and focus on FMC’s HSE initiatives, we
have defined four long-term objectives, along with specific actions to
measure our success and progress toward a more sound HSE culture.
Corp
orat
e Re
spon
sibi
lity
FMC Technologies, Inc. Annual Report 2007
FMC recognizes that itssuccess is contingentupon our investment inencouraging and shapingthe minds of ourneighboring youth.
FMC Technologies, Inc. Corporate Responsibility
25
Manage a consistent HSE focus
Our first objective is to maintain an HSE culture that reflectsindustry leading standards and values HSE as a priority in everythingwe do. To support this goal:
• During visits to FMC locations, senior management will regularlyengage key managers in extensive dialogue pertaining to each site’simplementation of HSE initiatives in which safety objectives will bereviewed and key actions will be identified.
• Major meetings will begin with a safety moment so thatemployees realize the importance of HSE and that it is a key priority.A safety moment is a discussion on a pertinent HSE topic on a job ornon-job related topic.
• An anonymous safety perception survey will be conducted atsites prior to a corporate HSE audit to gain additional employeeinsight into how well our programs are working.
Proactively manage high-risk activities
We will ensure that incidents with the highest potential for seriousconsequences are identified and actions are taken to preventrecurrence.
• Many of our serious incidents are not just recordables, but arealso property damage and near miss incidents. To be able to addressthese incidents, we must first identify, then classify the event basedon the seriousness of the incident and the likelihood of itsoccurrence. Using a risk matrix, those that fall into the most seriouspotential category will be thoroughly investigated, and action planswill be established to prevent their recurrence.
Achieve an injury-free workplace
• We will benchmark our performance with other companieswithin the oil and gas sector who are known for their outstandingsafety performance with the goal of surpassing industry performancein the areas of lost workday and total recordable incident rates.
• Our current corporate audit program focuses on siteimplementation of 15 key program elements for HSE. We have foundthat our sites with high compliance, 90 percent or better, to theseelements typically have superior safety performance. Our goal is tohave all sites reach this level of execution.
• All sites will implement a process for observing safety behavioras well as metrics to measure the percent of safe acts observed.
• We have reviewed our operations to identify high-risk activities,such as working at heights, material handling and testinghigh-pressure equipment, and will be assessing the risk level of eachof these activities. We will focus specifically on those processes thatare most important to the safe operation of our business and willdevelop plans and safeguards to address each of these.
Promote environmental stewardship
Finally, it is also important that we prevent damage to theenvironment, preserve our resources and mitigate environmentalrisks.
• We will gather information related to energy usage, CO2emissions, hazardous wastes and recycling to identify long-termimprovement targets for reduction, elimination and/or substitution.While we have made progress in a number of these areas over theyears, we know we can do more. As such, all of our facilities willestablish environmental projects in at least one of these areas basedon their respective site activities.
FMC is dedicated to continued growth, expanding our capabilitiesand meeting the challenges of our industry and of our world. Health,Safety and the Environment is at the center of our focus as wepursue new and better ways of protecting our employees, ourcommunity and our environment. We are committed to an “HSEfocus in all we do.”
Corporate Responsibility
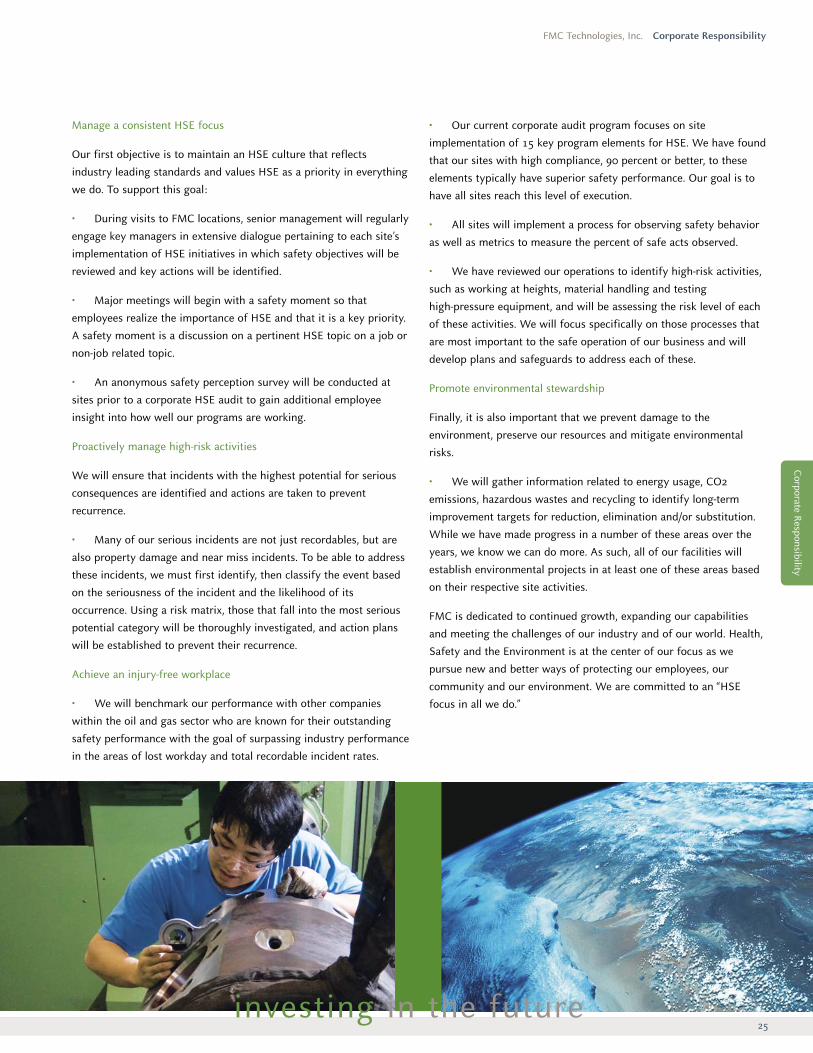
investing in the future

26
Mike R. Bowlin 2, 3
Retired Chairman of the Board, Atlantic Richfield Co.
Philip J. Burguieres 2, 3
Chairman and Chief Executive Officer, EMC Holdings, LLC
C. Maury Devine 1, 3
Retired President and Managing Director, ExxonMobil Norway, Inc.
Thomas M. Hamilton 1, 2
Retired Chairman, President and Chief Executive Officer, EEX Corporation
Peter D. Kinnear
President and Chief Executive Officer, FMC Technologies, Inc.
Asbjørn Larsen 1, 3
Retired President and Chief Executive Officer, Saga Petroleum ASA
Edward J. Mooney 1
Retired Délégué Général—North America, Suez Lyonnaise des Eaux
Joseph H. Netherland
Chairman, FMC Technologies, Inc.
Richard A. Pattarozzi 2, 3
Retired Vice President, Shell Oil Company
James M. Ringler 1, 2
Retired Vice Chairman, Illinois Tool Works Inc.
James R. Thompson 2, 3
Senior Chairman and Partner, Winston and Strawn LLP
1 Audit Committee2 Compensation Committee3 Nominating and Governance Committee
FMC Technologies, Inc. Annual Report 2007
FMC Technologies’ Directors are (seated, left to right) James Thompson, Joseph Netherland, Peter Kinnear, Maury Devine and Edward Mooney; (standing, left to right) Philip Burguieres, Thomas Hamilton, Asbjørn Larsen, Mike Bowlin, Richard Pattarozzi and James Ringler.
Dir
ecto
rs &
Off
icer
s
FMC Technologies, Inc. Directors & Officers
27
Peter D. Kinnear *
President and Chief Executive Officer
William H. Schumann, III *
Executive Vice President and Chief Financial Officer
John T. Gremp *
Executive Vice President – Energy Systems
Robert L. Potter *
Senior Vice President –Energy Processing and Global Surface Wellhead
Tore H. Halvorsen *
Senior Vice President –Global Subsea Production Systems
Charles H. Cannon, Jr. *
Senior Vice President –FoodTech and Airport Systems
Jeffrey W. Carr *
Vice President, General Counsel and Secretary
Ronald D. Mambu *
Vice President and Controller
Maryann T. Seaman *
Vice President –Administration
Randall S. Ellis
Vice President and Chief Information Officer
* Executive Officer
Directors &
Officers
Industry TermsBoosting – the use of pumps toovercome pressure losses relatedto long pipelines and/or liftinglevels in order to increase oilrecovery and production rates.
Custody Transfer – in metering,refers to a measurement deviceused in calculating payment forproduct.
Deepwater – generally definedas operations in water depths of1,500 feet (450 meters) orgreater.
Development Well – a welldrilled in a proven field tocomplete a planned pattern ofproduction.
Dynamic Positioning – systemsthat use computer-controlleddirectional propellers to keep adrilling or production vessel(such as a semisubmersible) ona fixed location relative to theseabed, compensating for wind,wave or current.
Flow-Control Equipment –mechanical devices for thepurpose of directing, managingand controlling the flow ofproduced or injected fluids.
HP/HT (High-Pressure/High-Temperature) – refers todeepwater environmentsproducing pressures as great as15,000 pounds per square inch(psi) and temperatures as highas 300 degrees Fahrenheit.
Intervention System – a systemused for deployment andretrieval of subsea equipment,for the purpose of equipmentmaintenance, replacement orupgrades. Intervention systemscan be used to re-establishaccess to the wellbore tofacilitate well manipulationoperations. Other interventionsystems may be used to deployand retrieve subsea equipmentsuch as subsea control modules,flow-control modules orpressure caps or to enablediagnostic checks. Intervention
systems are also used toperform pull-in and connectionof umbilicals and flowlines.
Manifold – a subsea assemblythat provides an interfacebetween the well and theproduction pipeline. Themanifold performs severalfunctions, including collectingproduced fluids from individualsubsea wells, distributing theelectrical and hydraulic systems and providing supportfor other subsea structures andequipment.
Risers – the physical linkbetween the seabed and thetopsides offshore installations,for production, gas lift or waterinjection purposes. Risers can beeither rigid or flexible and arecritical components of thesetypes of installations.
RLWI (Riserless Light WellIntervention) – wellmaintenance that is performedusing smaller, dynamicallypositioned (DP) vessels insteadof large anchored drilling rigs atshorter time and lower costs.RLWI technology includes apatented lubricator system thatrecirculates hydrocarbons intothe well. The system is deployedthrough the vessel’s moonpooland installed on the subsea treewithout the use of anintervention riser.
Subsea Separation andProcessing – treating producedfluids, upstream of surfacefacilities at or below the seabed, including oil/gas/waterseparation, active sandmanagement, multi-phasepumping, gas compression andflow assurance.
Subsea System – ranges fromsingle or multiple subsea wellsproducing to a nearby platform,floating production system orTLP to multiple wells producingthrough a manifold and pipelinesystem to a distant productionfacility.
Subsea Tree – a pressurecontaining safety devicecomprised of a series ofremotely operated safety valves,pipework, connections andsensors. The subsea tree isinstalled onto the subseawellhead system to direct andcontrol the flow of reservoirfluids from a subsea well.
Topside – refers to the oilproduction facilities above thewater, usually on a platform orproduction vessel, as opposed tosubsea production facilities. Alsorefers to the above-waterlocation of certain subseasystem components, such assome control systems.
Ultra-deepwater – usually refersto operations in water depths of5,000 feet (1,500 meters) orgreater.
Wellhead – the subseatermination of a wellbore thatincorporates facilities forinstalling casing hangers duringthe well construction phase. Thewellhead also incorporates ameans of hanging theproduction tubing and installingthe subsea tree and surfaceflow-control facilities inpreparation for the production phase of the well.
Financia l TermsCapital Employed – a businesssegment’s assets, net ofliabilities, excluding debt,pension, income taxes and LIFOreserves. In general, it representsthe capital investment necessaryfor a business to function.
Cash Equivalents – highly liquidinvestments that mature in threemonths or less.
Commercial Paper – anunsecured obligation issued by acorporation or bank to financeits short-term credit needs, withmaturities ranging from one dayto 270 days.
Earnings Per Share – net incomedivided by the weighted-averagenumber of shares outstanding.
GAAP (Generally AcceptedAccounting Principles) –the standard framework ofguidelines for financialaccounting, which includesstandards, conventions and rulesfor recording and summarizingtransactions and preparingfinancial statements.
Inbound Orders – the sales valueof confirmed customer ordersreceived for products andservices during a specifiedperiod.
Operating Profit – a businesssegment’s revenue, less itsoperating expenses, excludingcorporate staff expenses, netinterest expense, income taxesand certain other expenses.
Order Backlog – the sales valueof unfilled, confirmed customerorders for products and servicesat a specified date.
ROI (Return On Investment) –income from continuingoperations plus after-tax interestexpense as a percentage of totalaverage debt and equity.
Sale-Leaseback – sale of an assetfor cash with an agreement tolease it back from the purchaser.
28
FMC Technologies, Inc. Annual Report 2007
29
FMC Technologies, Inc. Annual Report 2007
Management’s Discussion & Analysisof Financial Condition & Results of Operations
Cautionary Note Regarding Forward-Looking Statements
Statement under the safe harbor provisions of the Private Securities Litigation Reform Act of 1995: FMC Technologies, Inc. and itsrepresentatives may from time to time make written or oral statements that are “forward-looking” and provide information that is nothistorical in nature, including statements that are or will be contained in this report, the notes to our consolidated financial statements,our other filings with the Securities and Exchange Commission, our press releases and conference call presentations and our othercommunications to our stockholders. These statements involve known and unknown risks, uncertainties and other factors that may beoutside of our control and may cause actual results to differ materially from any results, levels of activity, performance or achievementsexpressed or implied by any forward-looking statement. These factors include, among other things, those described under Risk Factors inItem 1A of the Annual Report on Form 10-K.
In some cases, forward-looking statements can be identified by such words or phrases as “will likely result,” “is confident that,” “expects,”“should,” “could,” “may,” “will continue to,” “believes,” “anticipates,” “predicts,” “forecasts,” “estimates,” “projects,” “potential,” “intends” orsimilar expressions identifying “forward-looking statements” within the meaning of the Private Securities Litigation Reform Act of 1995,including the negative of those words and phrases. Such forward-looking statements are based on our current views and assumptionsregarding future events, future business conditions and our outlook based on currently available information. We wish to caution you notto place undue reliance on any such forward-looking statements, which speak only as of the date made and involve judgments.
Executive Overview
We design, manufacture and service sophisticated machinery and systems for customers in the energy, food processing and air transportationindustries. We have manufacturing operations worldwide and are strategically located to facilitate delivery of our products and services toour customers. We operate Energy Systems (comprising Energy Production Systems and Energy Processing Systems), FoodTech andAirport Systems business segments. Our business segments serve diverse industries with a wide customer base. We focus on economicand industry-specific drivers and key risk factors affecting each of our business segments as we formulate our strategic plans and makedecisions related to allocating capital and human resources. The following discussion provides examples of the kinds of economic andindustry factors and key risks that we consider.
The results of our Energy Systems businesses are primarily driven by changes in exploration and production spending by oil and gascompanies, which in part depend upon current and anticipated future crude oil and natural gas prices and production volumes. OurEnergy Production Systems business is affected by trends in land and offshore oil and gas production, including shallow and deepwaterdevelopment. Our Energy Processing Systems business results reflect spending by oilfield service companies and engineering constructioncompanies for equipment and systems that facilitate the flow, measurement and transportation of crude oil and natural gas. The level ofproduction activity worldwide influences spending decisions, and we use rig count as one indicator of demand. In the past year, oil andgas prices have been high relative to historical levels, creating incentives for investment in the energy industry. This trend benefited bothof our Energy Systems businesses in 2007.
Our FoodTech business results reflect the level of capital investment being made by our food processing customers. The level of capitalspending is influenced by changing consumer preferences, public perception of food safety, conditions in the agricultural sector thataffect commodity prices, and by our customers’ overall profitability. FoodTech revenues include variable rentals from equipment leases,such as citrus extractors. FoodTech results also may fluctuate as a result of consolidation of customers in the commercial foodprocessing industry.
The results of our Airport Systems business are highly dependent upon the profitability of our customers in the airline and air cargomarkets. Their profitability is affected by fluctuations in passenger and freight traffic and the volatility of operating expenses, includingthe impact of costs related to labor, fuel and airline security. There were positive developments in the airline industry during 2007,including growth in passenger traffic and air cargo. However, we have experienced competitive pressures, especially in the passengerboarding bridge product line, which has affected our pricing. In addition, results in our Airport Systems business are influenced by thelevel of purchases by the U.S. Air Force, which depend upon governmental funding approvals.
We also focus on key risk factors when determining our overall strategy and making decisions for allocating capital. These factors includerisks associated with the global economic outlook, product obsolescence and the competitive environment. We address these risks in ourbusiness strategies, which incorporate continuing development of leading-edge technologies, cultivating strong customer relationshipsand growing our energy business.
MD
& A
FMC Technologies, Inc. Annual Report 2007
30
In 2007, we again emphasized technological advancement. In Energy Production Systems, we delivered the industry’s first commercialapplication of a full-scale subsea processing system. Subsea processing enables production and treatment of hydrocarbons on the oceanfloor, thereby reducing deepwater oilfield development costs for pipelines, risers and other topside processing equipment. The installationof our system is expected to improve an oilfield’s recovery by removing the water from the wellstream and then reinjecting the waterback into the reservoir through a separate subsea well. In FoodTech, we advanced the design in one of our freezers to manage increasedthroughput while maintaining the same compact size of earlier models. This should allow food processors to increase yield and speed ofprocessing without requiring more production space.
We have developed close working relationships with our customers in all of our business segments. Our Energy Production Systemsbusiness results reflect our ability to build long-term alliances with oil and gas companies that are actively engaged in offshore deepwaterdevelopment, and provide solutions to their needs in a timely and cost-effective manner. We have formed similar collaborative relationshipswith oilfield service companies in Energy Processing Systems, air cargo companies in Airport Systems and citrus processors in FoodTech.We believe that by working closely with our customers we enhance our competitive advantage, strengthen our market positions andimprove our results.
In October 2007, we announced our decision to spin off our FoodTech and Airport Systems businesses into a separate, publicly tradedcompany. If the spin-off is completed, we will be able to focus all of our efforts and resources on growing the energy business. The currenteconomic outlook in the energy sector is positive. We expect deepwater rig additions over the next few years to add new capacity todevelop future subsea fields, which we expect to support the secular growth trend for subsea equipment.
As we evaluate our operating results, we view our business segments by product line and consider performance indicators like segmentrevenues, operating profit and capital employed, in addition to the level of inbound orders and order backlog. A significant and growingproportion of our revenues is recognized under the percentage of completion method of accounting. Our payments for such arrangementsare generally received according to milestones achieved under stated contract terms. Consequently, the timing of revenue recognition isnot always highly correlated with the timing of customer payments. We may structure our contracts to receive advance payments whichwe may use to fund engineering efforts and inventory purchases. Working capital (excluding cash) and net debt are therefore keyperformance indicators of cash flows.
In all of our segments, we serve customers from around the world. During 2007, approximately 70% of our total sales were to non-U.S.locations. We evaluate international markets and pursue opportunities that fit our technological capabilities and strategies. For example,we have targeted opportunities in West Africa, Brazil and the Asia Pacific region because of the expected offshore drilling potential inthose regions.
MD
& A
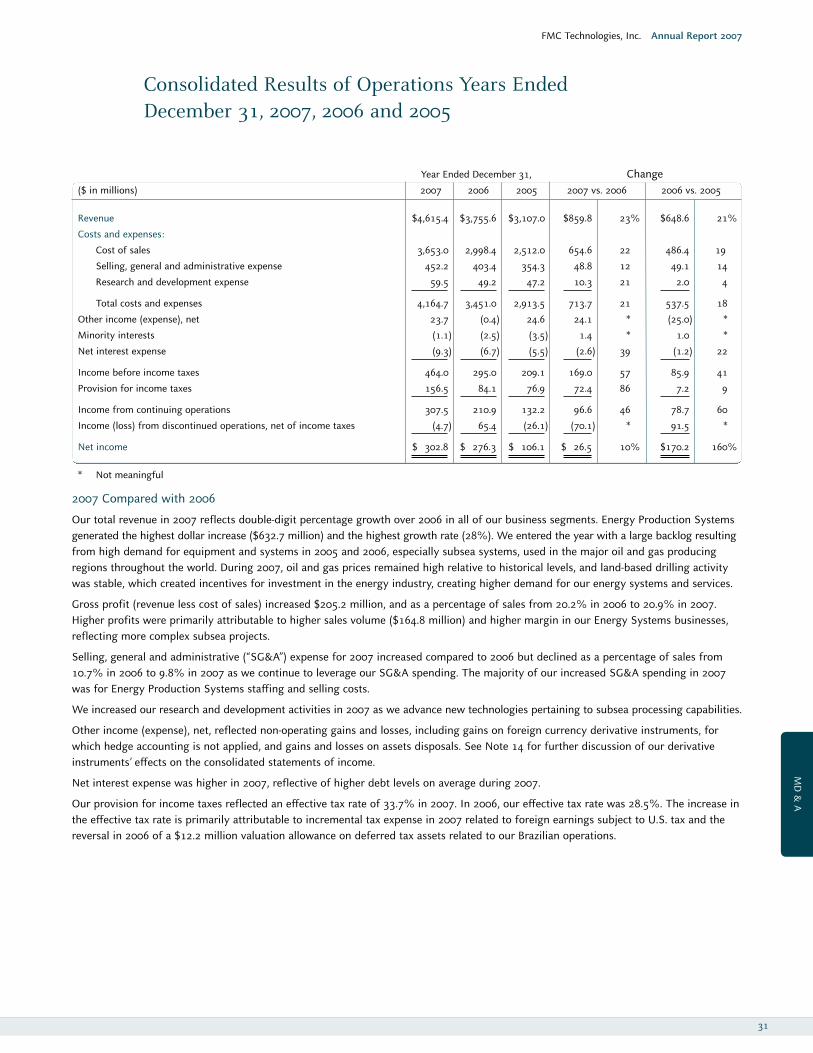
31
FMC Technologies, Inc. Annual Report 2007
Year Ended December 31, Change ($ in millions) 2007 2006 2005 2007 vs. 2006 2006 vs. 2005
Revenue $4,615.4 $3,755.6 $3,107.0 $859.8 23% $648.6 21%
Costs and expenses:
Cost of sales 3,653.0 2,998.4 2,512.0 654.6 22 486.4 19
Selling, general and administrative expense 452.2 403.4 354.3 48.8 12 49.1 14
Research and development expense 59.5 49.2 47.2 10.3 21 2.0 4
Total costs and expenses 4,164.7 3,451.0 2,913.5 713.7 21 537.5 18
Other income (expense), net 23.7 (0.4) 24.6 24.1 * (25.0) *
Minority interests (1.1) (2.5) (3.5) 1.4 * 1.0 *
Net interest expense (9.3) (6.7) (5.5) (2.6) 39 (1.2) 22
Income before income taxes 464.0 295.0 209.1 169.0 57 85.9 41
Provision for income taxes 156.5 84.1 76.9 72.4 86 7.2 9
Income from continuing operations 307.5 210.9 132.2 96.6 46 78.7 60
Income (loss) from discontinued operations, net of income taxes (4.7) 65.4 (26.1) (70.1) * 91.5 *
Net income $ 302.8 $ 276.3 $ 106.1 $ 26.5 10% $170.2 160%
* Not meaningful
2007 Compared with 2006
Our total revenue in 2007 reflects double-digit percentage growth over 2006 in all of our business segments. Energy Production Systemsgenerated the highest dollar increase ($632.7 million) and the highest growth rate (28%). We entered the year with a large backlog resultingfrom high demand for equipment and systems in 2005 and 2006, especially subsea systems, used in the major oil and gas producingregions throughout the world. During 2007, oil and gas prices remained high relative to historical levels, and land-based drilling activitywas stable, which created incentives for investment in the energy industry, creating higher demand for our energy systems and services.
Gross profit (revenue less cost of sales) increased $205.2 million, and as a percentage of sales from 20.2% in 2006 to 20.9% in 2007.Higher profits were primarily attributable to higher sales volume ($164.8 million) and higher margin in our Energy Systems businesses,reflecting more complex subsea projects.
Selling, general and administrative (“SG&A”) expense for 2007 increased compared to 2006 but declined as a percentage of sales from10.7% in 2006 to 9.8% in 2007 as we continue to leverage our SG&A spending. The majority of our increased SG&A spending in 2007was for Energy Production Systems staffing and selling costs.
We increased our research and development activities in 2007 as we advance new technologies pertaining to subsea processing capabilities.
Other income (expense), net, reflected non-operating gains and losses, including gains on foreign currency derivative instruments, forwhich hedge accounting is not applied, and gains and losses on assets disposals. See Note 14 for further discussion of our derivativeinstruments’ effects on the consolidated statements of income.
Net interest expense was higher in 2007, reflective of higher debt levels on average during 2007.
Our provision for income taxes reflected an effective tax rate of 33.7% in 2007. In 2006, our effective tax rate was 28.5%. The increase inthe effective tax rate is primarily attributable to incremental tax expense in 2007 related to foreign earnings subject to U.S. tax and thereversal in 2006 of a $12.2 million valuation allowance on deferred tax assets related to our Brazilian operations.
Consolidated Results of Operations Years EndedDecember 31, 2007, 2006 and 2005
MD
& A
FMC Technologies, Inc. Annual Report 2007
32
Discontinued Operations
We have reported a net loss from discontinued operations, reflecting operating losses in two FoodTech product lines, which were partiallyoffset by a $3.1 million gain on sale of one of the FoodTech product lines during the third quarter of 2007. In 2006, our net income fromdiscontinued operations included a gain of $34.8 million, net of tax, on the sale of our Floating Systems business. In addition, wegenerated profits from the Floating Systems business during 2006, including a $15.0 million ($9.2 million, net of tax) on the favorableresolution of claims on a large contract.
2006 Compared with 2005
Our total revenue for the year ended December 31, 2006, increased compared to the prior year, primarily as a result of our energybusinesses, which generated $631.2 million of the revenue growth. Our Energy Production Systems businesses, which provided $479.0 million of the increase, benefited from the high demand for equipment and systems, especially subsea systems, used in the majoroil and gas producing regions throughout the world. High oil and gas prices relative to historical levels drove demand for our EnergyProcessing Systems businesses, providing $150.5 million in incremental revenue compared to 2005.
Cost of sales increased relative to 2005, but gross profit (revenue less cost of sales) increased $162.2 million compared to 2005. Highersales volume generated approximately 75% of the increase, particularly in our Energy Production Systems and Energy ProcessingSystems businesses. Gross profit improvements in all of our segments relative to 2005 drove the remaining increase in gross profits. The improvement was highly attributable to production cost reductions and shifts in product mix to higher-margin products.
Selling, general and administrative expense for the year ended December 31, 2006, increased compared to the prior year but declined asa percentage of sales from 11.4% in 2005 to 10.7% in 2006. Higher costs in our Energy Production Systems businesses were primarilyresponsible for the dollar increase, the result of increased headcount required for bid and proposal activity to pursue large-scale subseaprojects. While we have expanded our operations to meet the growing demand, we have been able to reduce expenses as a percentage ofsales by leveraging our existing capabilities.
The absence of the $25.3 million gain on disposal of our investment in common stock of MODEC, Inc. recorded in 2005 contributed tothe decline in other income (expense), net for 2006.
Net interest expense for the year ended December 31, 2006, was higher compared to the same period in 2005, primarily as a result ofhigher average debt levels.
Income tax expense for the year ended December 31, 2006, resulted in an effective income tax rate of 28.5%, compared to an effectiverate of 36.8% for 2005. The decrease in effective tax rate is attributable to $25.5 million in incremental tax expense recorded in 2005related to repatriating foreign earnings under the American Jobs Creation Act of 2004 (the “JOBS Act”). This effect was partially offset bythe correction of an immaterial error in 2005, resulting in a reduction in income tax expense of $5.4 million. Additionally, in 2006, wereversed a $12.2 million valuation allowance on deferred tax assets related to our Brazilian operations. Profitability and projections forfuture taxable income in Brazil caused us to change our assessment of the recoverability of deferred tax assets and reverse the valuationallowance established in prior years.
Discontinued Operations
Our discontinued operations generated income of $65.4 million for the year ended December 31, 2006, compared with $26.1 million inlosses for 2005. The variance was driven by two factors. First, we recognized income of $15.0 million ($9.2 million, net of tax) related tofavorable resolution of contract claims for the Sonatrach project during the second quarter of 2006, compared to losses of $54.9 million($33.6 million, net of tax) in 2005. Additionally, we recorded a gain of $34.8 million, net of tax of $18.5 million, in 2006 related to the saleof our discontinued Floating Systems business.
Outlook for 2008
We estimate that our full-year 2008 diluted earnings per share will be within the range of $2.75 to $2.85, including FoodTech and AirportSystems, but excluding estimated costs of $0.08 to $0.10 associated with the planned spin-off. The section titled “Operating Results ofBusiness Segments” provides further discussion of our 2008 outlook. This estimate includes results of operations for FoodTech andAirport Systems, which we expect to spin off during 2008.
MD
& A
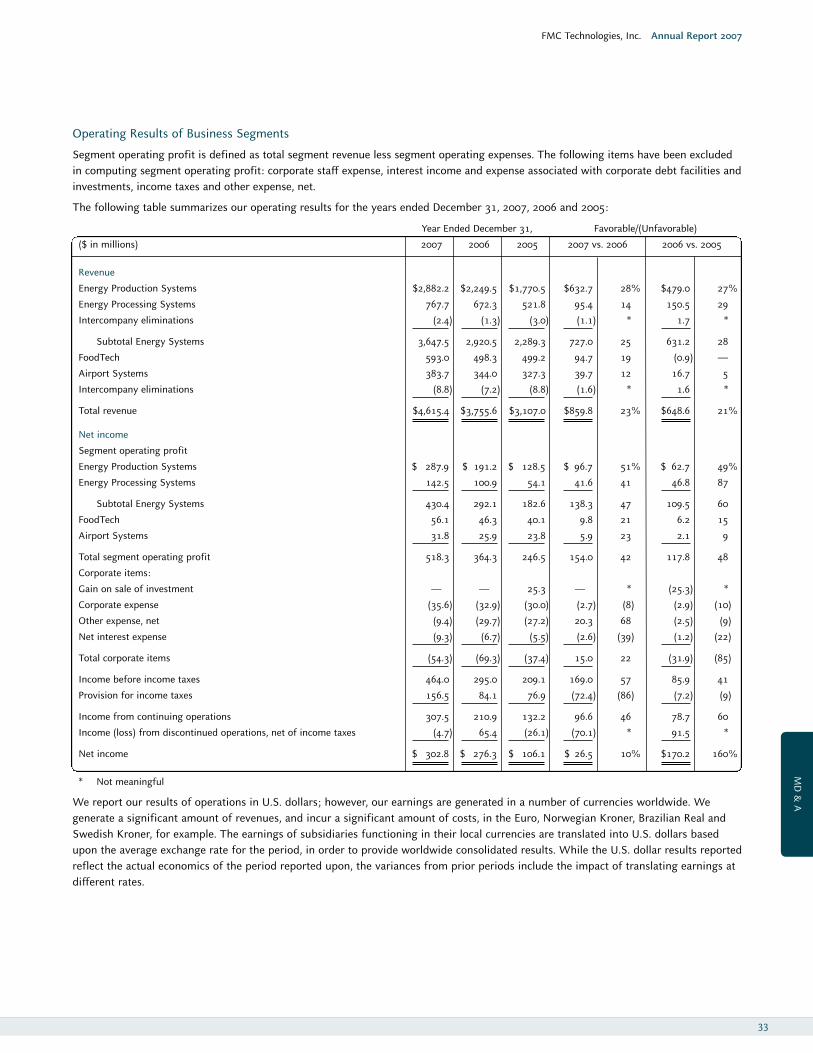
Operating Results of Business Segments
Segment operating profit is defined as total segment revenue less segment operating expenses. The following items have been excludedin computing segment operating profit: corporate staff expense, interest income and expense associated with corporate debt facilities andinvestments, income taxes and other expense, net.
The following table summarizes our operating results for the years ended December 31, 2007, 2006 and 2005:
Year Ended December 31, Favorable/(Unfavorable)
($ in millions) 2007 2006 2005 2007 vs. 2006 2006 vs. 2005
Revenue
Energy Production Systems $2,882.2 $2,249.5 $1,770.5 $632.7 28% $479.0 27%
Energy Processing Systems 767.7 672.3 521.8 95.4 14 150.5 29
Intercompany eliminations (2.4) (1.3) (3.0) (1.1) * 1.7 *
Subtotal Energy Systems 3,647.5 2,920.5 2,289.3 727.0 25 631.2 28
FoodTech 593.0 498.3 499.2 94.7 19 (0.9) —
Airport Systems 383.7 344.0 327.3 39.7 12 16.7 5
Intercompany eliminations (8.8) (7.2) (8.8) (1.6) * 1.6 *
Total revenue $4,615.4 $3,755.6 $3,107.0 $859.8 23% $648.6 21%
Net income
Segment operating profit
Energy Production Systems $ 287.9 $ 191.2 $ 128.5 $ 96.7 51% $ 62.7 49%
Energy Processing Systems 142.5 100.9 54.1 41.6 41 46.8 87
Subtotal Energy Systems 430.4 292.1 182.6 138.3 47 109.5 60
FoodTech 56.1 46.3 40.1 9.8 21 6.2 15
Airport Systems 31.8 25.9 23.8 5.9 23 2.1 9
Total segment operating profit 518.3 364.3 246.5 154.0 42 117.8 48
Corporate items:
Gain on sale of investment — — 25.3 — * (25.3) *
Corporate expense (35.6) (32.9) (30.0) (2.7) (8) (2.9) (10)
Other expense, net (9.4) (29.7) (27.2) 20.3 68 (2.5) (9)
Net interest expense (9.3) (6.7) (5.5) (2.6) (39) (1.2) (22)
Total corporate items (54.3) (69.3) (37.4) 15.0 22 (31.9) (85)
Income before income taxes 464.0 295.0 209.1 169.0 57 85.9 41
Provision for income taxes 156.5 84.1 76.9 (72.4) (86) (7.2) (9)
Income from continuing operations 307.5 210.9 132.2 96.6 46 78.7 60
Income (loss) from discontinued operations, net of income taxes (4.7) 65.4 (26.1) (70.1) * 91.5 *
Net income $ 302.8 $ 276.3 $ 106.1 $ 26.5 10% $170.2 160%
* Not meaningful
We report our results of operations in U.S. dollars; however, our earnings are generated in a number of currencies worldwide. Wegenerate a significant amount of revenues, and incur a significant amount of costs, in the Euro, Norwegian Kroner, Brazilian Real andSwedish Kroner, for example. The earnings of subsidiaries functioning in their local currencies are translated into U.S. dollars basedupon the average exchange rate for the period, in order to provide worldwide consolidated results. While the U.S. dollar results reportedreflect the actual economics of the period reported upon, the variances from prior periods include the impact of translating earnings atdifferent rates.
FMC Technologies, Inc. Annual Report 2007
33
MD
& A
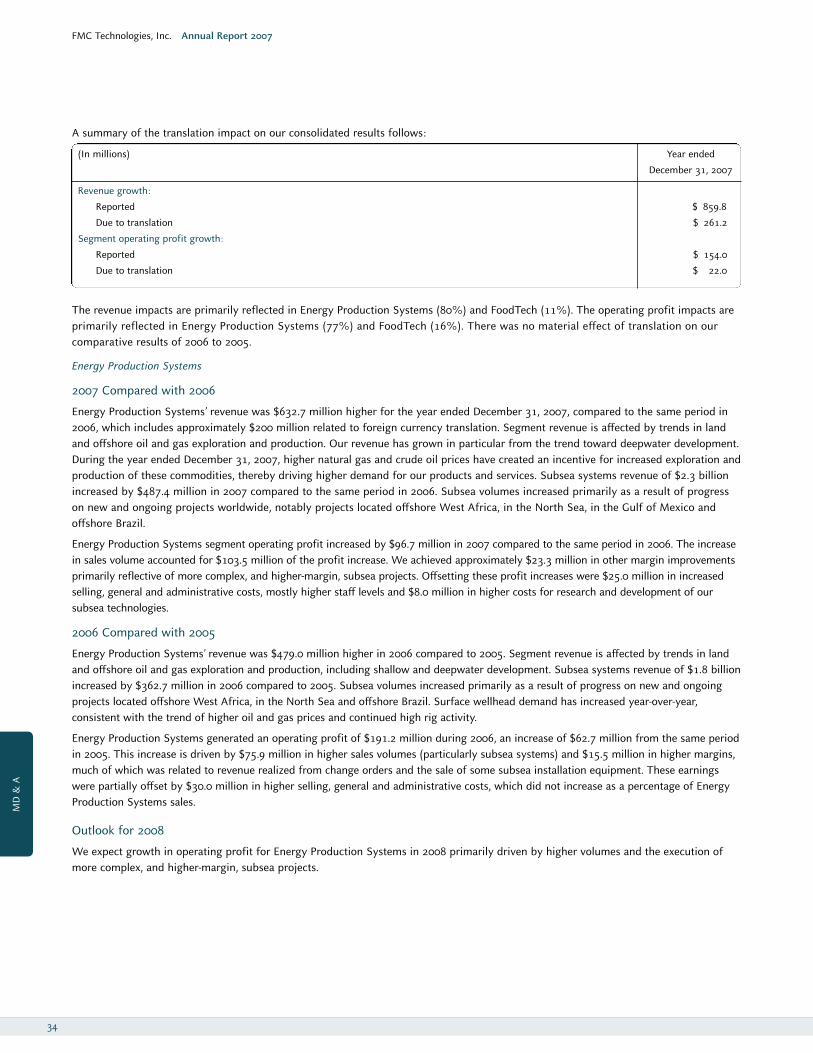
FMC Technologies, Inc. Annual Report 2007
34
A summary of the translation impact on our consolidated results follows:
(In millions) Year ended
December 31, 2007
Revenue growth:
Reported $ 859.8
Due to translation $ 261.2
Segment operating profit growth:
Reported $ 154.0
Due to translation $ 22.0
The revenue impacts are primarily reflected in Energy Production Systems (80%) and FoodTech (11%). The operating profit impacts areprimarily reflected in Energy Production Systems (77%) and FoodTech (16%). There was no material effect of translation on ourcomparative results of 2006 to 2005.
Energy Production Systems
2007 Compared with 2006
Energy Production Systems’ revenue was $632.7 million higher for the year ended December 31, 2007, compared to the same period in2006, which includes approximately $200 million related to foreign currency translation. Segment revenue is affected by trends in landand offshore oil and gas exploration and production. Our revenue has grown in particular from the trend toward deepwater development.During the year ended December 31, 2007, higher natural gas and crude oil prices have created an incentive for increased exploration andproduction of these commodities, thereby driving higher demand for our products and services. Subsea systems revenue of $2.3 billionincreased by $487.4 million in 2007 compared to the same period in 2006. Subsea volumes increased primarily as a result of progresson new and ongoing projects worldwide, notably projects located offshore West Africa, in the North Sea, in the Gulf of Mexico andoffshore Brazil.
Energy Production Systems segment operating profit increased by $96.7 million in 2007 compared to the same period in 2006. The increasein sales volume accounted for $103.5 million of the profit increase. We achieved approximately $23.3 million in other margin improvementsprimarily reflective of more complex, and higher-margin, subsea projects. Offsetting these profit increases were $25.0 million in increasedselling, general and administrative costs, mostly higher staff levels and $8.0 million in higher costs for research and development of oursubsea technologies.
2006 Compared with 2005
Energy Production Systems’ revenue was $479.0 million higher in 2006 compared to 2005. Segment revenue is affected by trends in landand offshore oil and gas exploration and production, including shallow and deepwater development. Subsea systems revenue of $1.8 billionincreased by $362.7 million in 2006 compared to 2005. Subsea volumes increased primarily as a result of progress on new and ongoingprojects located offshore West Africa, in the North Sea and offshore Brazil. Surface wellhead demand has increased year-over-year,consistent with the trend of higher oil and gas prices and continued high rig activity.
Energy Production Systems generated an operating profit of $191.2 million during 2006, an increase of $62.7 million from the same periodin 2005. This increase is driven by $75.9 million in higher sales volumes (particularly subsea systems) and $15.5 million in higher margins,much of which was related to revenue realized from change orders and the sale of some subsea installation equipment. These earningswere partially offset by $30.0 million in higher selling, general and administrative costs, which did not increase as a percentage of EnergyProduction Systems sales.
Outlook for 2008
We expect growth in operating profit for Energy Production Systems in 2008 primarily driven by higher volumes and the execution ofmore complex, and higher-margin, subsea projects.
MD
& A
FMC Technologies, Inc. Annual Report 2007
35
Energy Processing Systems
2007 Compared with 2006
Energy Processing Systems’ revenue increased $95.4 million in 2007 compared to 2006. Energy demand has continued to rise in 2007,driving higher oil and gas prices, and has sustained land-based drilling and fracturing activity. This has resulted in higher demand for ourfluid control products and our measurement custody transfer products and systems.
Energy Processing Systems’ operating profit in 2007 increased $41.6 million compared to 2006. Higher volume drove an increase in profitsof $33.1 million. Cost-reduction efforts and our ability to leverage higher sales volumes led to improved product costs in most of ourbusiness units, contributing $9.9 million in increased profits. These savings were partially offset by higher selling, general andadministrative costs, including higher staff levels and increased commission expense.
2006 Compared with 2005
Energy Processing Systems’ revenue increased $150.5 million in 2006 compared to 2005. Segment revenues benefited from strong oil andgas prices as well as the continuing strength in land-based drilling and fracturing activity. These factors contributed to fluid control salesvolumes increasing by $73.9 million compared to 2005, driven by higher demand for WECO
®/Chiksan
®equipment, which is sold primarily to
service companies, along with an increased demand for pump oil and gas products. Continued progress on bulk conveying projects thatwere inbound in 2005 and higher demand for other material handling products contributed $42.7 million to the increase in revenue. Salesof loading systems increased by $20.4 million, reflecting increased demand, especially for LNG loading arms.
Energy Processing Systems’ operating profit in 2006 increased $46.8 million compared to 2005, primarily attributable to increased salesvolume, contributing $40.4 million to the annual increase in profit. Production cost reductions and improved operating efficiency contributed$9.5 million to the increase in profitability. In the fourth quarter of 2006, we announced the closure of one of our facilities, which requiredan asset impairment charge of $1.5 million and severance expense of $2.2 million. In addition, during the fourth quarter of 2006, we settleda lawsuit and incurred $1.7 million in expense.
Outlook for 2008
We expect an increase in operating profit for Energy Processing Systems resulting from a growth in revenue. However, we don’t expectthat the growth in revenues will approach 14%, as achieved in 2007.
FoodTech
2007 Compared with 2006
FoodTech’s revenue increased by $94.7 million in the 12 months ended December 31, 2007, compared with the same period in 2006.Demand from the poultry industry was lower than in 2006 primarily as a result of a slowdown in the North American poultry market;however, we have been able to replace lost revenue in this industry with increases in other food processing markets worldwide. Thesesales, primarily freezing equipment, accounted for $27.3 million in incremental revenue. Increased demand for food processing equipmentcompared to a much lower market demand worldwide in 2006 drove $32.5 million in incremental revenue. Additionally, foreign currencytranslation caused $29.6 million of the increase in revenue.
FoodTech’s operating profit in the 12 months ended December 31, 2007, increased by $9.8 million as compared to the same period in2006. Higher sales volume contributed $25.7 million in higher profits, which were partially offset by $8.5 million from margin declinesresulting from a change in sales mix. In 2006, our sales mix was more heavily weighted toward the poultry industry, to which we generallysell our higher-technology-based core product line. In 2007, we compensated for decreased volume in the North American poultry industrywith a higher volume of lower-margin equipment to non-poultry customers. In addition, selling, general and administrative costsincreased $4.8 million in 2007 compared to 2006, most of which represents foreign currency translation.
2006 Compared with 2005
FoodTech’s revenue during 2006 was essentially flat compared to 2005. Higher volumes primarily from poultry processing demand provided$5.7 million in incremental revenue which was offset by decreases in revenue from food processing equipment, especially in the tomatoand fruit processing markets.
FoodTech’s operating profit increased by $6.2 million during 2006 compared to 2005. The increase in operating profit resulted fromdelivering a more favorable mix of products and services primarily in our cooking and freezing businesses. In addition, we realized a gainof $1.0 million on a sale of property in 2006.
MD
& A
FMC Technologies, Inc. Annual Report 2007
36
Outlook for 2008
We anticipate some recovery in poultry demand in the U.S., which supports our expectations for increased revenue and operatingprofit in 2008.
Airport Systems
2007 Compared with 2006
Airport Systems’ revenue was $39.7 million higher for the year ended December 31, 2007, compared with the same period in 2006. Airtraffic has trended upward as compared to 2006, creating higher demand for airline ground support equipment ($23.3 million) as wellas airport maintenance and facility operation services ($9.5 million), which includes new service contracts as well as increased scope onexisting contracts.
Airport Systems’ operating profit for the year ended December 31, 2007, improved $5.9 million compared with the same period in 2006,reflecting two factors of approximately equal magnitude: higher volume and better leveraging of our selling, general and administrativespending.
2006 Compared with 2005
Airport Systems’ revenue was $16.7 million higher during 2006 compared with 2005. The revenue improvement was driven by higherdemand for passenger boarding bridges primarily from domestic and international airport authorities and the addition of newmaintenance contracts at various domestic airports in our airport services business.
Airport Systems’ operating profit increased in 2006 by $2.1 million compared to 2005. Increased profits were driven by lower startupcosts for a ground support equipment product line recently integrated into the business, which provided $2.7 million in incremental profitand $1.7 million higher profits from airport services. The absence of a $2.7 million gain recorded in 2005 on a land sale partially offsetour net increase in profits.
Outlook for 2008
We experienced record high inbound orders and ended the year with a record high backlog which will support growth in revenue and inoperating profit in 2008.
Corporate Items
2007 Compared with 2006
Our corporate items reduced earnings by $54.3 million in 2007 compared to $69.3 million in 2006. Our comparative results reflect$28.2 million in increased gains from foreign currency hedging activity. Partially offsetting these earnings were higher stock-basedcompensation of $5.0 million and other corporate staff costs of $2.7 million.
2006 Compared with 2005
Corporate items increased by $31.9 million in 2006 compared to the prior year, primarily as a result of the absence of a $25.3 milliongain on sale of MODEC, Inc. shares recognized in 2005. Additionally, stock-based compensation expense increased by $4.4 million overthe prior year, reflecting the amortization of higher value awards granted in the past several years.
MD
& A
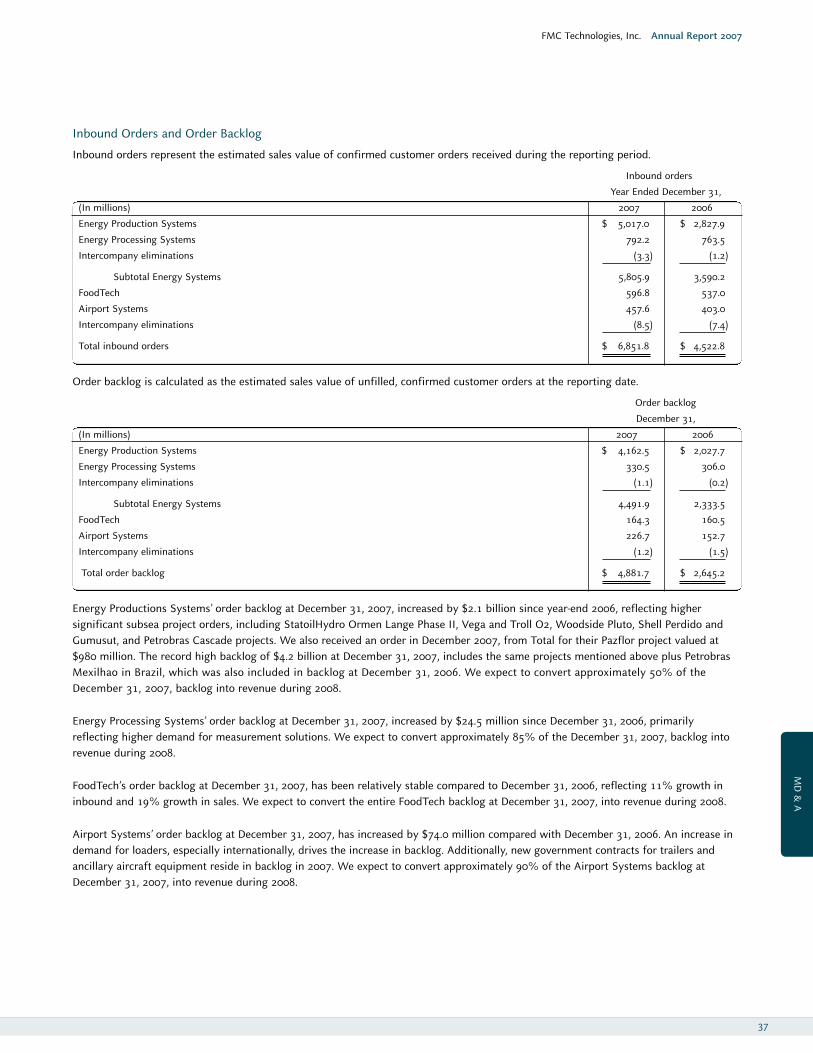
FMC Technologies, Inc. Annual Report 2007
37
Inbound Orders and Order Backlog
Inbound orders represent the estimated sales value of confirmed customer orders received during the reporting period.
Inbound orders
Year Ende d December 31,
(In millions) 2007 2006
Energy Production Systems $ 5,017.0 $ 2,827.9
Energy Processing Systems 792.2 763.5
Intercompany eliminations (3.3) (1.2)
Subtotal Energy Systems 5,805.9 3,590.2
FoodTech 596.8 537.0
Airport Systems 457.6 403.0
Intercompany eliminations (8.5) (7.4)
Total inbound orders $ 6,851.8 $ 4,522.8
Order backlog is calculated as the estimated sales value of unfilled, confirmed customer orders at the reporting date.
Order backlog
December 31,
(In millions) 2007 2006
Energy Production Systems $ 4,162.5 $ 2,027.7
Energy Processing Systems 330.5 306.0
Intercompany eliminations (1.1) (0.2)
Subtotal Energy Systems 4,491.9 2,333.5
FoodTech 164.3 160.5
Airport Systems 226.7 152.7
Intercompany eliminations (1.2) (1.5)
Total order backlog $ 4,881.7 $ 2,645.2
Energy Productions Systems’ order backlog at December 31, 2007, increased by $2.1 billion since year-end 2006, reflecting highersignificant subsea project orders, including StatoilHydro Ormen Lange Phase II, Vega and Troll O2, Woodside Pluto, Shell Perdido andGumusut, and Petrobras Cascade projects. We also received an order in December 2007, from Total for their Pazflor project valued at$980 million. The record high backlog of $4.2 billion at December 31, 2007, includes the same projects mentioned above plus PetrobrasMexilhao in Brazil, which was also included in backlog at December 31, 2006. We expect to convert approximately 50% of theDecember 31, 2007, backlog into revenue during 2008.
Energy Processing Systems’ order backlog at December 31, 2007, increased by $24.5 million since December 31, 2006, primarilyreflecting higher demand for measurement solutions. We expect to convert approximately 85% of the December 31, 2007, backlog intorevenue during 2008.
FoodTech’s order backlog at December 31, 2007, has been relatively stable compared to December 31, 2006, reflecting 11% growth ininbound and 19% growth in sales. We expect to convert the entire FoodTech backlog at December 31, 2007, into revenue during 2008.
Airport Systems’ order backlog at December 31, 2007, has increased by $74.0 million compared with December 31, 2006. An increase indemand for loaders, especially internationally, drives the increase in backlog. Additionally, new government contracts for trailers andancillary aircraft equipment reside in backlog in 2007. We expect to convert approximately 90% of the Airport Systems backlog atDecember 31, 2007, into revenue during 2008.
MD
& A
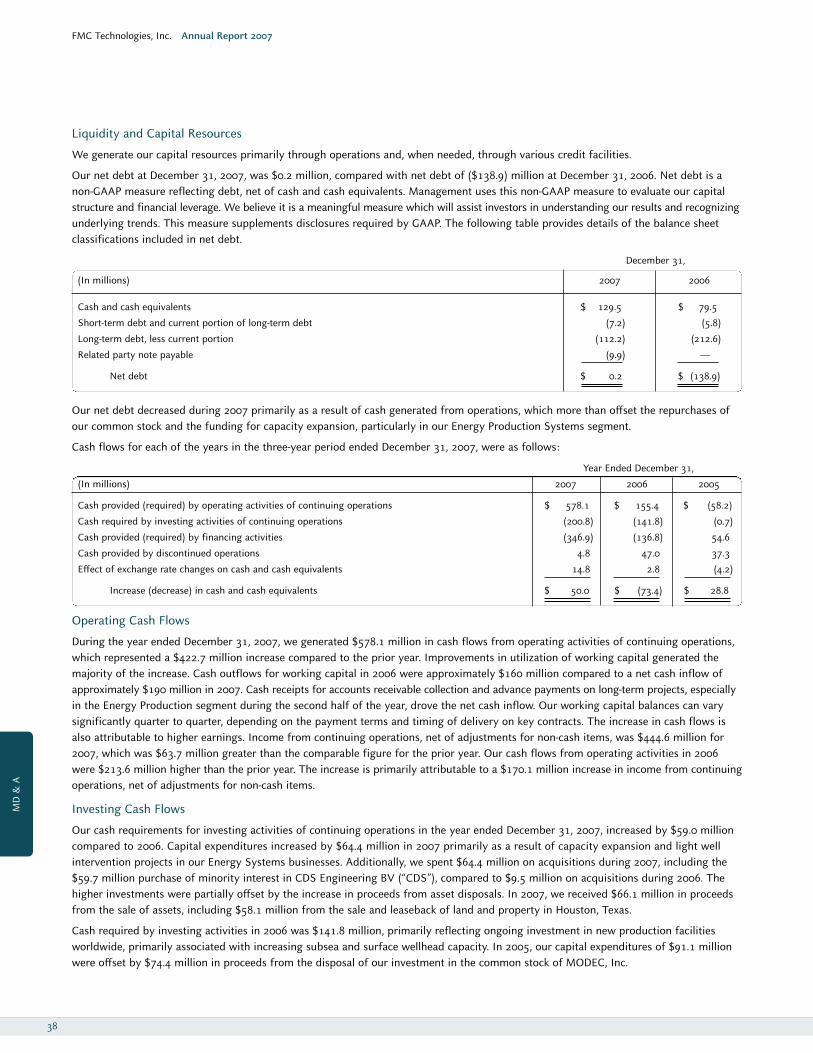
FMC Technologies, Inc. Annual Report 2007
38
Liquidity and Capital Resources
We generate our capital resources primarily through operations and, when needed, through various credit facilities.
Our net debt at December 31, 2007, was $0.2 million, compared with net debt of ($138.9) million at December 31, 2006. Net debt is anon-GAAP measure reflecting debt, net of cash and cash equivalents. Management uses this non-GAAP measure to evaluate our capitalstructure and financial leverage. We believe it is a meaningful measure which will assist investors in understanding our results and recognizingunderlying trends. This measure supplements disclosures required by GAAP. The following table provides details of the balance sheetclassifications included in net debt.
December 31,
(In millions) 2007 2006
Cash and cash equivalents $ 129.5 $ 79.5
Short-term debt and current portion of long-term debt (7.2) (5.8)
Long-term debt, less current portion (112.2) (212.6)
Related party note payable ( 9.9) —
Net debt $ 0.2 $ (138.9)
Our net debt decreased during 2007 primarily as a result of cash generated from operations, which more than offset the repurchases ofour common stock and the funding for capacity expansion, particularly in our Energy Production Systems segment.
Cash flows for each of the years in the three-year period ended December 31, 2007, were as follows:
Year Ended December 31,
(In millions) 2007 2006 2005
Cash provided (required) by operating activities of continuing operations $ 578.1 $ 155.4 $ (58.2)
Cash required by investing activities of continuing operations (200.8) (141.8) (0.7)
Cash provided (required) by financing activities (346.9) (136.8) 54.6
Cash provided by discontinued operations 4.8 47.0 37.3
Effect of exchange rate changes on cash and cash equivalents 14.8 2.8 (4.2)
Increase (decrease) in cash and cash equivalents $ 50.0 $ (73.4) $ 28.8
Operating Cash Flows
During the year ended December 31, 2007, we generated $578.1 million in cash flows from operating activities of continuing operations,which represented a $422.7 million increase compared to the prior year. Improvements in utilization of working capital generated themajority of the increase. Cash outflows for working capital in 2006 were approximately $160 million compared to a net cash inflow ofapproximately $190 million in 2007. Cash receipts for accounts receivable collection and advance payments on long-term projects, especiallyin the Energy Production segment during the second half of the year, drove the net cash inflow. Our working capital balances can varysignificantly quarter to quarter, depending on the payment terms and timing of delivery on key contracts. The increase in cash flows isalso attributable to higher earnings. Income from continuing operations, net of adjustments for non-cash items, was $444.6 million for2007, which was $63.7 million greater than the comparable figure for the prior year. Our cash flows from operating activities in 2006were $213.6 million higher than the prior year. The increase is primarily attributable to a $170.1 million increase in income from continuingoperations, net of adjustments for non-cash items.
Investing Cash Flows
Our cash requirements for investing activities of continuing operations in the year ended December 31, 2007, increased by $59.0 millioncompared to 2006. Capital expenditures increased by $64.4 million in 2007 primarily as a result of capacity expansion and light wellintervention projects in our Energy Systems businesses. Additionally, we spent $64.4 million on acquisitions during 2007, including the$59.7 million purchase of minority interest in CDS Engineering BV (“CDS”), compared to $9.5 million on acquisitions during 2006. Thehigher investments were partially offset by the increase in proceeds from asset disposals. In 2007, we received $66.1 million in proceedsfrom the sale of assets, including $58.1 million from the sale and leaseback of land and property in Houston, Texas.
Cash required by investing activities in 2006 was $141.8 million, primarily reflecting ongoing investment in new production facilitiesworldwide, primarily associated with increasing subsea and surface wellhead capacity. In 2005, our capital expenditures of $91.1 millionwere offset by $74.4 million in proceeds from the disposal of our investment in the common stock of MODEC, Inc.
MD
& A
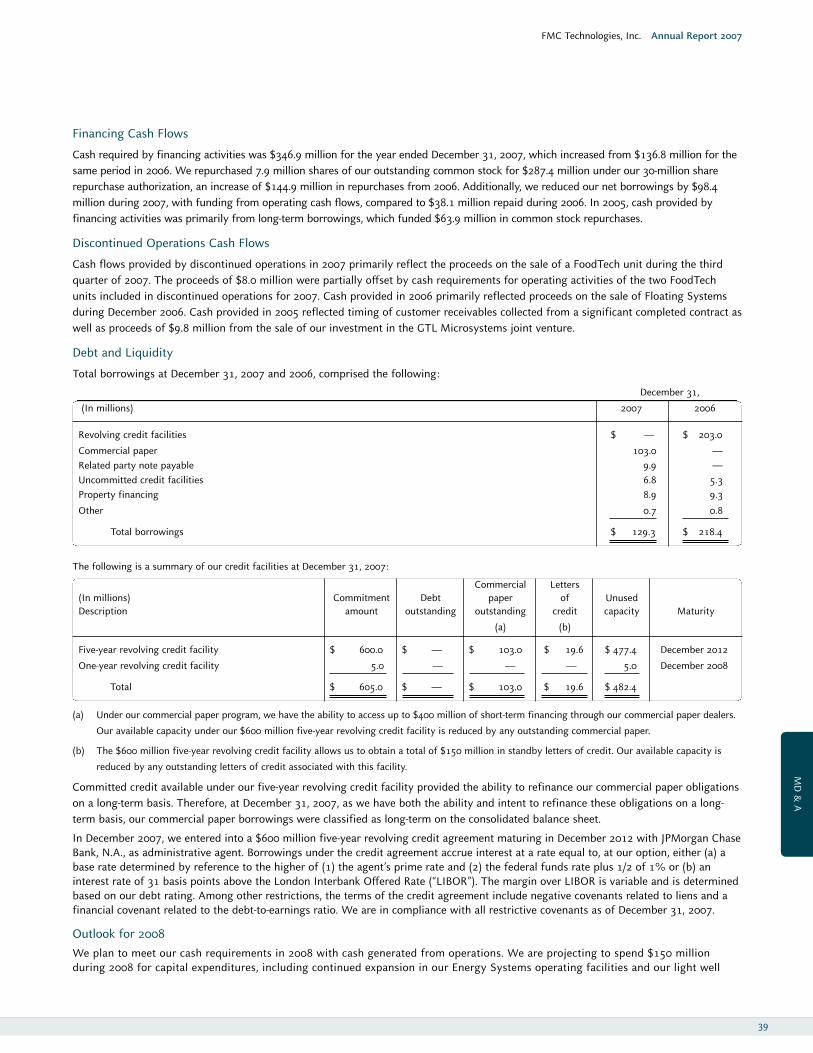
FMC Technologies, Inc. Annual Report 2007
39
Financing Cash Flows
Cash required by financing activities was $346.9 million for the year ended December 31, 2007, which increased from $136.8 million for thesame period in 2006. We repurchased 7.9 million shares of our outstanding common stock for $287.4 million under our 30-million sharerepurchase authorization, an increase of $144.9 million in repurchases from 2006. Additionally, we reduced our net borrowings by $98.4million during 2007, with funding from operating cash flows, compared to $38.1 million repaid during 2006. In 2005, cash provided byfinancing activities was primarily from long-term borrowings, which funded $63.9 million in common stock repurchases.
Discontinued Operations Cash Flows
Cash flows provided by discontinued operations in 2007 primarily reflect the proceeds on the sale of a FoodTech unit during the thirdquarter of 2007. The proceeds of $8.0 million were partially offset by cash requirements for operating activities of the two FoodTechunits included in discontinued operations for 2007. Cash provided in 2006 primarily reflected proceeds on the sale of Floating Systemsduring December 2006. Cash provided in 2005 reflected timing of customer receivables collected from a significant completed contract aswell as proceeds of $9.8 million from the sale of our investment in the GTL Microsystems joint venture.
Debt and Liquidity
Total borrowings at December 31, 2007 and 2006, comprised the following:
December 31,
(In millions) 2007 2006
Revolving credit facilities $ — $ 203.0
Commercial paper 103.0 — Related party note payable 9.9 — Uncommitted credit facilities 6.8 5.3Property financing 8.9 9.3
Other 0.7 0.8
Total borrowings $ 129.3 $ 218.4
The following is a summary of our credit facilities at December 31, 2007:
Commercial Letters (In millions) Commitment Debt paper of Unused Description amount outstanding outstanding credit capacity Maturity
(a) (b)
Five-year revolving credit facility $ 600.0 $ — $ 103.0 $ 19.6 $ 477.4 December 2012
One-year revolving credit facility 5.0 — — — 5.0 December 2008
Total $ 605.0 $ — $ 103.0 $ 19.6 $ 482.4
(a) Under our commercial paper program, we have the ability to access up to $400 million of short-term financing through our commercial paper dealers.
Our available capacity under our $600 million five-year revolving credit facility is reduced by any outstanding commercial paper.
(b) The $600 million five-year revolving credit facility allows us to obtain a total of $150 million in standby letters of credit. Our available capacity is
reduced by any outstanding letters of credit associated with this facility.
Committed credit available under our five-year revolving credit facility provided the ability to refinance our commercial paper obligationson a long-term basis. Therefore, at December 31, 2007, as we have both the ability and intent to refinance these obligations on a long-term basis, our commercial paper borrowings were classified as long-term on the consolidated balance sheet.
In December 2007, we entered into a $600 million five-year revolving credit agreement maturing in December 2012 with JPMorgan ChaseBank, N.A., as administrative agent. Borrowings under the credit agreement accrue interest at a rate equal to, at our option, either (a) abase rate determined by reference to the higher of (1) the agent’s prime rate and (2) the federal funds rate plus 1/2 of 1% or (b) aninterest rate of 31 basis points above the London Interbank Offered Rate (“LIBOR”). The margin over LIBOR is variable and is determinedbased on our debt rating. Among other restrictions, the terms of the credit agreement include negative covenants related to liens and afinancial covenant related to the debt-to-earnings ratio. We are in compliance with all restrictive covenants as of December 31, 2007.
Outlook for 2008 We plan to meet our cash requirements in 2008 with cash generated from operations. We are projecting to spend $150 millionduring 2008 for capital expenditures, including continued expansion in our Energy Systems operating facilities and our light well
MD
& A
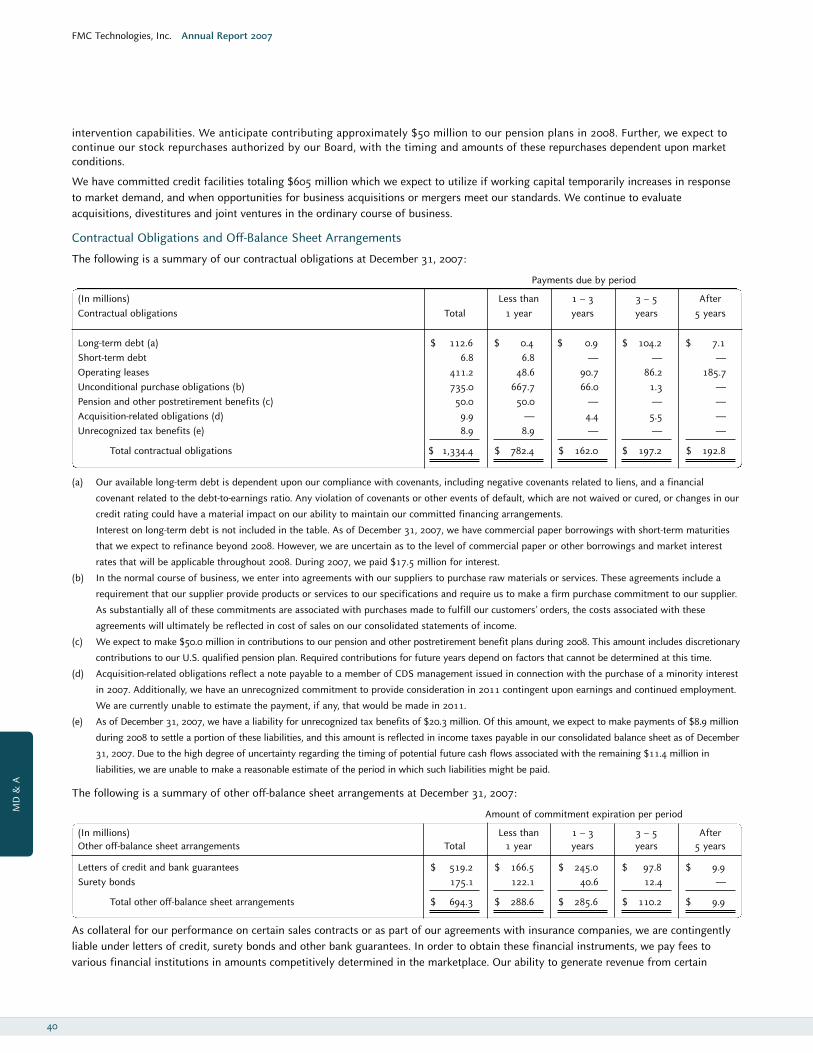
FMC Technologies, Inc. Annual Report 2007
40
intervention capabilities. We anticipate contributing approximately $50 million to our pension plans in 2008. Further, we expect tocontinue our stock repurchases authorized by our Board, with the timing and amounts of these repurchases dependent upon marketconditions.
We have committed credit facilities totaling $605 million which we expect to utilize if working capital temporarily increases in responseto market demand, and when opportunities for business acquisitions or mergers meet our standards. We continue to evaluateacquisitions, divestitures and joint ventures in the ordinary course of business.
Contractual Obligations and Off-Balance Sheet Arrangements
The following is a summary of our contractual obligations at December 31, 2007:
Payments due by period
(In millions) Less than 1 – 3 3 – 5 After Contractual obligations Total 1 year years years 5 years
Long-term debt (a) $ 112.6 $ 0.4 $ 0.9 $ 104.2 $ 7.1Short-term debt 6.8 6.8 — — — Operating leases 411.2 48.6 90.7 86.2 185.7Unconditional purchase obligations (b) 735.0 667.7 66.0 1.3 — Pension and other postretirement benefits (c) 50.0 50.0 — — — Acquisition-related obligations (d) 9.9 — 4.4 5.5 — Unrecognized tax benefits (e) 8.9 8.9 — — —
Total contractual obligations $ 1,334.4 $ 782.4 $ 162.0 $ 197.2 $ 192.8
(a) Our available long-term debt is dependent upon our compliance with covenants, including negative covenants related to liens, and a financial
covenant related to the debt-to-earnings ratio. Any violation of covenants or other events of default, which are not waived or cured, or changes in our
credit rating could have a material impact on our ability to maintain our committed financing arrangements.
Interest on long-term debt is not included in the table. As of December 31, 2007, we have commercial paper borrowings with short-term maturities
that we expect to refinance beyond 2008. However, we are uncertain as to the level of commercial paper or other borrowings and market interest
rates that will be applicable throughout 2008. During 2007, we paid $17.5 million for interest.
(b) In the normal course of business, we enter into agreements with our suppliers to purchase raw materials or services. These agreements include a
requirement that our supplier provide products or services to our specifications and require us to make a firm purchase commitment to our supplier.
As substantially all of these commitments are associated with purchases made to fulfill our customers’ orders, the costs associated with these
agreements will ultimately be reflected in cost of sales on our consolidated statements of income.
(c) We expect to make $50.0 million in contributions to our pension and other postretirement benefit plans during 2008. This amount includes discretionary
contributions to our U.S. qualified pension plan. Required contributions for future years depend on factors that cannot be determined at this time.
(d) Acquisition-related obligations reflect a note payable to a member of CDS management issued in connection with the purchase of a minority interest
in 2007. Additionally, we have an unrecognized commitment to provide consideration in 2011 contingent upon earnings and continued employment.
We are currently unable to estimate the payment, if any, that would be made in 2011.
(e) As of December 31, 2007, we have a liability for unrecognized tax benefits of $20.3 million. Of this amount, we expect to make payments of $8.9 million
during 2008 to settle a portion of these liabilities, and this amount is reflected in income taxes payable in our consolidated balance sheet as of December
31, 2007. Due to the high degree of uncertainty regarding the timing of potential future cash flows associated with the remaining $11.4 million in
liabilities, we are unable to make a reasonable estimate of the period in which such liabilities might be paid.
The following is a summary of other off-balance sheet arrangements at December 31, 2007:
Amount of commitment expiration per period
(In millions) Less than 1 – 3 3 – 5 After Other off-balance sheet arrangements Total 1 year years years 5 years
Letters of credit and bank guarantees $ 519.2 $ 166.5 $ 245.0 $ 97.8 $ 9.9Surety bonds 175.1 122.1 40.6 12.4 —
Total other off-balance sheet arrangements $ 694.3 $ 288.6 $ 285.6 $ 110.2 $ 9.9
As collateral for our performance on certain sales contracts or as part of our agreements with insurance companies, we are contingentlyliable under letters of credit, surety bonds and other bank guarantees. In order to obtain these financial instruments, we pay fees tovarious financial institutions in amounts competitively determined in the marketplace. Our ability to generate revenue from certain
MD
& A
FMC Technologies, Inc. Annual Report 2007
41
contracts is dependent upon our ability to obtain these off-balance sheet financial instruments. These off-balance sheet financialinstruments may be renewed, revised or released based on changes in the underlying commitment. Historically, our commercialcommitments have not been drawn upon to a material extent; consequently, management believes it is not likely that there will be claimsagainst these commitments that will have a negative impact on our key financial ratios or our ability to obtain financing.
Qualitative and Quantitative Disclosures about Market Risk
We are subject to financial market risks, including fluctuations in foreign currency exchange rates and interest rates. In order to manageand mitigate our exposure to these risks, we may use derivative financial instruments in accordance with established policies andprocedures. We do not use derivative financial instruments where the objective is to generate profits solely from trading activities. AtDecember 31, 2007 and 2006, our derivative holdings consisted of foreign currency forward contracts, foreign currency instrumentsembedded in purchase and sale contracts, and interest-rate swap agreements.
These forward-looking disclosures only address potential impacts from market risks as they affect our financial instruments. They do notinclude other potential effects which could impact our business as a result of changes in foreign currency exchange rates, interest rates,commodity prices or equity prices.
Foreign Currency Exchange Rate Risk
When we sell or purchase products or services, transactions are frequently denominated in currencies other than an operation’sfunctional currency. When foreign currency exposures exist, we may enter into foreign exchange forward instruments with thirdparties. Our hedging policy reduces, but does not entirely eliminate, the impact of foreign currency exchange rate movements. Weexpect any gains or losses in the hedging portfolio to be substantially offset by a corresponding gain or loss in the underlyingexposure being hedged.
We hedge our net recognized foreign currency assets and liabilities to reduce the risk that our earnings and cash flows will be adverselyaffected by fluctuations in foreign currency exchange rates. We also hedge firmly committed anticipated transactions in the normalcourse of business. The majority of these hedging instruments mature during 2008.
In certain circumstances, we enter into purchase and sales contracts which contain payment terms in foreign currencies. This may occur,for instance, to offset the cost of equipment or services payable in the same currency. Contractual payments required in a currency that isnot the functional or local currency of substantial parties to the contract are embedded derivatives.
We use a sensitivity analysis to measure the impact on derivative instrument fair values of an immediate 10% adverse movement in theforeign currency exchange rates. This calculation assumes that each exchange rate would change in the same direction relative to theU.S. dollar and all other variables are held constant. We expect that changes in the fair value of derivative instruments will offset thechanges in fair value of the underlying assets and liabilities on the balance sheet. To the extent that our derivative instruments arehedging anticipated transactions, a 10% decrease in the value of the hedged currency would result in a decrease of approximately $40 million in the net fair value of derivative financial instruments reflected on our balance sheet at December 31, 2007. Changes in thederivative fair value will not have an immediate impact on our results of operations unless these contracts are deemed to be ineffective.
Interest Rate Risk
Our debt instruments subject us to market risk associated with movements in interest rates. We had $103.0 million in variable-rate debtoutstanding at December 31, 2007, upon which interest expense is subject to the movement in LIBOR. A 10% adverse movement in theinterest rate, or 50 basis points, would result in an increase to interest expense of $0.5 million.
At December 31, 2007, we had three floating-to-fixed interest rate swaps which we used to hedge $150 million of variable-rate debt. Weterminated the swaps in January 2008 with no material impact on earnings.
We assess effectiveness of forward foreign currency contracts designated as cash flow hedges based on changes in fair value attributableto changes in spot rates. We exclude the impact attributable to changes in the difference between the spot rate and the forward rate forthe assessment of hedge effectiveness, and recognize the change in fair value of this component immediately in earnings. The differencebetween the spot rate and the forward rate is generally related to the differences in the interest rates of the countries of the currenciesbeing traded. Consequently, we have exposure to relative changes in interest rates between countries in our results of operations. To theextent the U.S. interest rate decreases by 10%, or 50 basis points, and other countries, interest rates remain fixed, we would expect torecognize a decrease of $2.6 million in earnings in the period of change. However, if the foreign currency forward contracts are held tomaturity, we can expect to recognize increased earnings of $2.6 million over the remaining lives of the contracts. Based on our portfolioas of December 31, 2007, we believe we have exposure to the interest rates in the U.S., Brazil, the United Kingdom, the EuropeanCommunity and Norway.
MD
& A
FMC Technologies, Inc. Annual Report 2007
42
Critical Accounting Estimates
We prepare our consolidated financial statements in conformity with United States generally accepted accounting principles. As such, weare required to make certain estimates, judgments and assumptions about matters that are inherently uncertain. On an ongoing basis, ourmanagement re-evaluates these estimates, judgments and assumptions for reasonableness because of the critical impact that these factorshave on the reported amounts of assets and liabilities at the dates of the financial statements and the reported amounts of revenues andexpenses during the periods presented. Management has discussed the development and selection of these critical accounting estimateswith the Audit Committee of our Board of Directors, and the Audit Committee has reviewed this disclosure. We believe that the followingare the critical accounting estimates used in preparing our financial statements.
Percentage of Completion Method of Accounting
We record revenue on construction-type manufacturing projects using the percentage of completion method, where revenue is recordedas work progresses on each contract. There are several acceptable methods of measuring progress toward completion. Most frequently,we use the ratio of costs incurred to date to total estimated contract costs at completion to measure this progress; however, there are alsotypes of contracts where we consistently apply the ratio of units delivered to date — or units of work performed — as a percentage oftotal units because we have determined that these methods provide a more accurate measure of progress toward completion.
We execute contracts with our customers that clearly describe the equipment, systems and/or services that we will provide and theamount of consideration we will receive. After analyzing the drawings and specifications of the contract requirements, our projectengineers estimate total contract costs based on their experience with similar projects and then adjust these estimates for specific risksassociated with each project, such as technical risks associated with a new design. Costs associated with specific risks are estimated byassessing the probability that conditions will arise that will affect our total cost to complete the project. After work on a project begins,assumptions that form the basis for our calculation of total project cost are examined on a monthly basis and our estimates are updatedto reflect new information as it becomes available.
Revenue recorded using the percentage of completion method amounted to $2,018.8 million, $1,665.9 million and $1,274.6 million forthe years ended December 31, 2007, 2006 and 2005, respectively.
A significant portion of our total revenue recorded under the percentage of completion method relates to the Energy Production Systemsbusiness segment, primarily for subsea petroleum exploration equipment projects that involve the design, engineering, manufacturingand assembly of complex, customer-specific systems. The systems are not entirely built from standard bills of material and typicallyrequire extended periods of time to design and construct.
Total estimated contract cost affects both the revenue recognized in a period as well as the reported profit or loss on a project. Thedetermination of profit or loss on a contract requires consideration of contract revenue, change orders and claims, less costs incurred todate and estimated costs to complete. Anticipated losses on contracts are recorded in full in the period in which they are identified.Profits are recorded based on the estimated project profit multiplied by the percentage complete.
The total estimated contract cost in percentage of completion accounting is a critical accounting estimate because it can materially affectrevenue and cost of sales, and it requires us to make judgments about matters that are uncertain. There are many factors, including butnot limited to resource price inflation, labor availability, productivity and weather that can affect the accuracy of our cost estimates andultimately our future profitability. In the past, we have realized both lower and higher than expected margins and have incurred losses asa result of unforeseen changes in our project costs.
The amount of revenue recognized using the percentage of completion method is sensitive to our changes in estimates of total contractcosts. If we had used a different estimate of total contract costs for each contract in progress at December 31, 2007, a 1% increase ordecrease in the estimated margin earned on each contract would have increased or decreased total revenue and pre-tax income for theyear ended December 31, 2007, by $20 million.
Inventory Valuation
Inventory is recorded at the lower of cost or net realizable value. In order to determine net realizable value, we evaluate each componentof inventory on a regular basis to determine whether it is excess or obsolete. We record the decline in the carrying value of estimatedexcess or obsolete inventory as a reduction of inventory and as an expense included in cost of sales in the period in which it is identified.Our estimate of excess and obsolete inventory is a critical accounting estimate because it is highly susceptible to change from period toperiod. In addition, it requires management to make judgments about the future demand for inventory.
In order to quantify excess or obsolete inventory, we begin by preparing a candidate listing of the components of inventory that have aquantity on hand in excess of usage within the most recent two-year period. This list is then reviewed with sales, engineering, production
MD
& A
FMC Technologies, Inc. Annual Report 2007
43
and materials management personnel to determine whether this list of potential excess or obsolete inventory items is accurate.Management considers as part of this evaluation whether there has been a change in the market for finished goods, whether there will befuture demand for on-hand inventory items and whether there are components of inventory that incorporate obsolete technology. As aresult, our estimate of excess or obsolete inventory is sensitive to changes in assumptions about future usage of the inventory.
Accounting for Income Taxes
In determining our current income tax provision, we assess temporary differences resulting from differing treatments of items for tax andaccounting purposes. These differences result in deferred tax assets and liabilities, which are recorded in our consolidated balance sheets.When we maintain deferred tax assets, we must assess the likelihood that these assets will be recovered through adjustments to futuretaxable income. To the extent we believe recovery is not likely, we establish a valuation allowance. We record an allowance reducing theasset to a value we believe will be recoverable based on our expectation of future taxable income. We believe the accounting estimaterelated to the valuation allowance is a critical accounting estimate because it is highly susceptible to change from period to period, as itrequires management to make assumptions about our future income over the lives of the deferred tax assets, and the impact ofincreasing or decreasing the valuation allowance is potentially material to our results of operations.
Forecasting future income requires us to use a significant amount of judgment. In estimating future income, we use our internaloperating budgets and long-range planning projections. We develop our budgets and long-range projections based on recent results,trends, economic and industry forecasts influencing our segments’ performance, our backlog, planned timing of new product launchesand customer sales commitments. Significant changes in the expected realizability of the deferred tax asset would require that we adjustthe valuation allowance applied against the gross value of our total deferred tax assets, resulting in a change to net income.
As of December 31, 2007, we estimated that it is not likely that we will generate future taxable income in certain foreign jurisdictions inwhich we have cumulative net operating losses, and, therefore, we have provided a valuation allowance against the related deferred taxassets. As of December 31, 2007, we estimated that it is more likely than not that we will have future taxable income in the United Statesto utilize our domestic deferred tax assets. Therefore, we have not provided a valuation allowance against any domestic deferred tax assets.
The need for a valuation allowance is sensitive to changes in our estimate of future taxable income. If our estimate of future taxable incomewas 15% lower than the estimate used, we would still generate sufficient taxable income to utilize such domestic deferred tax assets.
Retirement Benefits
We provide most of our employees with certain retirement (pension) and postretirement (health care and life insurance) benefits. Inorder to measure the expense and obligations associated with these retirement benefits, management must make a variety of estimates,including discount rates used to value certain liabilities, expected return on plan assets set aside to fund these costs, rate of compensationincrease, employee turnover rates, retirement rates, mortality rates and other factors. We update these estimates on an annual basis ormore frequently upon the occurrence of significant events. These accounting estimates bear the risk of change due to the uncertaintyassociated with the estimate as well as the fact that these estimates are difficult to measure. Different estimates used by managementcould result in our recognizing different amounts of expense over different periods of time.
We use third-party specialists to assist management in evaluating our assumptions as well as appropriately measuring the costs andobligations associated with these retirement benefits. The discount rate and expected return on plan assets are based primarily oninvestment yields available and the historical performance of our plan assets. They are critical accounting estimates because they aresubject to management’s judgment and can materially affect net income.
Pension expense was $34.5 million, $31.5 million and $23.7 million for the years ended December 31, 2007, 2006 and 2005, respectively.
The discount rate used affects the interest cost component of net periodic pension cost. The discount rate is based on rates at which thepension benefit obligation could effectively be settled on a present value basis. To determine the weighted average discount rate, wereview long-term, high quality corporate bonds at our determination date and use a model that matches the projected benefit paymentsfor our plans to coupons and maturities from high quality bonds. Significant changes in the discount rate, such as those caused bychanges in the yield curve, the mix of bonds available in the market, the duration of selected bonds and the timing of expected benefitpayments may result in volatility in pension expense and pension liabilities. We increased the discount rate for our domestic and certainof our international plans during 2006 and 2007. The weighted average discount rate used to compute net periodic benefit cost increasedfrom 5.5% to 5.6% in 2007.
Our pension expense is sensitive to changes in our estimate of discount rate. Holding other assumptions constant, for a 50-basis-pointreduction in the discount rate, annual pension expense would increase by approximately $7.7 million before taxes. Holding otherassumptions constant, for a 50-basis-point increase in the discount rate, annual pension expense would decrease by approximately$7.7 million before taxes.
MD
& A
FMC Technologies, Inc. Annual Report 2007
44
Net periodic pension cost includes an underlying expected long-term rate of asset return. Our estimate of the expected rate of returnon plan assets is based primarily on the historical performance of plan assets, current market conditions, our asset allocation andlong-term growth expectations. Our actual annualized returns on plan assets on trailing 5-year and trailing 10-year periods haveexceeded the 2007 estimated long-term rate of return of 8.5%. Our actual returns, after fees, on plan assets were 4.3% and 13.2% in2007 and 2006, respectively. The expected return on plan assets is recognized as part of the net periodic pension cost. The differencebetween the expected return and the actual return on plan assets is amortized over the expected remaining service life of employees,so there is a lag time between the market’s performance and its impact on plan results. Holding other assumptions constant, anincrease or decrease of 50 basis points in the expected rate of return on plan assets would decrease or increase annual pensionexpense by approximately $3.8 million before taxes.
Impact of Recently Issued Accounting Pronouncements
In September 2006, the Financial Accounting Standards Board (“FASB”) issued Statement of Financial Accounting Standards (“SFAS”)No. 157, “Fair Value Measurements,” which defines fair value, establishes a framework for measuring fair value in generally acceptedaccounting principles, and expands disclosures about fair value measurements. SFAS No. 157 is effective in fiscal years beginning afterNovember 15, 2007. Delayed application is permitted for nonfinancial assets and nonfinancial liabilities, except for items that arerecognized or disclosed at fair value in the financial statements on a recurring basis (at least annually), until fiscal years beginning afterNovember 15, 2008. We adopted SFAS No. 157 on January 1, 2008, for financial assets and financial liabilities and have chosen to delaythe adoption for nonfinancial assets and nonfinancial liabilities until January 1, 2009. We do not believe that the adoption of thispronouncement will have a material effect on our results of operations or financial position.
In February 2007, the FASB issued SFAS No. 159, “The Fair Value Option for Financial Assets and Financial Liabilities.” SFAS No. 159permits entities to choose to measure certain financial instruments and other items at fair value. Under SFAS No. 159, the decision tomeasure items at fair value is made at specified election dates on an irrevocable instrument-by-instrument basis. This statement iseffective for financial statements issued for fiscal years beginning after November 15, 2007. We do not expect to elect this option ofmeasurement on any of our financial instruments, and, therefore, we do not believe the adoption of SFAS No. 159 on January 1, 2008,will have a significant impact on our financial position, results of operations or cash flows.
In December 2007, the FASB issued SFAS No. 141 (revised 2007), “Business Combinations,” replacing SFAS No. 141. SFAS No. 141Rchanges or clarifies the acquisition method of accounting for acquired contingencies, transaction costs, step acquisitions, restructuringcosts and other major areas affecting how the acquirer recognizes and measures the assets acquired, the liabilities assumed and anynoncontrolling interest in the acquiree. In addition, this pronouncement amends previous interpretations of intangible asset accountingby requiring the capitalization of in-process research and development and proscribing impacts to current income tax expense (ratherthan a reduction to goodwill) for changes in deferred tax benefits related to a business combination. SFAS No. 141R will be appliedprospectively for business combinations occurring after December 31, 2008.
In December 2007, the FASB issued SFAS No. 160, “Non-controlling Interests in Consolidated Financial Statements, an amendment ofARB No. 51.” SFAS No. 160 will standardize the accounting for and reporting of minority interests in the financial statements, which willbe presented as noncontrolling interests and classified as a component of equity. In addition, statements of operations will reportconsolidated net income before an allocation to both the parent and the noncontrolling interest. This new presentation will have animpact on the basic financial statements as well as the disclosures to clearly identify and distinguish between the interests of the parentand the interests of the noncontrolling interests. SFAS No. 160 is effective for fiscal years beginning after December 15, 2008. We havenot yet determined the impact, if any, that the adoption of SFAS No. 160 will have on our results of operations or financial position.
MD
& A
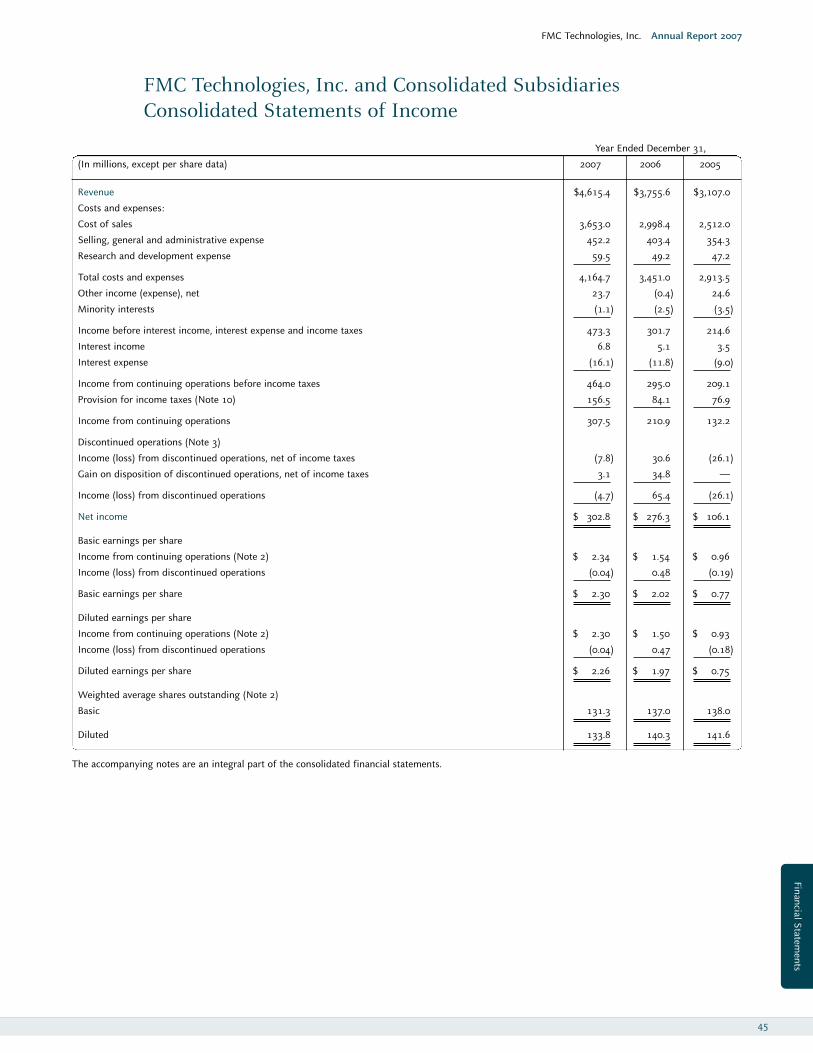
Year Ended December 31,
(In millions, except per share data) 2007 2006 2005
Revenue $4,615.4 $3,755.6 $3,107.0
Costs and expenses:
Cost of sales 3,653.0 2,998.4 2,512.0
Selling, general and administrative expense 452.2 403.4 354.3
Research and development expense 59.5 49.2 47.2
Total costs and expenses 4,164.7 3,451.0 2,913.5
Other income (expense), net 23.7 (0.4) 24.6
Minority interests (1.1) (2.5) (3.5)
Income before interest income, interest expense and income taxes 473.3 301.7 214.6
Interest income 6.8 5.1 3.5
Interest expense (16.1) (11.8) (9.0)
Income from continuing operations before income taxes 464.0 295.0 209.1
Provision for income taxes (Note 10) 156.5 84.1 76.9
Income from continuing operations 307.5 210.9 132.2
Discontinued operations (Note 3)
Income (loss) from discontinued operations, net of income taxes (7.8) 30.6 (26.1)
Gain on disposition of discontinued operations, net of income taxes 3.1 34.8 —
Income (loss) from discontinued operations (4.7) 65.4 (26.1)
Net income $ 302.8 $ 276.3 $ 106.1
Basic earnings per share
Income from continuing operations (Note 2) $ 2.34 $ 1.54 $ 0.96
Income (loss) from discontinued operations (0.04) 0.48 (0.19)
Basic earnings per share $ 2.30 $ 2.02 $ 0.77
Diluted earnings per share
Income from continuing operations (Note 2) $ 2.30 $ 1.50 $ 0.93
Income (loss) from discontinued operations (0.04) 0.47 (0.18)
Diluted earnings per share $ 2.26 $ 1.97 $ 0.75
Weighted average shares outstanding (Note 2)
Basic 131.3 137.0 138.0
Diluted 133.8 140.3 141.6
The accompanying notes are an integral part of the consolidated financial statements.
FMC Technologies, Inc. and Consolidated SubsidiariesConsolidated Statements of Income
FMC Technologies, Inc. Annual Report 2007
45
Financial Statements
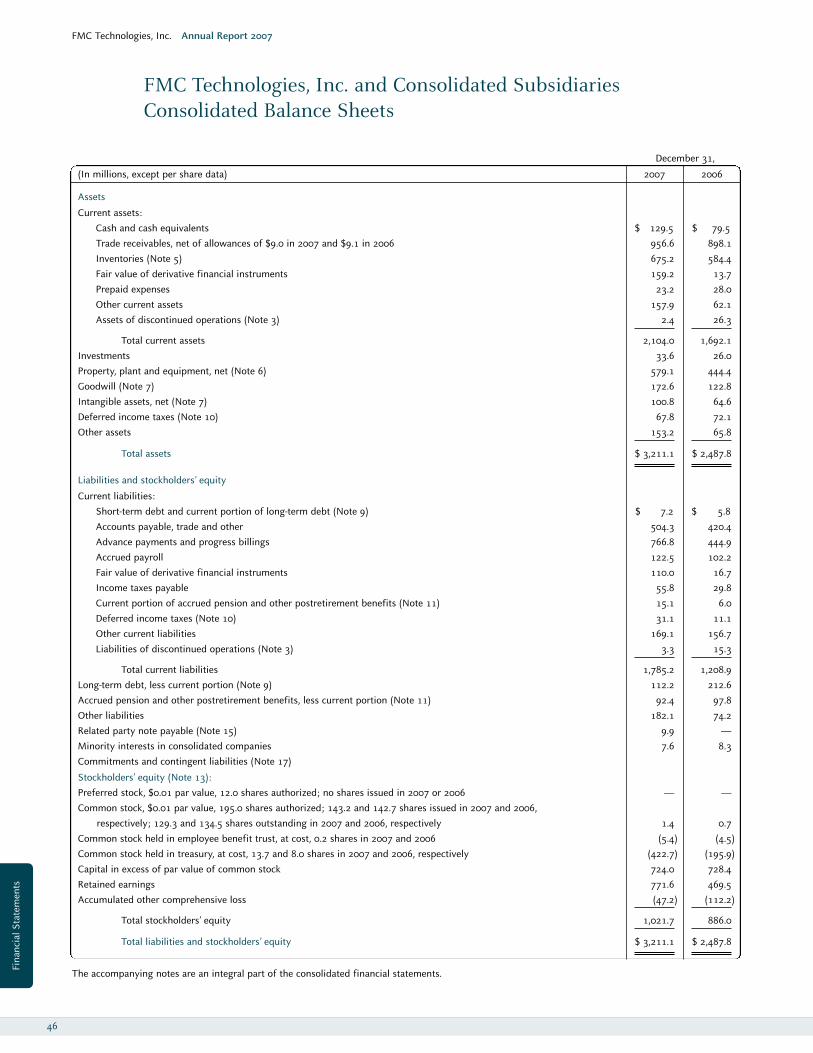
December 31,
(In millions, except per share data) 2007 2006
Assets
Current assets:Cash and cash equivalents $ 129.5 $ 79.5Trade receivables, net of allowances of $9.0 in 2007 and $9.1 in 2006 956.6 898.1Inventories (Note 5) 675.2 584.4Fair value of derivative financial instruments 159.2 13.7Prepaid expenses 23.2 28.0Other current assets 157.9 62.1Assets of discontinued operations (Note 3) 2.4 26.3
Total current assets 2,104.0 1,692.1Investments 33.6 26.0Property, plant and equipment, net (Note 6) 579.1 444.4Goodwill (Note 7) 172.6 122.8Intangible assets, net (Note 7) 100.8 64.6Deferred income taxes (Note 10) 67.8 72.1Other assets 153.2 65.8
Total assets $ 3,211.1 $ 2,487.8
Liabilities and stockholders’ equity
Current liabilities:Short-term debt and current portion of long-term debt (Note 9) $ 7.2 $ 5.8Accounts payable, trade and other 504.3 420.4Advance payments and progress billings 766.8 444.9Accrued payroll 122.5 102.2Fair value of derivative financial instruments 110.0 16.7Income taxes payable 55.8 29.8Current portion of accrued pension and other postretirement benefits (Note 11) 15.1 6.0Deferred income taxes (Note 10) 31.1 11.1Other current liabilities 169.1 156.7Liabilities of discontinued operations (Note 3) 3.3 15.3
Total current liabilities 1,785.2 1,208.9Long-term debt, less current portion (Note 9) 112.2 212.6Accrued pension and other postretirement benefits, less current portion (Note 11) 92.4 97.8Other liabilities 182.1 74.2Related party note payable (Note 15) 9.9 —Minority interests in consolidated companies 7.6 8.3Commitments and contingent liabilities (Note 17)
Stockholders’ equity (Note 13):Preferred stock, $0.01 par value, 12.0 shares authorized; no shares issued in 2007 or 2006 — —Common stock, $0.01 par value, 195.0 shares authorized; 143.2 and 142.7 shares issued in 2007 and 2006,
respectively; 129.3 and 134.5 shares outstanding in 2007 and 2006, respectively 1.4 0.7Common stock held in employee benefit trust, at cost, 0.2 shares in 2007 and 2006 (5.4) (4.5)Common stock held in treasury, at cost, 13.7 and 8.0 shares in 2007 and 2006, respectively (422.7) (195.9)Capital in excess of par value of common stock 724.0 728.4Retained earnings 771.6 469.5Accumulated other comprehensive loss (47.2) (112.2)
Total stockholders’ equity 1,021.7 886.0
Total liabilities and stockholders’ equity $ 3,211.1 $ 2,487.8
The accompanying notes are an integral part of the consolidated financial statements.
FMC Technologies, Inc. Annual Report 2007
46
FMC Technologies, Inc. and Consolidated Subsidiaries Consolidated Balance Sheets
Fina
ncia
l Sta
tem
ents
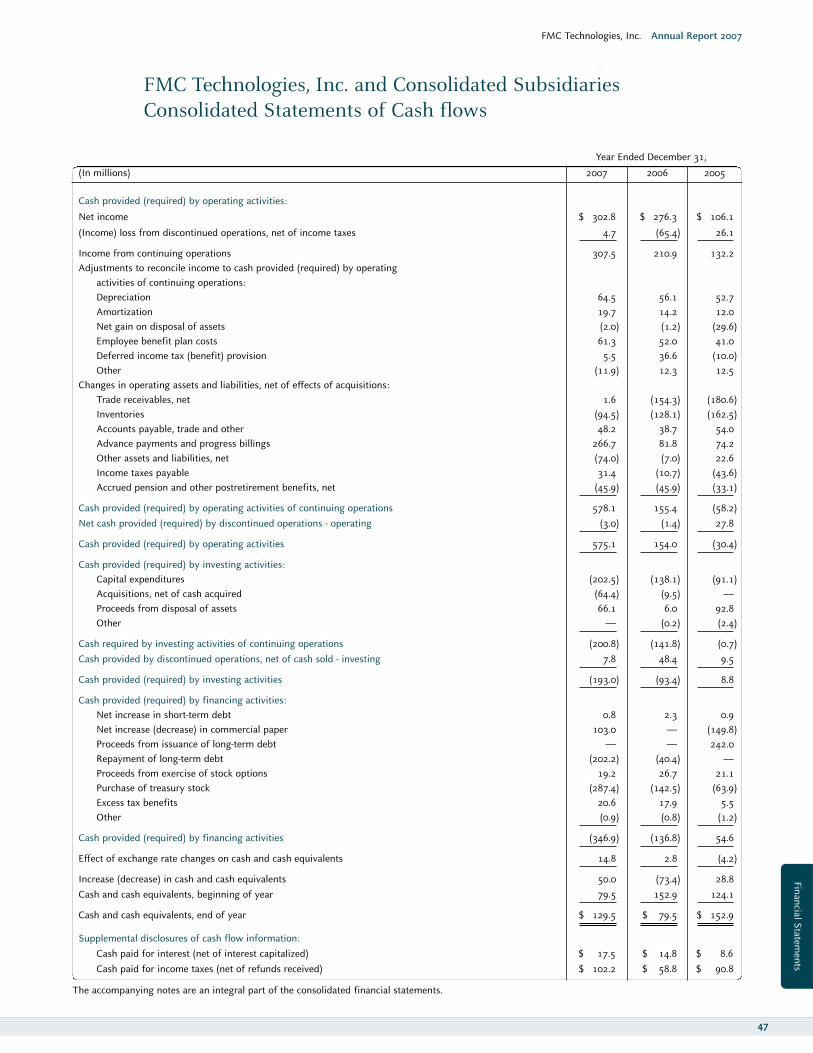
Year Ended December 31,
(In millions) 2007 2006 2005
Cash provided (required) by operating activities:
Net income $ 302.8 $ 276.3 $ 106.1
(Income) loss from discontinued operations, net of income taxes 4.7 (65.4) 26.1
Income from continuing operations 307.5 210.9 132.2Adjustments to reconcile income to cash provided (required) by operating
activities of continuing operations:Depreciation 64.5 56.1 52.7Amortization 19.7 14.2 12.0Net gain on disposal of assets (2.0) (1.2) (29.6)Employee benefit plan costs 61.3 52.0 41.0Deferred income tax (benefit) provision 5.5 36.6 (10.0)Other (11.9) 12.3 12.5
Changes in operating assets and liabilities, net of effects of acquisitions:Trade receivables, net 1.6 (154.3) (180.6)Inventories (94.5) (128.1) (162.5)Accounts payable, trade and other 48.2 38.7 54.0Advance payments and progress billings 266.7 81.8 74.2Other assets and liabilities, net (74.0) (7.0) 22.6Income taxes payable 31.4 (10.7) (43.6)Accrued pension and other postretirement benefits, net (45.9) (45.9) (33.1)
Cash provided (required) by operating activities of continuing operations 578.1 155.4 (58.2)Net cash provided (required) by discontinued operations - operating (3.0) (1.4) 27.8
Cash provided (required) by operating activities 575.1 154.0 (30.4)
Cash provided (required) by investing activities:Capital expenditures (202.5) (138.1) (91.1)Acquisitions, net of cash acquired (64.4) (9.5) —Proceeds from disposal of assets 66.1 6.0 92.8Other — (0.2) (2.4)
Cash required by investing activities of continuing operations (200.8) (141.8) (0.7)Cash provided by discontinued operations, net of cash sold - investing 7.8 48.4 9.5
Cash provided (required) by investing activities (193.0) (93.4) 8.8
Cash provided (required) by financing activities:Net increase in short-term debt 0.8 2.3 0.9Net increase (decrease) in commercial paper 103.0 — (149.8)Proceeds from issuance of long-term debt — — 242.0Repayment of long-term debt (202.2) (40.4) —Proceeds from exercise of stock options 19.2 26.7 21.1Purchase of treasury stock (287.4) (142.5) (63.9)Excess tax benefits 20.6 17.9 5.5Other (0.9) (0.8) (1.2)
Cash provided (required) by financing activities (346.9) (136.8) 54.6
Effect of exchange rate changes on cash and cash equivalents 14.8 2.8 (4.2)
Increase (decrease) in cash and cash equivalents 50.0 (73.4) 28.8Cash and cash equivalents, beginning of year 79.5 152.9 124.1
Cash and cash equivalents, end of year $ 129.5 $ 79.5 $ 152.9
Supplemental disclosures of cash flow information:Cash paid for interest (net of interest capitalized) $ 17.5 $ 14.8 $ 8.6Cash paid for income taxes (net of refunds received) $ 102.2 $ 58.8 $ 90.8
The accompanying notes are an integral part of the consolidated financial statements.
FMC Technologies, Inc. Annual Report 2007
47
FMC Technologies, Inc. and Consolidated Subsidiaries Consolidated Statements of Cash flows
47
Financial Statements
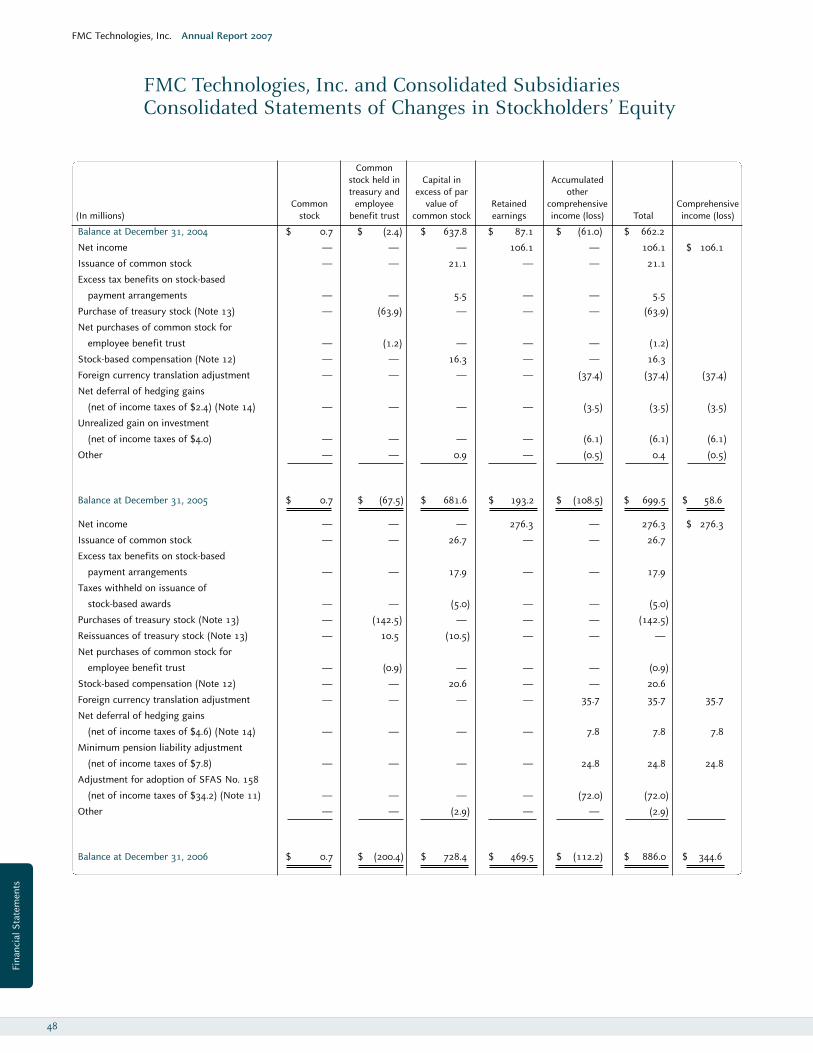
FMC Technologies, Inc. Annual Report 2007
Commonstock held in Capital in Accumulatedtreasury and excess of par other
Common employee value of Retained comprehensive Comprehensive(In millions) stock benefit trust common stock earnings income (loss) Total income (loss)
Balance at December 31, 2004 $ 0.7 $ (2.4) $ 637.8 $ 87.1 $ (61.0) $ 662.2
Net income — — — 106.1 — 106.1 $ 106.1
Issuance of common stock — — 21.1 — — 21.1
Excess tax benefits on stock-based
payment arrangements — — 5.5 — — 5.5
Purchase of treasury stock (Note 13) — (63.9) — — — (63.9)
Net purchases of common stock for
employee benefit trust — (1.2) — — — (1.2)
Stock-based compensation (Note 12) — — 16.3 — — 16.3
Foreign currency translation adjustment — — — — (37.4) (37.4) (37.4)
Net deferral of hedging gains
(net of income taxes of $2.4) (Note 14) — — — — (3.5) (3.5) (3.5)
Unrealized gain on investment
(net of income taxes of $4.0) — — — — (6.1) (6.1) (6.1)
Other — — 0.9 — (0.5) 0.4 (0.5)
Balance at December 31, 2005 $ 0.7 $ (67.5) $ 681.6 $ 193.2 $ (108.5) $ 699.5 $ 58.6
Net income — — — 276.3 — 276.3 $ 276.3
Issuance of common stock — — 26.7 — — 26.7
Excess tax benefits on stock-based
payment arrangements — — 17.9 — — 17.9
Taxes withheld on issuance of
stock-based awards — — (5.0) — — (5.0)
Purchases of treasury stock (Note 13) — (142.5) — — — (142.5)
Reissuances of treasury stock (Note 13) — 10.5 (10.5) — — —
Net purchases of common stock for
employee benefit trust — (0.9) — — — (0.9)
Stock-based compensation (Note 12) — — 20.6 — — 20.6
Foreign currency translation adjustment — — — — 35.7 35.7 35.7
Net deferral of hedging gains
(net of income taxes of $4.6) (Note 14) — — — — 7.8 7.8 7.8
Minimum pension liability adjustment
(net of income taxes of $7.8) — — — — 24.8 24.8 24.8
Adjustment for adoption of SFAS No. 158
(net of income taxes of $34.2) (Note 11) — — — — (72.0) (72.0)
Other — — (2.9) — — (2.9)
Balance at December 31, 2006 $ 0.7 $ (200.4) $ 728.4 $ 469.5 $ (112.2) $ 886.0 $ 344.6
48
FMC Technologies, Inc. and Consolidated Subsidiaries Consolidated Statements of Changes in Stockholders’ Equity
Fina
ncia
l Sta
tem
ents
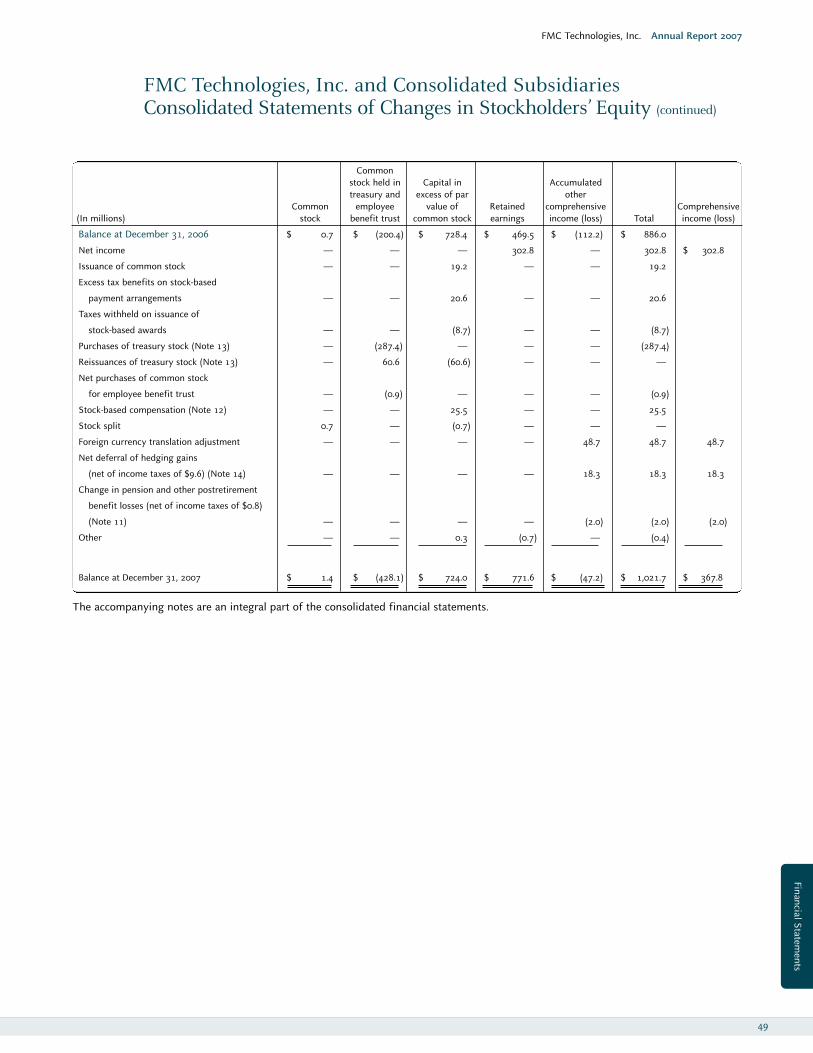
Commonstock held in Capital in Accumulatedtreasury and excess of par other
Common employee value of Retained comprehensive Comprehensive(In millions) stock benefit trust common stock earnings income (loss) Total income (loss)
Balance at December 31, 2006 $ 0.7 $ (200.4) $ 728.4 $ 469.5 $ (112.2) $ 886.0
Net income — — — 302.8 — 302.8 $ 302.8
Issuance of common stock — — 19.2 — — 19.2
Excess tax benefits on stock-based
payment arrangements — — 20.6 — — 20.6
Taxes withheld on issuance of
stock-based awards — — (8.7) — — (8.7)
Purchases of treasury stock (Note 13) — (287.4) — — — (287.4)
Reissuances of treasury stock (Note 13) — 60.6 (60.6) — — —
Net purchases of common stock
for employee benefit trust — (0.9) — — — (0.9)
Stock-based compensation (Note 12) — — 25.5 — — 25.5
Stock split 0.7 — (0.7) — — —
Foreign currency translation adjustment — — — — 48.7 48.7 48.7
Net deferral of hedging gains
(net of income taxes of $9.6) (Note 14) — — — — 18.3 18.3 18.3
Change in pension and other postretirement
benefit losses (net of income taxes of $0.8)
(Note 11) — — — — (2.0) (2.0) (2.0)
Other — — 0.3 (0.7) — (0.4)
Balance at December 31, 2007 $ 1.4 $ (428.1) $ 724.0 $ 771.6 $ (47.2) $ 1,021.7 $ 367.8
The accompanying notes are an integral part of the consolidated financial statements.
FMC Technologies, Inc. Annual Report 2007
FMC Technologies, Inc. and Consolidated Subsidiaries Consolidated Statements of Changes in Stockholders’ Equity (continued)
49
Financial Statements
FMC Technologies, Inc. Annual Report 2007
NOTE 1. BASIS OF PRESENTATION AND SUMMARY OF SIGNIFICANT ACCOUNTING POLICIES
Basis of presentation — FMC Technologies, Inc. and consolidated subsidiaries (“FMC Technologies” or “we”) designs, manufactures andservices sophisticated machinery and systems for our customers through our business segments: Energy Systems (comprising EnergyProduction Systems and Energy Processing Systems), FoodTech and Airport Systems. Our consolidated financial statements have beenprepared in United States dollars and in accordance with United States generally accepted accounting principles (“GAAP”).
On July 18, 2007, we announced that our Board of Directors approved a two-for-one stock split in the form of a stock dividend payable onAugust 31, 2007, to shareholders of record as of August 17, 2007. At August 31, 2007, an adjustment was made to reclassify an amountfrom capital in excess of par value to common stock to account for the par value of the common stock issued as a stock dividend. Thisadjustment had no overall effect on equity. We have revised the historical common share and per common share information in thisreport to reflect the effects of the stock split.
On October 29, 2007, we announced our intention to separate into two independent publicly traded companies through the spin-off anddistribution of 100% of our FoodTech and Airport Systems businesses to our shareholders. The transaction, expected to be tax-free toshareholders, is expected to enable the two public companies to better focus on their distinct customer bases, business strategies andoperational needs. Consummation of the proposed separation is subject to certain conditions, including final receipt of a ruling from theInternal Revenue Service (IRS) with respect to the tax-free status of the spin-off, the absence of any material changes or developmentsand the effectiveness of registration statements with the Securities and Exchange Commission. The separation, expected to occur inmid-2008, will not require a vote by FMC Technologies shareholders.
Use of estimates—The preparation of financial statements in conformity with GAAP requires management to make estimates andassumptions that affect the reported amounts of assets and liabilities and disclosures of contingent assets and liabilities at the date of thefinancial statements and the reported amounts of revenue and expenses during the reporting period. Actual results could differ fromthose estimates. We base our estimates on historical experience and on other assumptions that we believe to be relevant under thecircumstances. In particular, judgment is used in areas such as revenue recognition using the percentage of completion method ofaccounting, making estimates associated with the valuation of inventory and income tax assets, and accounting for retirement benefitsand contingencies.
Principles of consolidation—The consolidated financial statements include the accounts of FMC Technologies and its majority-ownedsubsidiaries and affiliates. Intercompany accounts and transactions are eliminated in consolidation.
Reclassifications—Certain prior-year amounts have been reclassified to conform to the current year’s presentation. We reclassified netforeign exchange losses of $1.6 million and $5.0 million for the years ended December 31, 2006 and 2005, respectively, from cost of salesto other income (expense), net on the consolidated statements of income. In the consolidated statements of cash flows, we reclassified$7.4 million and ($3.0) million from advance payments and progress billings to other assets and liabilities, net within operating activitiesfor the years ended December 31, 2006 and 2005, respectively. This reclassification had no impact on total cash flows from operatingactivities for any of the periods presented.
Revenue recognition—Revenue from equipment sales is recognized either upon transfer of title to the customer (which is uponshipment or when customer-specific acceptance requirements are met) or under the percentage of completion method. Servicerevenue is recognized as the service is provided. For multiple-element revenue arrangements, such as the sale of equipment with aservice agreement, we allocate the contract value to the various elements based on objective evidence of fair value for eachelement and recognize revenue consistent with the nature of each deliverable. We record our sales net of any value added, sales oruse tax.
The percentage of completion method of accounting is used for construction-type manufacturing and assembly projects that involvesignificant design and engineering effort in order to satisfy detailed customer-supplied specifications. Under the percentage ofcompletion method, revenue is recognized as work progresses on each contract. We primarily apply the ratio of costs incurred todate to total estimated contract costs at completion to measure this ratio; however, there are certain types of contracts where weconsistently apply the ratio of units delivered to date — or units of work performed — as a percentage of total units, because it hasbeen determined that these methods provide a more accurate measure of progress toward completion. If it is not possible to form areliable estimate of progress toward completion, no revenues or costs are recognized until the project is complete or substantiallycomplete. Any expected losses on construction-type contracts in progress are charged to earnings, in total, in the period the lossesare identified.
50
FMC Technologies, Inc. and Consolidated Subsidiaries Notes to Consolidated Financial Statements
Fina
ncia
l Sta
tem
ents
FMC Technologies, Inc. Annual Report 2007
Modifications to construction-type contracts, referred to as “change orders,” effectively change the provisions of the original contract,and may, for example, alter the specifications or design, method or manner of performance, equipment, materials, sites and/orperiod for completion of the work. If a change order represents a firm price commitment from a customer, we account for therevised estimate as if it had been included in the original estimate, effectively recognizing the pro rata impact of the new estimateon our calculation of progress toward completion in the period in which the firm commitment is received. If a change order isunpriced: (1) we include the costs of contract performance in our calculation of progress toward completion in the period in whichthe costs are incurred or become probable; and (2) when it is determined that the revenue is probable of recovery, we include thechange order revenue, limited to the costs incurred to date related to the change order, in our calculation of progress towardcompletion. Margin is not recorded on unpriced change orders unless realization is assured beyond a reasonable doubt. Theassessment of realization may be based upon our previous experience with the customer or based upon our receiving a firm pricecommitment from the customer.
Progress billings generally are issued contingent on completion of certain phases of the work as stipulated in the contract. Revenue inexcess of progress billings on contracts accounted for under the percentage of completion method amounted to $194.5 million and$210.9 million at December 31, 2007 and 2006, respectively. These unbilled receivables are reported in trade receivables on theconsolidated balance sheets. Progress billings and cash collections in excess of revenue recognized on a contract are classified as advancepayments and progress billings within current liabilities on the consolidated balance sheets.
Cash equivalents—We consider investments in all highly liquid debt instruments with original maturities of three months or less to becash equivalents.
Trade receivables—We provide an allowance for doubtful accounts on trade receivables equal to the estimated uncollectible amounts.This estimate is based on historical collection experience and a specific review of each customer’s trade receivable balance.
Inventories—Inventories are stated at the lower of cost or net realizable value. Inventory costs include those costs directly attributable toproducts, including all manufacturing overhead but excluding costs to distribute. Cost is determined on the last-in, first-out (“LIFO”) basisfor all domestic inventories, except certain inventories relating to construction-type contracts, which are stated at the actual productioncost incurred to date, reduced by the portion of these costs identified with revenue recognized. The first-in, first-out (“FIFO”) method isused to determine the cost for all other inventories.
Impairment of long-lived and intangible assets—Long-lived assets, including property, plant and equipment; identifiable intangible assetsbeing amortized; and capitalized software costs are reviewed for impairment whenever events or changes in circumstances indicate thatthe carrying amount of the long-lived asset may not be recoverable. The carrying amount of a long-lived asset is not recoverable if itexceeds the sum of the undiscounted cash flows expected to result from the use and eventual disposition of the asset. If it is determinedthat an impairment loss has occurred, the loss is measured as the amount by which the carrying amount of the long-lived asset exceedsits fair value.
Long-lived assets held for sale are reported at the lower of carrying value or fair value less cost to sell.
Property, plant, and equipment—Property, plant, and equipment is recorded at cost. Depreciation for financial reporting purposes isprovided principally on the straight-line basis over the estimated useful lives of the assets (land improvements — 20 to 35 years,buildings — 20 to 50 years, and machinery and equipment — 3 to 20 years). Gains and losses are reflected in income upon the sale orretirement of assets. Expenditures that extend the useful lives of property, plant and equipment are capitalized and depreciated over theestimated new remaining life of the asset.
Capitalized software costs—Other assets include the capitalized cost of internal-use software (including Internet Web sites). The assetsare stated at cost less accumulated amortization and totaled $24.3 million and $22.0 million at December 31, 2007 and 2006, respectively.These software costs include significant purchases of software and internal and external costs incurred during the applicationdevelopment stage of software projects. These costs are amortized on a straight-line basis over the estimated useful lives of the assets.For internal use software, the useful lives range from three to ten years. For Internet Web site costs, the estimated useful lives do notexceed three years.
Goodwill and other intangible assets—Goodwill is not subject to amortization but is tested for impairment on an annual basis (or morefrequently if impairment indicators arise) under the provisions of Statement of Financial Accounting Standards (“SFAS”) No. 142, “Goodwilland Other Intangible Assets.” We have established October 31 as the date of our annual test for impairment of goodwill. Impairment losses
51
Financial Statements
FMC Technologies, Inc. Annual Report 2007
are calculated at the reporting unit level and represent the excess of the carrying value of reporting unit goodwill over its implied fair value.The implied fair value of goodwill is determined by a two-step process. The first compares the fair value of the reporting unit (measured asthe present value of expected future cash flows) to its carrying amount. If the fair value of the reporting unit is less than its carryingamount, a second step is performed. In this step, the fair value of the reporting unit is allocated to its assets and liabilities to determine theimplied fair value of goodwill, which is used to measure the impairment loss. We have not recognized any impairment for the years endedDecember 31, 2007 or 2006, as the fair values of our reporting units with goodwill balances exceed our carrying amounts.
Our acquired intangible assets are being amortized on a straight-line basis over their estimated useful lives, which generally range from7 to 40 years. None of our acquired intangible assets have indefinite lives.
Reserve for discontinued operations—This reserve reflects liabilities of our disposed businesses. The balance includes reserves related topersonal injury and product liability claims associated with our discontinued operations as well as other unpaid employee-related andtransaction costs resulting from the disposals. Personal injury and product liability claims reserves are recorded based on an actuariallydetermined estimate of liabilities for both reported claims and incurred but unreported claims. Adjustments to the reserve fordiscontinued operations are included in results of discontinued operations in the consolidated statements of income. The reserve fordiscontinued operations, which is recorded in other long-term liabilities in the consolidated balance sheets, amounted to $2.2 million and$4.3 million at December 31, 2007 and 2006, respectively.
Income taxes—Current income taxes are provided on income reported for financial statement purposes, adjusted for transactions that donot enter into the computation of income taxes payable in the same year. Deferred tax assets and liabilities are measured using enactedtax rates for the expected future tax consequences of temporary differences between the carrying amounts and the tax bases of assetsand liabilities. A valuation allowance is established whenever management believes that it is more likely than not that deferred tax assetsmay not be realizable.
Income taxes are not provided on our equity in undistributed earnings of foreign subsidiaries or affiliates when it is management’sintention that such earnings will remain invested in those companies. Taxes are provided on such earnings in the year in which thedecision is made to repatriate the earnings.
Stock-based employee compensation—Prior to October 1, 2005, we applied the fair value recognition provisions of SFAS No. 123,“Accounting for Stock-Based Compensation.” We measure compensation cost on restricted stock awards based on the market price at thegrant date and the number of shares awarded. The compensation cost for each award is recognized ratably over the applicable serviceperiod, after taking into account estimated forfeitures. On October 1, 2005, we adopted the provisions of SFAS No. 123R, “Share-BasedPayment,” which modified our recognition of stock-based compensation by (i) incorporating an estimate of forfeitures in the calculationof current expense to record and (ii) adjusting the recognition period for new awards that accelerate vesting upon retirement to reflectthe lesser of the stated vesting period or the period until the employee becomes retirement eligible.
Common stock held in employee benefit trust—Shares of our common stock are purchased by the plan administrator of the FMCTechnologies, Inc. Non-Qualified Savings and Investment Plan and placed in a trust owned by us. Purchased shares are recorded at costand classified as a reduction of stockholders’ equity in the consolidated balance sheets.
Earnings per common share (“EPS”)—Basic EPS is computed using the weighted-average number of common shares outstanding. DilutedEPS gives effect to the potential dilution of earnings which could have occurred if additional shares were issued for stock option exercisesand restricted stock under the treasury stock method. The treasury stock method assumes that proceeds that would be obtained uponexercise of common stock options and issuance of restricted stock are used to buy back outstanding common stock at the average marketprice during the period.
Foreign currency—Financial statements of operations for which the U.S. dollar is not the functional currency, and are located in non-highlyinflationary countries, are translated to the U.S. dollar prior to consolidation. Assets and liabilities are translated at the exchange rate ineffect at the balance sheet date, while income statement accounts are translated at the average exchange rate for each period. For theseoperations, translation gains and losses are recorded as a component of accumulated other comprehensive income (loss) in stockholders’equity until the foreign entity is sold or liquidated. For operations in highly inflationary countries and where the local currency is not thefunctional currency, inventories, property, plant and equipment, and other non-current assets are converted to U.S. dollars at historicalexchange rates, and all gains or losses from conversion are included in net income. Foreign currency effects on cash, cash equivalents, anddebt in hyperinflationary economies are included in interest income or expense.
52
Fina
ncia
l Sta
tem
ents
FMC Technologies, Inc. Annual Report 2007
Derivative financial instruments—Derivatives are recognized in the consolidated balance sheets at fair value, with classification as currentor non-current based upon the maturity of the derivative instrument. Changes in the fair value of derivative instruments are recorded incurrent earnings or deferred in accumulated other comprehensive income (loss), depending on the type of hedging transaction andwhether a derivative is designated as, and is effective as, a hedge.
Hedge accounting is only applied when the derivative is deemed to be highly effective at offsetting changes in anticipated cash flowsof the hedged item or transaction. Changes in fair value of derivatives that are designated as cash flow hedges are deferred inaccumulated other comprehensive income (loss) until the underlying transactions are recognized in earnings. At such time, relateddeferred hedging gains or losses are also recorded in operating earnings on the same line as the hedged item. Effectiveness isassessed at the inception of the hedge and on a quarterly basis. Effectiveness of forward contract cash flow hedges is assessed basedsolely on changes in fair value attributable to the change in the spot rate. The change in the fair value of the contract related to thechange in forward rates is excluded from the assessment of hedge effectiveness. Changes in this excluded component of the derivativeinstrument, along with any ineffectiveness identified, are recorded in operating earnings as incurred. We document our riskmanagement strategy and hedge effectiveness at the inception of and during the term of each hedge. We also use forward contractsto hedge foreign currency assets and liabilities. These contracts are not designated as hedges; therefore, the changes in fair value ofthese contracts are recognized in other income (expense), net as they occur and offset gains or losses on the remeasurement of therelated asset or liability.
Cash flows from derivative contracts are reported in the consolidated statements of cash flows in the same categories as the cash flowsfrom the underlying transactions.
Recently issued accounting pronouncements—In September 2006, the Financial Accounting Standards Board (“FASB”) issued SFASNo. 157, “Fair Value Measurements,” which defines fair value, establishes a framework for measuring fair value in generally acceptedaccounting principles and expands disclosures about fair value measurements. SFAS No. 157 is effective in fiscal years beginning afterNovember 15, 2007. Delayed application is permitted for nonfinancial assets and nonfinancial liabilities, except for items that arerecognized or disclosed at fair value in the financial statements on a recurring basis (at least annually), until fiscal years beginningafter November 15, 2008. We adopted SFAS No. 157 on January 1, 2008, for financial assets and financial liabilities and have chosento delay the adoption for nonfinancial assets and nonfinancial liabilities until January 1, 2009. We do not believe that the adoption ofthis pronouncement will have a material effect on our results of operations or financial position.
In February 2007, the FASB issued SFAS No. 159, “The Fair Value Option for Financial Assets and Financial Liabilities.” SFAS No. 159permits entities to choose to measure certain financial instruments and other items at fair value. Under SFAS No. 159, the decision tomeasure items at fair value is made at specified election dates on an irrevocable instrument-by-instrument basis. This statement iseffective for financial statements issued for fiscal years beginning after November 15, 2007. We do not expect to elect this option ofmeasurement on any of our financial instruments, and, therefore, we do not believe the adoption of SFAS No. 159 on January 1, 2008,will have a significant impact on our financial position, results of operations or cash flows.
In December 2007, the FASB issued SFAS No. 141 (revised 2007), “Business Combinations,” replacing SFAS No. 141. SFAS No. 141Rchanges or clarifies the acquisition method of accounting for acquired contingencies, transaction costs, step acquisitions, restructuringcosts and other major areas affecting how the acquirer recognizes and measures the assets acquired, the liabilities assumed and anynoncontrolling interest in the acquiree. In addition, this pronouncement amends previous interpretations of intangible asset accountingby requiring the capitalization of in-process research and development and proscribing impacts to current income tax expense (ratherthan a reduction to goodwill) for changes in deferred tax benefits related to a business combination. SFAS No. 141R will be appliedprospectively for business combinations occurring after December 31, 2008.
In December 2007, the FASB issued SFAS No. 160, “Noncontrolling Interests in Consolidated Financial Statements, an amendment ofARB No. 51.” SFAS No. 160 will standardize the accounting for and reporting of minority interests in the financial statements, whichwill be presented as noncontrolling interests and classified as a component of equity. In addition, statements of operations will reportconsolidated net income before an allocation to both the parent and the noncontrolling interest. This new presentation will have animpact on the basic financial statements as well as the disclosures to clearly identify and distinguish between the interests of the parentand the interests of the noncontrolling interests. SFAS No. 160 is effective for fiscal years beginning after December 15, 2008. We havenot yet determined the impact, if any, that the adoption of SFAS No. 160 will have on our results of operations or financial position.
53
Financial Statements
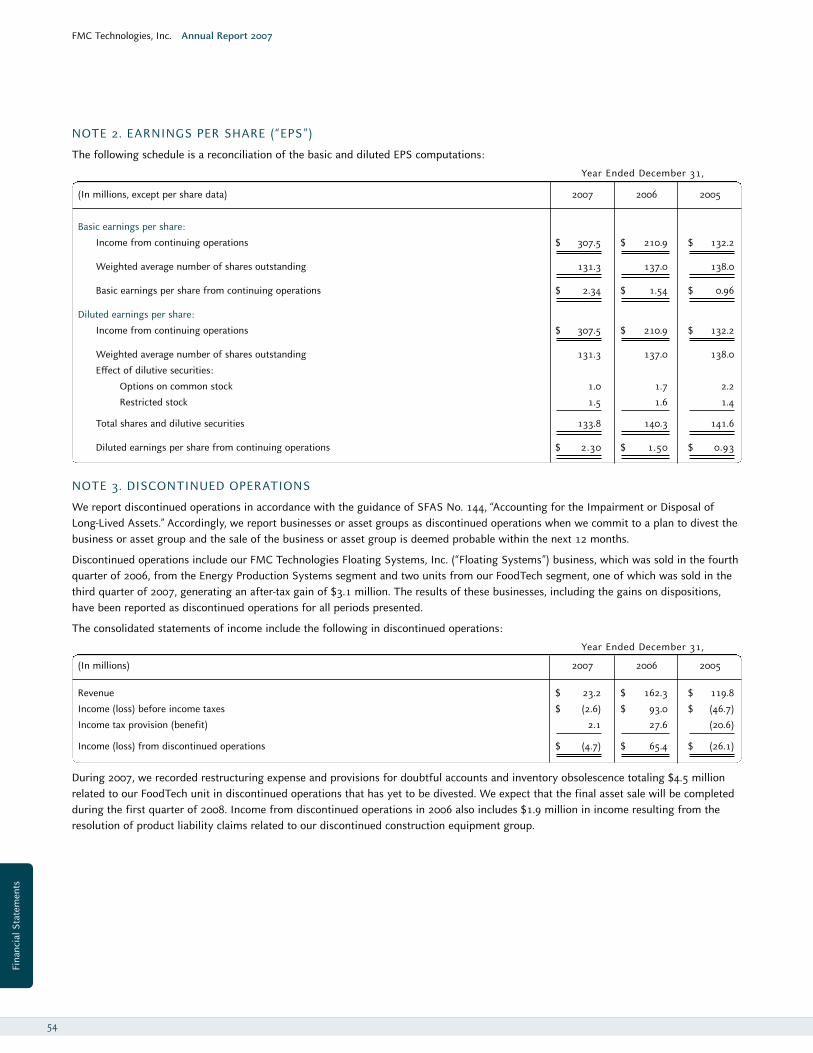
FMC Technologies, Inc. Annual Report 2007
NOTE 2. EARNINGS PER SHARE (“EPS”)
The following schedule is a reconciliation of the basic and diluted EPS computations:
Year Ended December 31,
(In millions, except per share data) 2007 2006 2005
Basic earnings per share:
Income from continuing operations $ 307.5 $ 210.9 $ 132.2
Weighted average number of shares outstanding 131.3 137.0 138.0
Basic earnings per share from continuing operations $ 2.34 $ 1.54 $ 0.96
Diluted earnings per share:
Income from continuing operations $ 307.5 $ 210.9 $ 132.2
Weighted average number of shares outstanding 131.3 137.0 138.0
Effect of dilutive securities:
Options on common stock 1.0 1.7 2.2
Restricted stock 1.5 1.6 1.4
Total shares and dilutive securities 133.8 140.3 141.6
Diluted earnings per share from continuing operations $ 2.30 $ 1.50 $ 0.93
NOTE 3. DISCONTINUED OPERATIONS
We report discontinued operations in accordance with the guidance of SFAS No. 144, “Accounting for the Impairment or Disposal ofLong-Lived Assets.” Accordingly, we report businesses or asset groups as discontinued operations when we commit to a plan to divest thebusiness or asset group and the sale of the business or asset group is deemed probable within the next 12 months.
Discontinued operations include our FMC Technologies Floating Systems, Inc. (“Floating Systems”) business, which was sold in the fourthquarter of 2006, from the Energy Production Systems segment and two units from our FoodTech segment, one of which was sold in thethird quarter of 2007, generating an after-tax gain of $3.1 million. The results of these businesses, including the gains on dispositions,have been reported as discontinued operations for all periods presented.
The consolidated statements of income include the following in discontinued operations:
Year Ended December 31,
(In millions) 2007 2006 2005
Revenue $ 23.2 $ 162.3 $ 119.8
Income (loss) before income taxes $ (2.6) $ 93.0 $ (46.7)
Income tax provision (benefit) 2.1 27.6 (20.6)
Income (loss) from discontinued operations $ (4.7) $ 65.4 $ (26.1)
During 2007, we recorded restructuring expense and provisions for doubtful accounts and inventory obsolescence totaling $4.5 millionrelated to our FoodTech unit in discontinued operations that has yet to be divested. We expect that the final asset sale will be completedduring the first quarter of 2008. Income from discontinued operations in 2006 also includes $1.9 million in income resulting from theresolution of product liability claims related to our discontinued construction equipment group.
54
Fina
ncia
l Sta
tem
ents
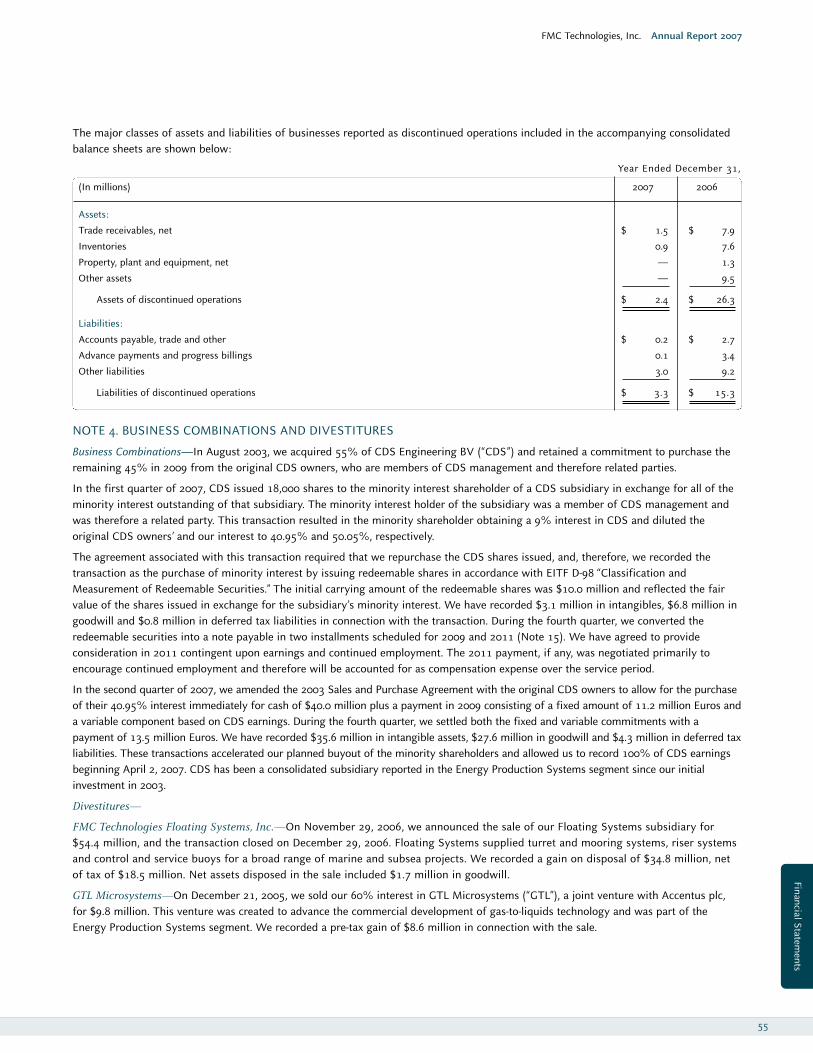
FMC Technologies, Inc. Annual Report 2007
The major classes of assets and liabilities of businesses reported as discontinued operations included in the accompanying consolidatedbalance sheets are shown below:
Year Ended December 31,
(In millions) 2007 2006
Assets:
Trade receivables, net $ 1.5 $ 7.9
Inventories 0.9 7.6
Property, plant and equipment, net — 1.3
Other assets — 9.5
Assets of discontinued operations $ 2.4 $ 26.3
Liabilities:
Accounts payable, trade and other $ 0.2 $ 2.7
Advance payments and progress billings 0.1 3.4
Other liabilities 3.0 9.2
Liabilities of discontinued operations $ 3.3 $ 15.3
NOTE 4. BUSINESS COMBINATIONS AND DIVESTITURES
Business Combinations—In August 2003, we acquired 55% of CDS Engineering BV (“CDS”) and retained a commitment to purchase theremaining 45% in 2009 from the original CDS owners, who are members of CDS management and therefore related parties.
In the first quarter of 2007, CDS issued 18,000 shares to the minority interest shareholder of a CDS subsidiary in exchange for all of theminority interest outstanding of that subsidiary. The minority interest holder of the subsidiary was a member of CDS management andwas therefore a related party. This transaction resulted in the minority shareholder obtaining a 9% interest in CDS and diluted theoriginal CDS owners’ and our interest to 40.95% and 50.05%, respectively.
The agreement associated with this transaction required that we repurchase the CDS shares issued, and, therefore, we recorded thetransaction as the purchase of minority interest by issuing redeemable shares in accordance with EITF D-98 “Classification andMeasurement of Redeemable Securities.” The initial carrying amount of the redeemable shares was $10.0 million and reflected the fairvalue of the shares issued in exchange for the subsidiary’s minority interest. We have recorded $3.1 million in intangibles, $6.8 million ingoodwill and $0.8 million in deferred tax liabilities in connection with the transaction. During the fourth quarter, we converted theredeemable securities into a note payable in two installments scheduled for 2009 and 2011 (Note 15). We have agreed to provideconsideration in 2011 contingent upon earnings and continued employment. The 2011 payment, if any, was negotiated primarily toencourage continued employment and therefore will be accounted for as compensation expense over the service period.
In the second quarter of 2007, we amended the 2003 Sales and Purchase Agreement with the original CDS owners to allow for the purchaseof their 40.95% interest immediately for cash of $40.0 million plus a payment in 2009 consisting of a fixed amount of 11.2 million Euros anda variable component based on CDS earnings. During the fourth quarter, we settled both the fixed and variable commitments with apayment of 13.5 million Euros. We have recorded $35.6 million in intangible assets, $27.6 million in goodwill and $4.3 million in deferred taxliabilities. These transactions accelerated our planned buyout of the minority shareholders and allowed us to record 100% of CDS earningsbeginning April 2, 2007. CDS has been a consolidated subsidiary reported in the Energy Production Systems segment since our initialinvestment in 2003.
Divestitures—
FMC Technologies Floating Systems, Inc.—On November 29, 2006, we announced the sale of our Floating Systems subsidiary for$54.4 million, and the transaction closed on December 29, 2006. Floating Systems supplied turret and mooring systems, riser systemsand control and service buoys for a broad range of marine and subsea projects. We recorded a gain on disposal of $34.8 million, netof tax of $18.5 million. Net assets disposed in the sale included $1.7 million in goodwill.
GTL Microsystems—On December 21, 2005, we sold our 60% interest in GTL Microsystems (“GTL”), a joint venture with Accentus plc,for $9.8 million. This venture was created to advance the commercial development of gas-to-liquids technology and was part of theEnergy Production Systems segment. We recorded a pre-tax gain of $8.6 million in connection with the sale.
55
Financial Statements
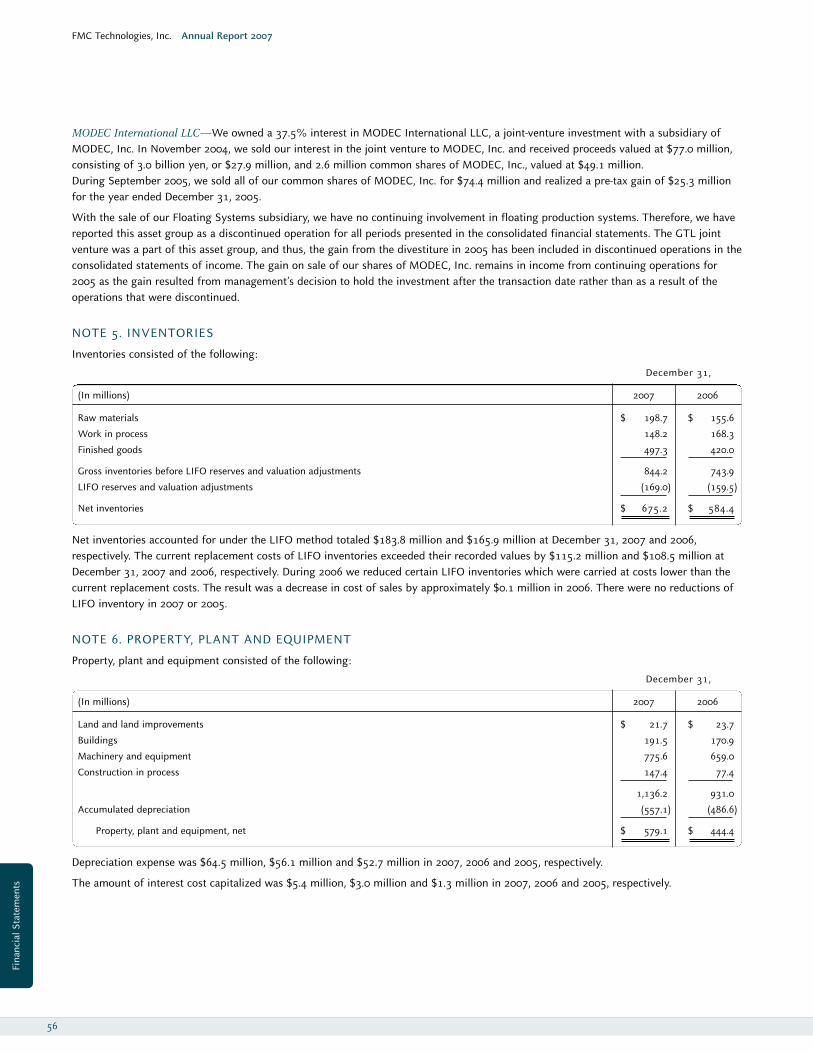
FMC Technologies, Inc. Annual Report 2007
MODEC International LLC—We owned a 37.5% interest in MODEC International LLC, a joint-venture investment with a subsidiary ofMODEC, Inc. In November 2004, we sold our interest in the joint venture to MODEC, Inc. and received proceeds valued at $77.0 million,consisting of 3.0 billion yen, or $27.9 million, and 2.6 million common shares of MODEC, Inc., valued at $49.1 million. During September 2005, we sold all of our common shares of MODEC, Inc. for $74.4 million and realized a pre-tax gain of $25.3 millionfor the year ended December 31, 2005.
With the sale of our Floating Systems subsidiary, we have no continuing involvement in floating production systems. Therefore, we havereported this asset group as a discontinued operation for all periods presented in the consolidated financial statements. The GTL jointventure was a part of this asset group, and thus, the gain from the divestiture in 2005 has been included in discontinued operations in theconsolidated statements of income. The gain on sale of our shares of MODEC, Inc. remains in income from continuing operations for2005 as the gain resulted from management’s decision to hold the investment after the transaction date rather than as a result of theoperations that were discontinued.
NOTE 5. INVENTORIES
Inventories consisted of the following:
December 31,
(In millions) 2007 2006
Raw materials $ 198.7 $ 155.6
Work in process 148.2 168.3
Finished goods 497.3 420.0
Gross inventories before LIFO reserves and valuation adjustments 844.2 743.9
LIFO reserves and valuation adjustments (169.0) (159.5)
Net inventories $ 675.2 $ 584.4
Net inventories accounted for under the LIFO method totaled $183.8 million and $165.9 million at December 31, 2007 and 2006,respectively. The current replacement costs of LIFO inventories exceeded their recorded values by $115.2 million and $108.5 million atDecember 31, 2007 and 2006, respectively. During 2006 we reduced certain LIFO inventories which were carried at costs lower than thecurrent replacement costs. The result was a decrease in cost of sales by approximately $0.1 million in 2006. There were no reductions ofLIFO inventory in 2007 or 2005.
NOTE 6. PROPERTY, PLANT AND EQUIPMENT
Property, plant and equipment consisted of the following:
December 31,
(In millions) 2007 2006
Land and land improvements $ 21.7 $ 23.7
Buildings 191.5 170.9
Machinery and equipment 775.6 659.0
Construction in process 147.4 77.4
1,136.2 931.0
Accumulated depreciation (557.1) (486.6)
Property, plant and equipment, net $ 579.1 $ 444.4
Depreciation expense was $64.5 million, $56.1 million and $52.7 million in 2007, 2006 and 2005, respectively.
The amount of interest cost capitalized was $5.4 million, $3.0 million and $1.3 million in 2007, 2006 and 2005, respectively.
56
Fina
ncia
l Sta
tem
ents
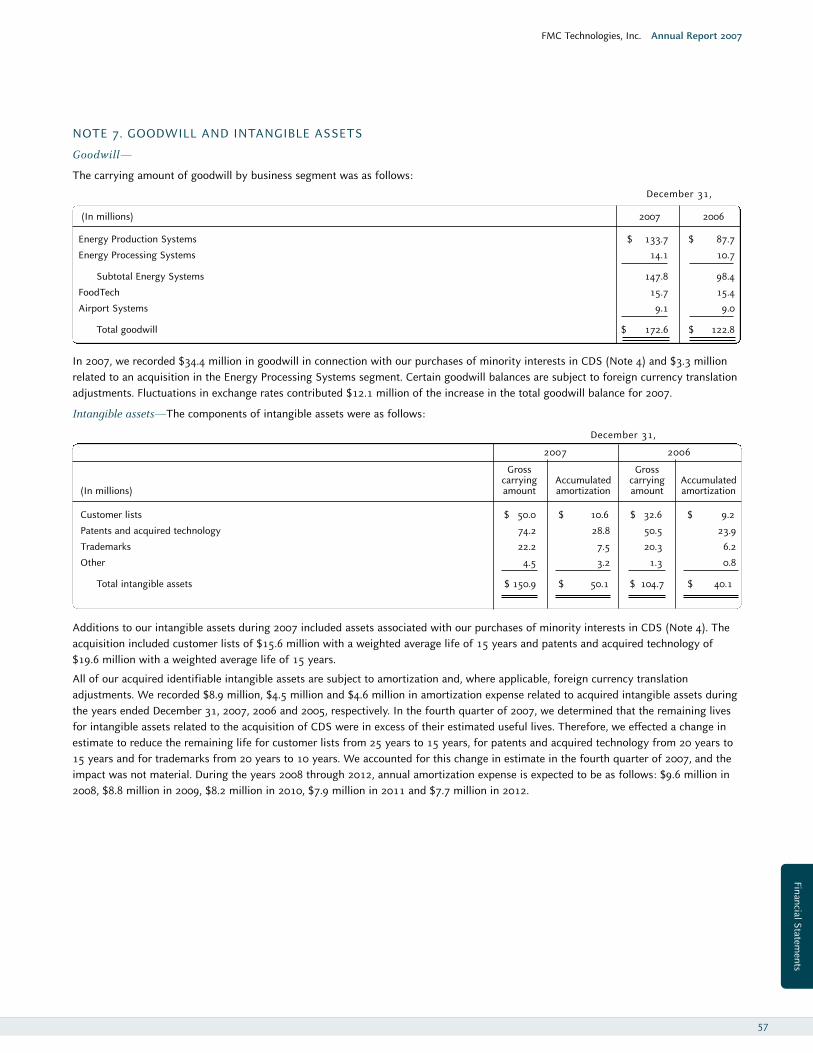
FMC Technologies, Inc. Annual Report 2007
NOTE 7. GOODWILL AND INTANGIBLE ASSETS
Goodwill—
The carrying amount of goodwill by business segment was as follows:
December 31,
(In millions) 2007 2006
Energy Production Systems $ 133.7 $ 87.7
Energy Processing Systems 14.1 10.7
Subtotal Energy Systems 147.8 98.4
FoodTech 15.7 15.4
Airport Systems 9.1 9.0
Total goodwill $ 172.6 $ 122.8
In 2007, we recorded $34.4 million in goodwill in connection with our purchases of minority interests in CDS (Note 4) and $3.3 millionrelated to an acquisition in the Energy Processing Systems segment. Certain goodwill balances are subject to foreign currency translationadjustments. Fluctuations in exchange rates contributed $12.1 million of the increase in the total goodwill balance for 2007.
Intangible assets—The components of intangible assets were as follows:
December 31,
2007 2006
Gross Grosscarrying Accumulated carrying Accumulated
(In millions) amount amortization amount amortization
Customer lists $ 50.0 $ 10.6 $ 32.6 $ 9.2
Patents and acquired technology 74.2 28.8 50.5 23.9
Trademarks 22.2 7.5 20.3 6.2
Other 4.5 3.2 1.3 0.8
Total intangible assets $ 150.9 $ 50.1 $ 104.7 $ 40.1
Additions to our intangible assets during 2007 included assets associated with our purchases of minority interests in CDS (Note 4). Theacquisition included customer lists of $15.6 million with a weighted average life of 15 years and patents and acquired technology of$19.6 million with a weighted average life of 15 years.
All of our acquired identifiable intangible assets are subject to amortization and, where applicable, foreign currency translationadjustments. We recorded $8.9 million, $4.5 million and $4.6 million in amortization expense related to acquired intangible assets duringthe years ended December 31, 2007, 2006 and 2005, respectively. In the fourth quarter of 2007, we determined that the remaining livesfor intangible assets related to the acquisition of CDS were in excess of their estimated useful lives. Therefore, we effected a change inestimate to reduce the remaining life for customer lists from 25 years to 15 years, for patents and acquired technology from 20 years to15 years and for trademarks from 20 years to 10 years. We accounted for this change in estimate in the fourth quarter of 2007, and theimpact was not material. During the years 2008 through 2012, annual amortization expense is expected to be as follows: $9.6 million in2008, $8.8 million in 2009, $8.2 million in 2010, $7.9 million in 2011 and $7.7 million in 2012.
57
Financial Statements
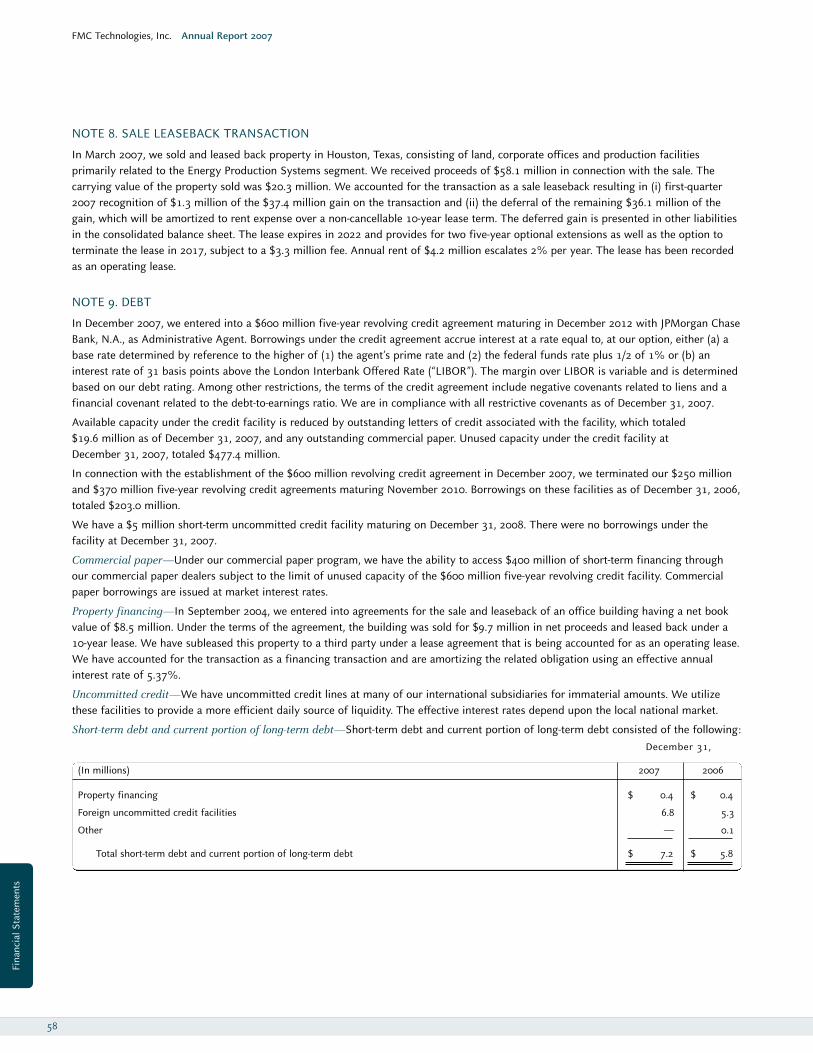
FMC Technologies, Inc. Annual Report 2007
NOTE 8. SALE LEASEBACK TRANSACTION
In March 2007, we sold and leased back property in Houston, Texas, consisting of land, corporate offices and production facilitiesprimarily related to the Energy Production Systems segment. We received proceeds of $58.1 million in connection with the sale. Thecarrying value of the property sold was $20.3 million. We accounted for the transaction as a sale leaseback resulting in (i) first-quarter2007 recognition of $1.3 million of the $37.4 million gain on the transaction and (ii) the deferral of the remaining $36.1 million of thegain, which will be amortized to rent expense over a non-cancellable 10-year lease term. The deferred gain is presented in other liabilitiesin the consolidated balance sheet. The lease expires in 2022 and provides for two five-year optional extensions as well as the option toterminate the lease in 2017, subject to a $3.3 million fee. Annual rent of $4.2 million escalates 2% per year. The lease has been recordedas an operating lease.
NOTE 9. DEBT
In December 2007, we entered into a $600 million five-year revolving credit agreement maturing in December 2012 with JPMorgan ChaseBank, N.A., as Administrative Agent. Borrowings under the credit agreement accrue interest at a rate equal to, at our option, either (a) abase rate determined by reference to the higher of (1) the agent’s prime rate and (2) the federal funds rate plus 1/2 of 1% or (b) aninterest rate of 31 basis points above the London Interbank Offered Rate (“LIBOR”). The margin over LIBOR is variable and is determinedbased on our debt rating. Among other restrictions, the terms of the credit agreement include negative covenants related to liens and afinancial covenant related to the debt-to-earnings ratio. We are in compliance with all restrictive covenants as of December 31, 2007.
Available capacity under the credit facility is reduced by outstanding letters of credit associated with the facility, which totaled $19.6 million as of December 31, 2007, and any outstanding commercial paper. Unused capacity under the credit facility at December 31, 2007, totaled $477.4 million.
In connection with the establishment of the $600 million revolving credit agreement in December 2007, we terminated our $250 millionand $370 million five-year revolving credit agreements maturing November 2010. Borrowings on these facilities as of December 31, 2006,totaled $203.0 million.
We have a $5 million short-term uncommitted credit facility maturing on December 31, 2008. There were no borrowings under thefacility at December 31, 2007.
Commercial paper—Under our commercial paper program, we have the ability to access $400 million of short-term financing throughour commercial paper dealers subject to the limit of unused capacity of the $600 million five-year revolving credit facility. Commercialpaper borrowings are issued at market interest rates.
Property financing—In September 2004, we entered into agreements for the sale and leaseback of an office building having a net bookvalue of $8.5 million. Under the terms of the agreement, the building was sold for $9.7 million in net proceeds and leased back under a10-year lease. We have subleased this property to a third party under a lease agreement that is being accounted for as an operating lease.We have accounted for the transaction as a financing transaction and are amortizing the related obligation using an effective annualinterest rate of 5.37%.
Uncommitted credit—We have uncommitted credit lines at many of our international subsidiaries for immaterial amounts. We utilizethese facilities to provide a more efficient daily source of liquidity. The effective interest rates depend upon the local national market.
Short-term debt and current portion of long-term debt—Short-term debt and current portion of long-term debt consisted of the following: December 31,
(In millions) 2007 2006
Property financing $ 0.4 $ 0.4
Foreign uncommitted credit facilities 6.8 5.3
Other — 0.1
Total short-term debt and current portion of long-term debt $ 7.2 $ 5.8
58
Fina
ncia
l Sta
tem
ents
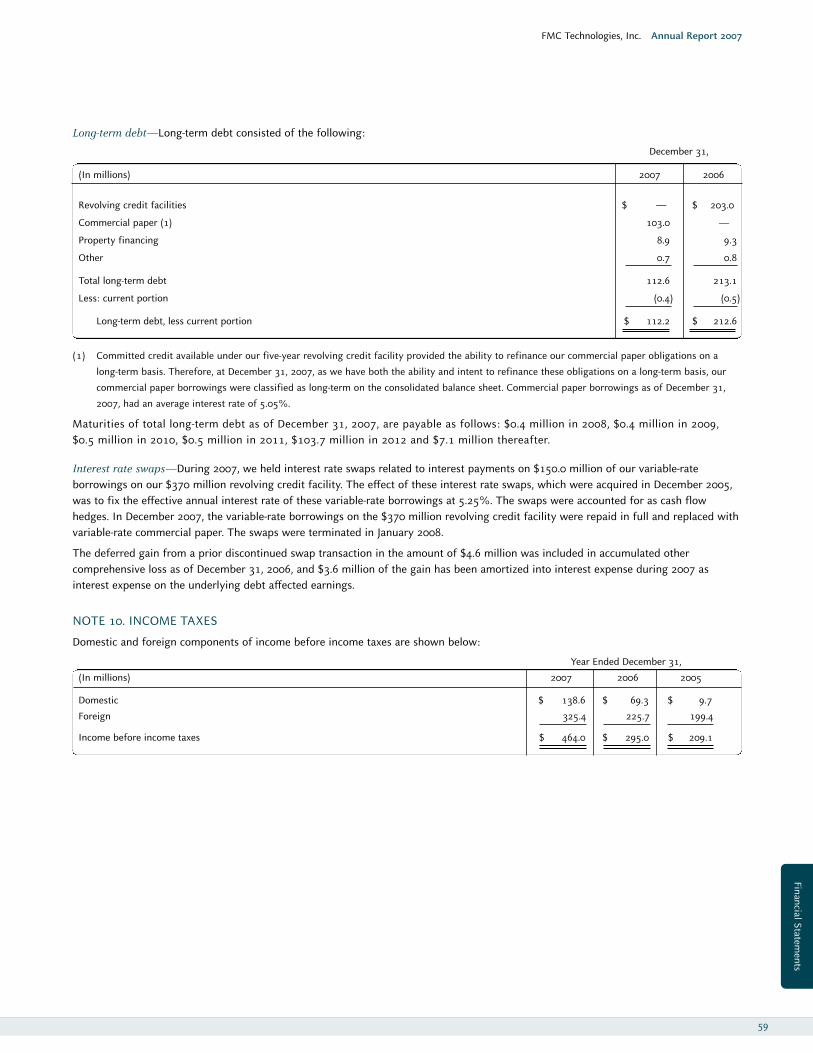
Long-term debt—Long-term debt consisted of the following:
December 31,
(In millions) 2007 2006
Revolving credit facilities $ — $ 203.0
Commercial paper (1) 103.0 —
Property financing 8.9 9.3
Other 0.7 0.8
Total long-term debt 112.6 213.1
Less: current portion (0.4) (0.5)
Long-term debt, less current portion $ 112.2 $ 212.6
(1) Committed credit available under our five-year revolving credit facility provided the ability to refinance our commercial paper obligations on a
long-term basis. Therefore, at December 31, 2007, as we have both the ability and intent to refinance these obligations on a long-term basis, our
commercial paper borrowings were classified as long-term on the consolidated balance sheet. Commercial paper borrowings as of December 31,
2007, had an average interest rate of 5.05%.
Maturities of total long-term debt as of December 31, 2007, are payable as follows: $0.4 million in 2008, $0.4 million in 2009,$0.5 million in 2010, $0.5 million in 2011, $103.7 million in 2012 and $7.1 million thereafter.
Interest rate swaps—During 2007, we held interest rate swaps related to interest payments on $150.0 million of our variable-rateborrowings on our $370 million revolving credit facility. The effect of these interest rate swaps, which were acquired in December 2005,was to fix the effective annual interest rate of these variable-rate borrowings at 5.25%. The swaps were accounted for as cash flowhedges. In December 2007, the variable-rate borrowings on the $370 million revolving credit facility were repaid in full and replaced withvariable-rate commercial paper. The swaps were terminated in January 2008.
The deferred gain from a prior discontinued swap transaction in the amount of $4.6 million was included in accumulated othercomprehensive loss as of December 31, 2006, and $3.6 million of the gain has been amortized into interest expense during 2007 asinterest expense on the underlying debt affected earnings.
NOTE 10. INCOME TAXES
Domestic and foreign components of income before income taxes are shown below:
Year Ended December 31,
(In millions) 2007 2006 2005
Domestic $ 138.6 $ 69.3 $ 9.7
Foreign 325.4 225.7 199.4
Income before income taxes $ 464.0 $ 295.0 $ 209.1
FMC Technologies, Inc. Annual Report 2007
59
Financial Statements
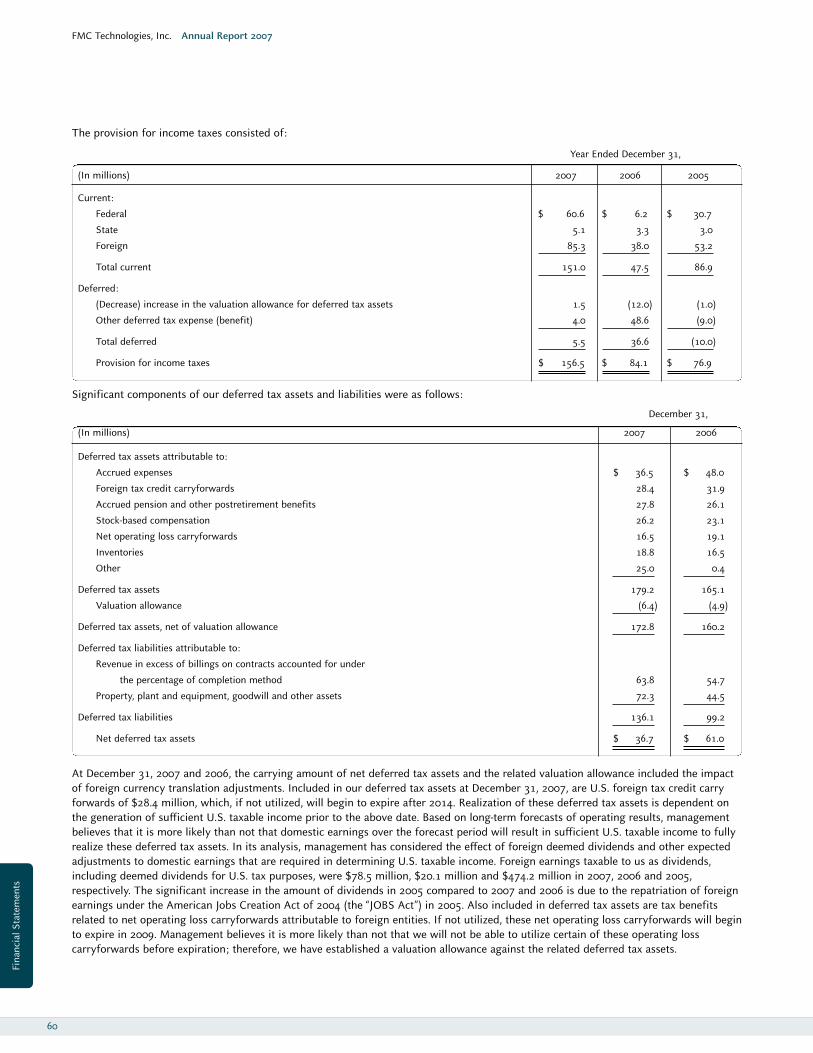
FMC Technologies, Inc. Annual Report 2007
The provision for income taxes consisted of:
Year Ended December 31,
(In millions) 2007 2006 2005
Current:
Federal $ 60.6 $ 6.2 $ 30.7
State 5.1 3.3 3.0
Foreign 85.3 38.0 53.2
Total current 151.0 47.5 86.9
Deferred:
(Decrease) increase in the valuation allowance for deferred tax assets 1.5 (12.0) (1.0)
Other deferred tax expense (benefit) 4.0 48.6 (9.0)
Total deferred 5.5 36.6 (10.0)
Provision for income taxes $ 156.5 $ 84.1 $ 76.9
Significant components of our deferred tax assets and liabilities were as follows:
December 31,
(In millions) 2007 2006
Deferred tax assets attributable to:
Accrued expenses $ 36.5 $ 48.0
Foreign tax credit carryforwards 28.4 31.9
Accrued pension and other postretirement benefits 27.8 26.1
Stock-based compensation 26.2 23.1
Net operating loss carryforwards 16.5 19.1
Inventories 18.8 16.5
Other 25.0 0.4
Deferred tax assets 179.2 165.1
Valuation allowance (6.4) (4.9)
Deferred tax assets, net of valuation allowance 172.8 160.2
Deferred tax liabilities attributable to:
Revenue in excess of billings on contracts accounted for under
the percentage of completion method 63.8 54.7
Property, plant and equipment, goodwill and other assets 72.3 44.5
Deferred tax liabilities 136.1 99.2
Net deferred tax assets $ 36.7 $ 61.0
At December 31, 2007 and 2006, the carrying amount of net deferred tax assets and the related valuation allowance included the impactof foreign currency translation adjustments. Included in our deferred tax assets at December 31, 2007, are U.S. foreign tax credit carryforwards of $28.4 million, which, if not utilized, will begin to expire after 2014. Realization of these deferred tax assets is dependent onthe generation of sufficient U.S. taxable income prior to the above date. Based on long-term forecasts of operating results, managementbelieves that it is more likely than not that domestic earnings over the forecast period will result in sufficient U.S. taxable income to fullyrealize these deferred tax assets. In its analysis, management has considered the effect of foreign deemed dividends and other expectedadjustments to domestic earnings that are required in determining U.S. taxable income. Foreign earnings taxable to us as dividends,including deemed dividends for U.S. tax purposes, were $78.5 million, $20.1 million and $474.2 million in 2007, 2006 and 2005,respectively. The significant increase in the amount of dividends in 2005 compared to 2007 and 2006 is due to the repatriation of foreignearnings under the American Jobs Creation Act of 2004 (the “JOBS Act”) in 2005. Also included in deferred tax assets are tax benefitsrelated to net operating loss carryforwards attributable to foreign entities. If not utilized, these net operating loss carryforwards will beginto expire in 2009. Management believes it is more likely than not that we will not be able to utilize certain of these operating losscarryforwards before expiration; therefore, we have established a valuation allowance against the related deferred tax assets.
60
Fina
ncia
l Sta
tem
ents
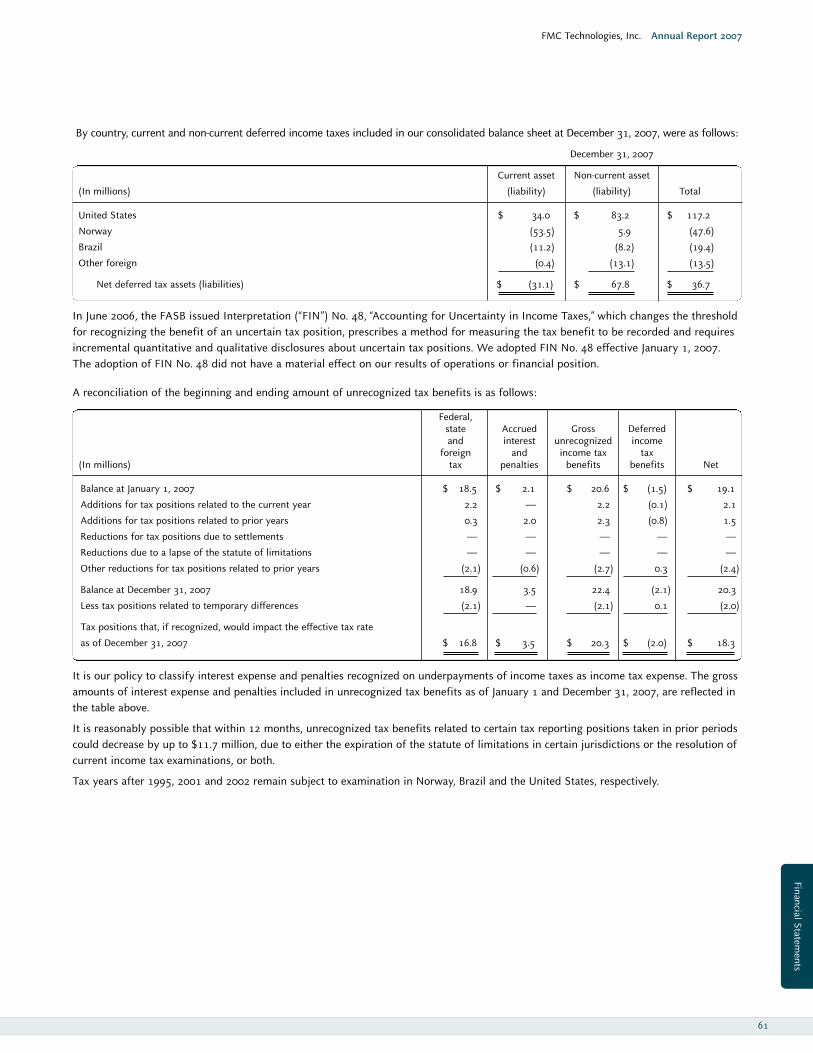
FMC Technologies, Inc. Annual Report 2007
By country, current and non-current deferred income taxes included in our consolidated balance sheet at December 31, 2007, were as follows:
December 31, 2007
Current asset Non-current asset
(In millions) (liability) (liability) Total
United States $ 34.0 $ 83.2 $ 117.2
Norway (53.5) 5.9 (47.6)
Brazil (11.2) (8.2) (19.4)
Other foreign (0.4) (13.1) (13.5)
Net deferred tax assets (liabilities) $ (31.1) $ 67.8 $ 36.7
In June 2006, the FASB issued Interpretation (“FIN”) No. 48, “Accounting for Uncertainty in Income Taxes,” which changes the thresholdfor recognizing the benefit of an uncertain tax position, prescribes a method for measuring the tax benefit to be recorded and requiresincremental quantitative and qualitative disclosures about uncertain tax positions. We adopted FIN No. 48 effective January 1, 2007.The adoption of FIN No. 48 did not have a material effect on our results of operations or financial position.
A reconciliation of the beginning and ending amount of unrecognized tax benefits is as follows:
Federal,state Accrued Gross Deferredand interest unrecognized income
foreign and income tax tax(In millions) tax penalties benefits benefits Net
Balance at January 1, 2007 $ 18.5 $ 2.1 $ 20.6 $ (1.5) $ 19.1
Additions for tax positions related to the current year 2.2 — 2.2 (0.1) 2.1
Additions for tax positions related to prior years 0.3 2.0 2.3 (0.8) 1.5
Reductions for tax positions due to settlements — — — — —
Reductions due to a lapse of the statute of limitations — — — — —
Other reductions for tax positions related to prior years (2.1) (0.6) (2.7) 0.3 (2.4)
Balance at December 31, 2007 18.9 3.5 22.4 (2.1) 20.3
Less tax positions related to temporary differences (2.1) — (2.1) 0.1 (2.0)
Tax positions that, if recognized, would impact the effective tax rate
as of December 31, 2007 $ 16.8 $ 3.5 $ 20.3 $ (2.0) $ 18.3
It is our policy to classify interest expense and penalties recognized on underpayments of income taxes as income tax expense. The grossamounts of interest expense and penalties included in unrecognized tax benefits as of January 1 and December 31, 2007, are reflected inthe table above.
It is reasonably possible that within 12 months, unrecognized tax benefits related to certain tax reporting positions taken in prior periodscould decrease by up to $11.7 million, due to either the expiration of the statute of limitations in certain jurisdictions or the resolution ofcurrent income tax examinations, or both.
Tax years after 1995, 2001 and 2002 remain subject to examination in Norway, Brazil and the United States, respectively.
61
Financial Statements
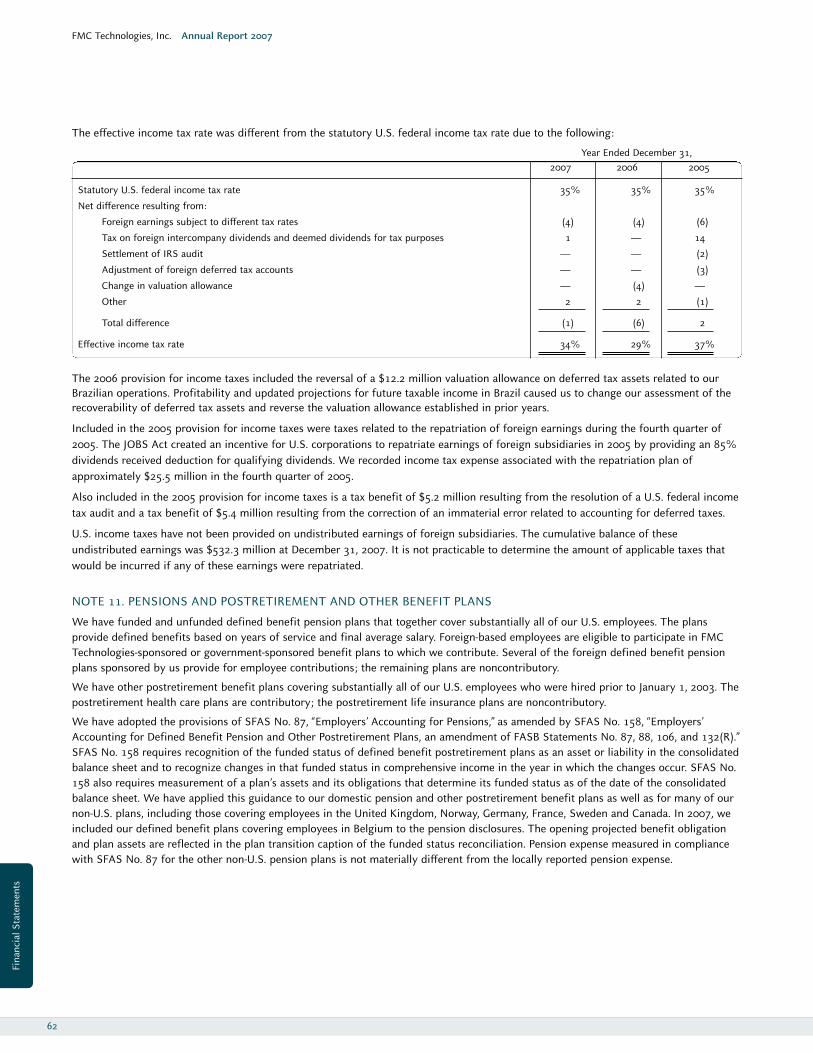
FMC Technologies, Inc. Annual Report 2007
The effective income tax rate was different from the statutory U.S. federal income tax rate due to the following:
Year Ended December 31, 2007 2006 2005
Statutory U.S. federal income tax rate 35% 35% 35%
Net difference resulting from:
Foreign earnings subject to different tax rates (4) (4) (6)
Tax on foreign intercompany dividends and deemed dividends for tax purposes 1 — 14
Settlement of IRS audit — — (2)
Adjustment of foreign deferred tax accounts — — (3)
Change in valuation allowance — (4) —
Other 2 2 (1)
Total difference (1) (6) 2
Effective income tax rate 34% 29% 37%
The 2006 provision for income taxes included the reversal of a $12.2 million valuation allowance on deferred tax assets related to ourBrazilian operations. Profitability and updated projections for future taxable income in Brazil caused us to change our assessment of therecoverability of deferred tax assets and reverse the valuation allowance established in prior years.
Included in the 2005 provision for income taxes were taxes related to the repatriation of foreign earnings during the fourth quarter of2005. The JOBS Act created an incentive for U.S. corporations to repatriate earnings of foreign subsidiaries in 2005 by providing an 85%dividends received deduction for qualifying dividends. We recorded income tax expense associated with the repatriation plan ofapproximately $25.5 million in the fourth quarter of 2005.
Also included in the 2005 provision for income taxes is a tax benefit of $5.2 million resulting from the resolution of a U.S. federal incometax audit and a tax benefit of $5.4 million resulting from the correction of an immaterial error related to accounting for deferred taxes.
U.S. income taxes have not been provided on undistributed earnings of foreign subsidiaries. The cumulative balance of theseundistributed earnings was $532.3 million at December 31, 2007. It is not practicable to determine the amount of applicable taxes thatwould be incurred if any of these earnings were repatriated.
NOTE 11. PENSIONS AND POSTRETIREMENT AND OTHER BENEFIT PLANS
We have funded and unfunded defined benefit pension plans that together cover substantially all of our U.S. employees. The plansprovide defined benefits based on years of service and final average salary. Foreign-based employees are eligible to participate in FMCTechnologies-sponsored or government-sponsored benefit plans to which we contribute. Several of the foreign defined benefit pensionplans sponsored by us provide for employee contributions; the remaining plans are noncontributory.
We have other postretirement benefit plans covering substantially all of our U.S. employees who were hired prior to January 1, 2003. Thepostretirement health care plans are contributory; the postretirement life insurance plans are noncontributory.
We have adopted the provisions of SFAS No. 87, “Employers’ Accounting for Pensions,” as amended by SFAS No. 158, “Employers’Accounting for Defined Benefit Pension and Other Postretirement Plans, an amendment of FASB Statements No. 87, 88, 106, and 132(R).”SFAS No. 158 requires recognition of the funded status of defined benefit postretirement plans as an asset or liability in the consolidatedbalance sheet and to recognize changes in that funded status in comprehensive income in the year in which the changes occur. SFAS No.158 also requires measurement of a plan’s assets and its obligations that determine its funded status as of the date of the consolidatedbalance sheet. We have applied this guidance to our domestic pension and other postretirement benefit plans as well as for many of ournon-U.S. plans, including those covering employees in the United Kingdom, Norway, Germany, France, Sweden and Canada. In 2007, weincluded our defined benefit plans covering employees in Belgium to the pension disclosures. The opening projected benefit obligationand plan assets are reflected in the plan transition caption of the funded status reconciliation. Pension expense measured in compliancewith SFAS No. 87 for the other non-U.S. pension plans is not materially different from the locally reported pension expense.
62
Fina
ncia
l Sta
tem
ents
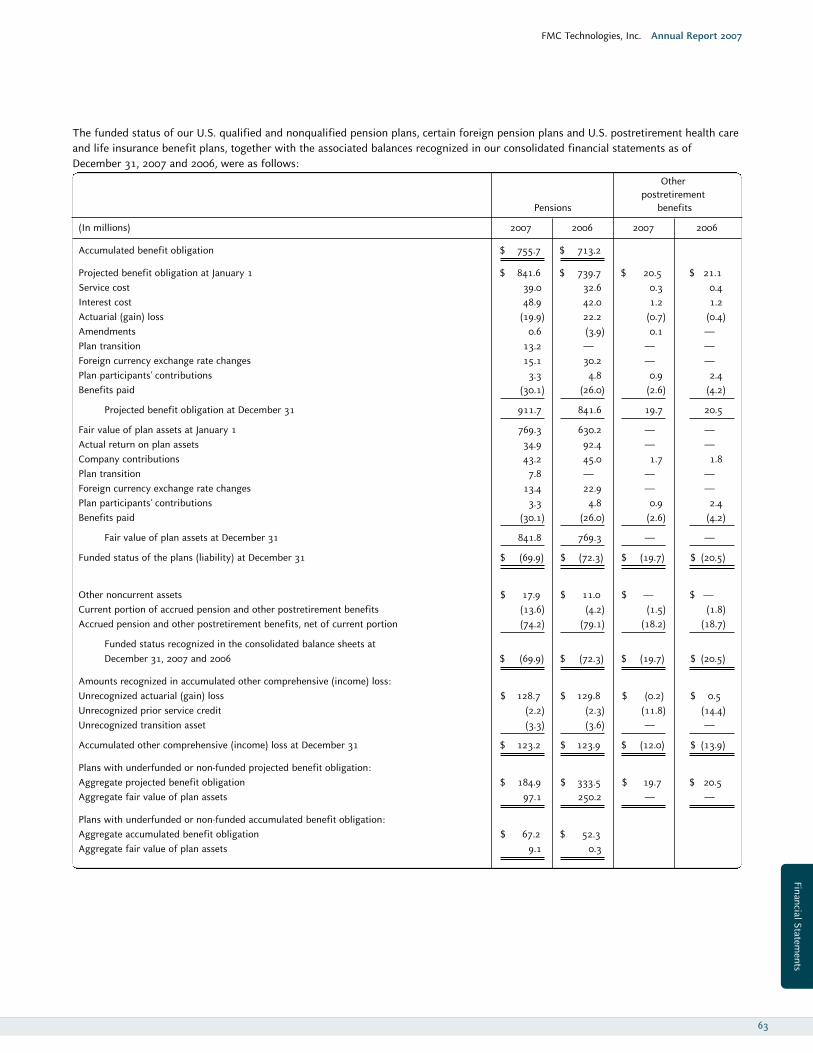
FMC Technologies, Inc. Annual Report 2007
The funded status of our U.S. qualified and nonqualified pension plans, certain foreign pension plans and U.S. postretirement health careand life insurance benefit plans, together with the associated balances recognized in our consolidated financial statements as ofDecember 31, 2007 and 2006, were as follows:
Otherpostretirement
Pensions benefits
(In millions) 2007 2006 2007 2006
Accumulated benefit obligation $ 755.7 $ 713.2
Projected benefit obligation at January 1 $ 841.6 $ 739.7 $ 20.5 $ 21.1Service cost 39.0 32.6 0.3 0.4Interest cost 48.9 42.0 1.2 1.2Actuarial (gain) loss (19.9) 22.2 (0.7) (0.4)Amendments 0.6 (3.9) 0.1 —Plan transition 13.2 — — —Foreign currency exchange rate changes 15.1 30.2 — —Plan participants’ contributions 3.3 4.8 0.9 2.4Benefits paid (30.1) (26.0) (2.6) (4.2)
Projected benefit obligation at December 31 911.7 841.6 19.7 20.5
Fair value of plan assets at January 1 769.3 630.2 — —Actual return on plan assets 34.9 92.4 — —Company contributions 43.2 45.0 1.7 1.8Plan transition 7.8 — — —Foreign currency exchange rate changes 13.4 22.9 — —Plan participants’ contributions 3.3 4.8 0.9 2.4Benefits paid (30.1) (26.0) (2.6) (4.2)
Fair value of plan assets at December 31 841.8 769.3 — —
Funded status of the plans (liability) at December 31 $ (69.9) $ (72.3) $ (19.7) $ (20.5)
Other noncurrent assets $ 17.9 $ 11.0 $ — $ — Current portion of accrued pension and other postretirement benefits (13.6) (4.2) (1.5) (1.8)Accrued pension and other postretirement benefits, net of current portion (74.2) (79.1) (18.2) (18.7)
Funded status recognized in the consolidated balance sheets at December 31, 2007 and 2006 $ (69.9) $ (72.3) $ (19.7) $ (20.5)
Amounts recognized in accumulated other comprehensive (income) loss:Unrecognized actuarial (gain) loss $ 128.7 $ 129.8 $ (0.2) $ 0.5Unrecognized prior service credit (2.2) (2.3) (11.8) (14.4)Unrecognized transition asset (3.3) (3.6) — —
Accumulated other comprehensive (income) loss at December 31 $ 123.2 $ 123.9 $ (12.0) $ (13.9)
Plans with underfunded or non-funded projected benefit obligation: Aggregate projected benefit obligation $ 184.9 $ 333.5 $ 19.7 $ 20.5Aggregate fair value of plan assets 97.1 250.2 — —
Plans with underfunded or non-funded accumulated benefit obligation:Aggregate accumulated benefit obligation $ 67.2 $ 52.3Aggregate fair value of plan assets 9.1 0.3
63
Financial Statements
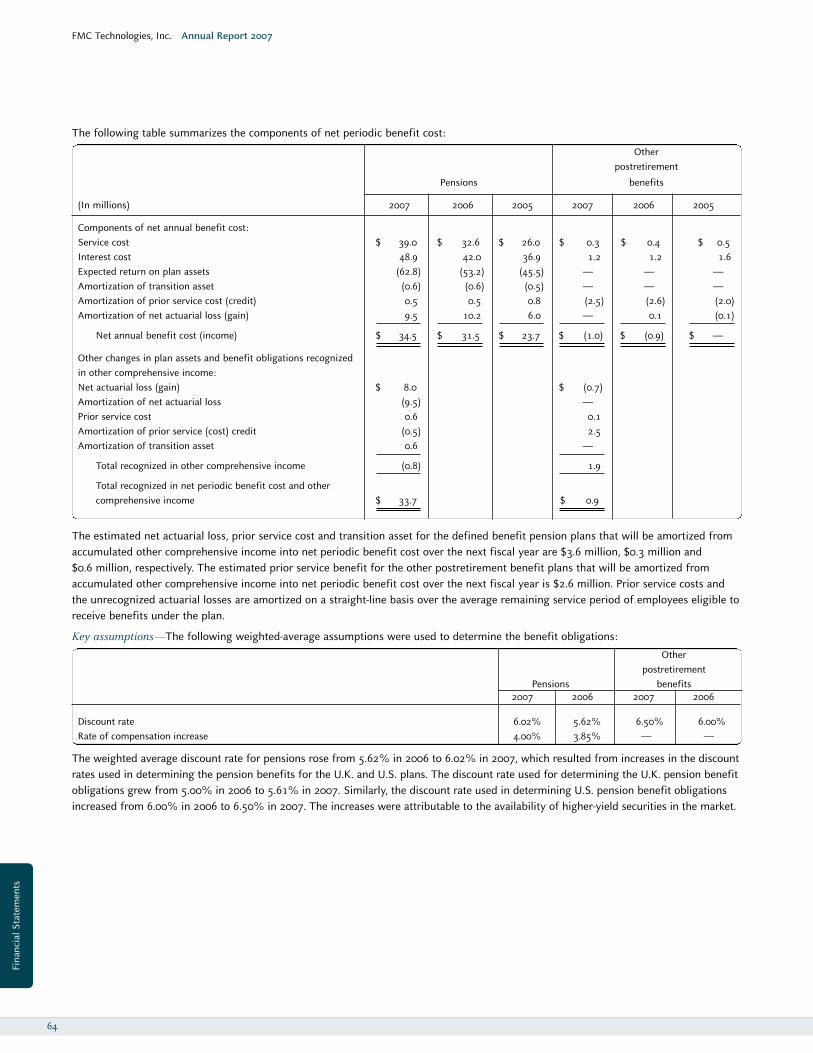
FMC Technologies, Inc. Annual Report 2007
The following table summarizes the components of net periodic benefit cost:
Otherpostretirement
Pensions benefits
(In millions) 2007 2006 2005 2007 2006 2005
Components of net annual benefit cost:Service cost $ 39.0 $ 32.6 $ 26.0 $ 0.3 $ 0.4 $ 0.5Interest cost 48.9 42.0 36.9 1.2 1.2 1.6Expected return on plan assets (62.8) (53.2) (45.5) — — —Amortization of transition asset (0.6) (0.6) (0.5) — — —Amortization of prior service cost (credit) 0.5 0.5 0.8 (2.5) (2.6) (2.0)Amortization of net actuarial loss (gain) 9.5 10.2 6.0 — 0.1 (0.1)
Net annual benefit cost (income) $ 34.5 $ 31.5 $ 23.7 $ (1.0) $ (0.9) $ —
Other changes in plan assets and benefit obligations recognizedin other comprehensive income:Net actuarial loss (gain) $ 8.0 $ (0.7) Amortization of net actuarial loss (9.5) —Prior service cost 0.6 0.1Amortization of prior service (cost) credit (0.5) 2.5Amortization of transition asset 0.6 —
Total recognized in other comprehensive income (0.8) 1.9
Total recognized in net periodic benefit cost and other comprehensive income $ 33.7 $ 0.9
The estimated net actuarial loss, prior service cost and transition asset for the defined benefit pension plans that will be amortized fromaccumulated other comprehensive income into net periodic benefit cost over the next fiscal year are $3.6 million, $0.3 million and $0.6 million, respectively. The estimated prior service benefit for the other postretirement benefit plans that will be amortized fromaccumulated other comprehensive income into net periodic benefit cost over the next fiscal year is $2.6 million. Prior service costs andthe unrecognized actuarial losses are amortized on a straight-line basis over the average remaining service period of employees eligible toreceive benefits under the plan.
Key assumptions—The following weighted-average assumptions were used to determine the benefit obligations:
Otherpostretirement
Pensions benefits2007 2006 2007 2006
Discount rate 6.02% 5.62% 6.50% 6.00%Rate of compensation increase 4.00% 3.85% — —
The weighted average discount rate for pensions rose from 5.62% in 2006 to 6.02% in 2007, which resulted from increases in the discountrates used in determining the pension benefits for the U.K. and U.S. plans. The discount rate used for determining the U.K. pension benefitobligations grew from 5.00% in 2006 to 5.61% in 2007. Similarly, the discount rate used in determining U.S. pension benefit obligationsincreased from 6.00% in 2006 to 6.50% in 2007. The increases were attributable to the availability of higher-yield securities in the market.
64
Fina
ncia
l Sta
tem
ents
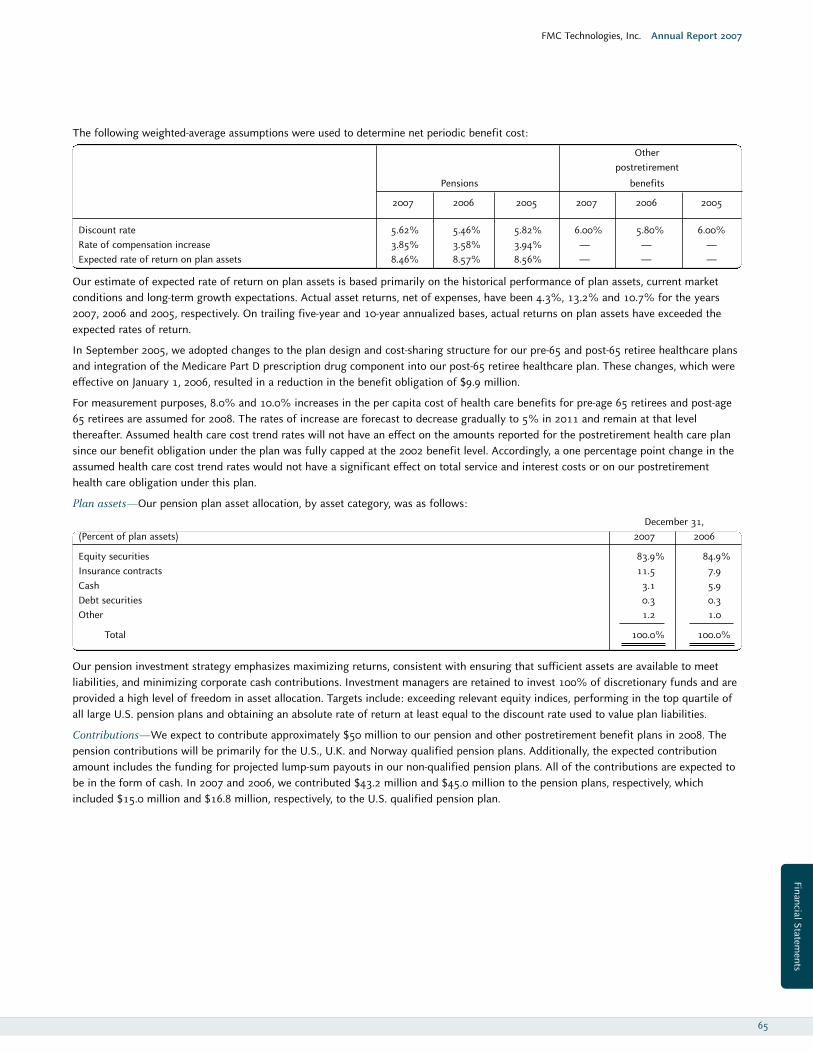
FMC Technologies, Inc. Annual Report 2007
The following weighted-average assumptions were used to determine net periodic benefit cost:
Otherpostretirement
Pensions benefits
2007 2006 2005 2007 2006 2005
Discount rate 5.62% 5.46% 5.82% 6.00% 5.80% 6.00%Rate of compensation increase 3.85% 3.58% 3.94% — — —Expected rate of return on plan assets 8.46% 8.57% 8.56% — — —
Our estimate of expected rate of return on plan assets is based primarily on the historical performance of plan assets, current marketconditions and long-term growth expectations. Actual asset returns, net of expenses, have been 4.3%, 13.2% and 10.7% for the years2007, 2006 and 2005, respectively. On trailing five-year and 10-year annualized bases, actual returns on plan assets have exceeded theexpected rates of return.
In September 2005, we adopted changes to the plan design and cost-sharing structure for our pre-65 and post-65 retiree healthcare plansand integration of the Medicare Part D prescription drug component into our post-65 retiree healthcare plan. These changes, which wereeffective on January 1, 2006, resulted in a reduction in the benefit obligation of $9.9 million.
For measurement purposes, 8.0% and 10.0% increases in the per capita cost of health care benefits for pre-age 65 retirees and post-age65 retirees are assumed for 2008. The rates of increase are forecast to decrease gradually to 5% in 2011 and remain at that levelthereafter. Assumed health care cost trend rates will not have an effect on the amounts reported for the postretirement health care plansince our benefit obligation under the plan was fully capped at the 2002 benefit level. Accordingly, a one percentage point change in theassumed health care cost trend rates would not have a significant effect on total service and interest costs or on our postretirementhealth care obligation under this plan.
Plan assets—Our pension plan asset allocation, by asset category, was as follows:
December 31,(Percent of plan assets) 2007 2006
Equity securities 83.9% 84.9%Insurance contracts 11.5 7.9Cash 3.1 5.9Debt securities 0.3 0.3Other 1.2 1.0
Total 100.0% 100.0%
Our pension investment strategy emphasizes maximizing returns, consistent with ensuring that sufficient assets are available to meetliabilities, and minimizing corporate cash contributions. Investment managers are retained to invest 100% of discretionary funds and areprovided a high level of freedom in asset allocation. Targets include: exceeding relevant equity indices, performing in the top quartile ofall large U.S. pension plans and obtaining an absolute rate of return at least equal to the discount rate used to value plan liabilities.
Contributions—We expect to contribute approximately $50 million to our pension and other postretirement benefit plans in 2008. Thepension contributions will be primarily for the U.S., U.K. and Norway qualified pension plans. Additionally, the expected contributionamount includes the funding for projected lump-sum payouts in our non-qualified pension plans. All of the contributions are expected tobe in the form of cash. In 2007 and 2006, we contributed $43.2 million and $45.0 million to the pension plans, respectively, whichincluded $15.0 million and $16.8 million, respectively, to the U.S. qualified pension plan.
65
Financial Statements
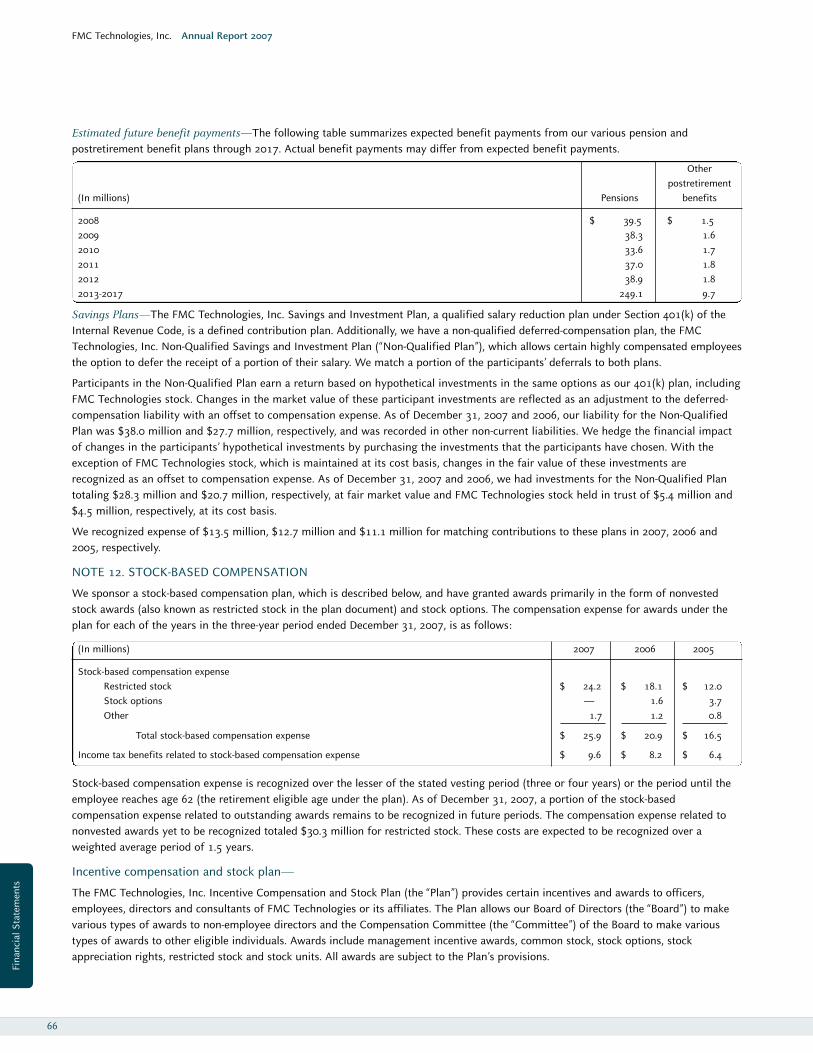
FMC Technologies, Inc. Annual Report 2007
Estimated future benefit payments—The following table summarizes expected benefit payments from our various pension andpostretirement benefit plans through 2017. Actual benefit payments may differ from expected benefit payments.
Otherpostretirement
(In millions) Pensions benefits
2008 $ 39.5 $ 1.52009 38.3 1.62010 33.6 1.72011 37.0 1.82012 38.9 1.82013-2017 249.1 9.7
Savings Plans—The FMC Technologies, Inc. Savings and Investment Plan, a qualified salary reduction plan under Section 401(k) of theInternal Revenue Code, is a defined contribution plan. Additionally, we have a non-qualified deferred-compensation plan, the FMCTechnologies, Inc. Non-Qualified Savings and Investment Plan (“Non-Qualified Plan”), which allows certain highly compensated employeesthe option to defer the receipt of a portion of their salary. We match a portion of the participants’ deferrals to both plans.
Participants in the Non-Qualified Plan earn a return based on hypothetical investments in the same options as our 401(k) plan, includingFMC Technologies stock. Changes in the market value of these participant investments are reflected as an adjustment to the deferred-compensation liability with an offset to compensation expense. As of December 31, 2007 and 2006, our liability for the Non-QualifiedPlan was $38.0 million and $27.7 million, respectively, and was recorded in other non-current liabilities. We hedge the financial impactof changes in the participants’ hypothetical investments by purchasing the investments that the participants have chosen. With theexception of FMC Technologies stock, which is maintained at its cost basis, changes in the fair value of these investments arerecognized as an offset to compensation expense. As of December 31, 2007 and 2006, we had investments for the Non-Qualified Plantotaling $28.3 million and $20.7 million, respectively, at fair market value and FMC Technologies stock held in trust of $5.4 million and$4.5 million, respectively, at its cost basis.
We recognized expense of $13.5 million, $12.7 million and $11.1 million for matching contributions to these plans in 2007, 2006 and2005, respectively.
NOTE 12. STOCK-BASED COMPENSATION
We sponsor a stock-based compensation plan, which is described below, and have granted awards primarily in the form of nonvestedstock awards (also known as restricted stock in the plan document) and stock options. The compensation expense for awards under theplan for each of the years in the three-year period ended December 31, 2007, is as follows:
(In millions) 2007 2006 2005
Stock-based compensation expenseRestricted stock $ 24.2 $ 18.1 $ 12.0Stock options — 1.6 3.7Other 1.7 1.2 0.8
Total stock-based compensation expense $ 25.9 $ 20.9 $ 16.5
Income tax benefits related to stock-based compensation expense $ 9.6 $ 8.2 $ 6.4
Stock-based compensation expense is recognized over the lesser of the stated vesting period (three or four years) or the period until theemployee reaches age 62 (the retirement eligible age under the plan). As of December 31, 2007, a portion of the stock-basedcompensation expense related to outstanding awards remains to be recognized in future periods. The compensation expense related tononvested awards yet to be recognized totaled $30.3 million for restricted stock. These costs are expected to be recognized over aweighted average period of 1.5 years.
Incentive compensation and stock plan—
The FMC Technologies, Inc. Incentive Compensation and Stock Plan (the “Plan”) provides certain incentives and awards to officers,employees, directors and consultants of FMC Technologies or its affiliates. The Plan allows our Board of Directors (the “Board”) to makevarious types of awards to non-employee directors and the Compensation Committee (the “Committee”) of the Board to make varioustypes of awards to other eligible individuals. Awards include management incentive awards, common stock, stock options, stockappreciation rights, restricted stock and stock units. All awards are subject to the Plan’s provisions.
66
Fina
ncia
l Sta
tem
ents
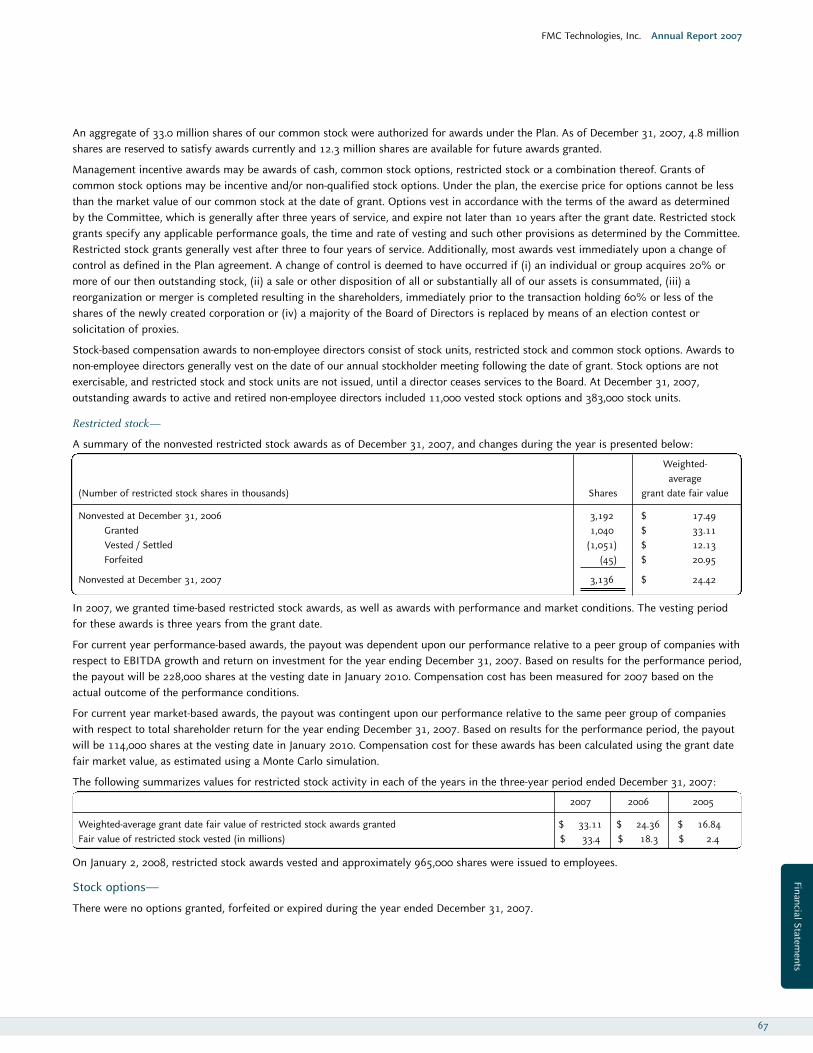
FMC Technologies, Inc. Annual Report 2007
An aggregate of 33.0 million shares of our common stock were authorized for awards under the Plan. As of December 31, 2007, 4.8 millionshares are reserved to satisfy awards currently and 12.3 million shares are available for future awards granted.
Management incentive awards may be awards of cash, common stock options, restricted stock or a combination thereof. Grants ofcommon stock options may be incentive and/or non-qualified stock options. Under the plan, the exercise price for options cannot be lessthan the market value of our common stock at the date of grant. Options vest in accordance with the terms of the award as determinedby the Committee, which is generally after three years of service, and expire not later than 10 years after the grant date. Restricted stockgrants specify any applicable performance goals, the time and rate of vesting and such other provisions as determined by the Committee.Restricted stock grants generally vest after three to four years of service. Additionally, most awards vest immediately upon a change ofcontrol as defined in the Plan agreement. A change of control is deemed to have occurred if (i) an individual or group acquires 20% ormore of our then outstanding stock, (ii) a sale or other disposition of all or substantially all of our assets is consummated, (iii) areorganization or merger is completed resulting in the shareholders, immediately prior to the transaction holding 60% or less of theshares of the newly created corporation or (iv) a majority of the Board of Directors is replaced by means of an election contest orsolicitation of proxies.
Stock-based compensation awards to non-employee directors consist of stock units, restricted stock and common stock options. Awards tonon-employee directors generally vest on the date of our annual stockholder meeting following the date of grant. Stock options are notexercisable, and restricted stock and stock units are not issued, until a director ceases services to the Board. At December 31, 2007,outstanding awards to active and retired non-employee directors included 11,000 vested stock options and 383,000 stock units.
Restricted stock—
A summary of the nonvested restricted stock awards as of December 31, 2007, and changes during the year is presented below:
Weighted-average
(Number of restricted stock shares in thousands) Shares grant date fair value
Nonvested at December 31, 2006 3,192 $ 17.49Granted 1,040 $ 33.11Vested / Settled (1,051) $ 12.13Forfeited (45) $ 20.95
Nonvested at December 31, 2007 3,136 $ 24.42
In 2007, we granted time-based restricted stock awards, as well as awards with performance and market conditions. The vesting periodfor these awards is three years from the grant date.
For current year performance-based awards, the payout was dependent upon our performance relative to a peer group of companies withrespect to EBITDA growth and return on investment for the year ending December 31, 2007. Based on results for the performance period,the payout will be 228,000 shares at the vesting date in January 2010. Compensation cost has been measured for 2007 based on theactual outcome of the performance conditions.
For current year market-based awards, the payout was contingent upon our performance relative to the same peer group of companieswith respect to total shareholder return for the year ending December 31, 2007. Based on results for the performance period, the payoutwill be 114,000 shares at the vesting date in January 2010. Compensation cost for these awards has been calculated using the grant datefair market value, as estimated using a Monte Carlo simulation.
The following summarizes values for restricted stock activity in each of the years in the three-year period ended December 31, 2007:
2007 2006 2005
Weighted-average grant date fair value of restricted stock awards granted $ 33.11 $ 24.36 $ 16.84Fair value of restricted stock vested (in millions) $ 33.4 $ 18.3 $ 2.4
On January 2, 2008, restricted stock awards vested and approximately 965,000 shares were issued to employees.
Stock options—
There were no options granted, forfeited or expired during the year ended December 31, 2007.
67
Financial Statements
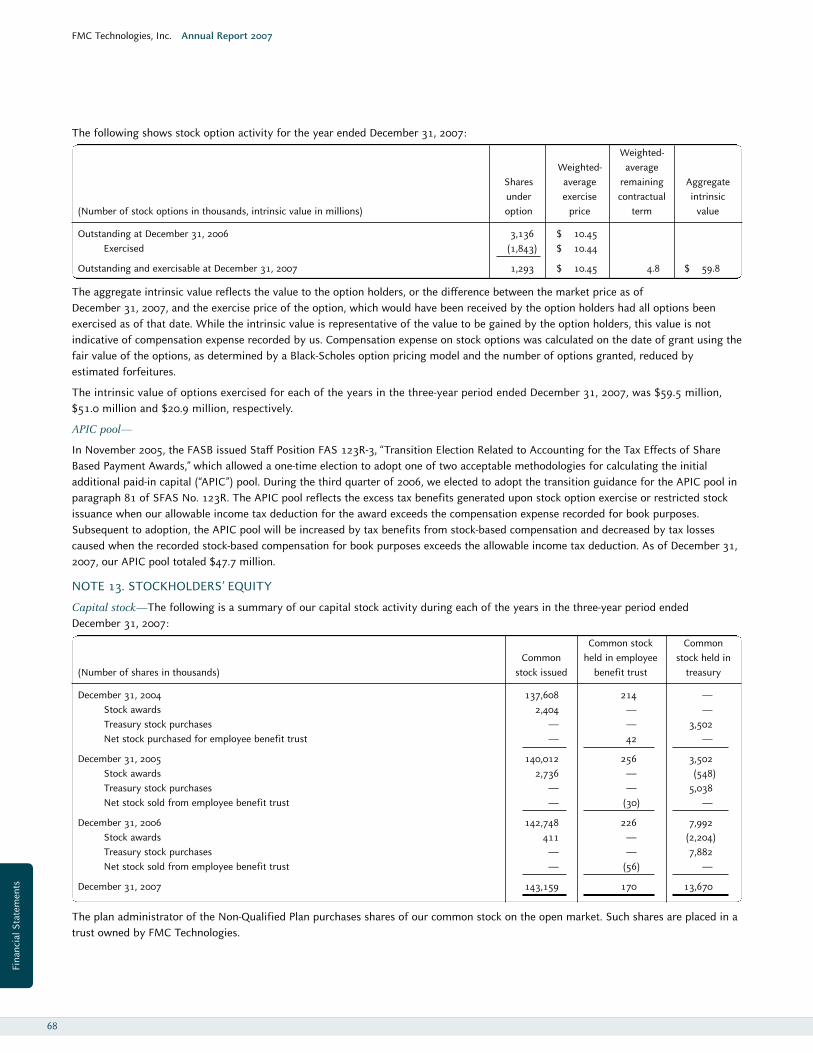
The following shows stock option activity for the year ended December 31, 2007:
Weighted- Weighted- average
Shares average remaining Aggregateunder exercise contractual intrinsic
(Number of stock options in thousands, intrinsic value in millions) option price term value
Outstanding at December 31, 2006 3,136 $ 10.45Exercised (1,843) $ 10.44
Outstanding and exercisable at December 31, 2007 1,293 $ 10.45 4.8 $ 59.8
The aggregate intrinsic value reflects the value to the option holders, or the difference between the market price as of December 31, 2007, and the exercise price of the option, which would have been received by the option holders had all options beenexercised as of that date. While the intrinsic value is representative of the value to be gained by the option holders, this value is notindicative of compensation expense recorded by us. Compensation expense on stock options was calculated on the date of grant using thefair value of the options, as determined by a Black-Scholes option pricing model and the number of options granted, reduced byestimated forfeitures.
The intrinsic value of options exercised for each of the years in the three-year period ended December 31, 2007, was $59.5 million,$51.0 million and $20.9 million, respectively.
APIC pool—
In November 2005, the FASB issued Staff Position FAS 123R-3, “Transition Election Related to Accounting for the Tax Effects of ShareBased Payment Awards,” which allowed a one-time election to adopt one of two acceptable methodologies for calculating the initialadditional paid-in capital (“APIC”) pool. During the third quarter of 2006, we elected to adopt the transition guidance for the APIC pool inparagraph 81 of SFAS No. 123R. The APIC pool reflects the excess tax benefits generated upon stock option exercise or restricted stockissuance when our allowable income tax deduction for the award exceeds the compensation expense recorded for book purposes.Subsequent to adoption, the APIC pool will be increased by tax benefits from stock-based compensation and decreased by tax lossescaused when the recorded stock-based compensation for book purposes exceeds the allowable income tax deduction. As of December 31,2007, our APIC pool totaled $47.7 million.
NOTE 13. STOCKHOLDERS’ EQUITY
Capital stock—The following is a summary of our capital stock activity during each of the years in the three-year period ended December 31, 2007:
Common stock CommonCommon held in employee stock held in
(Number of shares in thousands) stock issued benefit trust treasury
December 31, 2004 137,608 214 —Stock awards 2,404 — —Treasury stock purchases — — 3,502Net stock purchased for employee benefit trust — 42 —
December 31, 2005 140,012 256 3,502Stock awards 2,736 — (548)Treasury stock purchases — — 5,038Net stock sold from employee benefit trust — (30) —
December 31, 2006 142,748 226 7,992Stock awards 411 — (2,204)Treasury stock purchases — — 7,882Net stock sold from employee benefit trust — (56) —
December 31, 2007 143,159 170 13,670
The plan administrator of the Non-Qualified Plan purchases shares of our common stock on the open market. Such shares are placed in atrust owned by FMC Technologies.
FMC Technologies, Inc. Annual Report 2007
68
Fina
ncia
l Sta
tem
ents
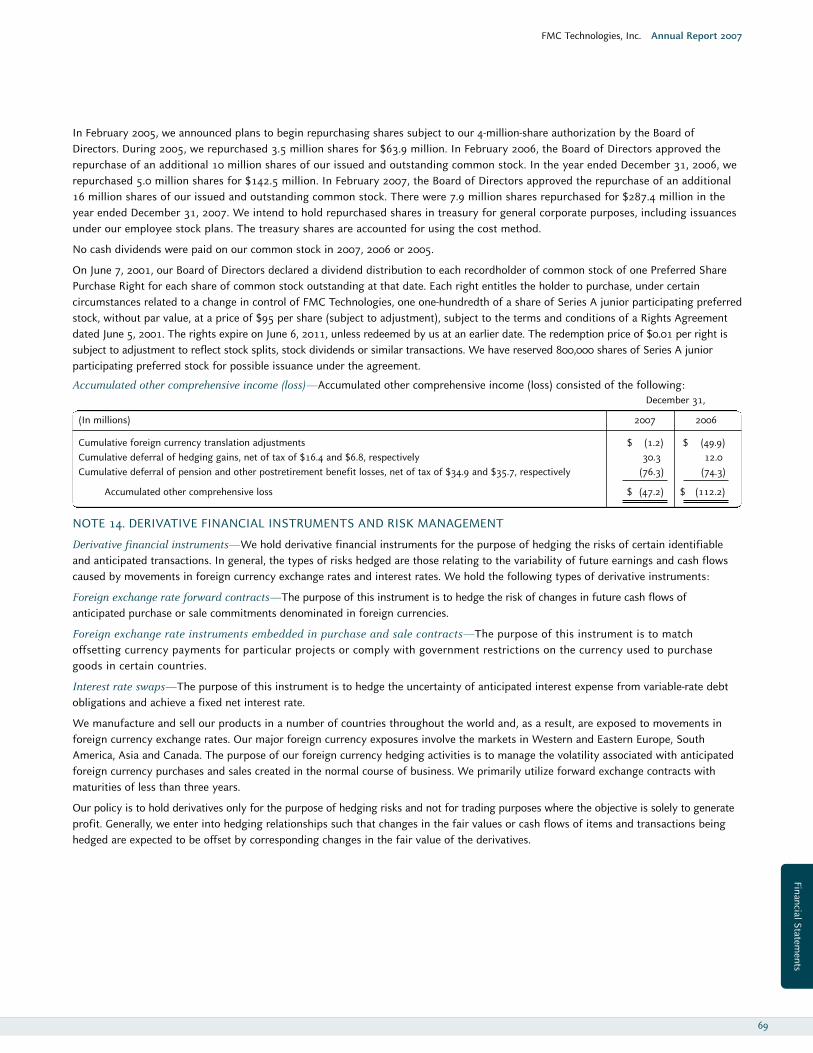
FMC Technologies, Inc. Annual Report 2007
In February 2005, we announced plans to begin repurchasing shares subject to our 4-million-share authorization by the Board ofDirectors. During 2005, we repurchased 3.5 million shares for $63.9 million. In February 2006, the Board of Directors approved therepurchase of an additional 10 million shares of our issued and outstanding common stock. In the year ended December 31, 2006, werepurchased 5.0 million shares for $142.5 million. In February 2007, the Board of Directors approved the repurchase of an additional16 million shares of our issued and outstanding common stock. There were 7.9 million shares repurchased for $287.4 million in theyear ended December 31, 2007. We intend to hold repurchased shares in treasury for general corporate purposes, including issuancesunder our employee stock plans. The treasury shares are accounted for using the cost method.
No cash dividends were paid on our common stock in 2007, 2006 or 2005.
On June 7, 2001, our Board of Directors declared a dividend distribution to each recordholder of common stock of one Preferred SharePurchase Right for each share of common stock outstanding at that date. Each right entitles the holder to purchase, under certaincircumstances related to a change in control of FMC Technologies, one one-hundredth of a share of Series A junior participating preferredstock, without par value, at a price of $95 per share (subject to adjustment), subject to the terms and conditions of a Rights Agreementdated June 5, 2001. The rights expire on June 6, 2011, unless redeemed by us at an earlier date. The redemption price of $0.01 per right issubject to adjustment to reflect stock splits, stock dividends or similar transactions. We have reserved 800,000 shares of Series A juniorparticipating preferred stock for possible issuance under the agreement.
Accumulated other comprehensive income (loss)—Accumulated other comprehensive income (loss) consisted of the following:December 31,
(In millions) 2007 2006
Cumulative foreign currency translation adjustments $ (1.2) $ (49.9)Cumulative deferral of hedging gains, net of tax of $16.4 and $6.8, respectively 30.3 12.0Cumulative deferral of pension and other postretirement benefit losses, net of tax of $34.9 and $35.7, respectively (76.3) (74.3)
Accumulated other comprehensive loss $ (47.2) $ (112.2)
NOTE 14. DERIVATIVE FINANCIAL INSTRUMENTS AND RISK MANAGEMENT
Derivative financial instruments—We hold derivative financial instruments for the purpose of hedging the risks of certain identifiableand anticipated transactions. In general, the types of risks hedged are those relating to the variability of future earnings and cash flowscaused by movements in foreign currency exchange rates and interest rates. We hold the following types of derivative instruments:
Foreign exchange rate forward contracts—The purpose of this instrument is to hedge the risk of changes in future cash flows ofanticipated purchase or sale commitments denominated in foreign currencies.
Foreign exchange rate instruments embedded in purchase and sale contracts—The purpose of this instrument is to matchoffsetting currency payments for particular projects or comply with government restrictions on the currency used to purchasegoods in certain countries.
Interest rate swaps—The purpose of this instrument is to hedge the uncertainty of anticipated interest expense from variable-rate debtobligations and achieve a fixed net interest rate.
We manufacture and sell our products in a number of countries throughout the world and, as a result, are exposed to movements inforeign currency exchange rates. Our major foreign currency exposures involve the markets in Western and Eastern Europe, SouthAmerica, Asia and Canada. The purpose of our foreign currency hedging activities is to manage the volatility associated with anticipatedforeign currency purchases and sales created in the normal course of business. We primarily utilize forward exchange contracts withmaturities of less than three years.
Our policy is to hold derivatives only for the purpose of hedging risks and not for trading purposes where the objective is solely to generateprofit. Generally, we enter into hedging relationships such that changes in the fair values or cash flows of items and transactions beinghedged are expected to be offset by corresponding changes in the fair value of the derivatives.
69
Financial Statements
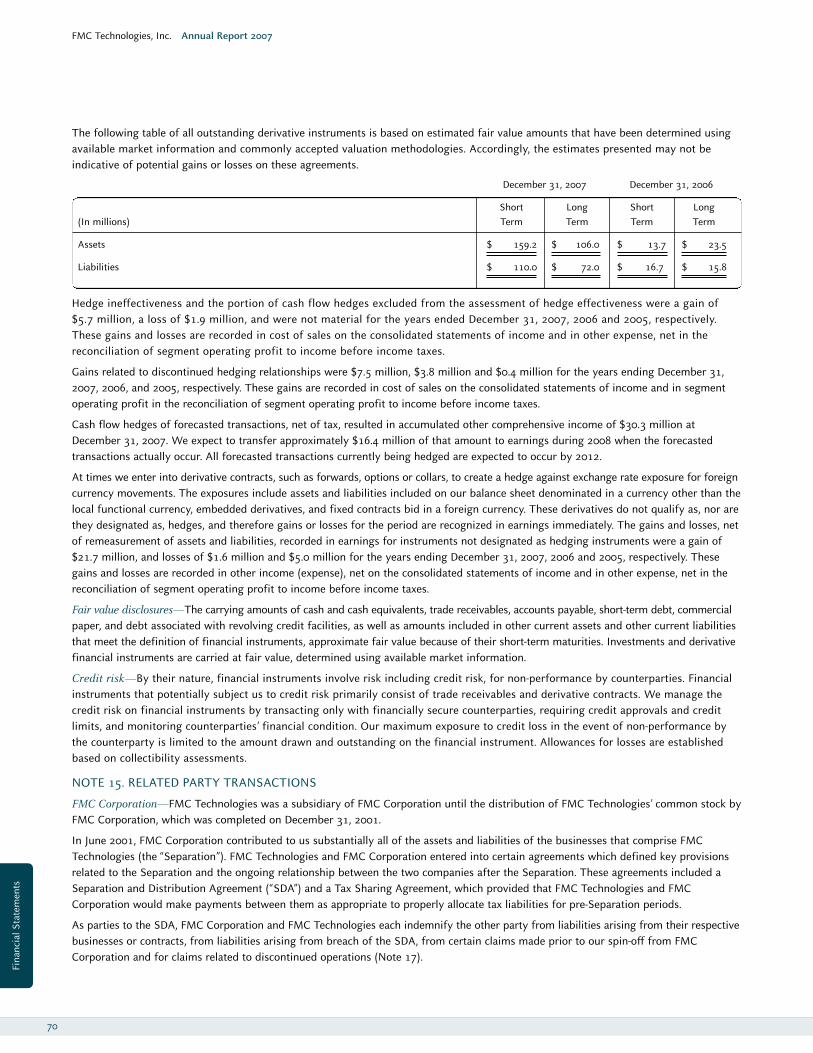
FMC Technologies, Inc. Annual Report 2007
The following table of all outstanding derivative instruments is based on estimated fair value amounts that have been determined usingavailable market information and commonly accepted valuation methodologies. Accordingly, the estimates presented may not beindicative of potential gains or losses on these agreements.
December 31, 2007 December 31, 2006
Short Long Short Long(In millions) Term Term Term Term
Assets $ 159.2 $ 106.0 $ 13.7 $ 23.5
Liabilities $ 110.0 $ 72.0 $ 16.7 $ 15.8
Hedge ineffectiveness and the portion of cash flow hedges excluded from the assessment of hedge effectiveness were a gain of$5.7 million, a loss of $1.9 million, and were not material for the years ended December 31, 2007, 2006 and 2005, respectively.These gains and losses are recorded in cost of sales on the consolidated statements of income and in other expense, net in thereconciliation of segment operating profit to income before income taxes.
Gains related to discontinued hedging relationships were $7.5 million, $3.8 million and $0.4 million for the years ending December 31,2007, 2006, and 2005, respectively. These gains are recorded in cost of sales on the consolidated statements of income and in segmentoperating profit in the reconciliation of segment operating profit to income before income taxes.
Cash flow hedges of forecasted transactions, net of tax, resulted in accumulated other comprehensive income of $30.3 million atDecember 31, 2007. We expect to transfer approximately $16.4 million of that amount to earnings during 2008 when the forecastedtransactions actually occur. All forecasted transactions currently being hedged are expected to occur by 2012.
At times we enter into derivative contracts, such as forwards, options or collars, to create a hedge against exchange rate exposure for foreigncurrency movements. The exposures include assets and liabilities included on our balance sheet denominated in a currency other than thelocal functional currency, embedded derivatives, and fixed contracts bid in a foreign currency. These derivatives do not qualify as, nor arethey designated as, hedges, and therefore gains or losses for the period are recognized in earnings immediately. The gains and losses, netof remeasurement of assets and liabilities, recorded in earnings for instruments not designated as hedging instruments were a gain of$21.7 million, and losses of $1.6 million and $5.0 million for the years ending December 31, 2007, 2006 and 2005, respectively. Thesegains and losses are recorded in other income (expense), net on the consolidated statements of income and in other expense, net in thereconciliation of segment operating profit to income before income taxes.
Fair value disclosures—The carrying amounts of cash and cash equivalents, trade receivables, accounts payable, short-term debt, commercialpaper, and debt associated with revolving credit facilities, as well as amounts included in other current assets and other current liabilitiesthat meet the definition of financial instruments, approximate fair value because of their short-term maturities. Investments and derivativefinancial instruments are carried at fair value, determined using available market information.
Credit risk—By their nature, financial instruments involve risk including credit risk, for non-performance by counterparties. Financialinstruments that potentially subject us to credit risk primarily consist of trade receivables and derivative contracts. We manage thecredit risk on financial instruments by transacting only with financially secure counterparties, requiring credit approvals and creditlimits, and monitoring counterparties’ financial condition. Our maximum exposure to credit loss in the event of non-performance bythe counterparty is limited to the amount drawn and outstanding on the financial instrument. Allowances for losses are establishedbased on collectibility assessments.
NOTE 15. RELATED PARTY TRANSACTIONS
FMC Corporation—FMC Technologies was a subsidiary of FMC Corporation until the distribution of FMC Technologies’ common stock byFMC Corporation, which was completed on December 31, 2001.
In June 2001, FMC Corporation contributed to us substantially all of the assets and liabilities of the businesses that comprise FMCTechnologies (the “Separation”). FMC Technologies and FMC Corporation entered into certain agreements which defined key provisionsrelated to the Separation and the ongoing relationship between the two companies after the Separation. These agreements included aSeparation and Distribution Agreement (“SDA”) and a Tax Sharing Agreement, which provided that FMC Technologies and FMCCorporation would make payments between them as appropriate to properly allocate tax liabilities for pre-Separation periods.
As parties to the SDA, FMC Corporation and FMC Technologies each indemnify the other party from liabilities arising from their respectivebusinesses or contracts, from liabilities arising from breach of the SDA, from certain claims made prior to our spin-off from FMCCorporation and for claims related to discontinued operations (Note 17).
70
Fina
ncia
l Sta
tem
ents
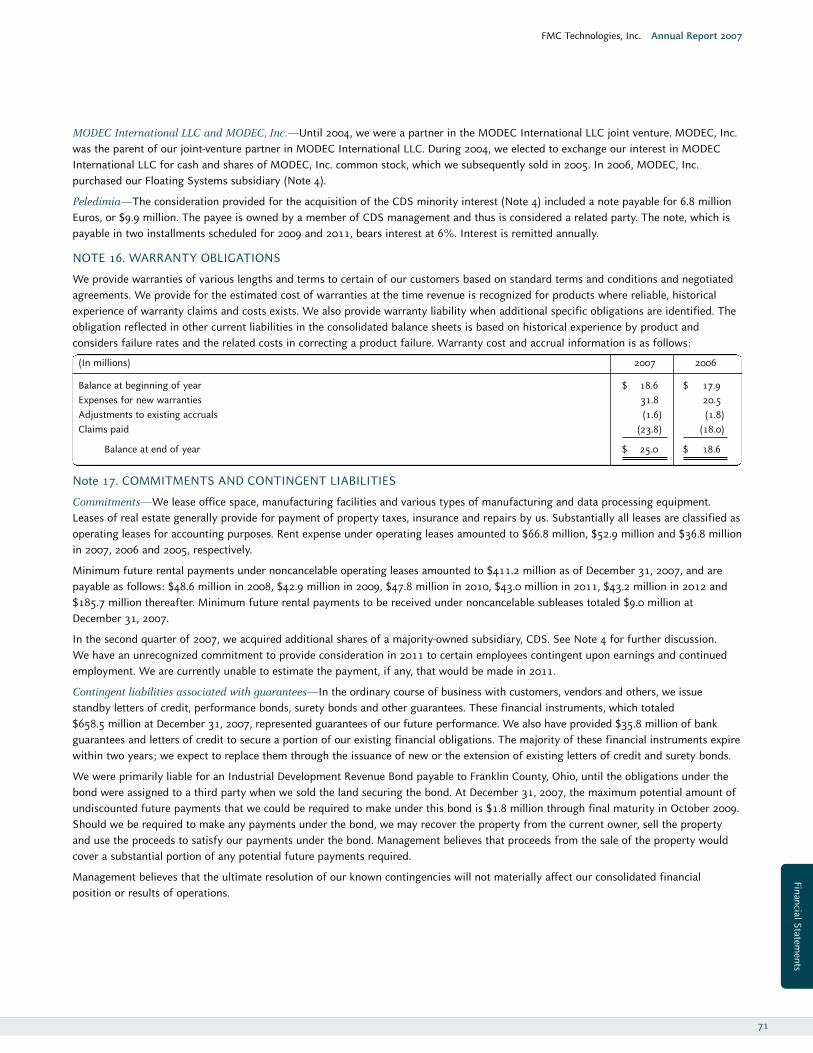
FMC Technologies, Inc. Annual Report 2007
MODEC International LLC and MODEC, Inc.—Until 2004, we were a partner in the MODEC International LLC joint venture. MODEC, Inc.was the parent of our joint-venture partner in MODEC International LLC. During 2004, we elected to exchange our interest in MODECInternational LLC for cash and shares of MODEC, Inc. common stock, which we subsequently sold in 2005. In 2006, MODEC, Inc.purchased our Floating Systems subsidiary (Note 4).
Peledimia—The consideration provided for the acquisition of the CDS minority interest (Note 4) included a note payable for 6.8 millionEuros, or $9.9 million. The payee is owned by a member of CDS management and thus is considered a related party. The note, which ispayable in two installments scheduled for 2009 and 2011, bears interest at 6%. Interest is remitted annually.
NOTE 16. WARRANTY OBLIGATIONS
We provide warranties of various lengths and terms to certain of our customers based on standard terms and conditions and negotiatedagreements. We provide for the estimated cost of warranties at the time revenue is recognized for products where reliable, historicalexperience of warranty claims and costs exists. We also provide warranty liability when additional specific obligations are identified. Theobligation reflected in other current liabilities in the consolidated balance sheets is based on historical experience by product andconsiders failure rates and the related costs in correcting a product failure. Warranty cost and accrual information is as follows:
(In millions) 2007 2006
Balance at beginning of year $ 18.6 $ 17.9Expenses for new warranties 31.8 20.5Adjustments to existing accruals (1.6) (1.8)Claims paid (23.8) (18.0)
Balance at end of year $ 25.0 $ 18.6
Note 17. COMMITMENTS AND CONTINGENT LIABILITIES
Commitments—We lease office space, manufacturing facilities and various types of manufacturing and data processing equipment.Leases of real estate generally provide for payment of property taxes, insurance and repairs by us. Substantially all leases are classified asoperating leases for accounting purposes. Rent expense under operating leases amounted to $66.8 million, $52.9 million and $36.8 millionin 2007, 2006 and 2005, respectively.
Minimum future rental payments under noncancelable operating leases amounted to $411.2 million as of December 31, 2007, and arepayable as follows: $48.6 million in 2008, $42.9 million in 2009, $47.8 million in 2010, $43.0 million in 2011, $43.2 million in 2012 and$185.7 million thereafter. Minimum future rental payments to be received under noncancelable subleases totaled $9.0 million atDecember 31, 2007.
In the second quarter of 2007, we acquired additional shares of a majority-owned subsidiary, CDS. See Note 4 for further discussion. We have an unrecognized commitment to provide consideration in 2011 to certain employees contingent upon earnings and continuedemployment. We are currently unable to estimate the payment, if any, that would be made in 2011.
Contingent liabilities associated with guarantees—In the ordinary course of business with customers, vendors and others, we issuestandby letters of credit, performance bonds, surety bonds and other guarantees. These financial instruments, which totaled $658.5 million at December 31, 2007, represented guarantees of our future performance. We also have provided $35.8 million of bankguarantees and letters of credit to secure a portion of our existing financial obligations. The majority of these financial instruments expirewithin two years; we expect to replace them through the issuance of new or the extension of existing letters of credit and surety bonds.
We were primarily liable for an Industrial Development Revenue Bond payable to Franklin County, Ohio, until the obligations under thebond were assigned to a third party when we sold the land securing the bond. At December 31, 2007, the maximum potential amount ofundiscounted future payments that we could be required to make under this bond is $1.8 million through final maturity in October 2009.Should we be required to make any payments under the bond, we may recover the property from the current owner, sell the propertyand use the proceeds to satisfy our payments under the bond. Management believes that proceeds from the sale of the property wouldcover a substantial portion of any potential future payments required.
Management believes that the ultimate resolution of our known contingencies will not materially affect our consolidated financialposition or results of operations.
71
Financial Statements
FMC Technologies, Inc. Annual Report 2007
Contingent liabilities associated with legal matters—We are named defendants in a number of multi-defendant, multi-plaintiff tort lawsuits.Under the SDA with FMC Corporation, which contains key provisions relating to our 2001 spin-off from FMC Corporation, FMCCorporation is required to indemnify us for certain claims made prior to the spin-off, as well as for other claims related to discontinuedoperations. We expect that FMC Corporation will bear responsibility for the majority of these claims. Claims of this nature have also beenasserted subsequent to the spin-off. While the ultimate responsibility for all of these claims cannot yet be determined due to lack ofidentification of the products or premises involved, we also expect that FMC Corporation will bear responsibility for a majority of theseclaims initiated subsequent to the spin-off.
While the results of litigation cannot be predicted with certainty, management believes that the most probable, ultimate resolution ofthese matters will not have a material adverse effect on our consolidated financial position or results of operations and cash flows.
NOTE 18. BUSINESS SEGMENTS
Our determination of our four reportable segments was made on the basis of our strategic business units and the commonalities amongthe products and services within each segment, and corresponds to the manner in which our management reviews and evaluates operatingperformance. We have combined certain similar operating segments that meet applicable criteria established under SFAS No. 131,“Disclosures about Segments of an Enterprise and Related Information.”
Our reportable segments are:
• Energy Production Systems - designs and manufactures systems and provides services used by oil and gas companies involved inland and offshore, particularly deepwater, exploration and production of crude oil and gas.
• Energy Processing Systems - designs, manufactures and supplies technologically advanced high-pressure valves and fittings foroilfield service customers; also manufactures and supplies liquid and gas measurement and transportation equipment andsystems to customers involved in the production, transportation and processing of crude oil, natural gas and petroleum-basedrefined products.
• FoodTech - designs, manufactures and services technologically sophisticated food processing and handling systems used for, amongother things, fruit juice production, frozen food production, shelf-stable food production and convenience food preparation by thefood industry.
• Airport Systems - designs, manufactures and services technologically advanced equipment and systems primarily for commercialairlines, air freight companies and airports.
Total revenue by segment includes intersegment sales, which are made at prices approximating those that the selling entity is able toobtain on external sales. Segment operating profit is defined as total segment revenue less segment operating expenses. The followingitems have been excluded in computing segment operating profit: corporate staff expense, net interest income (expense) associated withcorporate debt facilities and investments, income taxes and other expense, net.
72
Fina
ncia
l Sta
tem
ents
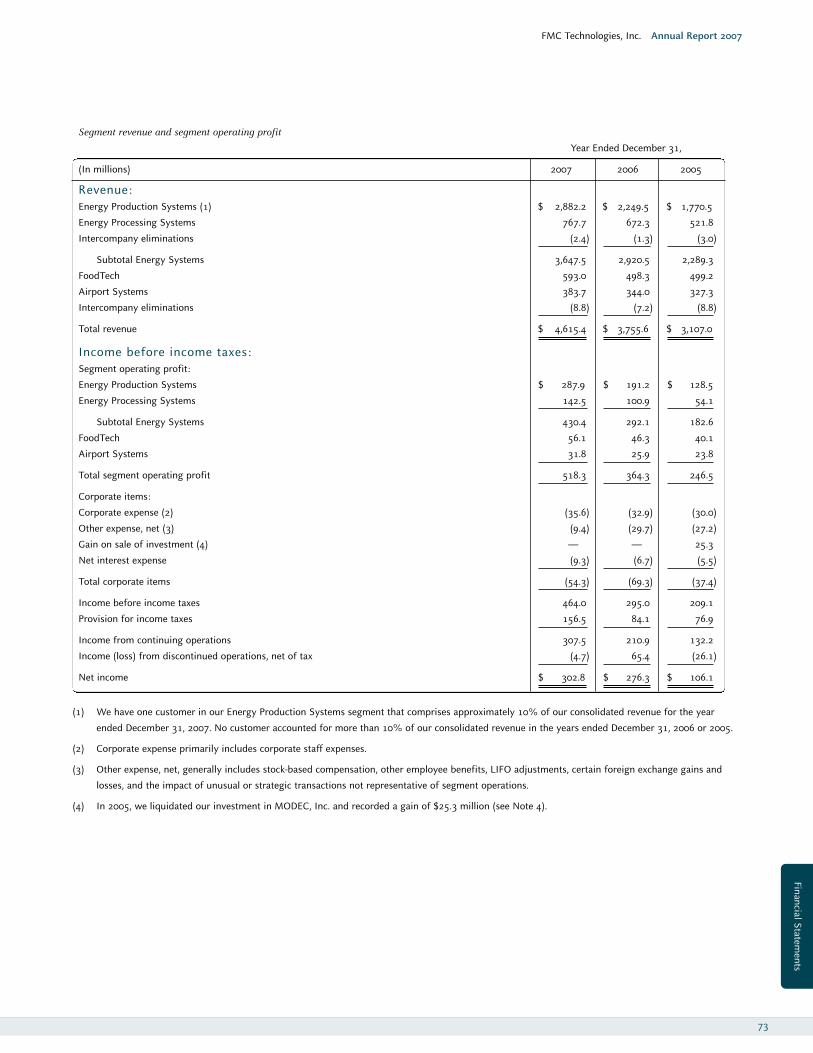
FMC Technologies, Inc. Annual Report 2007
Segment revenue and segment operating profit
Year Ended December 31,
(In millions) 2007 2006 2005
Revenue:Energy Production Systems (1) $ 2,882.2 $ 2,249.5 $ 1,770.5
Energy Processing Systems 767.7 672.3 521.8
Intercompany eliminations (2.4) (1.3) (3.0)
Subtotal Energy Systems 3,647.5 2,920.5 2,289.3
FoodTech 593.0 498.3 499.2
Airport Systems 383.7 344.0 327.3
Intercompany eliminations (8.8) (7.2) (8.8)
Total revenue $ 4,615.4 $ 3,755.6 $ 3,107.0
Income before income taxes:Segment operating profit:
Energy Production Systems $ 287.9 $ 191.2 $ 128.5
Energy Processing Systems 142.5 100.9 54.1
Subtotal Energy Systems 430.4 292.1 182.6
FoodTech 56.1 46.3 40.1
Airport Systems 31.8 25.9 23.8
Total segment operating profit 518.3 364.3 246.5
Corporate items:
Corporate expense (2) (35.6) (32.9) (30.0)
Other expense, net (3) (9.4) (29.7) (27.2)
Gain on sale of investment (4) — — 25.3
Net interest expense (9.3) (6.7) (5.5)
Total corporate items (54.3) (69.3) (37.4)
Income before income taxes 464.0 295.0 209.1
Provision for income taxes 156.5 84.1 76.9
Income from continuing operations 307.5 210.9 132.2
Income (loss) from discontinued operations, net of tax (4.7) 65.4 (26.1)
Net income $ 302.8 $ 276.3 $ 106.1
(1) We have one customer in our Energy Production Systems segment that comprises approximately 10% of our consolidated revenue for the year
ended December 31, 2007. No customer accounted for more than 10% of our consolidated revenue in the years ended December 31, 2006 or 2005.
(2) Corporate expense primarily includes corporate staff expenses.
(3) Other expense, net, generally includes stock-based compensation, other employee benefits, LIFO adjustments, certain foreign exchange gains and
losses, and the impact of unusual or strategic transactions not representative of segment operations.
(4) In 2005, we liquidated our investment in MODEC, Inc. and recorded a gain of $25.3 million (see Note 4).
73
Financial Statements
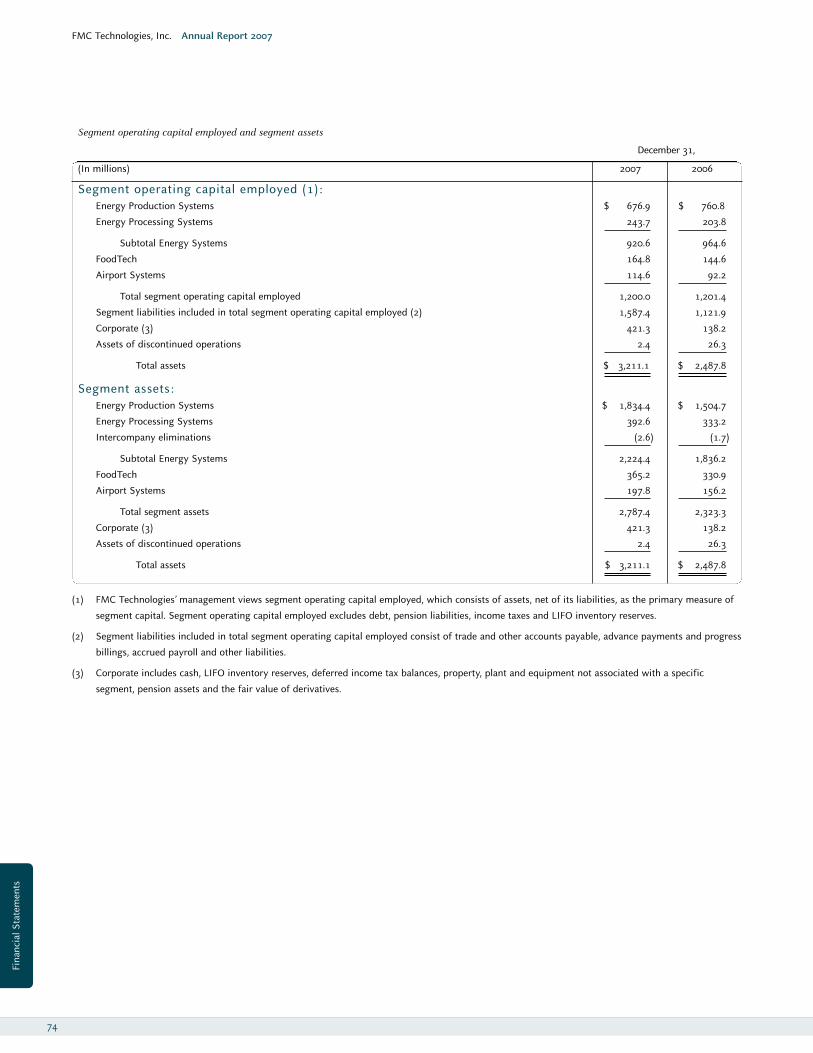
FMC Technologies, Inc. Annual Report 2007
Segment operating capital employed and segment assets
December 31,
(In millions) 2007 2006
Segment operating capital employed (1):Energy Production Systems $ 676.9 $ 760.8
Energy Processing Systems 243.7 203.8
Subtotal Energy Systems 920.6 964.6
FoodTech 164.8 144.6
Airport Systems 114.6 92.2
Total segment operating capital employed 1,200.0 1,201.4
Segment liabilities included in total segment operating capital employed (2) 1,587.4 1,121.9
Corporate (3) 421.3 138.2
Assets of discontinued operations 2.4 26.3
Total assets $ 3,211.1 $ 2,487.8
Segment assets:Energy Production Systems $ 1,834.4 $ 1,504.7
Energy Processing Systems 392.6 333.2
Intercompany eliminations (2.6) (1.7)
Subtotal Energy Systems 2,224.4 1,836.2
FoodTech 365.2 330.9
Airport Systems 197.8 156.2
Total segment assets 2,787.4 2,323.3
Corporate (3) 421.3 138.2
Assets of discontinued operations 2.4 26.3
Total assets $ 3,211.1 $ 2,487.8
(1) FMC Technologies’ management views segment operating capital employed, which consists of assets, net of its liabilities, as the primary measure of
segment capital. Segment operating capital employed excludes debt, pension liabilities, income taxes and LIFO inventory reserves.
(2) Segment liabilities included in total segment operating capital employed consist of trade and other accounts payable, advance payments and progress
billings, accrued payroll and other liabilities.
(3) Corporate includes cash, LIFO inventory reserves, deferred income tax balances, property, plant and equipment not associated with a specific
segment, pension assets and the fair value of derivatives.
74
Fina
ncia
l Sta
tem
ents
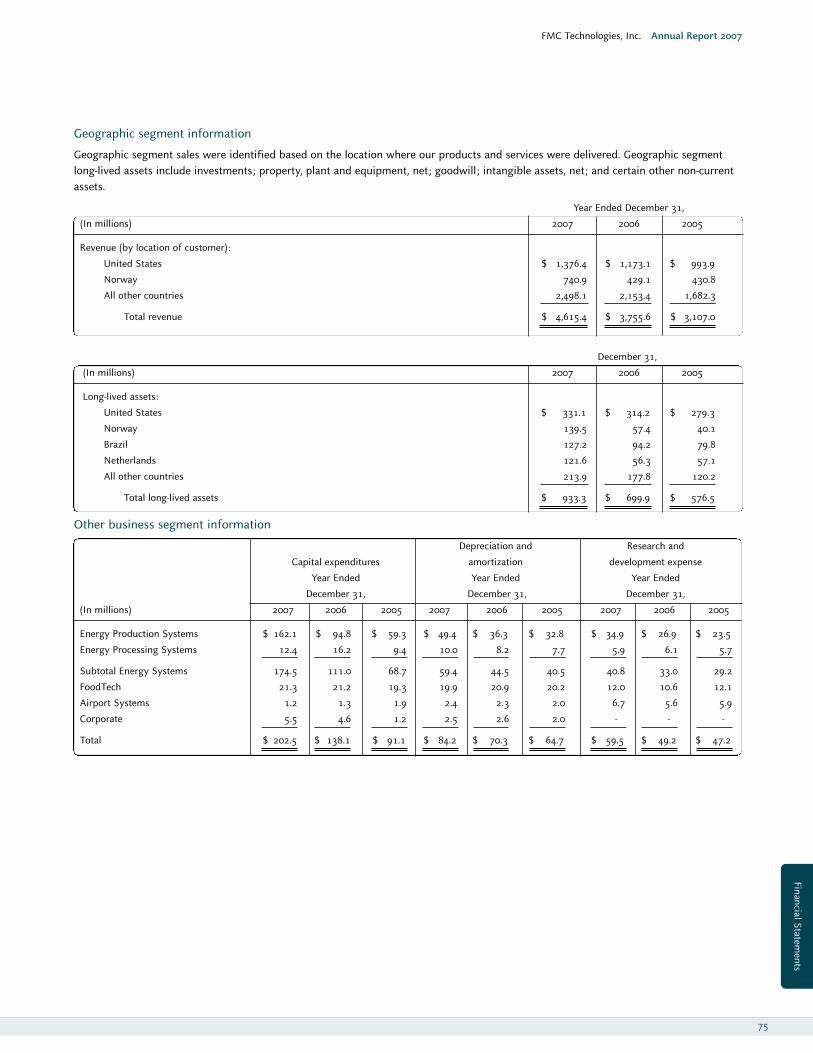
Geographic segment information
Geographic segment sales were identified based on the location where our products and services were delivered. Geographic segmentlong-lived assets include investments; property, plant and equipment, net; goodwill; intangible assets, net; and certain other non-currentassets.
Year Ended December 31,
(In millions) 2007 2006 2005
Revenue (by location of customer):
United States $ 1,376.4 $ 1,173.1 $ 993.9
Norway 740.9 429.1 430.8
All other countries 2,498.1 2,153.4 1,682.3
Total revenue $ 4,615.4 $ 3,755.6 $ 3,107.0
December 31,
(In millions) 2007 2006 2005
Long-lived assets:
United States $ 331.1 $ 314.2 $ 279.3
Norway 139.5 57.4 40.1
Brazil 127.2 94.2 79.8
Netherlands 121.6 56.3 57.1
All other countries 213.9 177.8 120.2
Total long-lived assets $ 933.3 $ 699.9 $ 576.5
Other business segment information
Depreciation and Research and
Capital expenditures amortization development expense
Year Ended Year Ended Year Ended
December 31, December 31, December 31,
(In millions) 2007 2006 2005 2007 2006 2005 2007 2006 2005
Energy Production Systems $ 162.1 $ 94.8 $ 59.3 $ 49.4 $ 36.3 $ 32.8 $ 34.9 $ 26.9 $ 23.5
Energy Processing Systems 12.4 16.2 9.4 10.0 8.2 7.7 5.9 6.1 5.7
Subtotal Energy Systems 174.5 111.0 68.7 59.4 44.5 40.5 40.8 33.0 29.2
FoodTech 21.3 21.2 19.3 19.9 20.9 20.2 12.0 10.6 12.1
Airport Systems 1.2 1.3 1.9 2.4 2.3 2.0 6.7 5.6 5.9
Corporate 5.5 4.6 1.2 2.5 2.6 2.0 - - -
Total $ 202.5 $ 138.1 $ 91.1 $ 84.2 $ 70.3 $ 64.7 $ 59.5 $ 49.2 $ 47.2
FMC Technologies, Inc. Annual Report 2007
75
Financial Statements
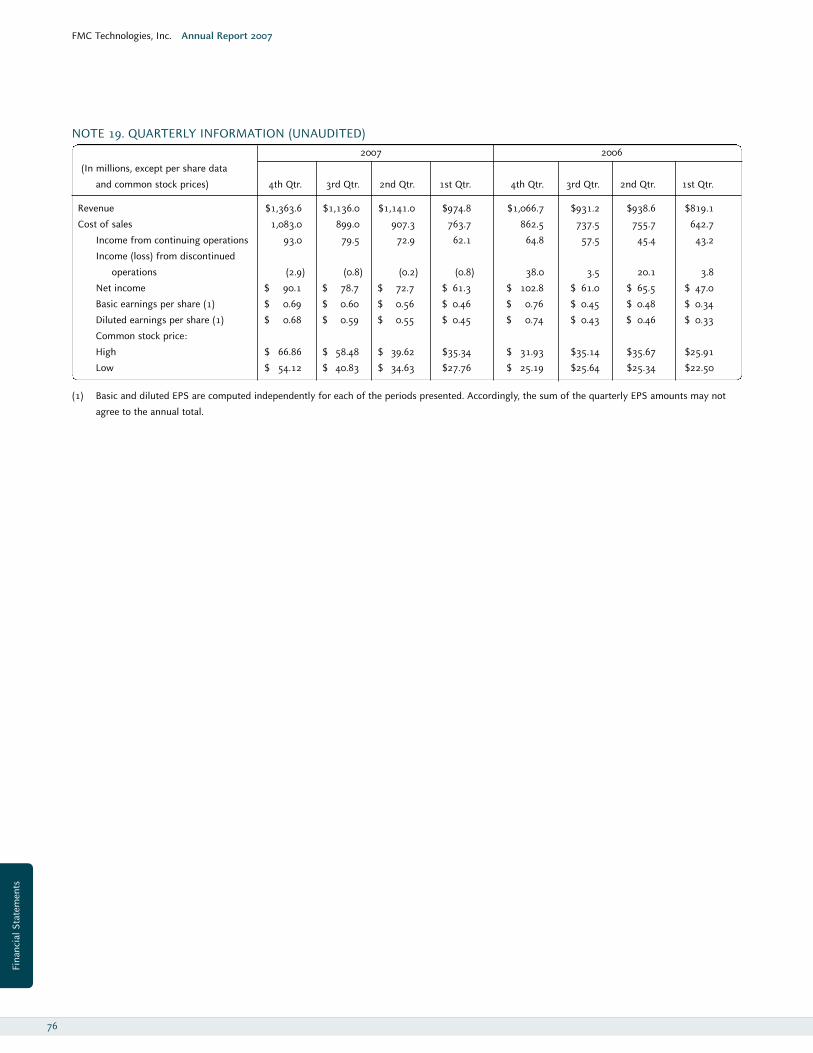
FMC Technologies, Inc. Annual Report 2007
76
NOTE 19. QUARTERLY INFORMATION (UNAUDITED) 2007 2006
(I n millions, except per share data
and common stock prices) 4th Qtr. 3rd Qtr. 2nd Qtr. 1st Qtr. 4th Qtr. 3rd Qtr. 2nd Qtr. 1st Qtr.
Revenue $1,363.6 $1,136.0 $1,141.0 $974.8 $1,066.7 $931.2 $938.6 $819.1
Cost of sales 1,083.0 899.0 907.3 763.7 862.5 737.5 755.7 642.7
Income from continuing operations 93.0 79.5 72.9 62.1 64.8 57.5 45.4 43.2
Income (loss) from discontinued
operations (2.9) (0.8) (0.2) (0.8) 38.0 3.5 20.1 3.8
Net income $ 90.1 $ 78.7 $ 72.7 $ 61.3 $ 102.8 $ 61.0 $ 65.5 $ 47.0
Basic earnings per share (1) $ 0.69 $ 0.60 $ 0.56 $ 0.46 $ 0.76 $ 0.45 $ 0.48 $ 0.34
Diluted earnings per share (1) $ 0.68 $ 0.59 $ 0.55 $ 0.45 $ 0.74 $ 0.43 $ 0.46 $ 0.33
Common stock price:
High $ 66.86 $ 58.48 $ 39.62 $35.34 $ 31.93 $35.14 $35.67 $25.91
Low $ 54.12 $ 40.83 $ 34.63 $27.76 $ 25.19 $25.64 $25.34 $22.50
(1) Basic and diluted EPS are computed independently for each of the periods presented. Accordingly, the sum of the quarterly EPS amounts may not
agree to the annual total.
Fina
ncia
l Sta
tem
ents
REPORT OF INDEPENDENT REGISTERED PUBLIC ACCOUNT ING FIRM
The Board of Directors and Stockholders of FMC Technologies, Inc.:
We have audited the accompanying consolidated balance sheets of FMC Technologies, Inc. and consolidated subsidiaries (the Company)as of December 31, 2007 and 2006, and the related consolidated statements of income, cash flows and changes in stockholders’ equity foreach of the years in the three-year period ended December 31, 2007. These consolidated financial statements are the responsibility of theCompany’s management. Our responsibility is to express an opinion on these consolidated financial statements based on our audits.
We conducted our audits in accordance with the standards of the Public Company Accounting Oversight Board (United States). Thosestandards require that we plan and perform the audit to obtain reasonable assurance about whether the financial statements are free ofmaterial misstatement. An audit includes examining, on a test basis, evidence supporting the amounts and disclosures in the financialstatements. An audit also includes assessing the accounting principles used and significant estimates made by management, as well asevaluating the overall financial statement presentation. We believe that our audits provide a reasonable basis for our opinion.
In our opinion, the consolidated financial statements referred to above present fairly, in all material respects, the financial position ofFMC Technologies, Inc. and consolidated subsidiaries as of December 31, 2007 and 2006, and the results of their operations and theircash flows for each of the years in the three-year period ended December 31, 2007, in conformity with U.S. generally accepted accountingprinciples.
As described in Note 11 to the consolidated financial statements, effective December 31, 2006, the Company adopted Statement ofFinancial Accounting Standards (SFAS) No. 158, Employers’ Accounting for Defined Benefit Pension and Other Postretirement Plans – anAmendment of FASB Statements No. 87, 88, 106, and 132R, which changed the method of accounting for pension and postretirementbenefits. As described in Note 1 to the consolidated financial statements, effective October 1, 2005, the Company adopted SFASNo. 123R, Share-Based Payment, modifying the method of accounting for share-based compensation.
We also have audited, in accordance with the standards of the Public Company Accounting Oversight Board (United States), theeffectiveness of FMC Technologies, Inc.’s internal control over financial reporting as of December 31, 2007, based on criteria establishedin Internal Control—Integrated Framework issued by the Committee of Sponsoring Organizations of the Treadway Commission (COSO),and our report dated February 29, 2008, expressed an unqualified opinion on the effective operation of internal control over financialreporting.
Chicago, IllinoisFebruary 29, 2008
Management’s Annual Report on Internal Control over Financial Reporting
Our management is responsible for establishing and maintaining adequate internal control over financial reporting, as such term isdefined in Exchange Act Rules 13a-15(f). Our internal control over financial reporting is a process designed under the supervision of theChief Executive Officer and Chief Financial Officer to provide reasonable assurance regarding the reliability of financial reporting and thepreparation of our financial statements for external purposes in accordance with generally accepted accounting principles. Under thesupervision and with the participation of our management, including our principal executive officer and principal financial officer, weconducted an evaluation of the effectiveness of our internal control over financial reporting based on the framework in Internal Control—Integrated Framework issued by the Committee of Sponsoring Organizations of the Treadway Commission. Based on our evaluationunder the framework in Internal Control—Integrated Framework, our management concluded that our internal control over financialreporting was effective in providing this reasonable assurance as of December 31, 2007. During the quarter ended December 31, 2007,there were no changes in our internal control over financial reporting that have materially affected, or are reasonably likely to materiallyaffect, our internal control over financial reporting.
The effectiveness of our internal control over financial reporting as of December 31, 2007, has been audited by KPMG LLP, anindependent registered public accounting firm, as stated in their report which is included herein.
FMC Technologies, Inc. Annual Report 2007
77
Financial Statements
FMC Technologies, Inc. Annual Report 2007
78
REPORT OF INDEPENDENT REGISTERED PUBLIC ACCOUNTING FIRM
The Board of Directors and Stockholders of FMC Technologies, Inc.:
We have audited FMC Technologies, Inc.’s internal control over financial reporting as of December 31, 2007, based on criteria establishedin Internal Control—Integrated Framework issued by the Committee of Sponsoring Organizations of the Treadway Commission (theCOSO Criteria). FMC Technologies, Inc.’s management is responsible for maintaining effective internal control over financial reportingand for its assessment of the effectiveness of internal control over financial reporting. Our responsibility is to express an opinion on theCompany’s internal control over financial reporting based on our audit.
We conducted our audit in accordance with the standards of the Public Company Accounting Oversight Board (United States). Thosestandards require that we plan and perform the audit to obtain reasonable assurance about whether effective internal control overfinancial reporting was maintained in all material respects. Our audit included obtaining an understanding of internal control overfinancial reporting, assessing the risk that a material weakness exists, and testing and evaluating the design and operating effectivenessof internal control based on the assessed risk. Our audit also included performing such other procedures as we considered necessary inthe circumstances. We believe that our audit provides a reasonable basis for our opinion.
A company’s internal control over financial reporting is a process designed to provide reasonable assurance regarding the reliability offinancial reporting and the preparation of financial statements for external purposes in accordance with generally accepted accountingprinciples. A company’s internal control over financial reporting includes those policies and procedures that (1) pertain to themaintenance of records that, in reasonable detail, accurately and fairly reflect the transactions and dispositions of the assets of thecompany; (2) provide reasonable assurance that transactions are recorded as necessary to permit preparation of financial statements inaccordance with generally accepted accounting principles, and that receipts and expenditures of the company are being made only inaccordance with authorizations of management and directors of the company; and (3) provide reasonable assurance regarding preventionor timely detection of unauthorized acquisition, use, or disposition of the company’s assets that could have a material effect on thefinancial statements.
Because of its inherent limitations, internal control over financial reporting may not prevent or detect misstatements. Also, projections ofany evaluation of effectiveness to future periods are subject to the risk that controls may become inadequate because of changes inconditions, or that the degree of compliance with the policies or procedures may deteriorate.
In our opinion, FMC Technologies, Inc. maintained, in all material respects, effective internal control over financial reporting as ofDecember 31, 2007, based on the COSO criteria.
We also have audited, in accordance with the standards of the Public Company Accounting Oversight Board (United States), theconsolidated balance sheets of FMC Technologies, Inc. and consolidated subsidiaries as of December 31, 2007 and 2006, and the relatedconsolidated statements of income, cash flows and changes in stockholders’ equity for each of the years in the three-year period endedDecember 31, 2007, and our report dated February 29, 2008, expressed an unqualified opinion on those consolidated financialstatements.
Chicago, IllinoisFebruary 29, 2008
Fina
ncia
l Sta
tem
ents
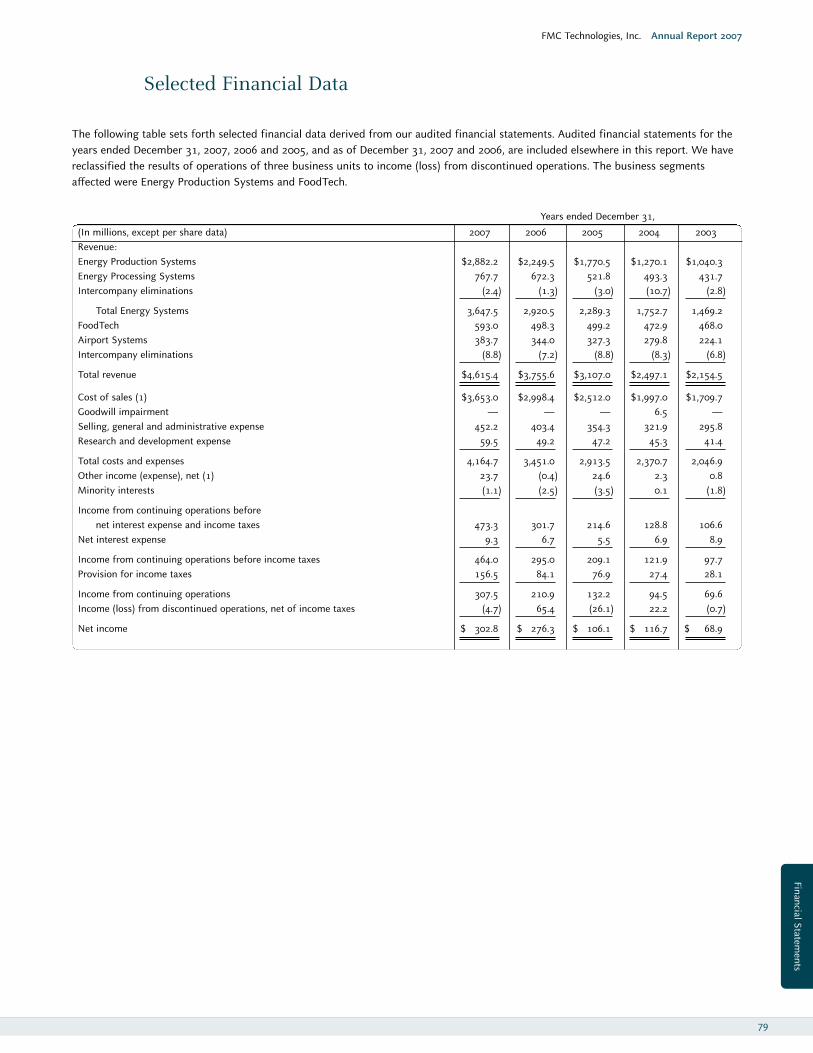
The following table sets forth selected financial data derived from our audited financial statements. Audited financial statements for theyears ended December 31, 2007, 2006 and 2005, and as of December 31, 2007 and 2006, are included elsewhere in this report. We havereclassified the results of operations of three business units to income (loss) from discontinued operations. The business segmentsaffected were Energy Production Systems and FoodTech.
Years ended December 31,
(In millions, except per share data) 2007 2006 2005 2004 2003 Revenue:Energy Production Systems $2,882.2 $2,249.5 $1,770.5 $1,270.1 $1,040.3Energy Processing Systems 767.7 672.3 521.8 493.3 431.7Intercompany eliminations (2.4) (1.3) (3.0) (10.7) (2.8)
Total Energy Systems 3,647.5 2,920.5 2,289.3 1,752.7 1,469.2FoodTech 593.0 498.3 499.2 472.9 468.0Airport Systems 383.7 344.0 327.3 279.8 224.1Intercompany eliminations (8.8) (7.2) (8.8) (8.3) (6.8)
Total revenue $4,615.4 $3,755.6 $3,107.0 $2,497.1 $2,154.5
Cost of sales (1) $3,653.0 $2,998.4 $2,512.0 $1,997.0 $1,709.7Goodwill impairment — — — 6.5 —Selling, general and administrative expense 452.2 403.4 354.3 321.9 295.8Research and development expense 59.5 49.2 47.2 45.3 41.4
Total costs and expenses 4,164.7 3,451.0 2,913.5 2,370.7 2,046.9Other income (expense), net (1) 23.7 (0.4) 24.6 2.3 0.8Minority interests (1.1) (2.5) (3.5) 0.1 (1.8)
Income from continuing operations beforenet interest expense and income taxes 473.3 301.7 214.6 128.8 106.6
Net interest expense 9.3 6.7 5.5 6.9 8.9
Income from continuing operations before income taxes 464.0 295.0 209.1 121.9 97.7Provision for income taxes 156.5 84.1 76.9 27.4 28.1
Income from continuing operations 307.5 210.9 132.2 94.5 69.6Income (loss) from discontinued operations, net of income taxes (4.7) 65.4 (26.1) 22.2 (0.7)
Net income $ 302.8 $ 276.3 $ 106.1 $ 116.7 $ 68.9
Selected Financial Data
FMC Technologies, Inc. Annual Report 2007
79
Financial Statements
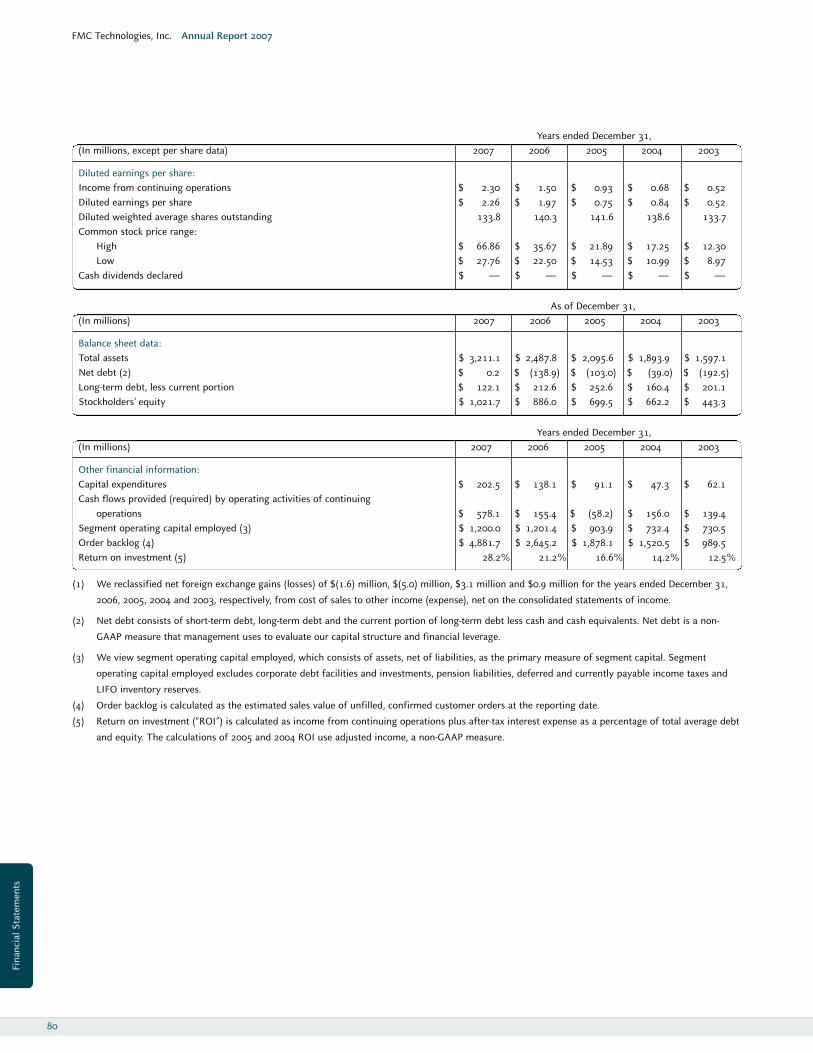
Years ended December 31 , (In millions, except per share data) 2007 2006 2005 2004 2003
Diluted earnings per share:Income from continuing operations $ 2.30 $ 1.50 $ 0.93 $ 0.68 $ 0.52Diluted earnings per share $ 2.26 $ 1.97 $ 0.75 $ 0.84 $ 0.52Diluted weighted average shares outstanding 133.8 140.3 141.6 138.6 133.7Common stock price range:
High $ 66.86 $ 35.67 $ 21.89 $ 17.25 $ 12.30Low $ 27.76 $ 22.50 $ 14.53 $ 10.99 $ 8.97
Cash dividends declared $ — $ — $ — $ — $ —
As of December 31,(In millions) 2007 2006 2005 2004 2003
Balance sheet data:Total assets $ 3,211.1 $ 2,487.8 $ 2,095.6 $ 1,893.9 $ 1,597.1Net debt (2) $ 0.2 $ (138.9) $ (103.0) $ (39.0) $ (192.5)Long-term debt, less current portion $ 122.1 $ 212.6 $ 252.6 $ 160.4 $ 201.1Stockholders’ equity $ 1,021.7 $ 886.0 $ 699.5 $ 662.2 $ 443.3
Years ended December 31,(In millions) 2007 2006 2005 2004 2003
Other financial information:Capital expenditures $ 202.5 $ 138.1 $ 91.1 $ 47.3 $ 62.1Cash flows provided (required) by operating activities of continuing
operations $ 578.1 $ 155.4 $ (58.2) $ 156.0 $ 139.4Segment operating capital employed (3) $ 1,200.0 $ 1,201.4 $ 903.9 $ 732.4 $ 730.5Order backlog (4) $ 4,881.7 $ 2,645.2 $ 1,878.1 $ 1,520.5 $ 989.5Return on investment (5) 28.2% 21.2% 16.6% 14.2% 12.5%
(1) We reclassified net foreign exchange gains (losses) of $(1.6) million, $(5.0) million, $3.1 million and $0.9 million for the years ended December 31,
2006, 2005, 2004 and 2003, respectively, from cost of sales to other income (expense), net on the consolidated statements of income.
(2) Net debt consists of short-term debt, long-term debt and the current portion of long-term debt less cash and cash equivalents. Net debt is a non-
GAAP measure that management uses to evaluate our capital structure and financial leverage.
(3) We view segment operating capital employed, which consists of assets, net of liabilities, as the primary measure of segment capital. Segment
operating capital employed excludes corporate debt facilities and investments, pension liabilities, deferred and currently payable income taxes and
LIFO inventory reserves.
(4) Order backlog is calculated as the estimated sales value of unfilled, confirmed customer orders at the reporting date.
(5) Return on investment (“ROI”) is calculated as income from continuing operations plus after-tax interest expense as a percentage of total average debt
and equity. The calculations of 2005 and 2004 ROI use adjusted income, a non-GAAP measure.
FMC Technologies, Inc. Annual Report 2007
80
Fina
ncia
l Sta
tem
ents
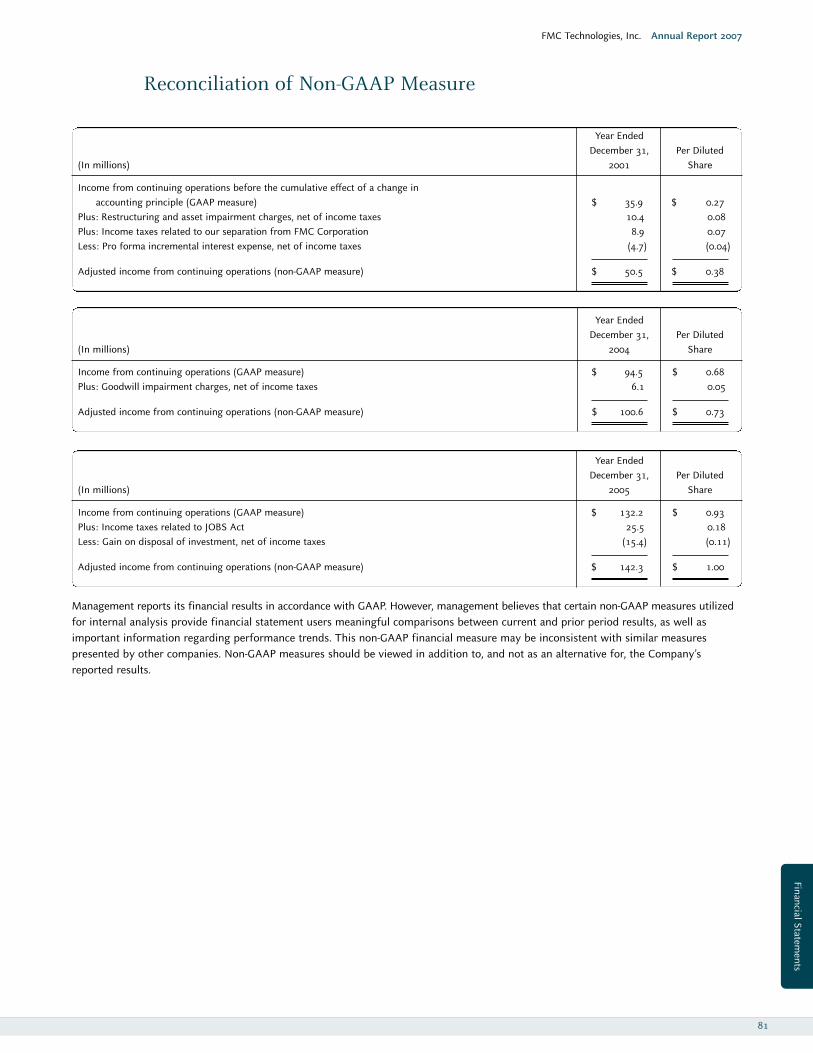
Year Ended December 31, Per Diluted
(In millions) 2001 Share
Income from continuing operations before the cumulative effect of a change in accounting principle (GAAP measure) $ 35.9 $ 0.27
Plus: Restructuring and asset impairment charges, net of income taxes 10.4 0.08Plus: Income taxes related to our separation from FMC Corporation 8.9 0.07Less: Pro forma incremental interest expense, net of income taxes (4.7) (0.04)
Adjusted income from continuing operations (non-GAAP measure) $ 50.5 $ 0.38
Year Ended December 31, Per Diluted
(In millions) 2004 Share
Income from continuing operations (GAAP measure) $ 94.5 $ 0.68Plus: Goodwill impairment charges, net of income taxes 6.1 0.05
Adjusted income from continuing operations (non-GAAP measure) $ 100.6 $ 0.73
Year Ended December 31, Per Diluted
(In millions) 2005 Share
Income from continuing operations (GAAP measure) $ 132.2 $ 0.93Plus: Income taxes related to JOBS Act 25.5 0.18Less: Gain on disposal of investment, net of income taxes (15.4) (0.11)
Adjusted income from continuing operations (non-GAAP measure) $ 142.3 $ 1.00
Management reports its financial results in accordance with GAAP. However, management believes that certain non-GAAP measures utilizedfor internal analysis provide financial statement users meaningful comparisons between current and prior period results, as well as important information regarding performance trends. This non-GAAP financial measure may be inconsistent with similar measures presented by other companies. Non-GAAP measures should be viewed in addition to, and not as an alternative for, the Company’s reported results.
FMC Technologies, Inc. Annual Report 2007
81
Reconciliation of Non-GAAP Measure
Financial Statements

Corporate Office
FMC Technologies, Inc.
1803 Gears Road
Houston, TX 77067
281 591 4000
Investor Relations
Investor Relations may be
contacted at the following address:
FMC Technologies, Inc.
Investor Relations
Robert K. Cherry
1803 Gears Road
Houston, TX 77067
281 591 4560
ir.fmctechnologies.com
Stock Exchange
FMC Technologies, Inc. is listed on the
New York Stock Exchange under the
symbol FTI.
Annual Meeting
The Annual Meeting of
Stockholders will be held at 11:00 a.m.
CDT on Friday, May 9, 2008, at 2825
West Washington Street, Stephenville,
Texas 76401. Notice of the meeting,
together with proxy materials, will be
mailed to stockholders in advance of
the meeting.
Stock Transfer Agent
Address stockholder inquiries,
including requests for stock
transfers, to:
National City Bank
Shareholder Services Operations
PO Box 92301
Cleveland, OH 44193-0900
Telephone 800 622 6757
Fax 216 257 8508
Email:
Form 10-K
A copy of the company’s 2007 Annual
Report on Form 10-K, as filed with the
U.S. Securities and Exchange
Commission, is available at
ir.fmctechnologies.com or upon
written request to:
FMC Technologies, Inc.
Corporate Communications
1803 Gears Road
Houston, TX 77067
However, certain information
required under Part III of the
company’s 2007 Annual Report on Form
10-K has been incorporated by reference
from the company’s Proxy Statement for
its 2008 Annual Meeting of Shareholders.
Certifications required by Section 302 of
the Sarbanes-Oxley Act of 2002, as
amended, are attached as Exhibits to the
company’s 2007 Annual Report on Form
10-K. FMC Technologies’ CEO timely
submitted the CEO Annual Certification
required by Section 303A.12(a) of the
New York Stock Exchange Listed
Company Manual in 2007 to the
New York Stock Exchange.
FMC Technologies was
incorporated in Delaware in 2000.
Auditors
KPMG LLP
303 East Wacker Drive
Chicago, IL 60601
Additional Information
Additional information about
FMC Technologies – including
continually updated stock quotes,
news and financial data – is available by
visiting the company’s website:
www.fmctechnologies.com
An email alert service is available by
request under the Investor Relations
section of the site. This service will
provide an automatic alert, via email,
each time a news release is posted to the
site or a new filing is made with the U.S.
Securities and Exchange Commission.
Information may also be obtained by
writing to Corporate Communications
in Houston.

FMC Technologies Inc
1803 Gears Road
Houston TX 77067
281 591 4000
fmctechnologies.com


![Brian Skeels – FMC Technologies API 17TR8 Task … Skeels – FMC Technologies . API 17TR8 Task Group Chair . ... ASME VIII Div. 2 . ... [ASME Div. 2: 2004] >15ksi > 350°F Note](https://img.pdfslide.net/doc/110x75/5ad8987d7f8b9a98098e4005/brian-skeels-fmc-technologies-api-17tr8-task-skeels-fmc-technologies.jpg)