Embed Size (px)
Citation preview

Measurement of Measurement of Macroeconomic VariablesMacroeconomic VariablesChapter 2Chapter 2
Professor Steve Cunningham
Intermediate Macroeconomics
ECON 219

2
The Circular Flow of Income and ProductThe Circular Flow of Income and Product
3
Stocks and FlowsStocks and Flows
A flow is a quantity per unit of time.– How much per period?– Example: pay rate
A stock is a quantity that exists at one point in time.– Example: your bank balance

4
Wealth and SavingWealth and Saving
Wealth is the value of all the things that people own. Savings is one form of wealth. It is a stock.
Saving is the amount of income that is left over after consumption. It adds to wealth. It is a flow.
Dissaving is the process of making expenditures out of savings. It reduces wealth.

5
Gross Domestic Product (GDP)Gross Domestic Product (GDP)
GDP is the total value of all the goods and services produced in a country per time period (usually one year). It is a flow variable.
In 2002, U.S. GDP was $10.4 trillion (per year). In contrast, Gross National Product (GNP) is
the total value of all the goods and services produced by the citizens of a country (wherever they might be) per time period.

6
Types of GoodsTypes of Goods
Two types of goods:– Consumer goods– Capital goods
• Gross or net, considering depreciation
Leads to two different components of aggregate demand related to the private sector:– Consumption (C)– Investment (I)
Public sector demand is treated separately (G). Net exports (exports – imports) is another source
of demand for goods and services (NX)

7
Firm Sector ExpenditureFirm Sector Expenditure
Investment is the change in the capital stock. Investment is a flow.
Gross investment is the new capital purchased in a given period. (I)
Depreciation is the capital “used up” in a given period. (δ)
Net investment is the change in the capital stock, accounting for depreciation. (I - δ)

8
Consumer Sector ExpenditureConsumer Sector Expenditure
Consumption (C) is the flow of expenditures related to the purchase of goods and services.
Saving (S) is the flow of income dollars withheld from consumption to increase wealth.
Income = Consumption + Saving + Taxes (Y = C + S + T )

9
Government Sector ExpenditureGovernment Sector Expenditure
Government Purchases (G) of goods and services (gross).
Net Taxes (T) are equal to the taxes paid to the government less the transfer payments received from the government less interest payments made by the government on its debt(T = taxes - transfers - gov’t interest)
A Budget Deficit is G > T A Budget Surplus is G < T

10
International SectorInternational Sector
Imports (IM or M) are goods and services purchased by domestic consumers that are produced elsewhere.
Exports (EX or X) are goods and services purchased by foreign consumers that are produced domestically (EX).
Net Exports (NX) = EX - IM

11
Adding It All UpAdding It All Up
Y = C + I + G + NXThe Expenditure Approach:
computes GDP this way.Aggregate production (GDP) equals
aggregate expenditure equals aggregate income.
Aggregate Supply = Aggregate Demand

12
GDP: Expenditure ApproachGDP: Expenditure Approach
Y = C + I + G + NXFocuses on final expenditureDoes not include:
– Intermediate goods and services– Used goods– Financial Assets

13
GDP ComponentsGDP Components
Year GDP = C + I + G + NX
1929 103.7 77.5 16.5 9.4 0.4
1990 5,803.2 3,831.5 861.7 1,181.4 -71.4
2000 9,824.6 6,683.7 1,755.4 1,751.0 -365.5
2002 10,446.2 7,303.7 1,593.2 1,972.9 -423.6
billions of dollars

14
U.S. Gross Domestic ProductU.S. Gross Domestic Product

15
Net Domestic ProductNet Domestic Product
Net Domestic Product (NDP) is Gross Domestic Product less depreciation.
NDP includes net investment instead of gross investment.

16
National IncomeNational Income
Gross National Product 10,436.7
Minus: Depreciation 1,393.5
Net National Product 9,043.2
Minus: Indirect Taxes & Other 703.1
National Income 8,340.1
2002, Billions of Dollars

17
GDP: Income ApproachGDP: Income Approach
Measures GDP by summing the incomes that firms pay households for the resources to produce the goods.
Includes:– Wages for labor (total compensation)– interest for capital (net interest)– rent for land (rental income)– profits for entrepreneurs (corporate profits and
proprietor’s income)

18
Personal Disposable IncomePersonal Disposable Income
National Income 8,340.1
less Corporate Profit Taxes, Undistributed Profits, and Valuation Adjustment
353.8
less Social Security Contributions 746.5
plus Transfer Payments to Individuals 1,288.0
plus Personal Interest Income 394.4
Personal Income 8,922.2
less Personal Taxes 1,111.9
Personal Disposable Income 7,810.3
2002, Billions of Dollars

19
Real GDPReal GDP
Real GDP is the GDP valued at the prices of a base year.
In the U.S., the current base year is 1996. GDP given in current prices is called
nominal GDP or money GDP. The economic growth rate is the
percentage change in real GDP.

20
GDP DeflatorGDP Deflator
The GDP Deflator measures the average price of all the goods and services that are included in GDP.
It is computed as:
100GDPReal
GDPdeflatorGDP ×=

21
Economic Welfare?Economic Welfare?
Real GDP does not measure economic welfare. Examples of reasons why GDP does not measure economic welfare:
– GDP over-adjustments for inflation– GDP does not include household production– GDP does not include the underground economy– GDP does not account for health and life expectancy– GDP does not consider the value of leisure time– GDP does not consider environment quality– GDP does not consider political freedom and social
justice

22
CPI and PPICPI and PPI
The Consumer Price Index (CPI) measures the average level of prices of the goods and services that the typical urban family buys. The Bureau of Labor Statistics (BLS) calculates the CPI monthly.
The Producer Price Index (PPI) measures the wholesale prices of approximately 3000 items.

23Source: Bureau of Labor Statistics.
The Distribution of Expenditures in Computing The Distribution of Expenditures in Computing the Consumer Price Indexthe Consumer Price Index

24
InflationInflation
The inflation rate is the percentage change in the price level from one year to the next.
100yearlast CPI
year)last CPI -year this(CPI
rateInflation
×
=

25
Sources of Bias in CPISources of Bias in CPI
New goods bias– The new, hot product costs more than the older product
it replaced. (Computer vs. typewriter ) Quality change bias
– The newer products have more features and reliability. Commodity substitution bias
– When the price rises, the consumer chooses to substitute a lower priced substitute.
Outlet substitution bias– When the price rises, the consumer changes shopping
habits and goes to an outlet store or buys foreign goods.
26
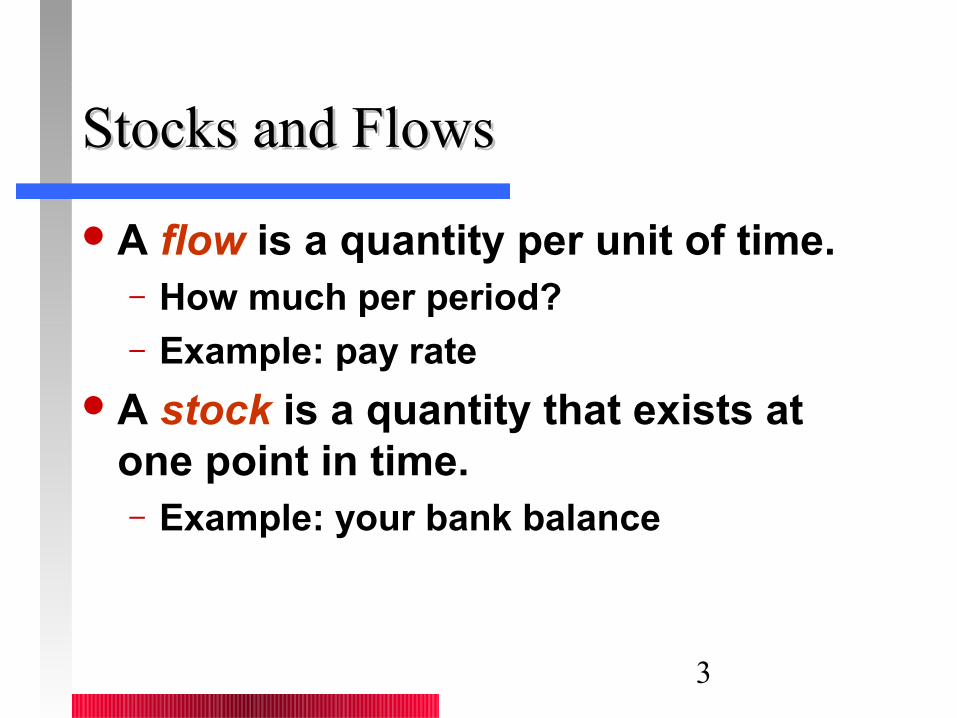
GDP Deflator BiasGDP Deflator Bias
In principle, the GDP deflator cannot be biased.– It reflects prices of the goods actually
chosen by consumers, not a fixed shopping list.
– Substitutions of various kinds are naturally accounted for.

27Sources: Economic Report of the President, 2002; Economic Indicators (various issues).
Figure 2–3
The GDP The GDP Deflator and Real Deflator and Real
and Nominal and Nominal GDPGDP
$ Billions
GDP Deflator

28
(Un)Employed?(Un)Employed?
To be employed, a person must have either a full-time job or a part-time job.
To be unemployed, a person must be available for work, and must be:– Without work but have made specific efforts to
find a job within the previous four (4) weeks, or– Waiting to be called back from a job from which
he or she has been laid off, or– Waiting to start a new job within 30 days.

29
Discouraged WorkersDiscouraged Workers
Discouraged workers are people who are available and willing and able to work but have not made specific efforts to find a job within the previous four weeks.
Unemployment measures tend to exclude these people and thus understate unemployment.

30
Working-Age PopulationWorking-Age Population
The working-age population is the total number of people aged 16 years and over, who are neither instutionalized or incarcerated.
The working-age population is divided into those in labor force and those not in the labor force.
The labor force is made up of the employed and the unemployed.

31
Labor Market IndicatorsLabor Market Indicators
Unemployment Rate =
Labor Force Participation Rate =
%100forcelabor
employednumber ×
%100population age-working
forcelabor ×

32
More MeasuresMore Measures
Employment to population ratio– Indicative of the availability of jobs and
the degree of match between people’s skills and jobs
Aggregate hours– The total number of hours worked by all
the people employed, both full and part-time, during a year. (Given in labor hours per year)

33
More MeasuresMore Measures(Continued)(Continued)
The average weekly hours per person divides aggregate hours by the number of workers in the labor force.
The real wage rate is the quantity of goods and services that an hour’s wages can buy. It is the average wage rate deflated by a price index.

34
Types of UnemploymentTypes of Unemployment
Frictional– Arises from normal labor turnover – Related to search– It is normal, permanent, and good
Structural– Related to mismatched skills
Cyclical– Related to general business conditions

35
Full EmploymentFull Employment
Full employment occurs when there is no cyclical unemployment.
The unemployment rate at full employment is the natural rate of unemployment.