Embed Size (px)
Citation preview
Utility Fuel Costs: Volatility & Risk
Asia Pacific Resilience Innovation Summits & Expo
August 24, 2015
Why Focus on Electric Utility Fuel Costs?
• Fuel costs dwarf /ixed costs
• Fuel costs are the source of most of the risk
• To date the discussion of risk has not been adequate – Single price forecast line
– High, expected, and low price forecast
– Such forecasts cannot capture the true variability in future fuel prices
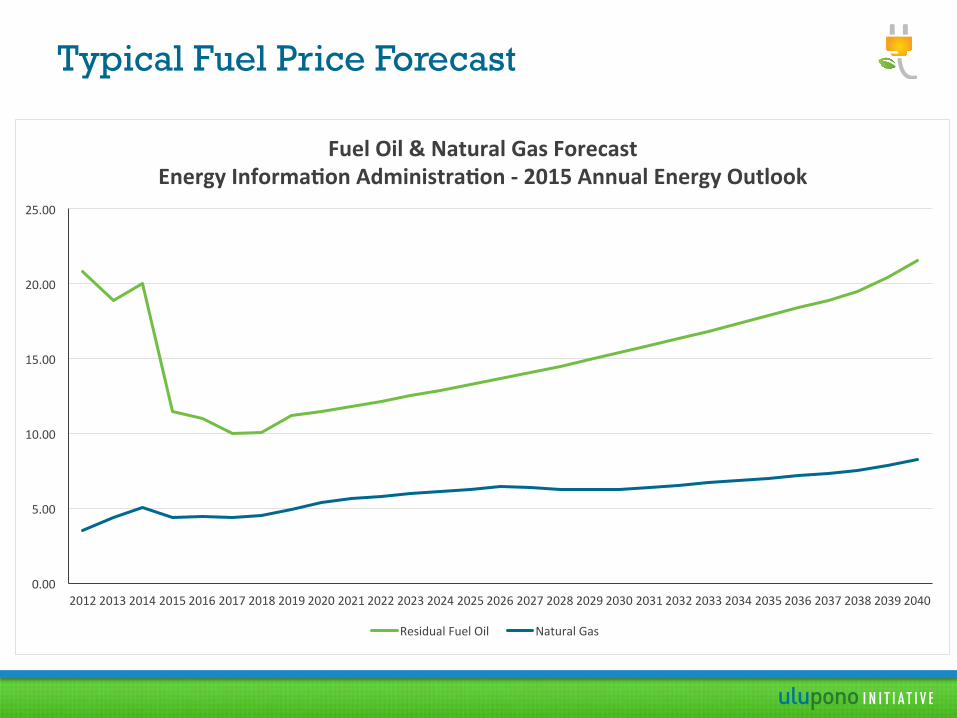
Typical Fuel Price Forecast
0.00
5.00
10.00
15.00
20.00
25.00
2012 2013 2014 2015 2016 2017 2018 2019 2020 2021 2022 2023 2024 2025 2026 2027 2028 2029 2030 2031 2032 2033 2034 2035 2036 2037 2038 2039 2040
Fuel Oil & Natural Gas Forecast Energy Informa8on Administra8on -‐ 2015 Annual Energy Outlook
Residual Fuel Oil Natural Gas
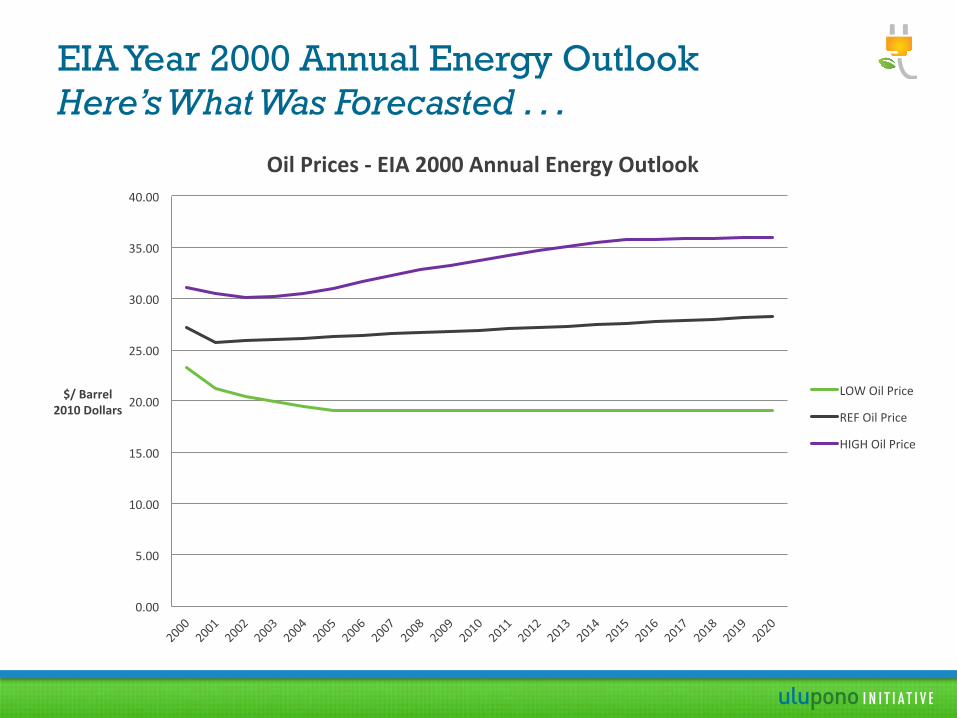
EIA Year 2000 Annual Energy Outlook Here’s What Was Forecasted . . .
0.00
5.00
10.00
15.00
20.00
25.00
30.00
35.00
40.00
$/ Barrel 2010 Dollars
Oil Prices -‐ EIA 2000 Annual Energy Outlook
LOW Oil Price
REF Oil Price
HIGH Oil Price
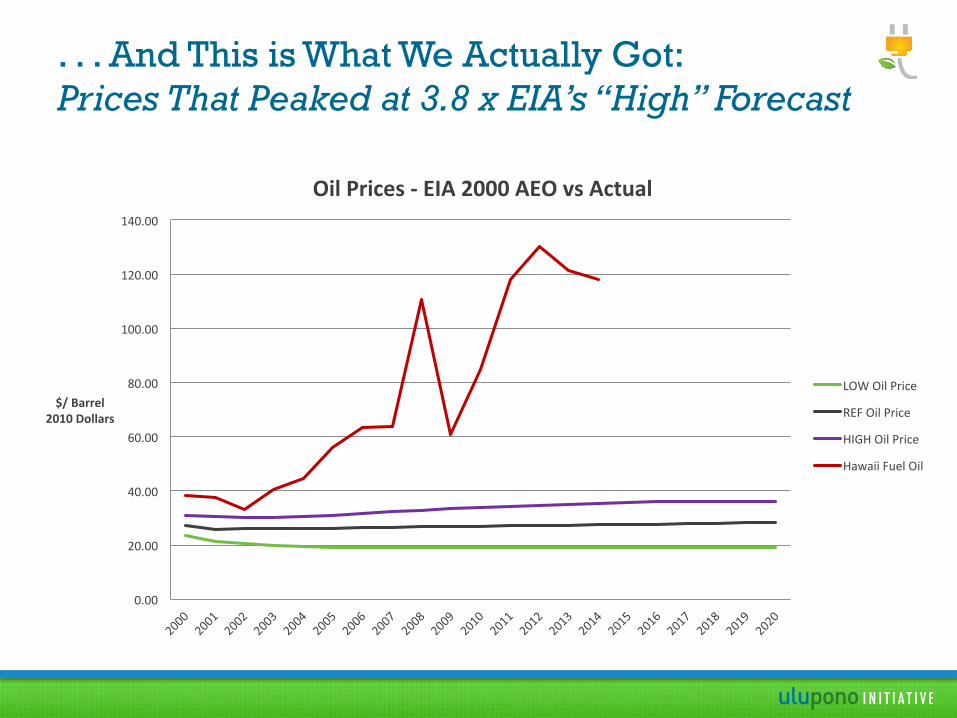
. . . And This is What We Actually Got: Prices That Peaked at 3.8 x EIA’s “High” Forecast
0.00
20.00
40.00
60.00
80.00
100.00
120.00
140.00
$/ Barrel 2010 Dollars
Oil Prices -‐ EIA 2000 AEO vs Actual
LOW Oil Price
REF Oil Price
HIGH Oil Price
Hawaii Fuel Oil
• Complete view of volatility and risk
• Generates many possible price paths
• Based on historical data
• Veri/ied by others
• Easily updated
• Uses generic software
• Used broadly
Used by uFliFes & energy planning orgs (e.g., Northwest Power & ConservaFon Council; Federal Govt., e.g., DOE/NETL and EPA; and Fortune 500 companies)
Monte Carlo 101
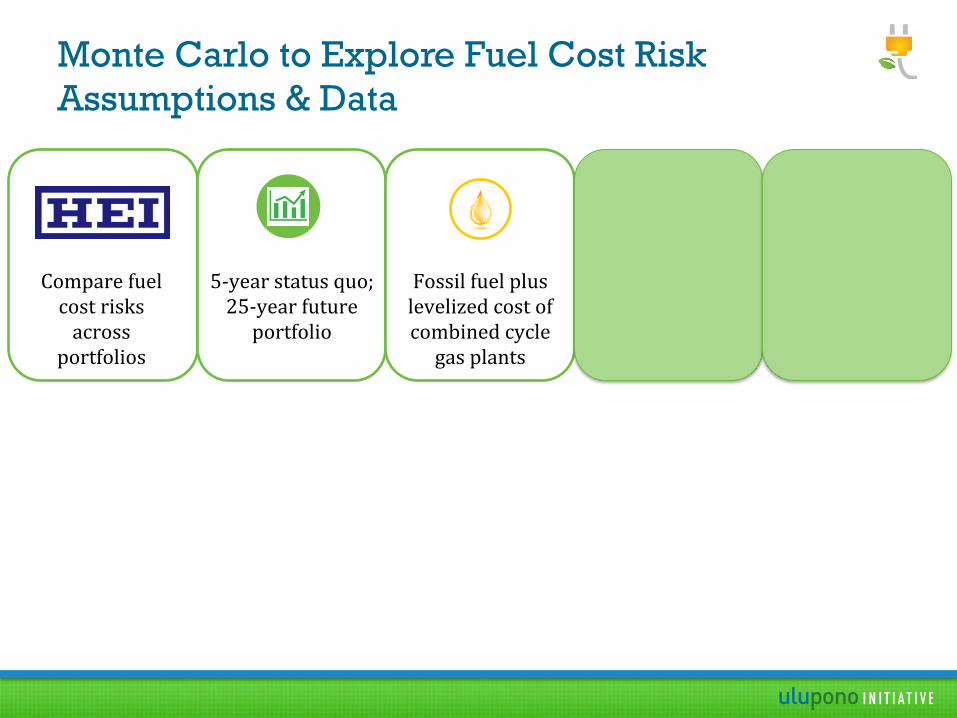
Monte Carlo to Explore Fuel Cost Risk Assumptions & Data
Monte Carlo to Explore Fuel Cost Risk Assumptions & Data
Compare fuel cost risks across
portfolios
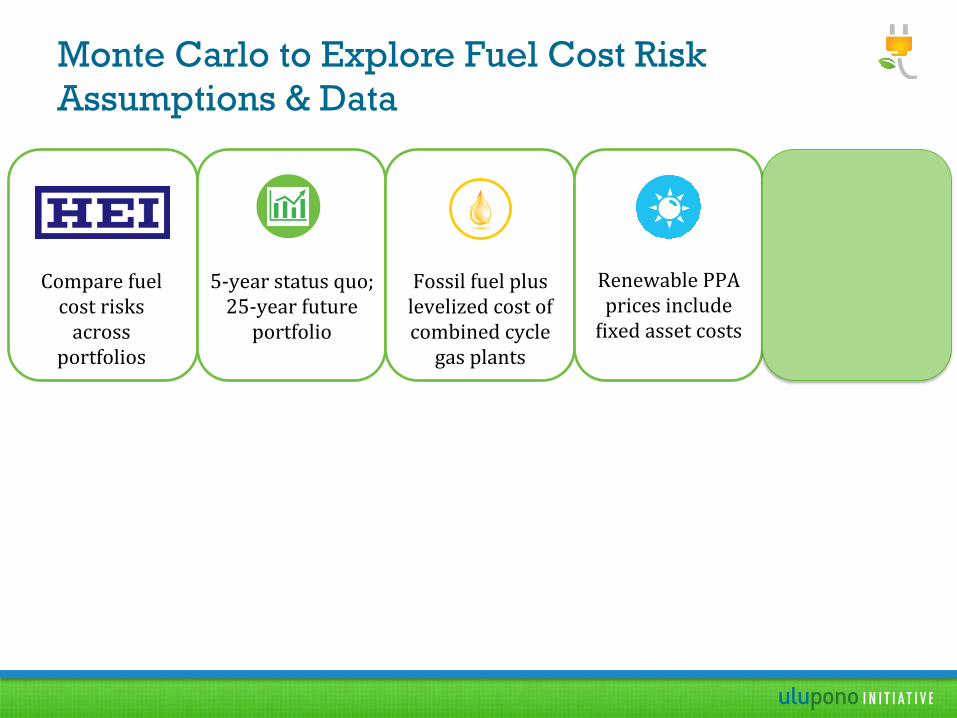
Monte Carlo to Explore Fuel Cost Risk Assumptions & Data
Compare fuel cost risks across
portfolios
5-‐year status quo; 25-‐year future portfolio
Monte Carlo to Explore Fuel Cost Risk Assumptions & Data
Compare fuel cost risks across
portfolios
5-‐year status quo; 25-‐year future portfolio
Fossil fuel plus levelized cost of combined cycle gas plants
Monte Carlo to Explore Fuel Cost Risk Assumptions & Data
Compare fuel cost risks across
portfolios
5-‐year status quo; 25-‐year future portfolio
Fossil fuel plus levelized cost of combined cycle gas plants
Renewable PPA prices include /ixed asset costs
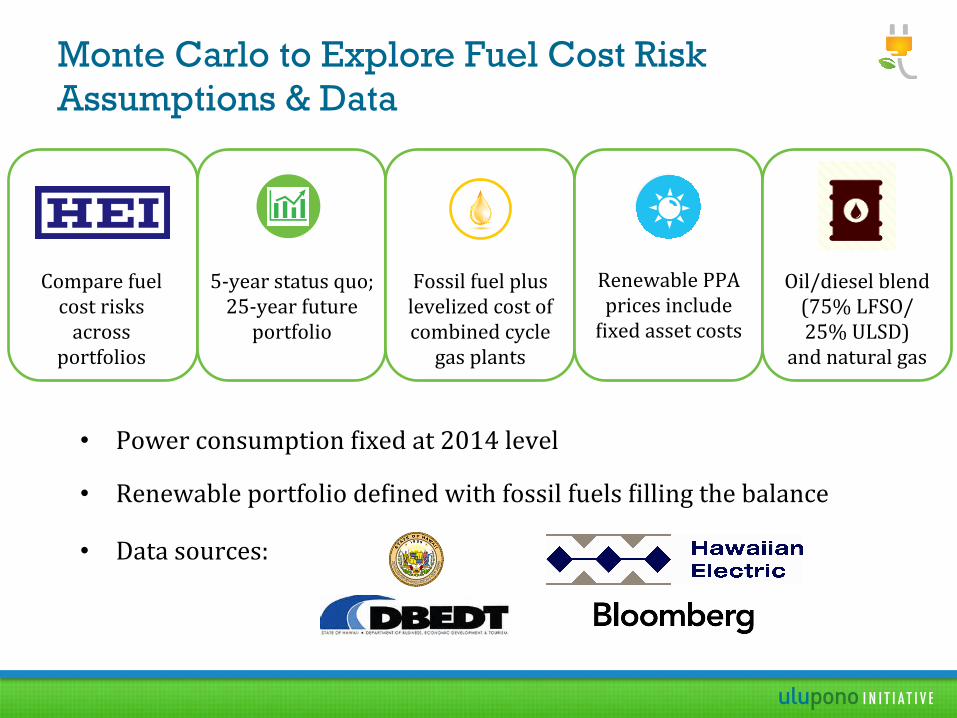
Monte Carlo to Explore Fuel Cost Risk Assumptions & Data
Compare fuel cost risks across
portfolios
5-‐year status quo; 25-‐year future portfolio
Fossil fuel plus levelized cost of combined cycle gas plants
Oil/diesel blend (75% LFSO/ 25% ULSD)
and natural gas
• Power consumption /ixed at 2014 level
• Renewable portfolio de/ined with fossil fuels /illing the balance
• Data sources:
Renewable PPA prices include /ixed asset costs

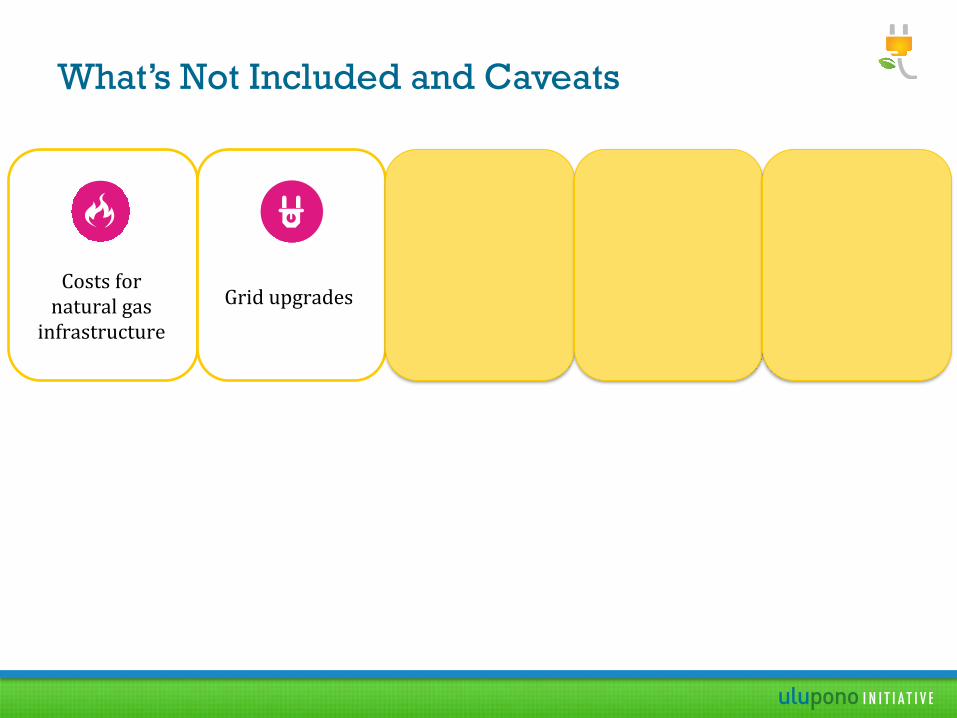
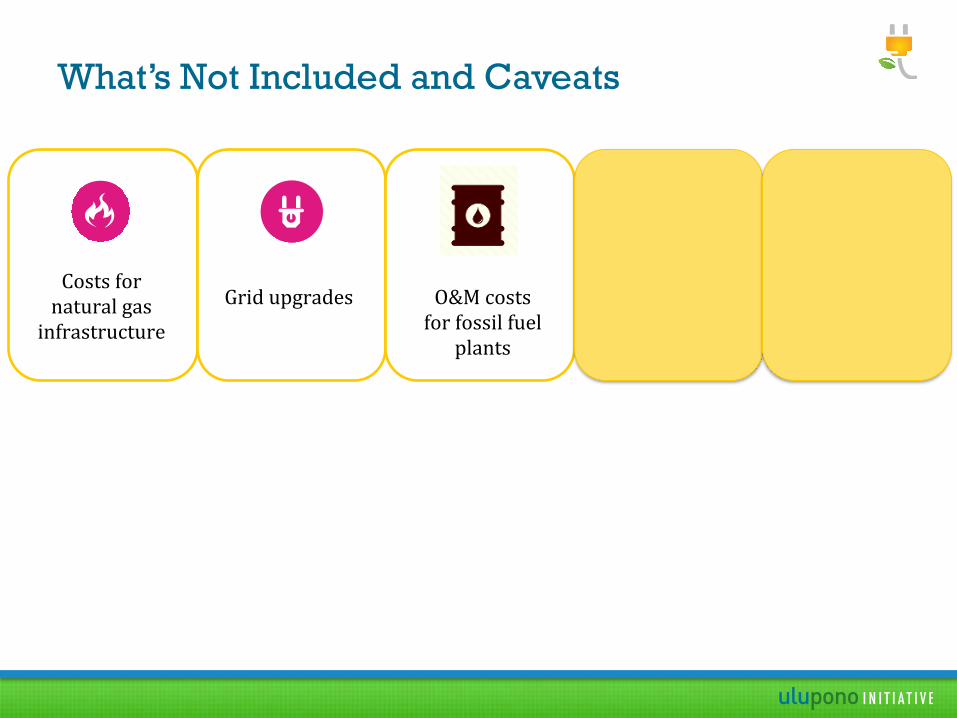
What’s Not Included and Caveats

What’s Not Included and Caveats
Costs for natural gas infrastructure
What’s Not Included and Caveats
Costs for natural gas infrastructure
Grid upgrades
What’s Not Included and Caveats
Costs for natural gas infrastructure
Grid upgrades O&M costs for fossil fuel
plants
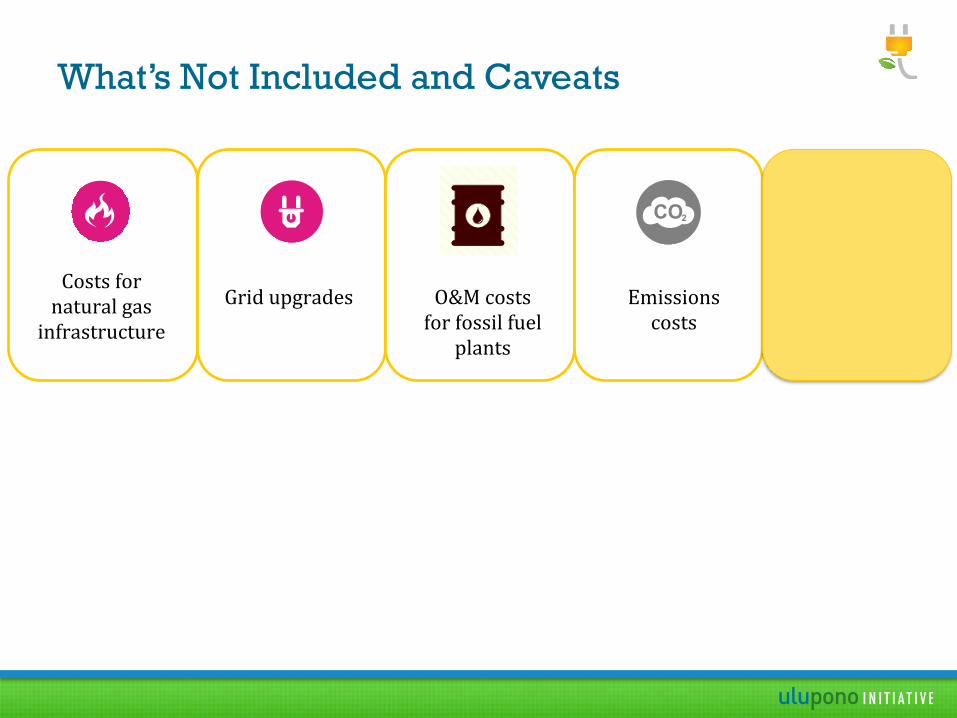
What’s Not Included and Caveats
Costs for natural gas infrastructure
Grid upgrades O&M costs for fossil fuel
plants
Emissions costs
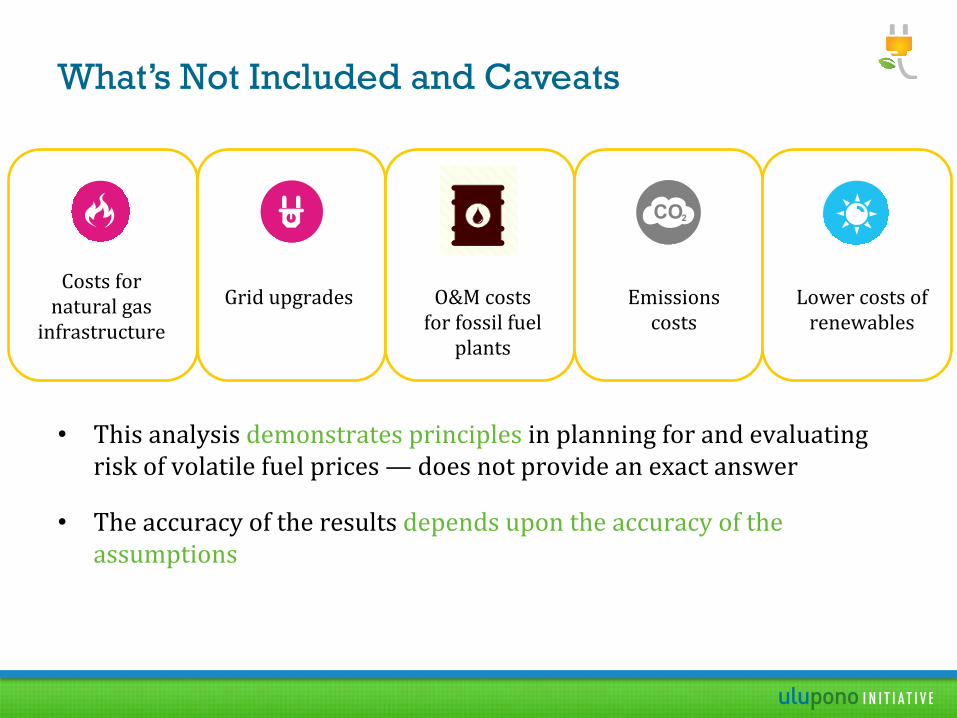
What’s Not Included and Caveats
• This analysis demonstrates principles in planning for and evaluating risk of volatile fuel prices — does not provide an exact answer
• The accuracy of the results depends upon the accuracy of the assumptions
Costs for natural gas infrastructure
Grid upgrades O&M costs for fossil fuel
plants
Emissions costs
Lower costs of renewables
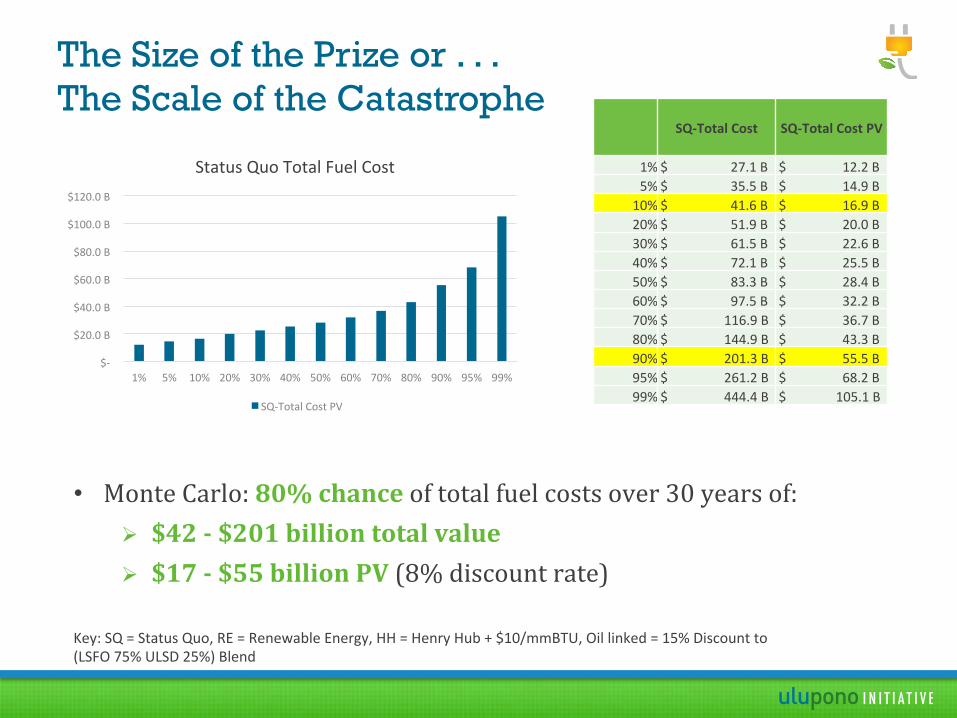
The Size of the Prize or . . . The Scale of the Catastrophe
Key: SQ = Status Quo, RE = Renewable Energy, HH = Henry Hub + $10/mmBTU, Oil linked = 15% Discount to (LSFO 75% ULSD 25%) Blend
• Monte Carlo: 80% chance of total fuel costs over 30 years of: Ø $42 -‐ $201 billion total value Ø $17 -‐ $55 billion PV (8% discount rate)
$-‐
$20.0 B
$40.0 B
$60.0 B
$80.0 B
$100.0 B
$120.0 B
1% 5% 10% 20% 30% 40% 50% 60% 70% 80% 90% 95% 99%
Status Quo Total Fuel Cost
SQ-‐Total Cost PV
SQ-‐Total Cost SQ-‐Total Cost PV
1% $ 27.1 B $ 12.2 B 5% $ 35.5 B $ 14.9 B 10% $ 41.6 B $ 16.9 B 20% $ 51.9 B $ 20.0 B 30% $ 61.5 B $ 22.6 B 40% $ 72.1 B $ 25.5 B 50% $ 83.3 B $ 28.4 B 60% $ 97.5 B $ 32.2 B 70% $ 116.9 B $ 36.7 B 80% $ 144.9 B $ 43.3 B 90% $ 201.3 B $ 55.5 B 95% $ 261.2 B $ 68.2 B 99% $ 444.4 B $ 105.1 B
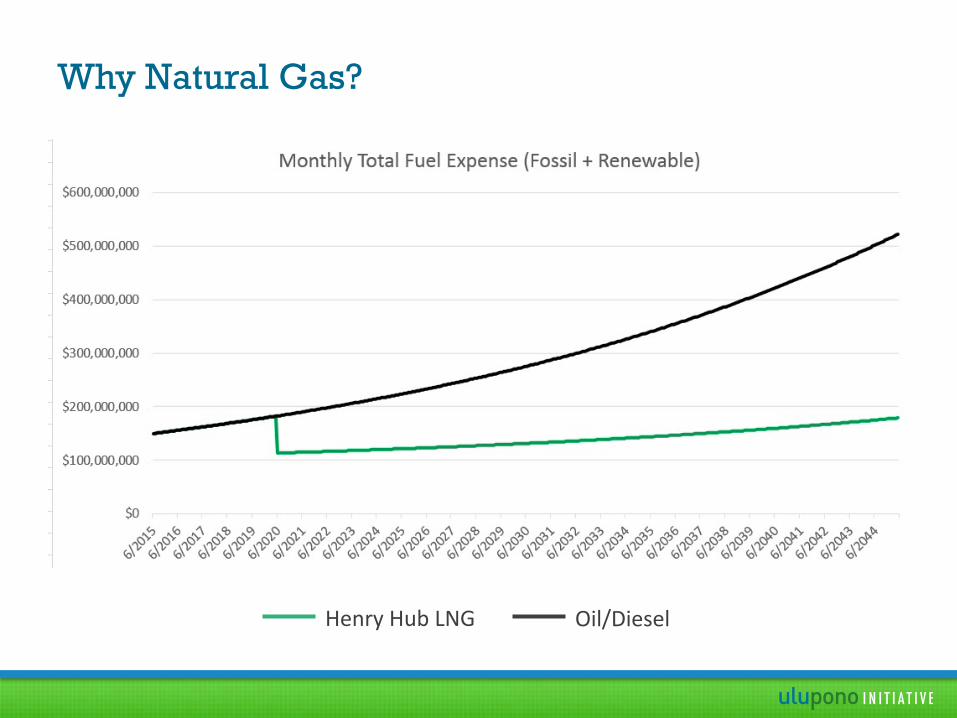
Why Natural Gas?
Henry Hub LNG Oil/Diesel
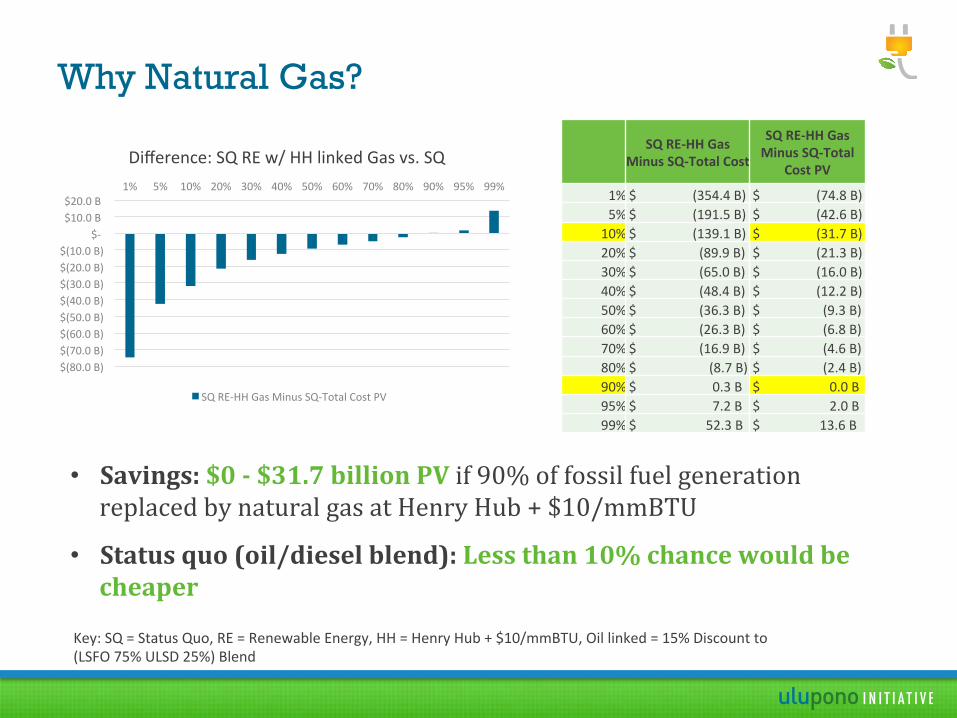
Why Natural Gas?
Key: SQ = Status Quo, RE = Renewable Energy, HH = Henry Hub + $10/mmBTU, Oil linked = 15% Discount to (LSFO 75% ULSD 25%) Blend
• Savings: $0 -‐ $31.7 billion PV if 90% of fossil fuel generation replaced by natural gas at Henry Hub + $10/mmBTU
• Status quo (oil/diesel blend): Less than 10% chance would be cheaper
$(80.0 B) $(70.0 B) $(60.0 B) $(50.0 B) $(40.0 B) $(30.0 B) $(20.0 B) $(10.0 B)
$-‐ $10.0 B $20.0 B
1% 5% 10% 20% 30% 40% 50% 60% 70% 80% 90% 95% 99%
Difference: SQ RE w/ HH linked Gas vs. SQ
SQ RE-‐HH Gas Minus SQ-‐Total Cost PV
SQ RE-‐HH Gas Minus SQ-‐Total Cost
SQ RE-‐HH Gas Minus SQ-‐Total
Cost PV
1% $ (354.4 B) $ (74.8 B) 5% $ (191.5 B) $ (42.6 B) 10% $ (139.1 B) $ (31.7 B) 20% $ (89.9 B) $ (21.3 B) 30% $ (65.0 B) $ (16.0 B) 40% $ (48.4 B) $ (12.2 B) 50% $ (36.3 B) $ (9.3 B) 60% $ (26.3 B) $ (6.8 B) 70% $ (16.9 B) $ (4.6 B) 80% $ (8.7 B) $ (2.4 B) 90% $ 0.3 B $ 0.0 B 95% $ 7.2 B $ 2.0 B 99% $ 52.3 B $ 13.6 B
• “HH LNG vs Oil-‐Indexed LNG-‐Total Fuel Expense Monte Carlo” video to be inserted here
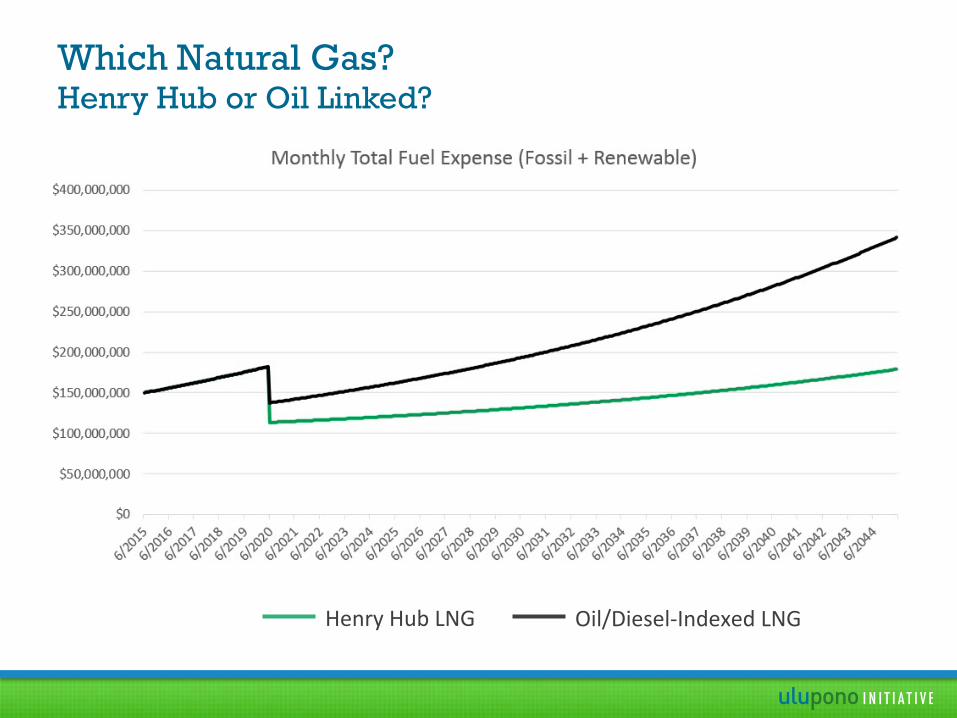
Which Natural Gas? Henry Hub or Oil Linked?
Henry Hub LNG Oil/Diesel-‐Indexed LNG
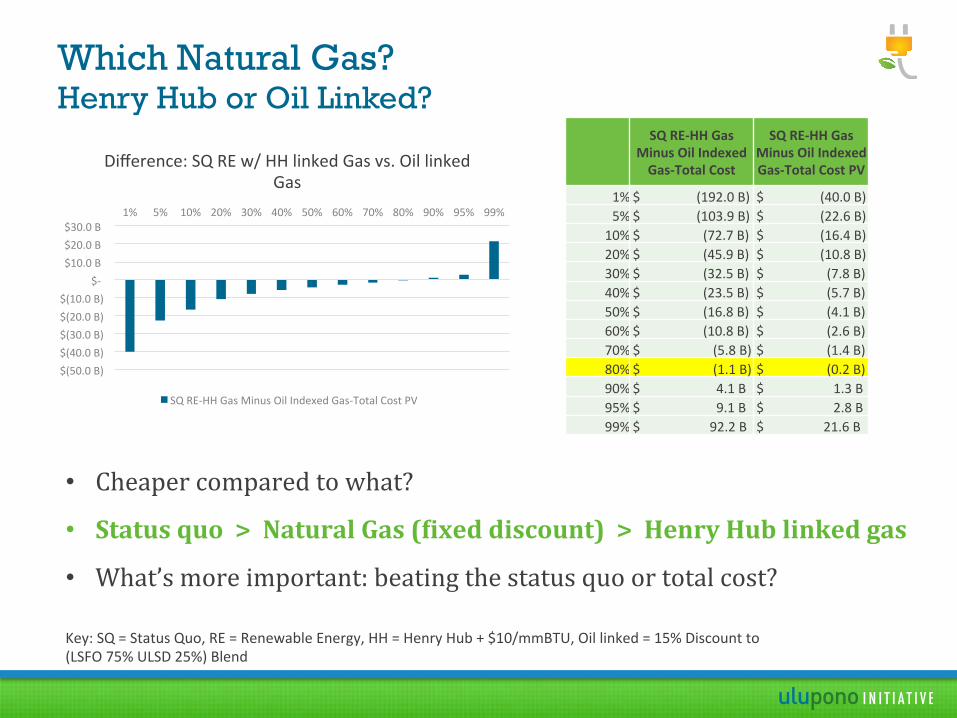
Which Natural Gas? Henry Hub or Oil Linked?
Key: SQ = Status Quo, RE = Renewable Energy, HH = Henry Hub + $10/mmBTU, Oil linked = 15% Discount to (LSFO 75% ULSD 25%) Blend
• Cheaper compared to what?
• Status quo > Natural Gas (Lixed discount) > Henry Hub linked gas
• What’s more important: beating the status quo or total cost?
$(50.0 B) $(40.0 B) $(30.0 B) $(20.0 B) $(10.0 B)
$-‐ $10.0 B $20.0 B $30.0 B
1% 5% 10% 20% 30% 40% 50% 60% 70% 80% 90% 95% 99%
Difference: SQ RE w/ HH linked Gas vs. Oil linked Gas
SQ RE-‐HH Gas Minus Oil Indexed Gas-‐Total Cost PV
SQ RE-‐HH Gas
Minus Oil Indexed Gas-‐Total Cost
SQ RE-‐HH Gas Minus Oil Indexed Gas-‐Total Cost PV
1% $ (192.0 B) $ (40.0 B) 5% $ (103.9 B) $ (22.6 B) 10% $ (72.7 B) $ (16.4 B) 20% $ (45.9 B) $ (10.8 B) 30% $ (32.5 B) $ (7.8 B) 40% $ (23.5 B) $ (5.7 B) 50% $ (16.8 B) $ (4.1 B) 60% $ (10.8 B) $ (2.6 B) 70% $ (5.8 B) $ (1.4 B) 80% $ (1.1 B) $ (0.2 B) 90% $ 4.1 B $ 1.3 B 95% $ 9.1 B $ 2.8 B 99% $ 92.2 B $ 21.6 B
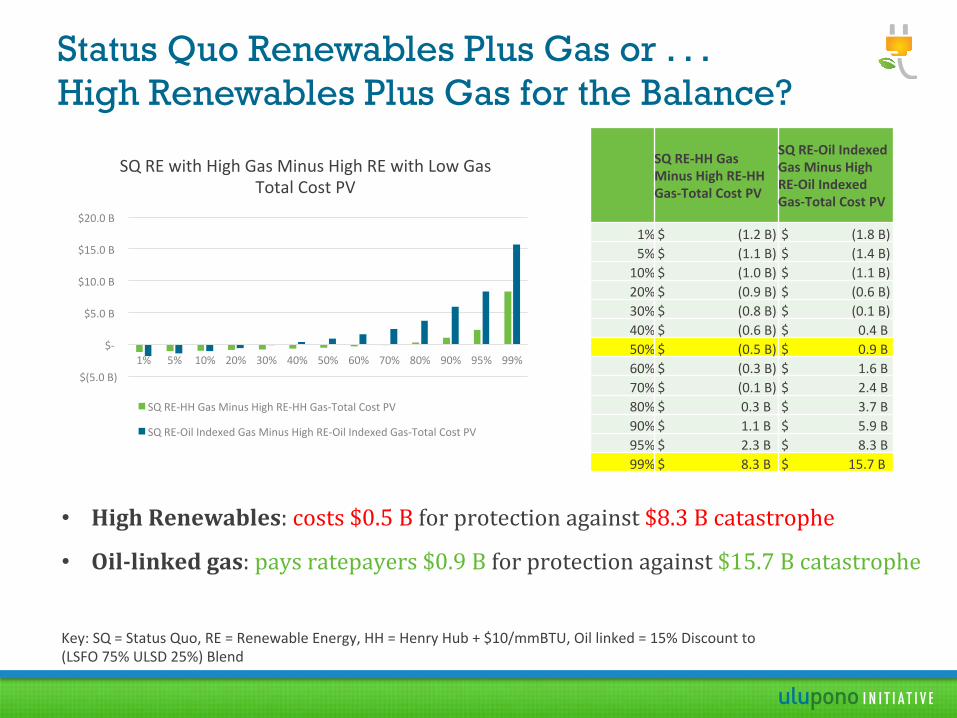
Status Quo Renewables Plus Gas or . . . High Renewables Plus Gas for the Balance?
• High Renewables: costs $0.5 B for protection against $8.3 B catastrophe
• Oil-‐linked gas: pays ratepayers $0.9 B for protection against $15.7 B catastrophe
Key: SQ = Status Quo, RE = Renewable Energy, HH = Henry Hub + $10/mmBTU, Oil linked = 15% Discount to (LSFO 75% ULSD 25%) Blend
$(5.0 B)
$-‐
$5.0 B
$10.0 B
$15.0 B
$20.0 B
1% 5% 10% 20% 30% 40% 50% 60% 70% 80% 90% 95% 99%
SQ RE with High Gas Minus High RE with Low Gas Total Cost PV
SQ RE-‐HH Gas Minus High RE-‐HH Gas-‐Total Cost PV
SQ RE-‐Oil Indexed Gas Minus High RE-‐Oil Indexed Gas-‐Total Cost PV
SQ RE-‐HH Gas Minus High RE-‐HH Gas-‐Total Cost PV
SQ RE-‐Oil Indexed Gas Minus High RE-‐Oil Indexed Gas-‐Total Cost PV
1% $ (1.2 B) $ (1.8 B) 5% $ (1.1 B) $ (1.4 B) 10% $ (1.0 B) $ (1.1 B) 20% $ (0.9 B) $ (0.6 B) 30% $ (0.8 B) $ (0.1 B) 40% $ (0.6 B) $ 0.4 B 50% $ (0.5 B) $ 0.9 B 60% $ (0.3 B) $ 1.6 B 70% $ (0.1 B) $ 2.4 B 80% $ 0.3 B $ 3.7 B 90% $ 1.1 B $ 5.9 B 95% $ 2.3 B $ 8.3 B 99% $ 8.3 B $ 15.7 B
• “High RE w LNG vs SQ RE w LNG-‐Total Fuel Expense Monte Carlo” video to be inserted here
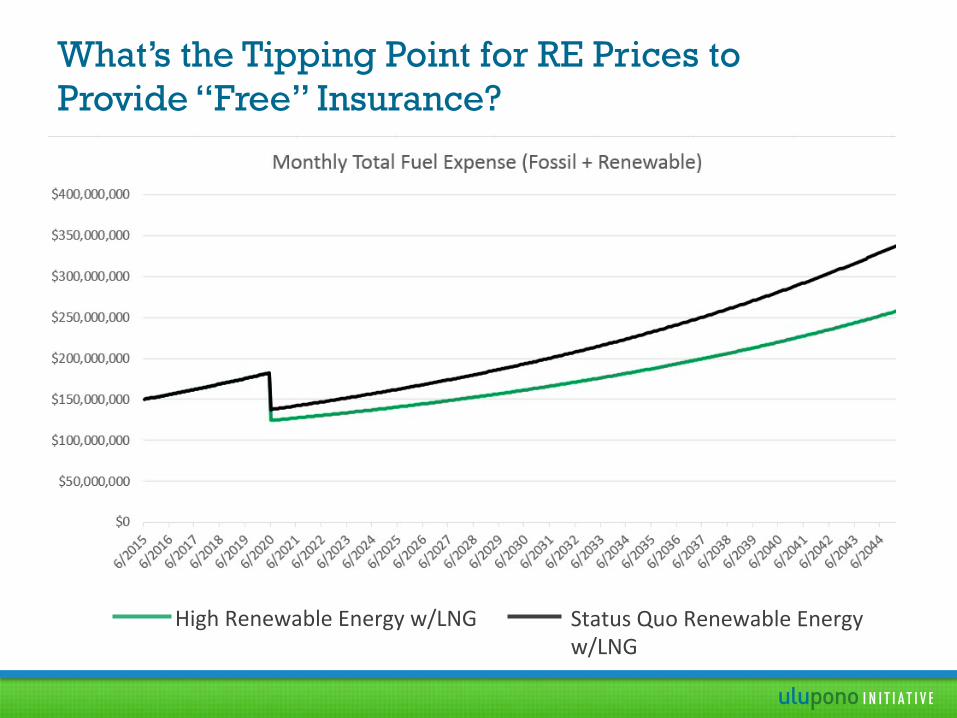
What’s the Tipping Point for RE Prices to Provide “Free” Insurance?
High Renewable Energy w/LNG Status Quo Renewable Energy w/LNG
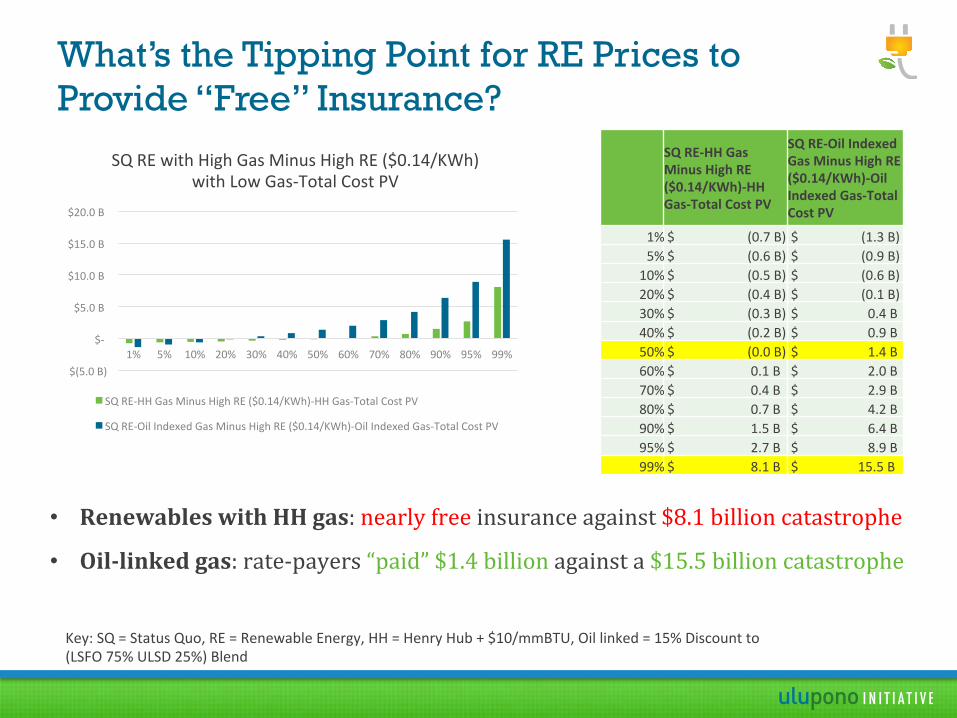
• Renewables with HH gas: nearly free insurance against $8.1 billion catastrophe
• Oil-‐linked gas: rate-‐payers “paid” $1.4 billion against a $15.5 billion catastrophe
Key: SQ = Status Quo, RE = Renewable Energy, HH = Henry Hub + $10/mmBTU, Oil linked = 15% Discount to (LSFO 75% ULSD 25%) Blend
$(5.0 B)
$-‐
$5.0 B
$10.0 B
$15.0 B
$20.0 B
1% 5% 10% 20% 30% 40% 50% 60% 70% 80% 90% 95% 99%
SQ RE with High Gas Minus High RE ($0.14/KWh) with Low Gas-‐Total Cost PV
SQ RE-‐HH Gas Minus High RE ($0.14/KWh)-‐HH Gas-‐Total Cost PV
SQ RE-‐Oil Indexed Gas Minus High RE ($0.14/KWh)-‐Oil Indexed Gas-‐Total Cost PV
SQ RE-‐HH Gas Minus High RE ($0.14/KWh)-‐HH Gas-‐Total Cost PV
SQ RE-‐Oil Indexed Gas Minus High RE ($0.14/KWh)-‐Oil Indexed Gas-‐Total Cost PV
1% $ (0.7 B) $ (1.3 B) 5% $ (0.6 B) $ (0.9 B) 10% $ (0.5 B) $ (0.6 B) 20% $ (0.4 B) $ (0.1 B) 30% $ (0.3 B) $ 0.4 B 40% $ (0.2 B) $ 0.9 B 50% $ (0.0 B) $ 1.4 B 60% $ 0.1 B $ 2.0 B 70% $ 0.4 B $ 2.9 B 80% $ 0.7 B $ 4.2 B 90% $ 1.5 B $ 6.4 B 95% $ 2.7 B $ 8.9 B 99% $ 8.1 B $ 15.5 B
What’s the Tipping Point for RE Prices to Provide “Free” Insurance?
Fuel Choices and Risk: Bottom Line
Fuel Choices and Risk: Bottom Line
Costs passed on to
ratepayers
Fuel Choices and Risk: Bottom Line
Costs passed on to
ratepayers
LNG can save ratepayers billions
Fuel Choices and Risk: Bottom Line
Costs passed on to
ratepayers
LNG can save ratepayers billions
May be locked in for
30+ years
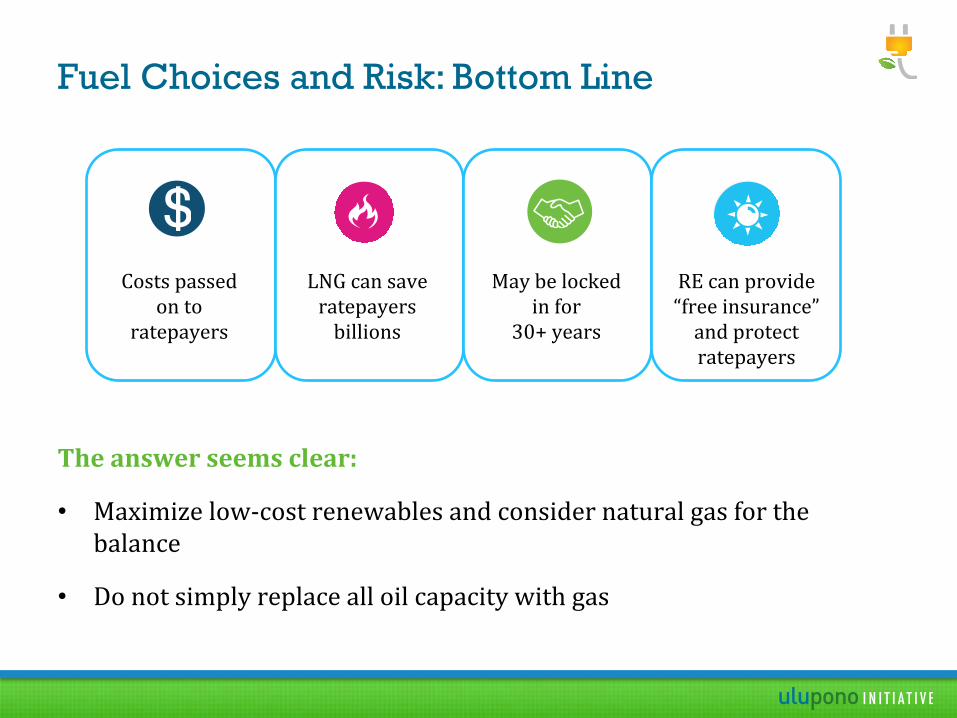
Fuel Choices and Risk: Bottom Line
Costs passed on to
ratepayers
LNG can save ratepayers billions
May be locked in for
30+ years
RE can provide “free insurance” and protect ratepayers
The answer seems clear:
• Maximize low-‐cost renewables and consider natural gas for the balance
• Do not simply replace all oil capacity with gas