Embed Size (px)
Citation preview
Full Year 2014 Results ING Bank posts 2014 underlying net profit of EUR 3,424 million
Ralph Hamers
CEO ING Group
Amsterdam – 11 February 2015 www.ing.com

2
• Significant progress on restructuring in 2014
• Dutch state fully repaid; NN Group stake reduced to 68%; Voya stake down to 19%
• Think Forward strategy launched in March 2014 and now embedded throughout the organisation
• More than one million individual customers and half a million primary customers are added as well as steady stream of innovations during 2014
• Strong full year result reflects higher interest results, strict expense control and lower risk costs
• Underlying net result ING Bank rose to EUR 3,424 mln in 2014, up 8.5% from 2013
• Fourth quarter 2014 underlying result before tax ING Bank EUR 783 mln
• Fourth quarter results impacted by negative CVA/DVA, redundancy provisions, Dutch bank tax and seasonality in Financial Markets
• Dividend payments reinstated for 2014; we propose to pay EUR 470 mln or EUR 0.12 per share
• Guidance confirmed: pay-out a minimum of 40% of ING Group’s annual net profits, effective from 2015
Key points
3
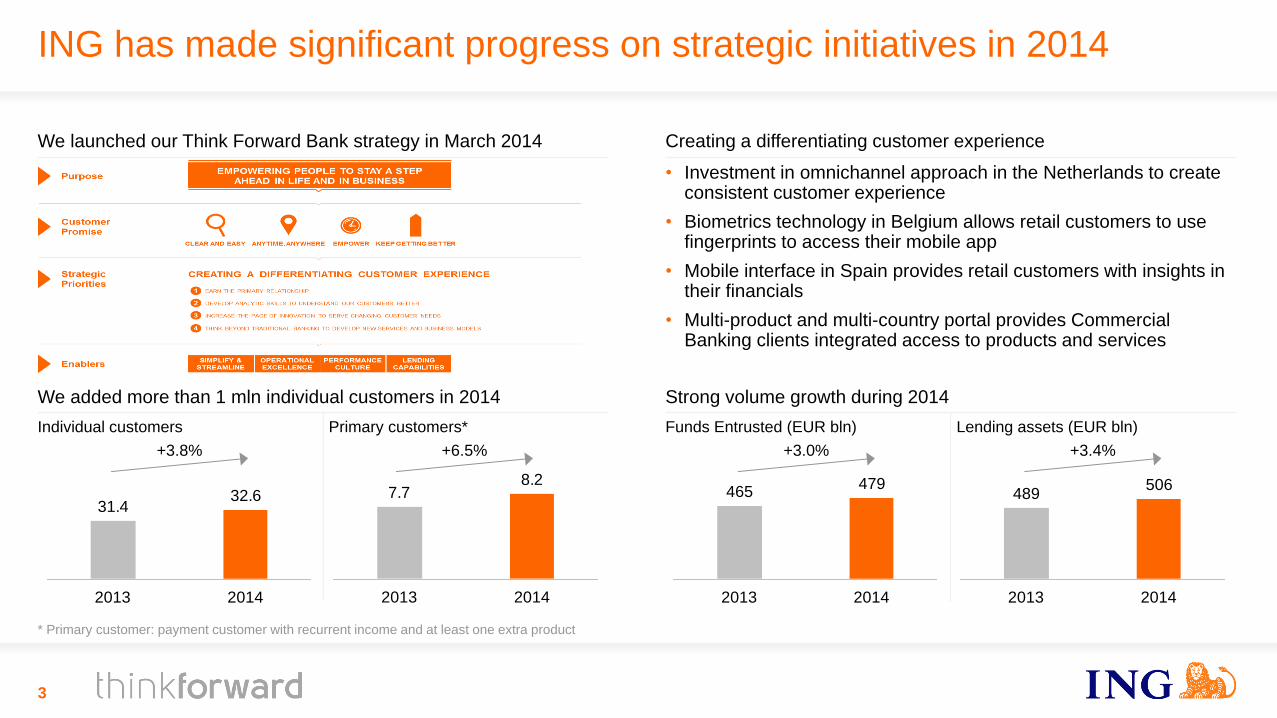
Strong volume growth during 2014
Funds Entrusted (EUR bln) Lending assets (EUR bln)
We added more than 1 mln individual customers in 2014
Individual customers Primary customers*
7.78.2
2013 2014
+6.5%
* Primary customer: payment customer with recurrent income and at least one extra product
31.432.6
2013 2014
+3.8%
465479
2013 2014
+3.0%
489506
2013 2014
+3.4%
Creating a differentiating customer experience
• Investment in omnichannel approach in the Netherlands to create consistent customer experience
• Biometrics technology in Belgium allows retail customers to use fingerprints to access their mobile app
• Mobile interface in Spain provides retail customers with insights in their financials
• Multi-product and multi-country portal provides Commercial Banking clients integrated access to products and services
We launched our Think Forward Bank strategy in March 2014
ING has made significant progress on strategic initiatives in 2014
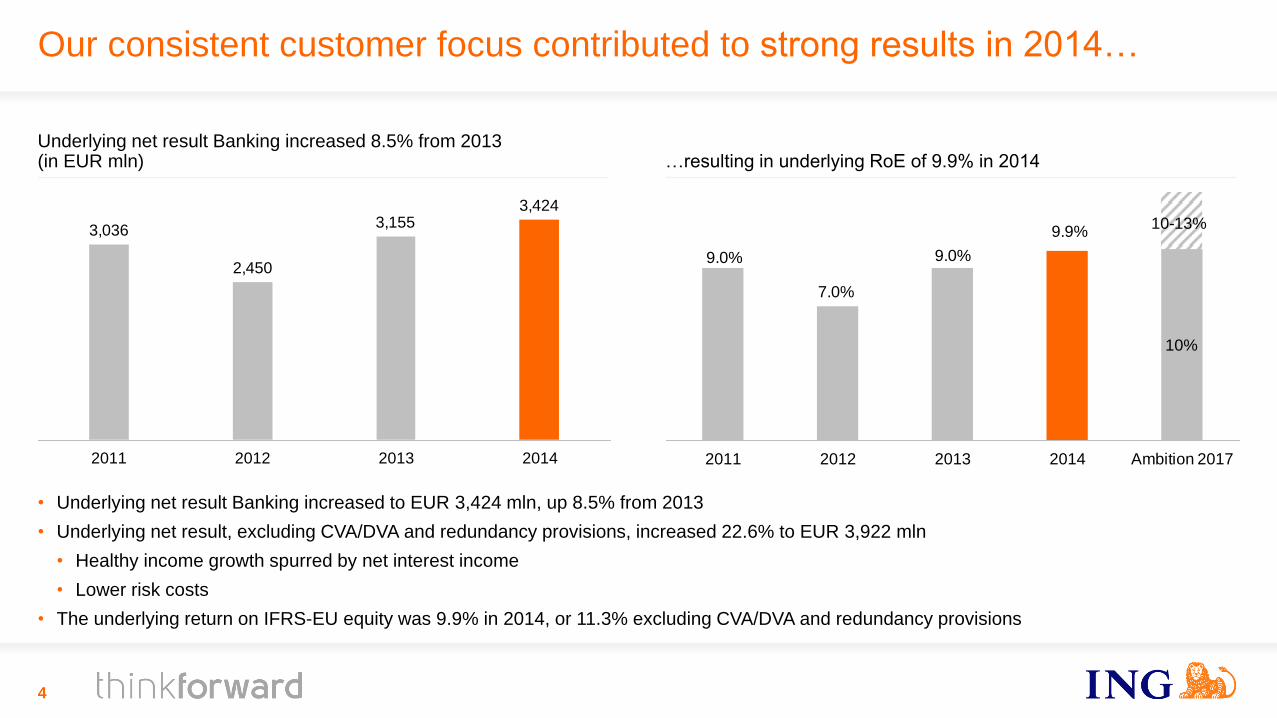
10%
7.0%
9.0%
9.9%10-13%
9.0%
2011 2012 2013 2014 Ambition 2017
Our consistent customer focus contributed to strong results in 2014…
3,036
2,450
3,1553,424
2011 2012 2013 2014
4
• Underlying net result Banking increased to EUR 3,424 mln, up 8.5% from 2013
• Underlying net result, excluding CVA/DVA and redundancy provisions, increased 22.6% to EUR 3,922 mln
• Healthy income growth spurred by net interest income
• Lower risk costs
• The underlying return on IFRS-EU equity was 9.9% in 2014, or 11.3% excluding CVA/DVA and redundancy provisions
Underlying net result Banking increased 8.5% from 2013 (in EUR mln)
…resulting in underlying RoE of 9.9% in 2014
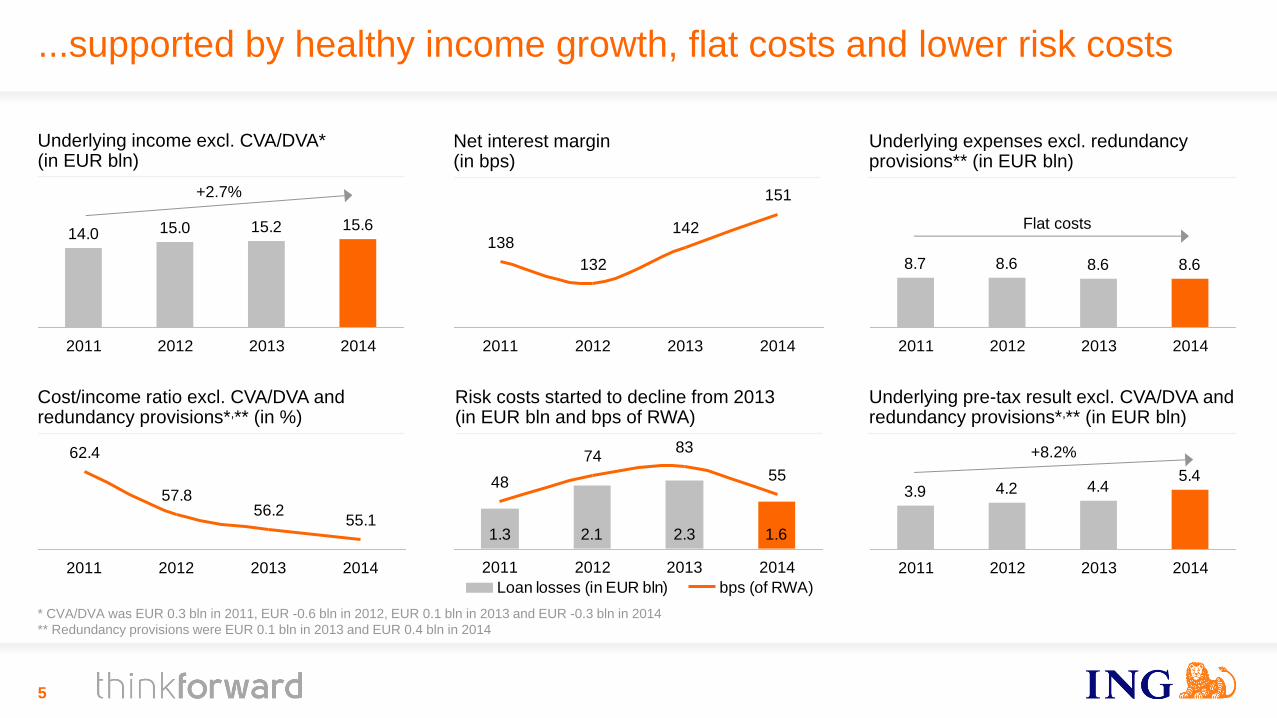
3.9 4.2 4.45.4
2011 2012 2013 2014
8.7 8.6 8.6 8.6
2011 2012 2013 2014
14.0 15.0 15.2 15.6
2011 2012 2013 2014
+2.7%
5
1.3 2.1 2.3 1.6
48
7483
55
2011 2012 2013 2014
Loan losses (in EUR bln) bps (of RWA)
Flat costs
+8.2%
138
132
142
151
2011 2012 2013 2014
Underlying income excl. CVA/DVA* (in EUR bln)
Net interest margin (in bps)
Underlying expenses excl. redundancy provisions** (in EUR bln)
Cost/income ratio excl. CVA/DVA and redundancy provisions*,** (in %)
Risk costs started to decline from 2013 (in EUR bln and bps of RWA)
Underlying pre-tax result excl. CVA/DVA and redundancy provisions*,** (in EUR bln)
* CVA/DVA was EUR 0.3 bln in 2011, EUR -0.6 bln in 2012, EUR 0.1 bln in 2013 and EUR -0.3 bln in 2014
** Redundancy provisions were EUR 0.1 bln in 2013 and EUR 0.4 bln in 2014
62.4
57.856.2
55.1
2011 2012 2013 2014
...supported by healthy income growth, flat costs and lower risk costs
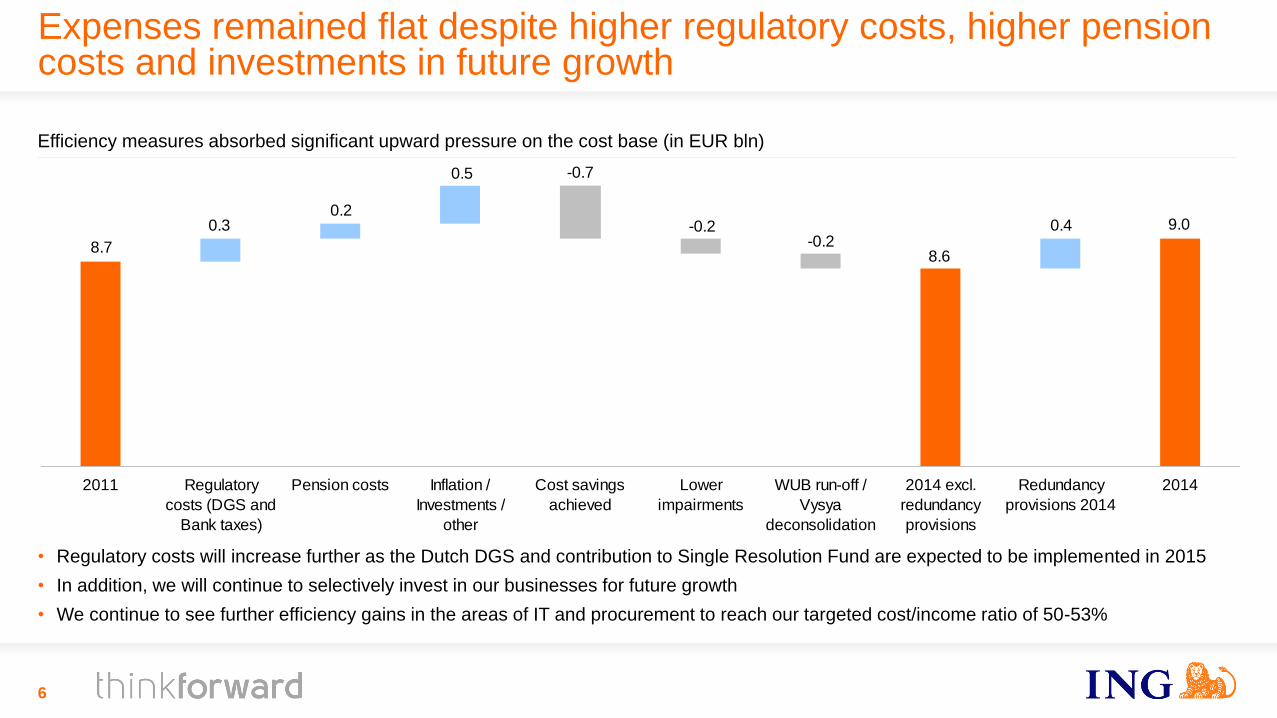
Expenses remained flat despite higher regulatory costs, higher pension costs and investments in future growth
6
Subordinated debt
Average balances NIM
8.6
9.0
8.7
0.4
0.5
0.20.3
-0.2-0.2
-0.7
2011 Regulatory
costs (DGS and
Bank taxes)
Pension costs Inflation /
Investments /
other
Cost savings
achieved
Lower
impairments
WUB run-off /
Vysya
deconsolidation
2014 excl.
redundancy
provisions
Redundancy
provisions 2014
2014
Efficiency measures absorbed significant upward pressure on the cost base (in EUR bln)
• Regulatory costs will increase further as the Dutch DGS and contribution to Single Resolution Fund are expected to be implemented in 2015
• In addition, we will continue to selectively invest in our businesses for future growth
• We continue to see further efficiency gains in the areas of IT and procurement to reach our targeted cost/income ratio of 50-53%

100
220
300
90100
10
4Q14 2015 2016 2017 >2018
375
Additional IT investments will deliver better service and harmonise systems and processes resulting in additional cost savings
7
Cost savings (in EUR mln)
Announced Cost savings
achieved Cost savings
by 2017 Cost savings
by 2018
Retail Banking NL
2011-13 354 480 480
2014 195 260
ING Bank Belgium
2012 105 160 160
Commercial Banking
2012 203 315 315
2014 25 40
Total Bank
662 1,175 1,255
Redundancy provisions, investments and accumulated savings programs announced in 4Q14 (in EUR mln)
• In November 2014, we announced to take the next steps in digital banking in the Netherlands
• Omnichannel approach to create consistent customer service
• Investment of EUR 200 mln to further simplify and automate IT
• Reduction of Dutch workforce by 1,700 internal FTEs over 3-year period
• Pre-tax provision of EUR 325 mln in 4Q14
• Annual gross savings of around EUR 270 mln from 2018*
• In 4Q, we have also taken additional steps in Commercial Banking related to the ongoing transformation programme
• Net reduction of workforce by 250 FTEs over a three-year period
• Pre-tax provision of EUR 39 mln in 4Q14
• Annual cost savings of around EUR 30 million from 2018
• In 4Q14, we have also taken a provision of EUR 11 mln for further restructuring at WUB (related to outsourcing of activities)
* Approximately 5% of the savings are related to Commercial Banking
Redundancy provision Investments Accumulated savings
4Q14 results
8
Underlying pre-tax result ING Bank (in EUR mln)
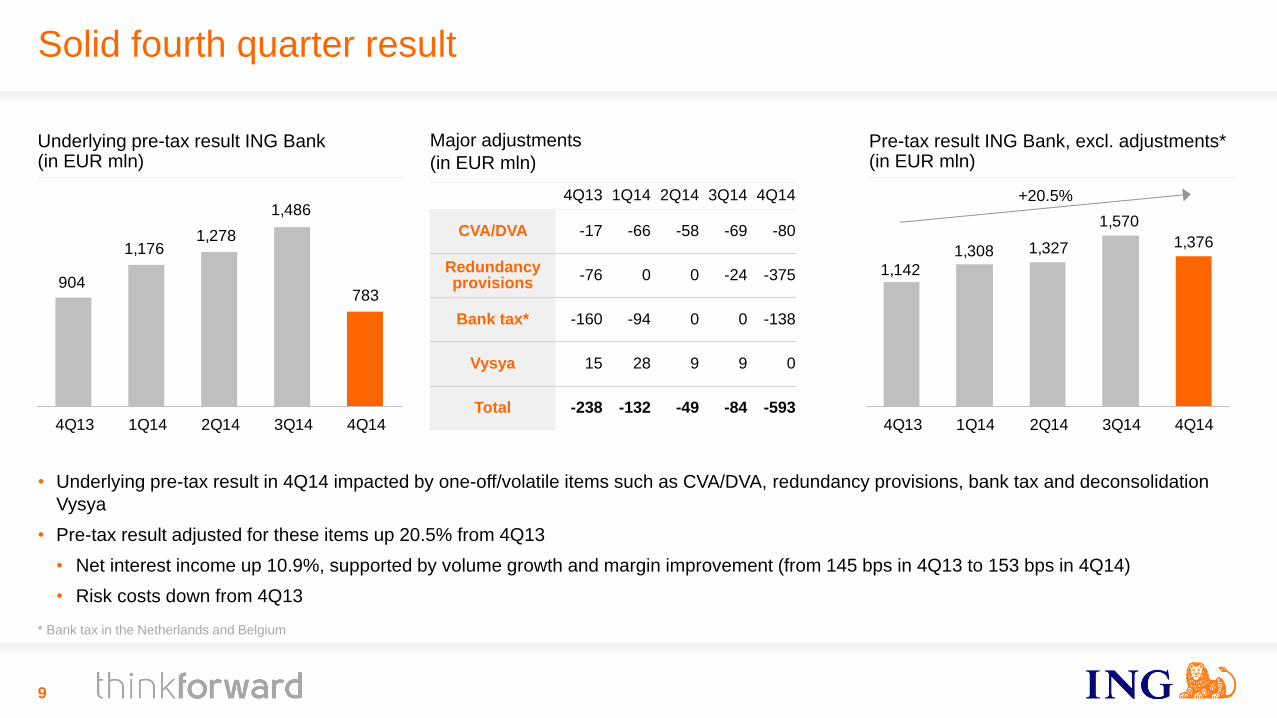
Solid fourth quarter result
• Underlying pre-tax result in 4Q14 impacted by one-off/volatile items such as CVA/DVA, redundancy provisions, bank tax and deconsolidation
Vysya
• Pre-tax result adjusted for these items up 20.5% from 4Q13
• Net interest income up 10.9%, supported by volume growth and margin improvement (from 145 bps in 4Q13 to 153 bps in 4Q14)
• Risk costs down from 4Q13
783
1,486
1,2781,176
904
4Q13 1Q14 2Q14 3Q14 4Q14
Pre-tax result ING Bank, excl. adjustments* (in EUR mln)
9
1,142
1,308 1,327 1,376
1,570
4Q13 1Q14 2Q14 3Q14 4Q14
Major adjustments
(in EUR mln)
4Q13 1Q14 2Q14 3Q14 4Q14
CVA/DVA -17 -66 -58 -69 -80
Redundancy provisions
-76 0 0 -24 -375
Bank tax* -160 -94 0 0 -138
Vysya 15 28 9 9 0
Total -238 -132 -49 -84 -593
* Bank tax in the Netherlands and Belgium
+20.5%
Lending Assets ING Bank, 2014 (Client Balances, in EUR bln)
489.4
506.00.5
8.1
5.11.6
5.4
6.9 2.4-1.4 -2.9-4.0
-3.0
-2.0
31/12/13 Retail NL Retail
Belgium
Retail
Germany
Retail
RoW*
CB SF* CB REF* CB
GL&TS*
CB Other* WUB run-
off /
transfers**
Vysya
decon-
solidation
Lease and
other run-
off/sales***
FX 31/12/14
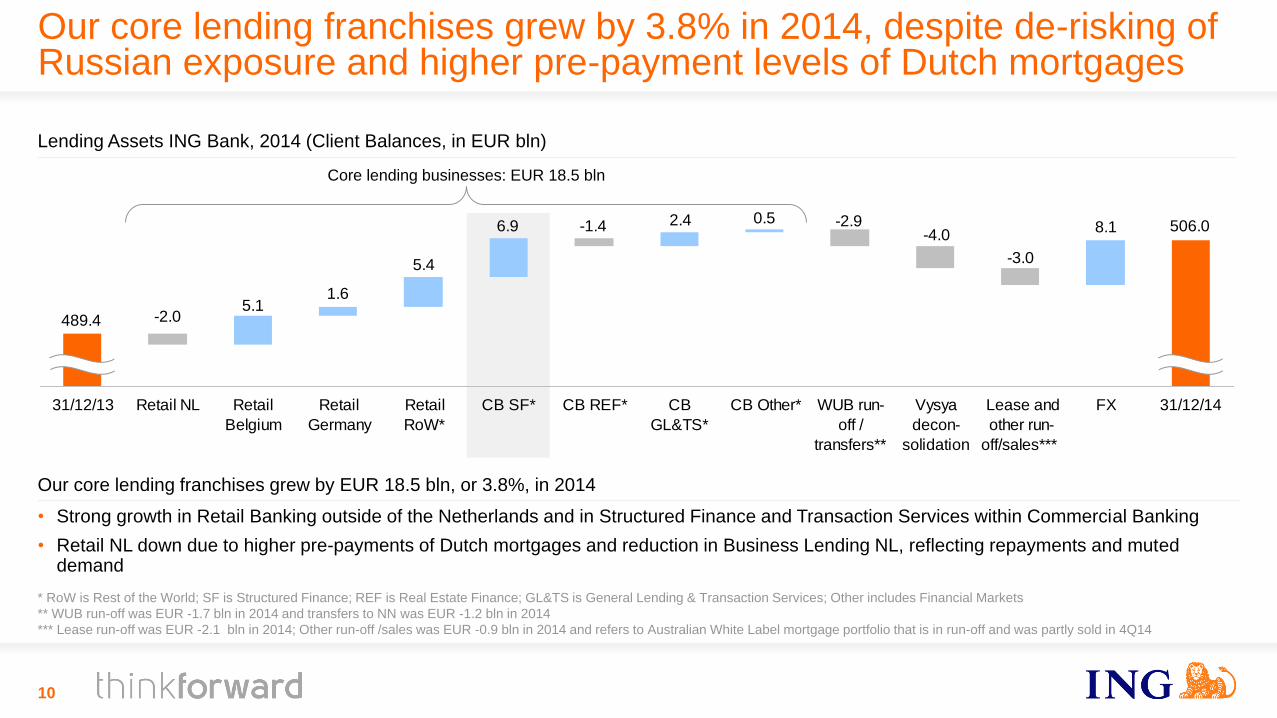
Our core lending franchises grew by EUR 18.5 bln, or 3.8%, in 2014
• Strong growth in Retail Banking outside of the Netherlands and in Structured Finance and Transaction Services within Commercial Banking
• Retail NL down due to higher pre-payments of Dutch mortgages and reduction in Business Lending NL, reflecting repayments and muted demand
10
* RoW is Rest of the World; SF is Structured Finance; REF is Real Estate Finance; GL&TS is General Lending & Transaction Services; Other includes Financial Markets
** WUB run-off was EUR -1.7 bln in 2014 and transfers to NN was EUR -1.2 bln in 2014
*** Lease run-off was EUR -2.1 bln in 2014; Other run-off /sales was EUR -0.9 bln in 2014 and refers to Australian White Label mortgage portfolio that is in run-off and was partly sold in 4Q14
Our core lending franchises grew by 3.8% in 2014, despite de-risking of Russian exposure and higher pre-payment levels of Dutch mortgages
Core lending businesses: EUR 18.5 bln
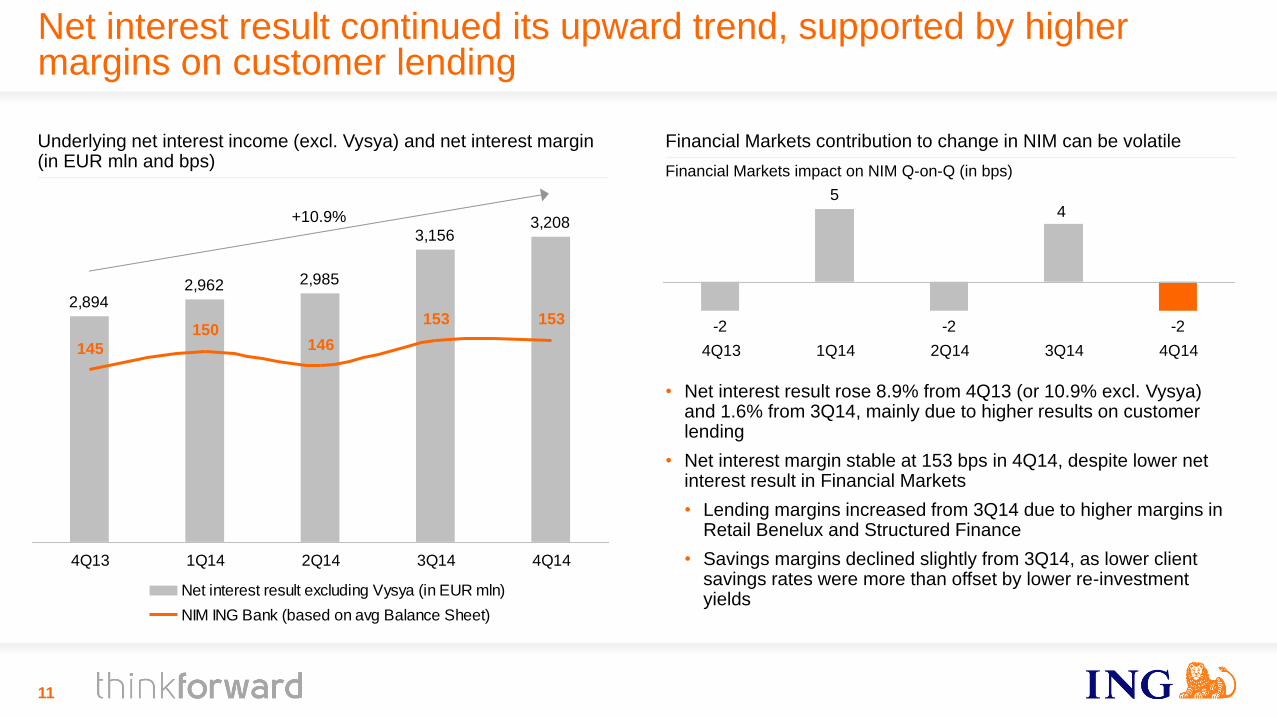
Net interest result continued its upward trend, supported by higher margins on customer lending
2,962
3,1563,208
2,894
2,985
145
150146
153 153
4Q13 1Q14 2Q14 3Q14 4Q14
Net interest result excluding Vysya (in EUR mln)
NIM ING Bank (based on avg Balance Sheet)
Underlying net interest income (excl. Vysya) and net interest margin (in EUR mln and bps)
-2
5
-2
4
-2
2Q14 3Q14 4Q14 4Q13 1Q14
11
Financial Markets contribution to change in NIM can be volatile
Financial Markets impact on NIM Q-on-Q (in bps)
• Net interest result rose 8.9% from 4Q13 (or 10.9% excl. Vysya) and 1.6% from 3Q14, mainly due to higher results on customer lending
• Net interest margin stable at 153 bps in 4Q14, despite lower net interest result in Financial Markets
• Lending margins increased from 3Q14 due to higher margins in Retail Benelux and Structured Finance
• Savings margins declined slightly from 3Q14, as lower client savings rates were more than offset by lower re-investment yields
+10.9%
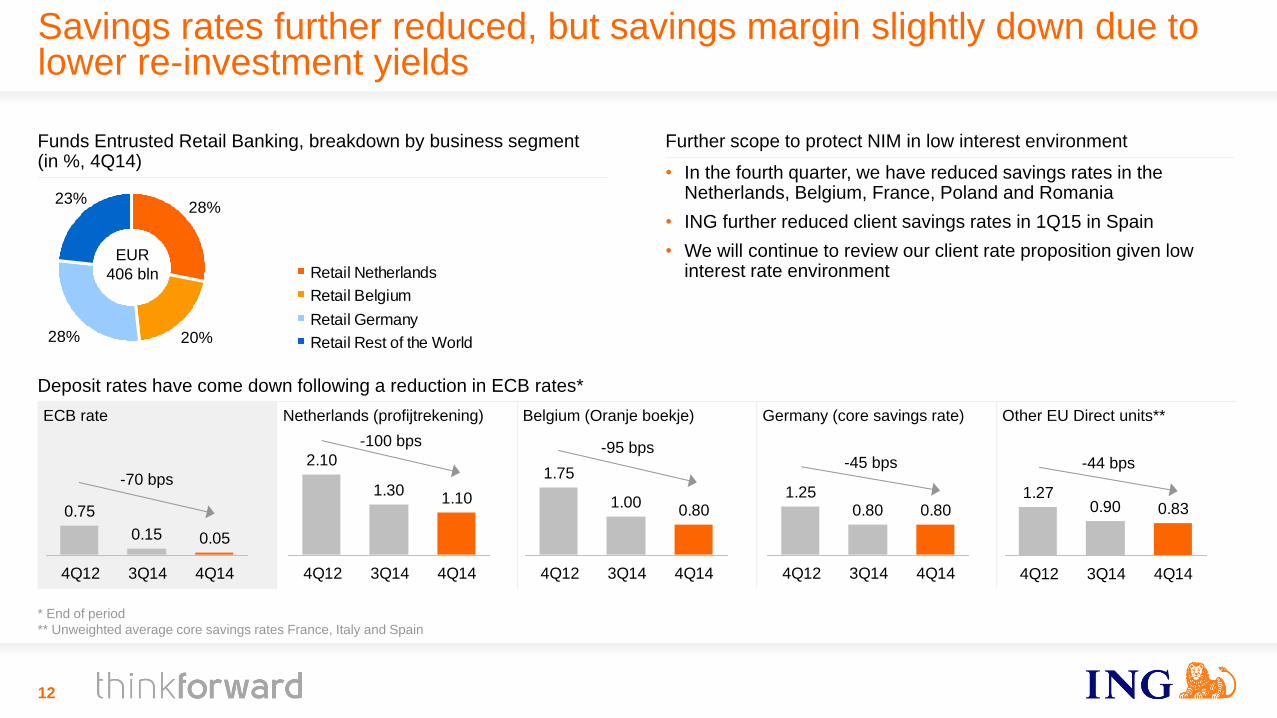
Deposit rates have come down following a reduction in ECB rates*
ECB rate
Netherlands (profijtrekening) Belgium (Oranje boekje) Germany (core savings rate) Other EU Direct units**
2.10
1.301.10
4Q12 3Q14 4Q14
12
0.75
0.15 0.05
4Q12 3Q14 4Q14
1.75
1.000.80
4Q12 3Q14 4Q14
1.250.80 0.80
4Q12 3Q14 4Q14
-70 bps
-100 bps -95 bps -45 bps
* End of period
** Unweighted average core savings rates France, Italy and Spain
20%28%
28%23%
Retail Netherlands
Retail Belgium
Retail Germany
Retail Rest of the World
EUR
406 bln
Further scope to protect NIM in low interest environment
• In the fourth quarter, we have reduced savings rates in the Netherlands, Belgium, France, Poland and Romania
• ING further reduced client savings rates in 1Q15 in Spain
• We will continue to review our client rate proposition given low interest rate environment
Funds Entrusted Retail Banking, breakdown by business segment (in %, 4Q14)
Savings rates further reduced, but savings margin slightly down due to lower re-investment yields
1.270.90 0.83
4Q12 3Q14 4Q14
-44 bps
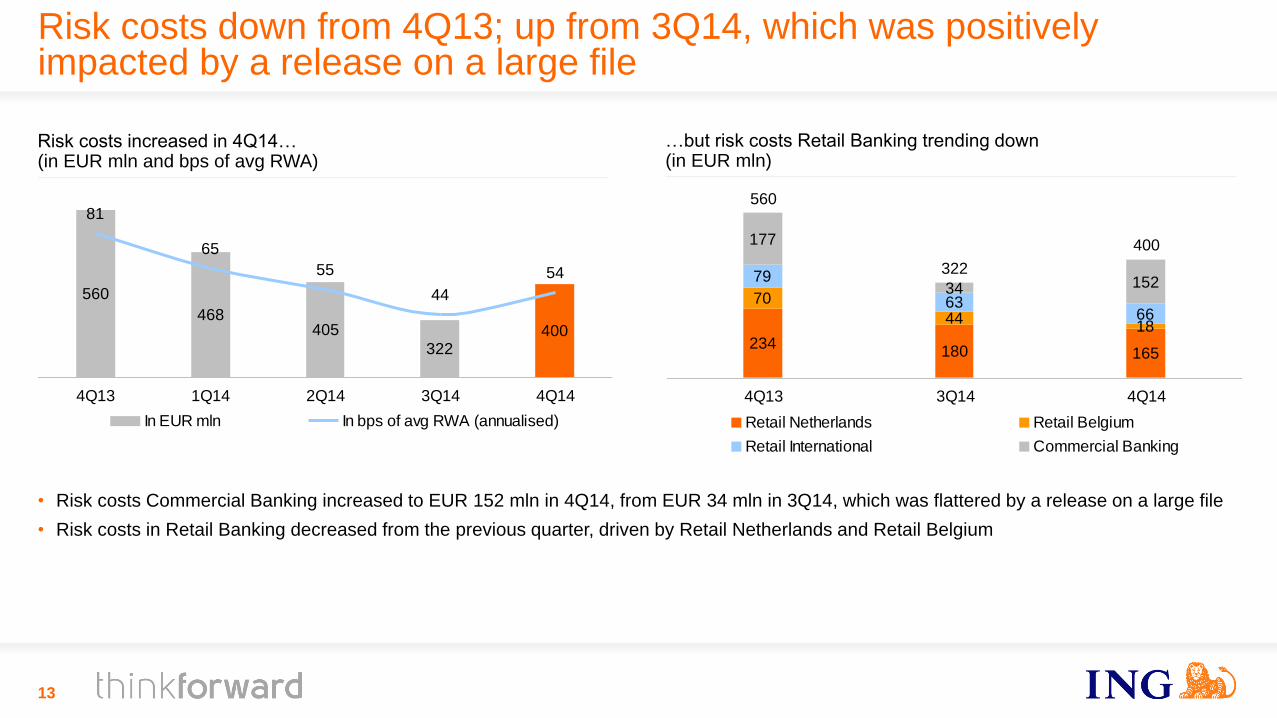
…but risk costs Retail Banking trending down (in EUR mln)
Risk costs down from 4Q13; up from 3Q14, which was positively impacted by a release on a large file
70
441866
152
234180 165
79
63
177
34
4Q13 3Q14 4Q14
Retail Netherlands Retail Belgium
Retail International Commercial Banking
• Risk costs Commercial Banking increased to EUR 152 mln in 4Q14, from EUR 34 mln in 3Q14, which was flattered by a release on a large file
• Risk costs in Retail Banking decreased from the previous quarter, driven by Retail Netherlands and Retail Belgium
560
468405
322400
81
65
54
44
55
4Q13 1Q14 2Q14 3Q14 4Q14
In EUR mln In bps of avg RWA (annualised)
560
Risk costs increased in 4Q14… (in EUR mln and bps of avg RWA)
322
400
13

NPL ratio rose to 3.0%, reflecting new forbearance definition
• The NPL ratio increased slightly to 3.0% in 4Q14 due to the implementation of the EBA forbearance definition in 4Q14
• Customers with loan modification have been retrospectively reclassified as non-performing to comply with EBA definitions
• Impact of forbearance mainly visible in our residential mortgage portfolios within Retail Banking
• The NPL ratio of Commercial Banking decreased slightly, driven by lower non-performing loans in Real Estate Finance
15.716.9
15.716.415.9
2.8 2.8 2.9 2.83.0
4Q13* 1Q14* 2Q14 3Q14 4Q14
Non-performing loans (in EUR bln) Non-performing loans (in %)
Non-performing loans excl. deconsolidation Vysya (in % and EUR bln)
14
* 4Q13-1Q14 are restated for the deconsolidation of Vysya
NPL ratio (in %)
4Q14 3Q14
Retail Banking
- Dutch Mortgages 2.6 2.0
- Business Lending NL 7.8 7.8
- Retail Belgium 3.2 3.2
- Retail International 1.3 1.2
Commercial Banking
- Structured Finance 2.1 2.0
- RE Finance 8.1 10.5
- General Lending & TS 2.0 1.9
- Lease run-off 21.8 19.8
Other Retail and Commercial Banking
- Other RB and CB 6.4 2.8
Total / average 3.0 2.8
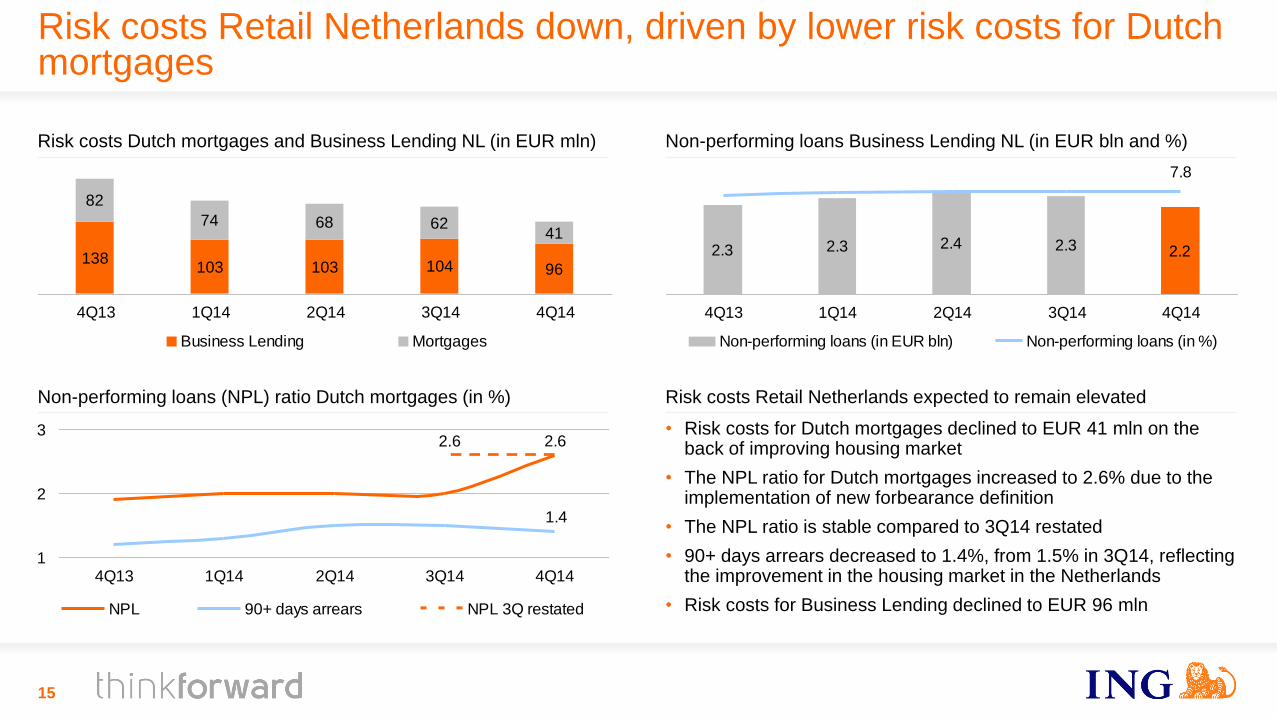
Risk costs Retail Netherlands down, driven by lower risk costs for Dutch mortgages
15
138103 103 104 96
82
74 68 6241
4Q13 1Q14 2Q14 3Q14 4Q14
Business Lending Mortgages
2.6
1.4
1
2
3
4Q13 1Q14 2Q14 3Q14 4Q14
NPL 90+ days arrears NPL 3Q restated
2.3 2.22.32.42.3
7.8
4Q13 1Q14 2Q14 3Q14 4Q14
Non-performing loans (in EUR bln) Non-performing loans (in %)
Risk costs Dutch mortgages and Business Lending NL (in EUR mln) Non-performing loans Business Lending NL (in EUR bln and %)
Non-performing loans (NPL) ratio Dutch mortgages (in %) Risk costs Retail Netherlands expected to remain elevated
• Risk costs for Dutch mortgages declined to EUR 41 mln on the back of improving housing market
• The NPL ratio for Dutch mortgages increased to 2.6% due to the implementation of new forbearance definition
• The NPL ratio is stable compared to 3Q14 restated
• 90+ days arrears decreased to 1.4%, from 1.5% in 3Q14, reflecting the improvement in the housing market in the Netherlands
• Risk costs for Business Lending declined to EUR 96 mln
2.6
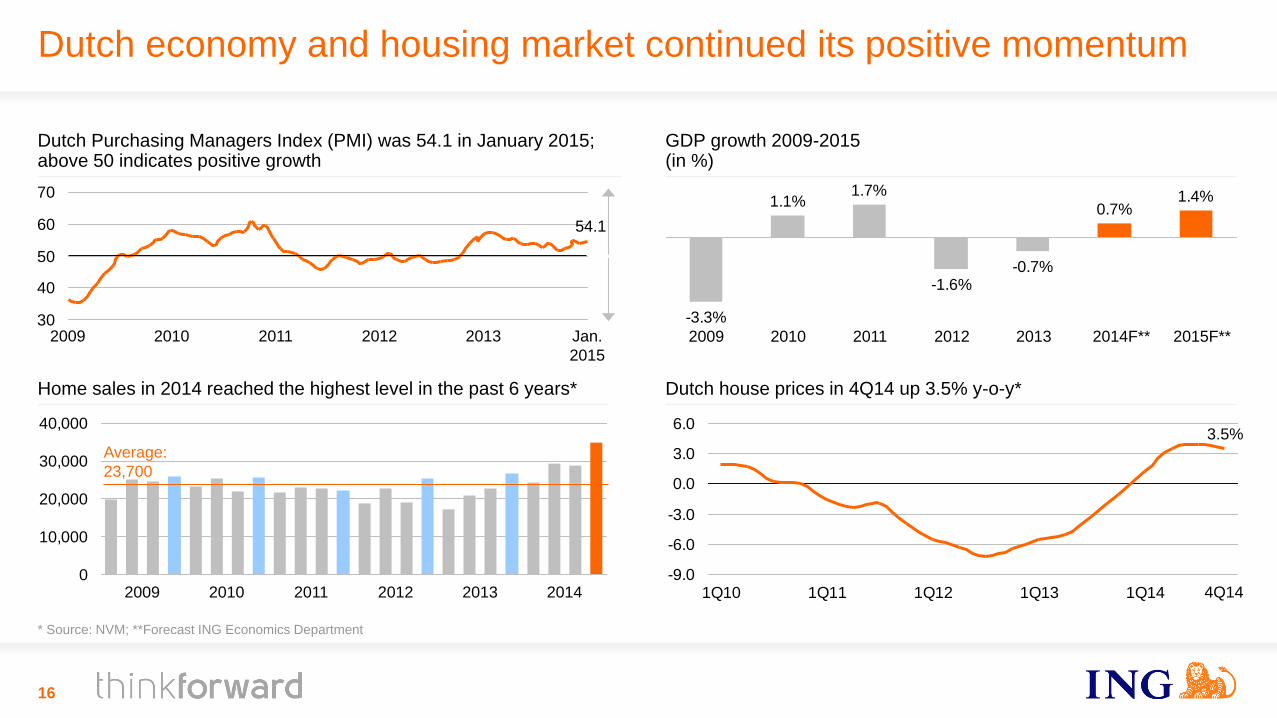
Dutch house prices in 4Q14 up 3.5% y-o-y*
Dutch Purchasing Managers Index (PMI) was 54.1 in January 2015; above 50 indicates positive growth
30
40
50
60
70
-9.0
-6.0
-3.0
0.0
3.0
6.0
1Q10 1Q11 1Q12 1Q13 1Q14
Dutch economy and housing market continued its positive momentum
1.1%1.7%
-1.6%-0.7%
0.7%1.4%
-3.3%
3.5%
Home sales in 2014 reached the highest level in the past 6 years*
GDP growth 2009-2015 (in %)
2009 2010 2011 2012 2013 Jan.
2015
54.1
* Source: NVM; **Forecast ING Economics Department
16
4Q14 0
10,000
20,000
30,000
40,000
Average:
23,700
2014 2009 2010 2011 2012 2013
2009 2010 2011 2012 2013 2014F** 2015F**

Strong capital position at Bank and Group level…
17
• ING Bank’s CET1 ratio on a fully-loaded basis increased to 11.4% due to retained earnings and higher revaluation reserves
• ING Group CET1 phased-in ratio increased to 13.5% in 4Q14, from 13.2% in 3Q14, largely due to the net profit in 4Q14 after excluding the proposed dividend. This ratio is well in excess of 10.5%, which we understand will be the regulatory guidance level for the Group
• Following the divestment of the Insurance stakes, the pro-forma Group CET1 ratio on a fully loaded basis is 13.1%, well in excess of the Bank
ING Bank CET1 fully-loaded ratio increased to 11.4% ING Group CET1 phased-in ratio increased to 13.5%
13.2% 13.5%
3Q14 4Q14
11.1% 11.4%
3Q14 4Q14
40%
4Q14 2015F
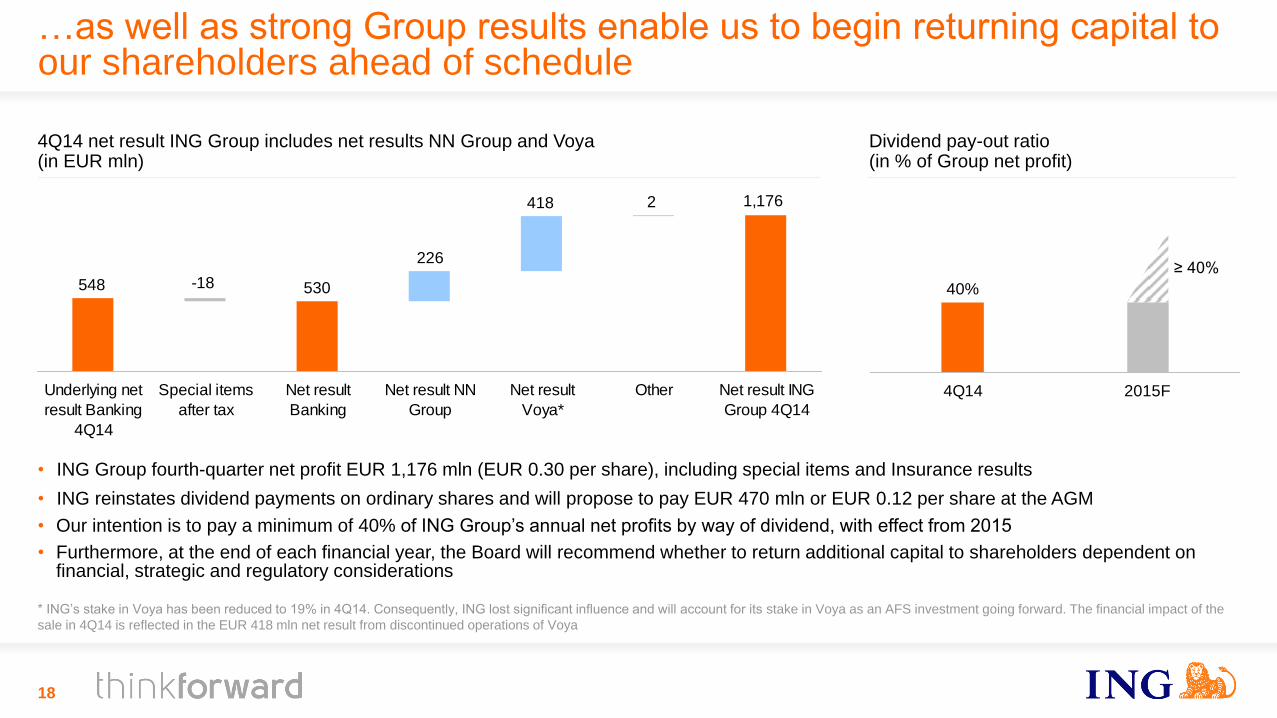
…as well as strong Group results enable us to begin returning capital to our shareholders ahead of schedule
18
• ING Group fourth-quarter net profit EUR 1,176 mln (EUR 0.30 per share), including special items and Insurance results
• ING reinstates dividend payments on ordinary shares and will propose to pay EUR 470 mln or EUR 0.12 per share at the AGM
• Our intention is to pay a minimum of 40% of ING Group’s annual net profits by way of dividend, with effect from 2015
• Furthermore, at the end of each financial year, the Board will recommend whether to return additional capital to shareholders dependent on financial, strategic and regulatory considerations
1,176
530548 -18
2418
226
Underlying net
result Banking
4Q14
Special items
after tax
Net result
Banking
Net result NN
Group
Net result
Voya*
Other Net result ING
Group 4Q14
* ING’s stake in Voya has been reduced to 19% in 4Q14. Consequently, ING lost significant influence and will account for its stake in Voya as an AFS investment going forward. The financial impact of the
sale in 4Q14 is reflected in the EUR 418 mln net result from discontinued operations of Voya
4Q14 net result ING Group includes net results NN Group and Voya (in EUR mln)
Dividend pay-out ratio (in % of Group net profit)
≥ 40%
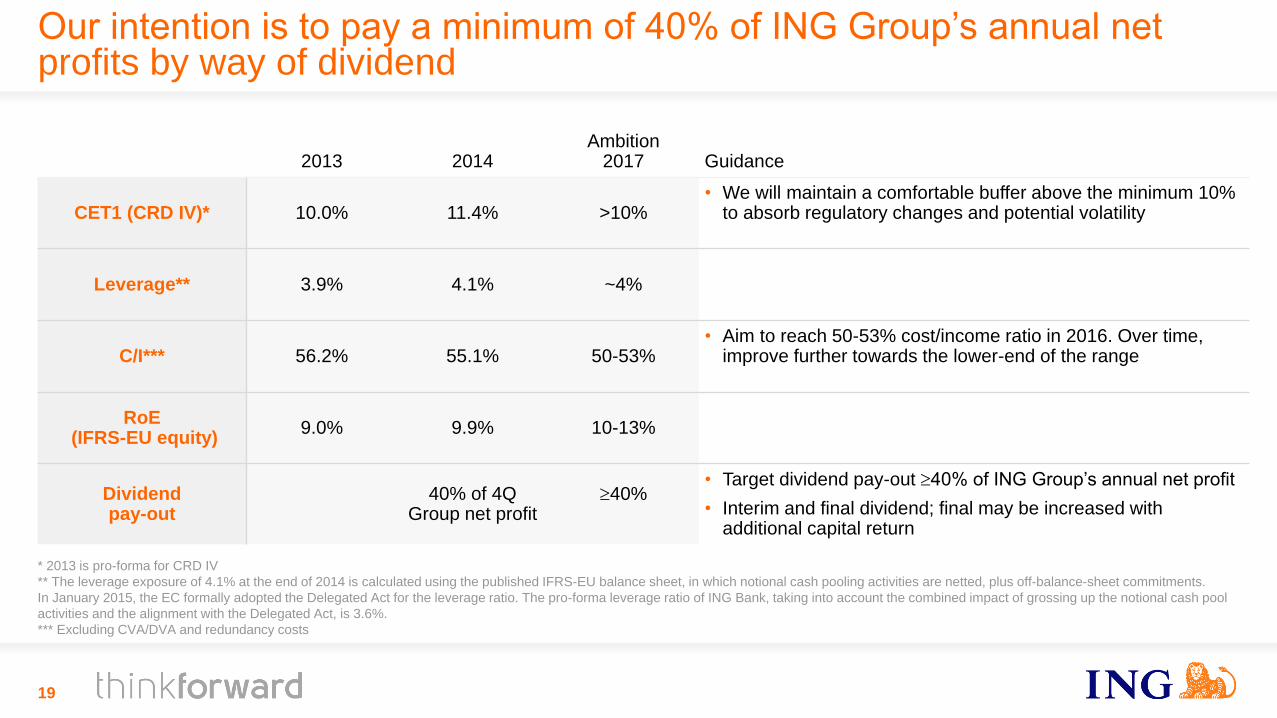
Our intention is to pay a minimum of 40% of ING Group’s annual net profits by way of dividend
19
2013 2014 Ambition
2017 Guidance
CET1 (CRD IV)* 10.0% 11.4% >10% • We will maintain a comfortable buffer above the minimum 10%
to absorb regulatory changes and potential volatility
Leverage** 3.9% 4.1% ~4%
C/I*** 56.2% 55.1% 50-53% • Aim to reach 50-53% cost/income ratio in 2016. Over time,
improve further towards the lower-end of the range
RoE (IFRS-EU equity)
9.0% 9.9% 10-13%
Dividend pay-out
40% of 4Q Group net profit
40%
• Target dividend pay-out 40% of ING Group’s annual net profit
• Interim and final dividend; final may be increased with additional capital return
* 2013 is pro-forma for CRD IV
** The leverage exposure of 4.1% at the end of 2014 is calculated using the published IFRS-EU balance sheet, in which notional cash pooling activities are netted, plus off-balance-sheet commitments.
In January 2015, the EC formally adopted the Delegated Act for the leverage ratio. The pro-forma leverage ratio of ING Bank, taking into account the combined impact of grossing up the notional cash pool
activities and the alignment with the Delegated Act, is 3.6%.
*** Excluding CVA/DVA and redundancy costs

Wrap up
20
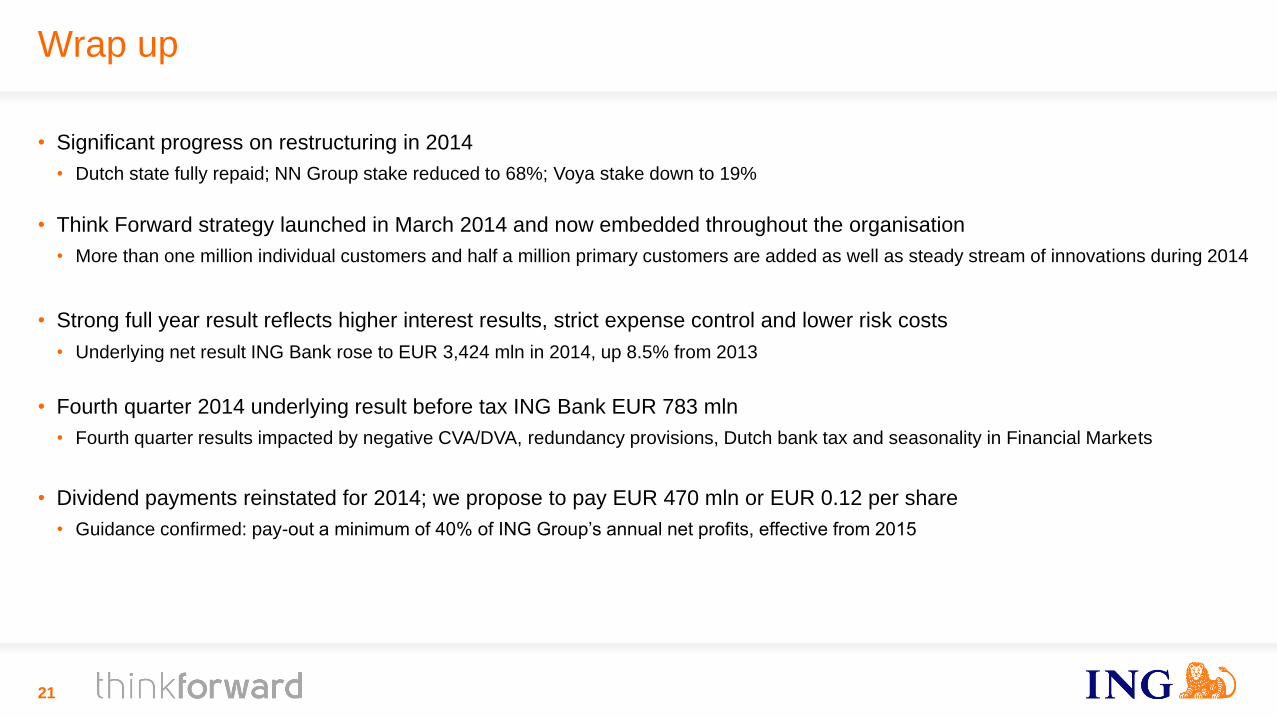
Wrap up
21
• Significant progress on restructuring in 2014
• Dutch state fully repaid; NN Group stake reduced to 68%; Voya stake down to 19%
• Think Forward strategy launched in March 2014 and now embedded throughout the organisation
• More than one million individual customers and half a million primary customers are added as well as steady stream of innovations during 2014
• Strong full year result reflects higher interest results, strict expense control and lower risk costs
• Underlying net result ING Bank rose to EUR 3,424 mln in 2014, up 8.5% from 2013
• Fourth quarter 2014 underlying result before tax ING Bank EUR 783 mln
• Fourth quarter results impacted by negative CVA/DVA, redundancy provisions, Dutch bank tax and seasonality in Financial Markets
• Dividend payments reinstated for 2014; we propose to pay EUR 470 mln or EUR 0.12 per share
• Guidance confirmed: pay-out a minimum of 40% of ING Group’s annual net profits, effective from 2015
Appendix
22
Full year 2014 net profit ING Group
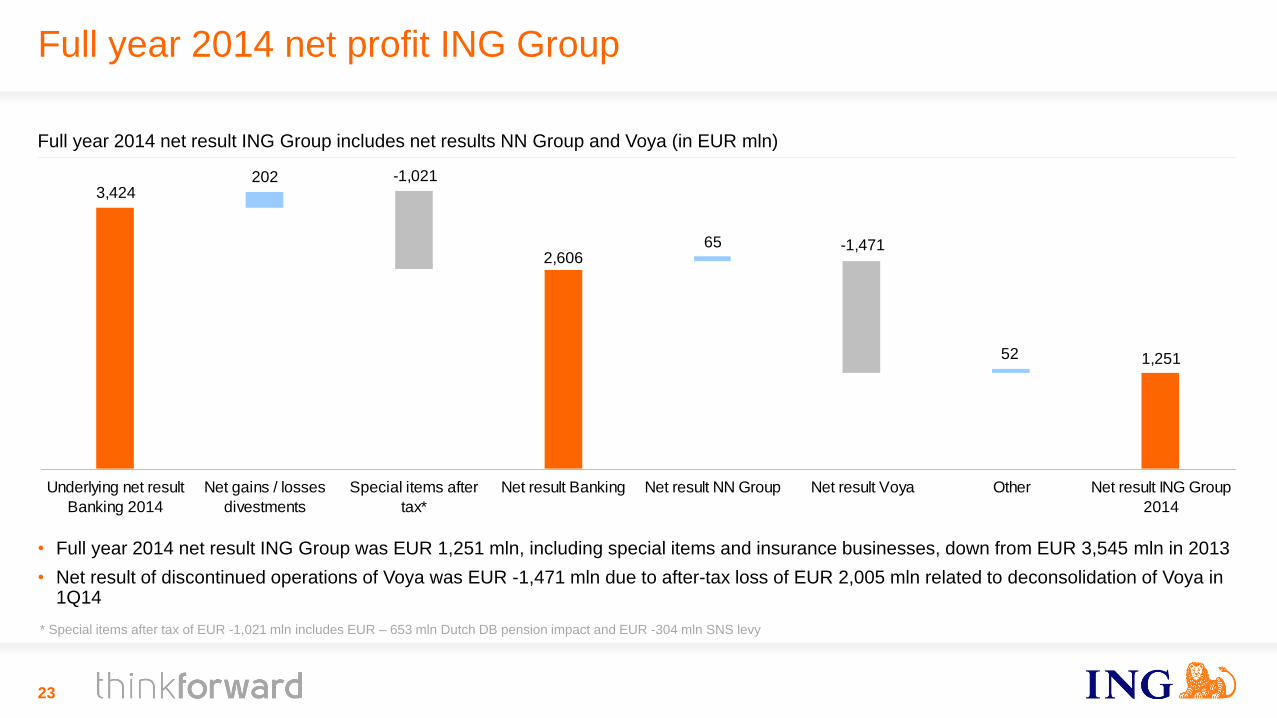
• Full year 2014 net result ING Group was EUR 1,251 mln, including special items and insurance businesses, down from EUR 3,545 mln in 2013
• Net result of discontinued operations of Voya was EUR -1,471 mln due to after-tax loss of EUR 2,005 mln related to deconsolidation of Voya in 1Q14
23
* Special items after tax of EUR -1,021 mln includes EUR – 653 mln Dutch DB pension impact and EUR -304 mln SNS levy
Full year 2014 net result ING Group includes net results NN Group and Voya (in EUR mln)
2,606
1,251
3,424
-1,471
-1,021
52
202
65
Underlying net result
Banking 2014
Net gains / losses
divestments
Special items after
tax*
Net result Banking Net result NN Group Net result Voya Other Net result ING Group
2014
Reported ING Group capital structure at 31 December 2014
24
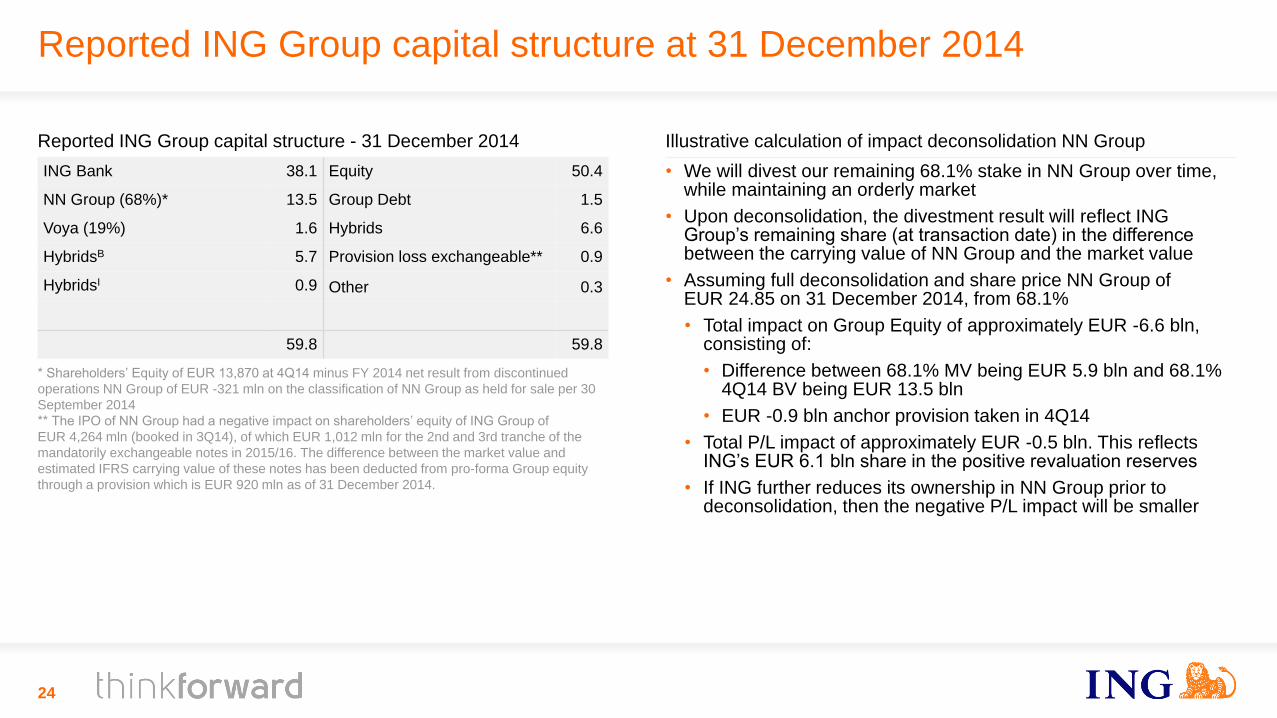
Illustrative calculation of impact deconsolidation NN Group
• We will divest our remaining 68.1% stake in NN Group over time, while maintaining an orderly market
• Upon deconsolidation, the divestment result will reflect ING Group’s remaining share (at transaction date) in the difference between the carrying value of NN Group and the market value
• Assuming full deconsolidation and share price NN Group of EUR 24.85 on 31 December 2014, from 68.1%
• Total impact on Group Equity of approximately EUR -6.6 bln, consisting of:
• Difference between 68.1% MV being EUR 5.9 bln and 68.1% 4Q14 BV being EUR 13.5 bln
• EUR -0.9 bln anchor provision taken in 4Q14
• Total P/L impact of approximately EUR -0.5 bln. This reflects ING’s EUR 6.1 bln share in the positive revaluation reserves
• If ING further reduces its ownership in NN Group prior to deconsolidation, then the negative P/L impact will be smaller
Reported ING Group capital structure - 31 December 2014
ING Bank 38.1 Equity 50.4
NN Group (68%)* 13.5 Group Debt 1.5
Voya (19%) 1.6 Hybrids 6.6
HybridsB 5.7 Provision loss exchangeable** 0.9
HybridsI 0.9 Other 0.3
59.8 59.8
* Shareholders’ Equity of EUR 13,870 at 4Q14 minus FY 2014 net result from discontinued
operations NN Group of EUR -321 mln on the classification of NN Group as held for sale per 30
September 2014
** The IPO of NN Group had a negative impact on shareholders’ equity of ING Group of
EUR 4,264 mln (booked in 3Q14), of which EUR 1,012 mln for the 2nd and 3rd tranche of the
mandatorily exchangeable notes in 2015/16. The difference between the market value and
estimated IFRS carrying value of these notes has been deducted from pro-forma Group equity
through a provision which is EUR 920 mln as of 31 December 2014.

Fully-loaded common equity Tier 1 capital (EUR and %)
Group CET1 will be in excess of Bank following Insurance divestments
• The carrying values of NN Group and Voya (FI deductions) are deducted from Group Shareholders’ equity
• The 4Q14 proposed dividend is already subtracted from Group capital
• Other deductions are almost similar to those applied in the Bank
• The full impact from divestment of Insurance stakes will set ING Group CET1 significantly ahead of ING Bank CET1
25
5.3-6.6
-4.3
-14.1
-0.5
14.139.0
50.4
33.731.5
ING Group
Shareholders'
Equity
FI deductions 4Q dividend Other
deductions
ING Group
CET1 fully
loaded
FI deductions ING Group
shareholders'
equity
ING Group
CET1 fully
loaded
Surplus/buffer ING Bank CET1
fully loaded
Pro-forma for full divestment Insurance stakes Actuals
* ING Group fully loaded CET1 ratio in 4Q14 is based on RWAs of EUR 301 bln; Pro-forma Group fully loaded is based on RWAs of EUR 298 bln
10.5%* 11.4% 13.1%*
Actual

ING Bank CRD IV common equity Tier 1 ratio fully-loaded 11.4%
Impact CRD IV 4Q2014 (in EUR bln)
Common equity Tier 1 capital RWAs Common equity Tier 1 ratio
31 December 2014 (Phased-in) 33.3 296.3 11.2%
Defined benefit pension fund assets -0.5
Intangibles -1.3
DTA -0.2
Loan loss provision shortfall -1.1
Other -0.4 0.1
Revaluation reserve debt securities +1.6
Revaluation reserve equity securities +2.0
Revaluation reserve real estate own use +0.3
Pro-forma common equity Tier 1 ratio (fully loaded) 33.7 296.4 11.4%
• ING Bank’s common equity Tier 1 ratio (CET1 ratio) on a fully-loaded basis rose to 11.4% from 11.1% at the end of September, mainly due to
retained earnings and higher revaluation reserves
• ING Bank’s CET1 ratio (phased-in) was stable at 11.2% in 4Q14. Increases in net profits and FX hedge were offset by EUR 1.4 bln higher RWA
26
ING Bank total Risk Weighted Assets (in EUR billion) Total capital (in EUR billion)*
26.031.8 33.7
8.1
5.1 5.75.710.7
8.5 8.3 9.59.5
33.138.1
6.9
2009 2011 2013 2014 2014
Common equity Tier 1 Shareholders' equity
Hybrid Tier 1 capital Tier 2 capital
13.5% 14.3% 16.5%
16.5% 53.3
252
34
330332
283 11
2009 2011 2013 2014
RWA Credit RWA
Operational RWA Market RWA
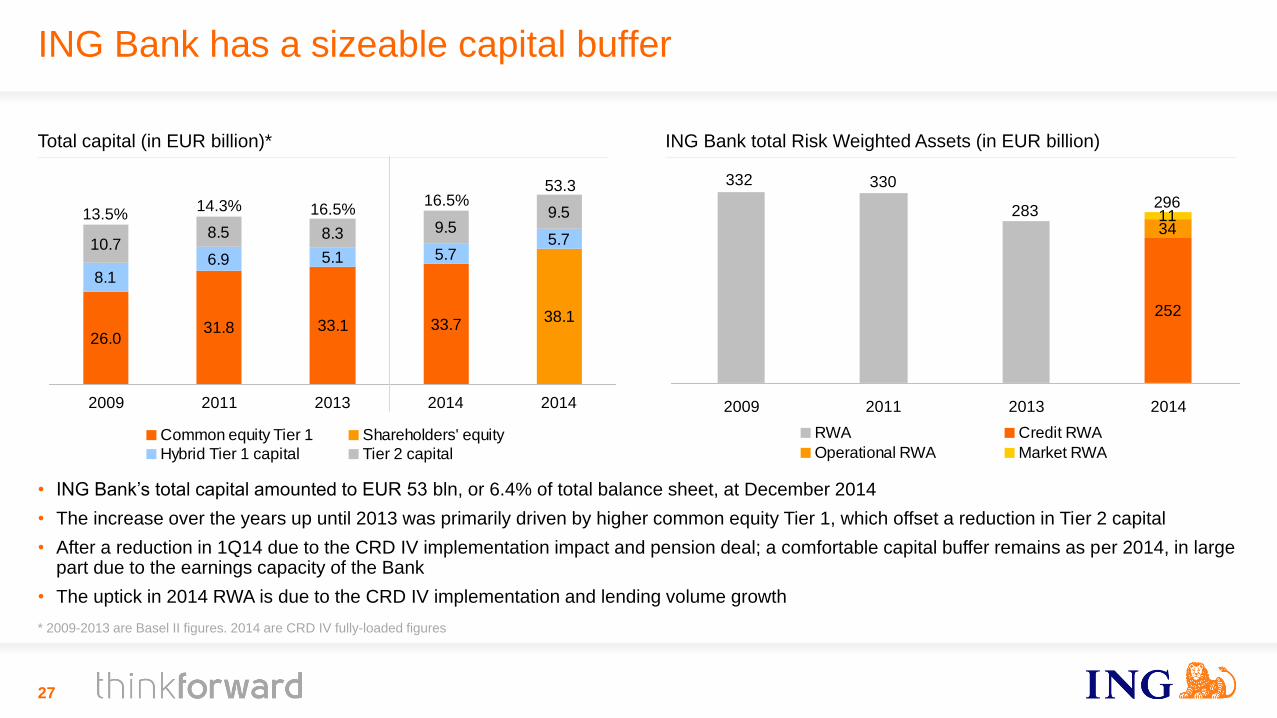
• ING Bank’s total capital amounted to EUR 53 bln, or 6.4% of total balance sheet, at December 2014
• The increase over the years up until 2013 was primarily driven by higher common equity Tier 1, which offset a reduction in Tier 2 capital
• After a reduction in 1Q14 due to the CRD IV implementation impact and pension deal; a comfortable capital buffer remains as per 2014, in large part due to the earnings capacity of the Bank
• The uptick in 2014 RWA is due to the CRD IV implementation and lending volume growth
296
27
* 2009-2013 are Basel II figures. 2014 are CRD IV fully-loaded figures
ING Bank has a sizeable capital buffer

We remain vigilant on expenses
28
• Underlying expenses in the fourth quarter were impacted by the redundancy provisions of EUR 375 mln and the Dutch bank tax of EUR 138 mln
• Excluding the provisions and bank tax, operating expenses declined by 2.6% from 4Q13 due to the benefits of ongoing cost-savings initiatives, the deconsolidation of Vysya and a large regulatory provision release in the Corporate Line, which more than offset higher pension costs in the Netherlands and investments in future growth
• The cost/income ratio, excl. CVA/DVA, redundancy provision and bank tax, was 53.7% in 4Q14, down from 4Q13 and up from 3Q14
149138
11
94
76375
2,0592,1102,0982,0802,115
24
4Q13 1Q14 2Q14 3Q14 4Q14
Expenses Dutch bank taxes Belgium bank taxes Restructuring costs
Underlying operating expenses (in EUR bln)
Cost/income ratio excl. CVA/DVA, redundancy provisions and bank tax (in %)
53.7%
52.6%
54.7%
53.6%
55.2%
4Q13 1Q14 2Q14 3Q14 4Q14

506.0507.3
0.5
2.31.4
0.8
1.0
-2.0
-1.3-0.8
-0.9-0.4-1.8
30/09/14 Retail NL Retail
Belgium
Retail
Germany
Retail RoW* CB SF* CB REF* CB GL&TS* CB Other* WUB run-off
/ transfers**
Lease and
other run-
off/sales***
FX 31/12/14
Lending Assets ING Bank, 4Q14 (Client Balances, in EUR bln)
Growth in core lending franchises was flat in the fourth quarter, partly due to pre-payments of Dutch mortgages and de-risking of Russian exposure
Core lending businesses: EUR 0.0 bln
29
• Retail NL down due to pre-payments of Dutch mortgages and reduction in Business Lending NL, reflecting repayments and muted demand
• Structured Finance showed increase in lending assets, despite reduction Russian exposure, with longer terms products increasing in particular
• General Lending down by EUR -0.7 bln, partly related to Russian clients
• Transaction Services down EUR -1.3 bln as increase in Working Capital Solutions (EUR 0.5 bln) was offset by decrease in short-term Trade Finance (EUR -1.8 bln), mainly in Asia
* RoW is Rest of the World; SF is Structured Finance; REF is Real Estate Finance; GL&TS is General Lending & Transaction Services; Other includes Financial Markets
** WUB run-off was EUR -0.6 bln in 4Q14 and transfers to NN was EUR -0.2 bln in 4Q14
*** Lease run-off was EUR -0.4 bln in 4Q14; Other run-off /sales was EUR -0.9 bln in 4Q14 and refers to Australian White Label mortgage portfolio that is in run-off and was partly sold in 4Q14
70%
6%
24%
USD
EUR
Local currency
19%
56%
8%
17%
Natural Resources
Commercial Banks
Transportation & Logistics
Other
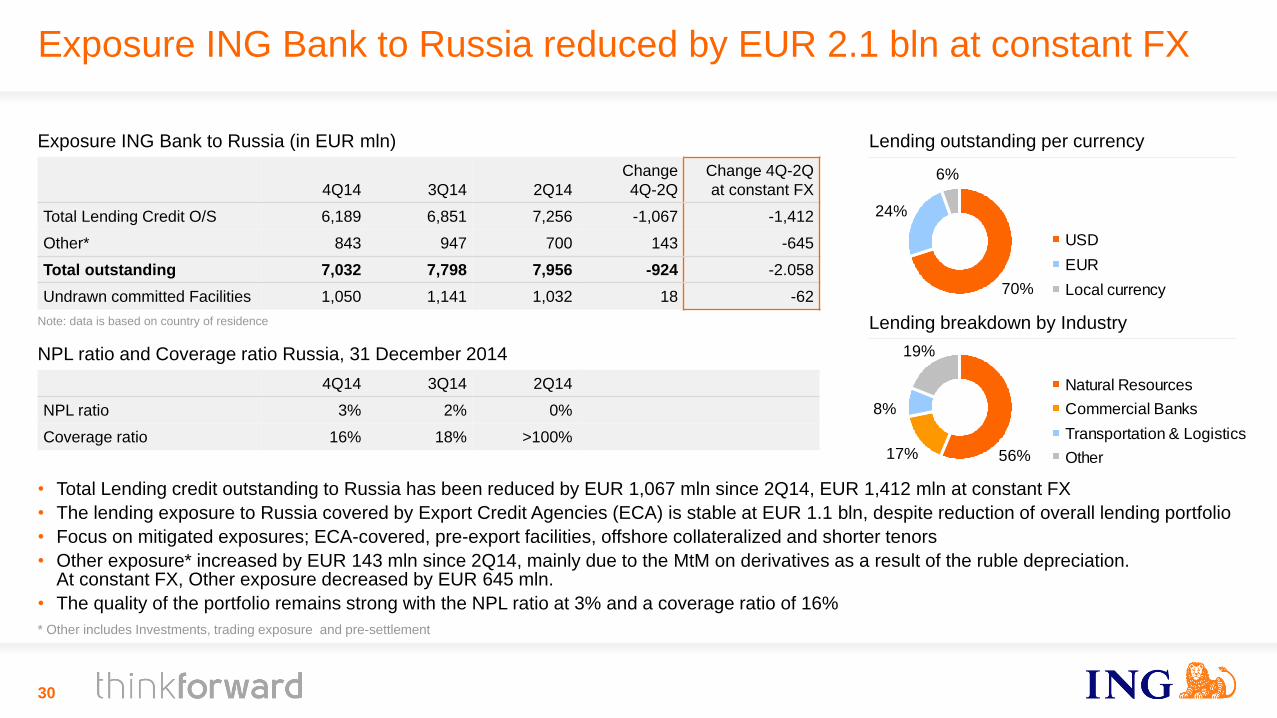
• Total Lending credit outstanding to Russia has been reduced by EUR 1,067 mln since 2Q14, EUR 1,412 mln at constant FX
• The lending exposure to Russia covered by Export Credit Agencies (ECA) is stable at EUR 1.1 bln, despite reduction of overall lending portfolio
• Focus on mitigated exposures; ECA-covered, pre-export facilities, offshore collateralized and shorter tenors
• Other exposure* increased by EUR 143 mln since 2Q14, mainly due to the MtM on derivatives as a result of the ruble depreciation. At constant FX, Other exposure decreased by EUR 645 mln.
• The quality of the portfolio remains strong with the NPL ratio at 3% and a coverage ratio of 16%
Exposure ING Bank to Russia reduced by EUR 2.1 bln at constant FX
Exposure ING Bank to Russia (in EUR mln)
4Q14 3Q14 2Q14
Change
4Q-2Q
Change 4Q-2Q
at constant FX
Total Lending Credit O/S 6,189 6,851 7,256 -1,067 -1,412
Other* 843 947 700 143 -645
Total outstanding 7,032 7,798 7,956 -924 -2.058
Undrawn committed Facilities 1,050 1,141 1,032 18 -62
Note: data is based on country of residence
NPL ratio and Coverage ratio Russia, 31 December 2014
4Q14 3Q14 2Q14
NPL ratio 3% 2% 0%
Coverage ratio 16% 18% >100%
30
Lending outstanding per currency
Lending breakdown by Industry
* Other includes Investments, trading exposure and pre-settlement
23%
9%
37%
17% 16%
Natural Resources
Food, Beverages & Personal
General industries
Utilities
Other
Exposure ING Bank to the Ukraine
31
* Other includes Investment, trading exposure and pre-settlement
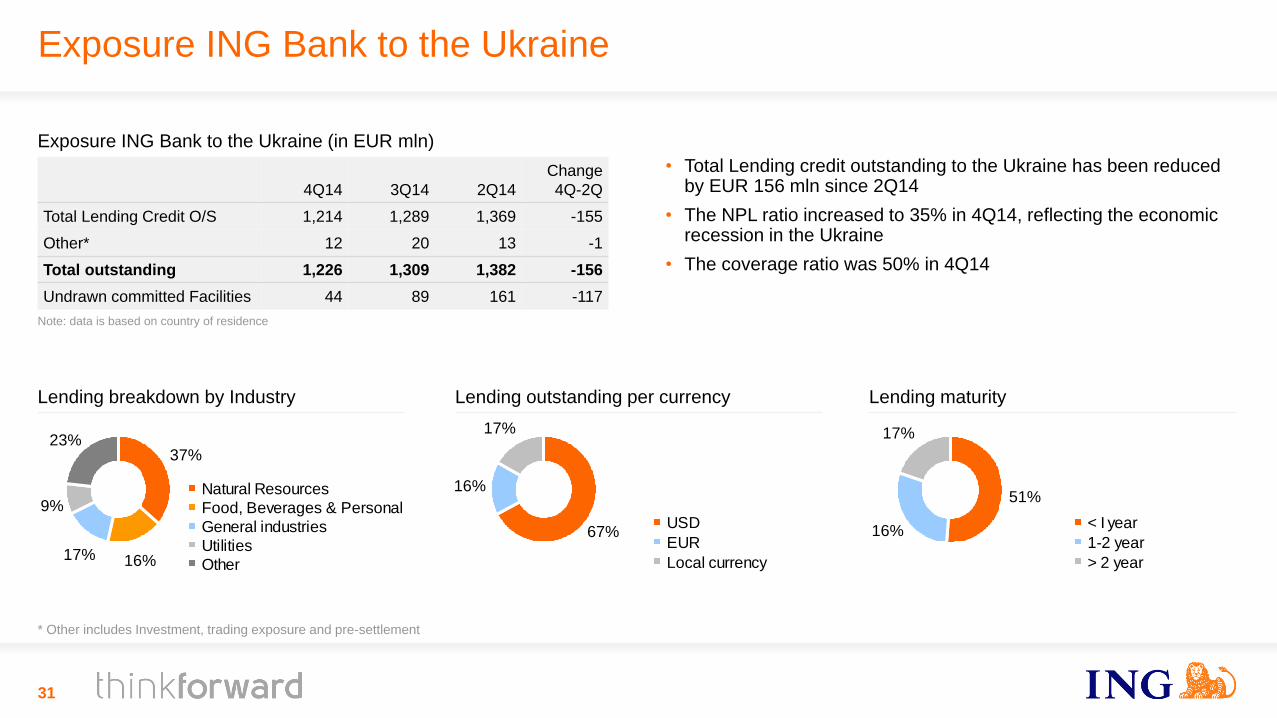
Exposure ING Bank to the Ukraine (in EUR mln)
4Q14 3Q14 2Q14
Change
4Q-2Q
Total Lending Credit O/S 1,214 1,289 1,369 -155
Other* 12 20 13 -1
Total outstanding 1,226 1,309 1,382 -156
Undrawn committed Facilities 44 89 161 -117
Note: data is based on country of residence
• Total Lending credit outstanding to the Ukraine has been reduced by EUR 156 mln since 2Q14
• The NPL ratio increased to 35% in 4Q14, reflecting the economic recession in the Ukraine
• The coverage ratio was 50% in 4Q14
Lending breakdown by Industry Lending outstanding per currency Lending maturity
67%
17%
16%
USD
EUR
Local currency
51%
17%
16%< I year
1-2 year
> 2 year
Exposure ING Bank to Oil & Gas Industry - oil price risk is limited
32
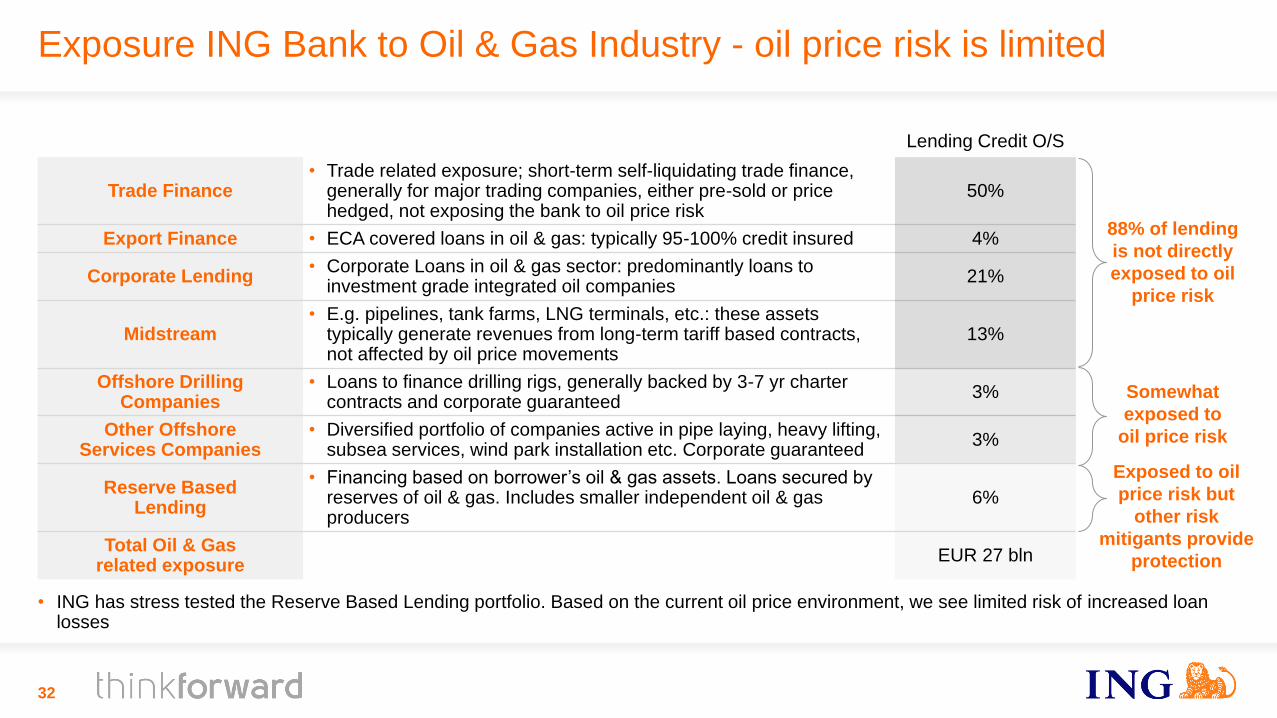
Lending Credit O/S
Trade Finance • Trade related exposure; short-term self-liquidating trade finance,
generally for major trading companies, either pre-sold or price hedged, not exposing the bank to oil price risk
50%
Export Finance • ECA covered loans in oil & gas: typically 95-100% credit insured 4%
Corporate Lending • Corporate Loans in oil & gas sector: predominantly loans to
investment grade integrated oil companies 21%
Midstream • E.g. pipelines, tank farms, LNG terminals, etc.: these assets
typically generate revenues from long-term tariff based contracts, not affected by oil price movements
13%
Offshore Drilling Companies
• Loans to finance drilling rigs, generally backed by 3-7 yr charter contracts and corporate guaranteed
3%
Other Offshore Services Companies
• Diversified portfolio of companies active in pipe laying, heavy lifting, subsea services, wind park installation etc. Corporate guaranteed
3%
Reserve Based Lending
• Financing based on borrower’s oil & gas assets. Loans secured by reserves of oil & gas. Includes smaller independent oil & gas producers
6%
Total Oil & Gas related exposure
EUR 27 bln
88% of lending
is not directly
exposed to oil
price risk
• ING has stress tested the Reserve Based Lending portfolio. Based on the current oil price environment, we see limited risk of increased loan losses
Exposed to oil
price risk but
other risk
mitigants provide
protection
Somewhat
exposed to
oil price risk
ING Group’s Annual Accounts are prepared in accordance with International Financial Reporting Standards as adopted by the European Union (‘IFRS-EU’).
In preparing the financial information in this document, the same accounting principles are applied as in the 3Q2014 ING Group Interim Accounts. The Financial statements for 2014 are in progress and may be subject to adjustments from subsequent events. All figures in this document are unaudited. Small differences are possible in the tables due to rounding.
Certain of the statements contained herein are not historical facts, including, without limitation, certain statements made of future expectations and other forward-looking statements that are based on management’s current views and assumptions and involve known and unknown risks and uncertainties that could cause actual results, performance or events to differ materially from those expressed or implied in such statements. Actual results, performance or events may differ materially from those in such statements due to, without limitation: (1) changes in general economic conditions, in particular economic conditions in ING’s core markets, (2) changes in performance of financial markets, including developing markets, (3) consequences of a potential (partial) break-up of the euro, (4) the implementation of ING’s restructuring plan to separate banking and insurance operations, (5) changes in the availability of, and costs associated with, sources of liquidity such as interbank funding, as well as conditions in the credit markets generally, including changes in borrower and counterparty creditworthiness, (6) the frequency and severity of insured loss events, (7) changes affecting mortality and morbidity levels and trends, (8) changes affecting persistency levels, (9) changes affecting interest rate levels, (10) changes affecting currency exchange rates, (11) changes in investor, customer and policyholder behaviour, (12) changes in general competitive factors, (13) changes in laws and regulations, (14) changes in the policies of governments and/or regulatory authorities, (15) conclusions with regard to purchase accounting assumptions and methodologies, (16) changes in ownership that could affect the future availability to us of net operating loss, net capital and built-in loss carry forwards, (17) changes in credit ratings, (18) ING’s ability to achieve projected operational synergies and (19) the other risks and uncertainties detailed in the Risk Factors section contained in the most recent annual report of ING Groep N.V. Any forward-looking statements made by or on behalf of ING speak only as of the date they are made, and, ING assumes no obligation to publicly update or revise any forward-looking statements, whether as a result of new information or for any other reason.
This document does not constitute an offer to sell, or a solicitation of an offer to purchase, any securities in the United States or any other jurisdiction. The securities of NN Group have not been and will not be registered under the U.S. Securities Act of 1933, as amended (the “Securities Act”), and may not be offered or sold within the United States absent registration or an applicable exemption from the registration requirements of the Securities Act.
www.ing.com
Important legal information
33