Embed Size (px)
Citation preview
Project on
Fundamental and Technical analysis of Top 4 FMCG Companies
SYMBIOSIS INSTITUTE OF BUSINESS MANAGEMENT-Hyderabad
Submitted to
Dr. Rishi Shukla
Shreya Banerjee Shahid Hassan
Abstract:
This analysis was done to study the trend in the shares of the Top FMCG companies. The parameters used to study the trends are Fundamental Analysis and Technical Analysis. Fundamental analysis contains Ratio’s which are used to study Growth% ,Gross Profit Margin, Return on equity, earning per share, price to book ratio, price to sales etc of the companies. In Technical Analysis we studied the opening price and closing price of the shares, and the trends of these companies, where it can help us to understand in which company we need to invest. At last we have seen that ITC has the most upward trend in its share price and if any investor wants to invest in this company he will get the long term benefit.
1. Introduction
Fast Moving consumer goods(FMCG) is a sector in which the products can be sold quickly and at relatively low cost which includes not durable goods like soft drinks, toys, drugs and many other consumables. The FMCG term was given by MR. Neil H.Borden in the concept of marketing mix in the year 1965. FMCG has a shorter shelf life which leads to high consumer demand because the product deteriorates rapidly. The profit margin made by FMCG products is relatively small so they are generally sold in large quantities to the producers or suppliers. The cumulative profits on these products can be substantial.So the FMCG sector is probably the most unique case of low margin and high volume business.The Top FMCG companies are HUL,ITC,GODREJ etc..
Hindustan Unilever Limited is a public limited company which was founded in 1932. The key people of HUL are Harish Manwani(Chairman) and Sanjiv Mehta(CEO & MD). The products sold by the company are foods,beverages, cleaning agents and personal care products. The headquarter is located at Mumbai, Maharashtra, India.The Parent company of HUL is Unilever Plc(67%).The Revenue generated by the company in the year 2011-12 is Rs 221billion and it is listed in BSE Sensex.
ITC Limited is an Indian Conglomerate company which was founded in 1910.The key people is Y.C.Deveshwar(chairman). The products sold by the company are Tobacco hotels, paperboards & speciality papers, packaging,agri-business, packaged foods & confectionery.The headquarter located in Kolkata, West Bengal.The revenue generated by the company in the 2013-14 is Rs13,051.89crores.It is listed in BSE Sensex and NSE .
Godrej is known as Godrej Consumer Products Limited. It is an Indian consumer goods company. It was founded in the year 2001. The key people are Adi Godrej, Chairman,Vivek Gambhir, Managing Director .The products sold by the company are Toilet soaps, hair colour, household insecticides, liquiddetergents, toiletries, Air Fresheners etc..The headquarters is located at Mumbai, Maharashtra ,India. The revenue generated by the company in the year 2010-11 was Rs 37.93 billion.It is listed in NSE Sensex and BSE Sensex both.
Colgate Palmolive Company is an American multinational consumer products company. It was founded in the year 1806.The key people is Ian M.Cook,CEO.The products sold by the company are soaps, detergents and oral hygiene products(including toothpaste and toothbrush).The headquater is located in park avenue in New York city, New York, United States.The revenue generated by the company in the year 2013is US $ 17.42 billion . It is a listed in NYSE.
2. Research Design & Methodology
This research has been carried purely on the basis of secondary data. The subject matter of this study is to pertain to the financial and technical analysis of the 3 FMCG companies over the years(2014- 2010).To study the Growth and Investment perspective, to understand and to conclude with conviction, the present secondary data is been taken from Live Mint and Money Control .
3. Fundamental Analysis
Fundamental analysis is the cornerstone fora company in which investment is to be done by an investor.This Fundamental Analysis helps an individual to understand whatis the present situation of the company to those who cannot understand the balance sheet and profit and loss statements. The biggest part of fundamental analysis involves in studying the financial statements also known as quantitative analysis, which involves looking at revenues ,expenses ,assets, liabilities and all other financial aspects of the company. For knowing the company’s future performance, Fundamental analysts look at this information and gives his/her opinion.
4. Fundamental Ratio’s:-
The Ratios are very much necessary in order to analysis the investment scenarios. Fundamental Ratio is comparing the number against previous years, with others companies, the industry or even the economy in general.
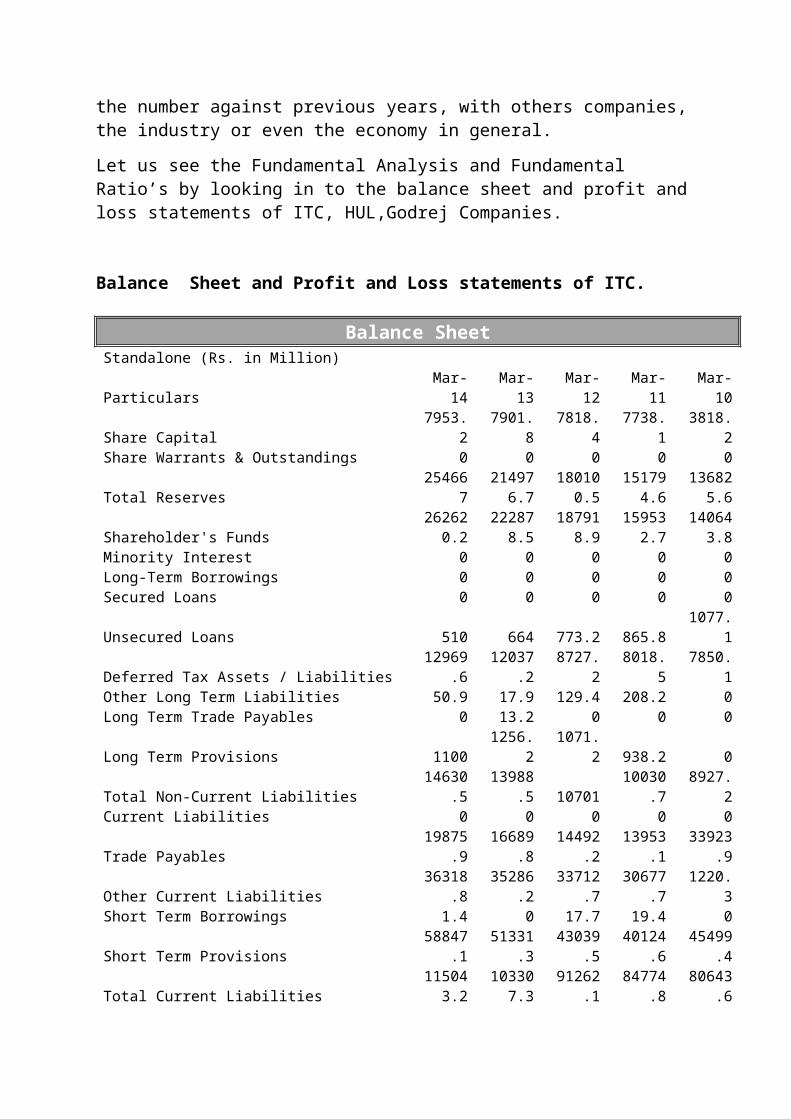
Let us see the Fundamental Analysis and Fundamental Ratio’s by looking in to the balance sheet and profit and loss statements of ITC, HUL,Godrej Companies.
Balance Sheet and Profit and Loss statements of ITC.
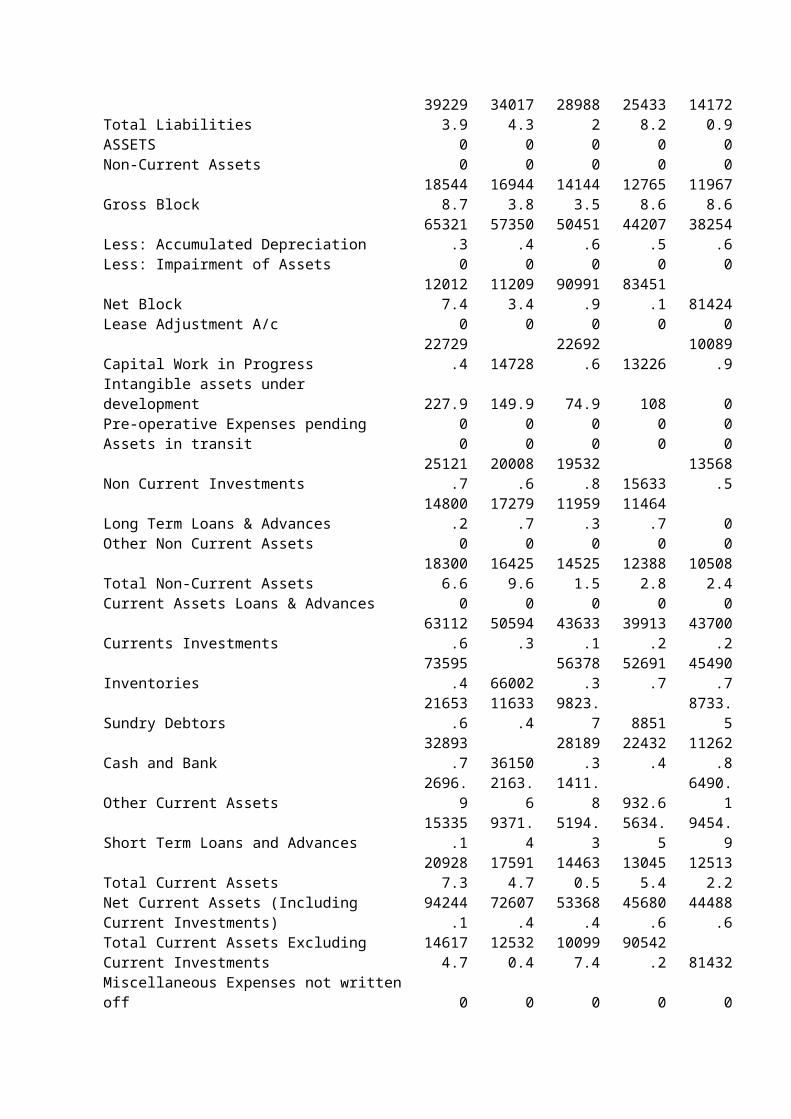
Balance SheetStandalone (Rs. in Million)Particulars Mar-14 Mar-13 Mar-12 Mar-11 Mar-10Share Capital 7953.2 7901.8 7818.4 7738.1 3818.2Share Warrants & Outstandings 0 0 0 0 0
Total Reserves 254667214976.
7180100.
5151794.
6136825.
6
Shareholder's Funds262620.
2222878.
5187918.
9159532.
7140643.
8Minority Interest 0 0 0 0 0Long-Term Borrowings 0 0 0 0 0Secured Loans 0 0 0 0 0Unsecured Loans 510 664 773.2 865.8 1077.1Deferred Tax Assets / Liabilities 12969.6 12037.2 8727.2 8018.5 7850.1Other Long Term Liabilities 50.9 17.9 129.4 208.2 0Long Term Trade Payables 0 13.2 0 0 0Long Term Provisions 1100 1256.2 1071.2 938.2 0Total Non-Current Liabilities 14630.5 13988.5 10701 10030.7 8927.2Current Liabilities 0 0 0 0 0Trade Payables 19875.9 16689.8 14492.2 13953.1 33923.9Other Current Liabilities 36318.8 35286.2 33712.7 30677.7 1220.3Short Term Borrowings 1.4 0 17.7 19.4 0Short Term Provisions 58847.1 51331.3 43039.5 40124.6 45499.4
Total Current Liabilities115043.
2103307.
3 91262.1 84774.8 80643.6
Total Liabilities392293.
9340174.
3 289882254338.
2141720.
9ASSETS 0 0 0 0 0Non-Current Assets 0 0 0 0 0
Gross Block185448.
7169443.
8141443.
5127658.
6119678.
6Less: Accumulated Depreciation 65321.3 57350.4 50451.6 44207.5 38254.6Less: Impairment of Assets 0 0 0 0 0
Net Block120127.
4112093.
4 90991.9 83451.1 81424Lease Adjustment A/c 0 0 0 0 0Capital Work in Progress 22729.4 14728 22692.6 13226 10089.9Intangible assets under development 227.9 149.9 74.9 108 0Pre-operative Expenses pending 0 0 0 0 0Assets in transit 0 0 0 0 0Non Current Investments 25121.7 20008.6 19532.8 15633 13568.5Long Term Loans & Advances 14800.2 17279.7 11959.3 11464.7 0Other Non Current Assets 0 0 0 0 0
Total Non-Current Assets183006.
6164259.
6145251.
5123882.
8105082.
4
Current Assets Loans & Advances 0 0 0 0 0Currents Investments 63112.6 50594.3 43633.1 39913.2 43700.2Inventories 73595.4 66002 56378.3 52691.7 45490.7Sundry Debtors 21653.6 11633.4 9823.7 8851 8733.5Cash and Bank 32893.7 36150 28189.3 22432.4 11262.8Other Current Assets 2696.9 2163.6 1411.8 932.6 6490.1Short Term Loans and Advances 15335.1 9371.4 5194.3 5634.5 9454.9
Total Current Assets209287.
3175914.
7144630.
5130455.
4125132.
2Net Current Assets (Including Current Investments) 94244.1 72607.4 53368.4 45680.6 44488.6Total Current Assets Excluding Current Investments
146174.7
125320.4
100997.4 90542.2 81432
Miscellaneous Expenses not written off 0 0 0 0 0
Total Assets392293.
9340174.
3 289882254338.
2141720.
9Contingent Liabilities 3615 4665.4 2870.8 2551.7 2851.3Total Debt 665.4 776.7 891.2 992 1077.1Book Value 32.95 28.14 23.97 20.55 36.69Adjusted Book Value 32.95 28.14 23.97 20.55 18.35
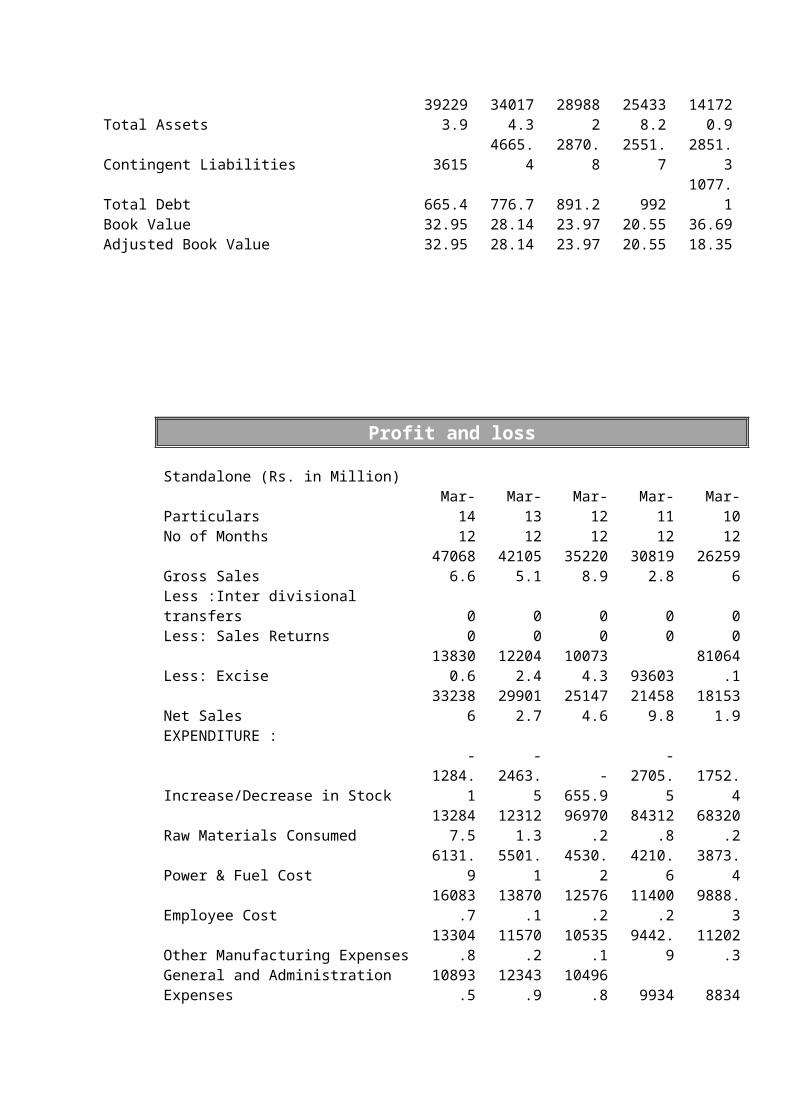
Profit and loss
Standalone (Rs. in Million)Particulars Mar-14 Mar-13 Mar-12 Mar-11 Mar-10No of Months 12 12 12 12 12
Gross Sales470686.
6421055.
1352208.
9308192.
8 262596Less :Inter divisional transfers 0 0 0 0 0Less: Sales Returns 0 0 0 0 0
Less: Excise138300.
6122042.
4100734.
3 93603 81064.1
Net Sales 332386299012.
7251474.
6214589.
8181531.
9EXPENDITURE :Increase/Decrease in Stock -1284.1 -2463.5 -655.9 -2705.5 1752.4
Raw Materials Consumed132847.
5123121.
3 96970.2 84312.8 68320.2Power & Fuel Cost 6131.9 5501.1 4530.2 4210.6 3873.4Employee Cost 16083.7 13870.1 12576.2 11400.2 9888.3Other Manufacturing Expenses 13304.8 11570.2 10535.1 9442.9 11202.3
General and Administration Expenses 10893.5 12343.9 10496.8 9934 8834Selling and Distribution Expenses 19823.1 20883.2 19546.2 17012.7 11286.6Miscellaneous Expenses 9830.4 8000.9 8789.2 6659 5461.6Expenses Capitalised 0 0 0 0 0
Total Expenditure207630.
8192827.
2 162788140266.
7120618.
8
PBIDT (Excl OI)124755.
2106185.
5 88686.6 74323.1 60913.1Other Income 11071.4 9671 8253.4 5798.2 6229.9
Operating Profit135826.
6115856.
5 96940 80121.3 67143Interest 236.3 1059.1 979.6 879.8 902.8
PBDT135590.
3114797.
4 95960.4 79241.5 66240.2Depreciation 8999.2 7955.6 6985.1 6559.9 6087.1Profit Before Taxation & Exceptional Items
126591.1
106841.8 88975.3 72681.6 60153.1
Exceptional Income / Expenses 0 0 0 0 0
Profit Before Tax126591.
1106841.
8 88975.3 72681.6 60153.1Provision for Tax 38739 32657.9 27351.6 22805.5 19543.1PAT 87852.1 74183.9 61623.7 49876.1 40610Adj to Profit After Tax 0 0 0 0 0Profit Balance B/F 37881 19725.9 5486.7 613.1 8581.4
Appropriations125733.
1 93909.8 67110.4 50489.2 49191.4Equity Dividend (%) 600 525 450 445 1000Earnings Per Share (Rs.) 11.05 9.39 7.88 6.45 10.64Book Value (Rs.) 32.95 28.14 23.97 20.55 36.69
Cost Of Goods Sold155063.
1142492.
5114076.
6 99923.6 82081.9Current Market Price 352.95 309.1 226.85 181.45 263.15
Market Capitalization280609
9244198
5177402
7140310
4100437
2EBIT 115756 98229.9 81701.5 67763.2 54826
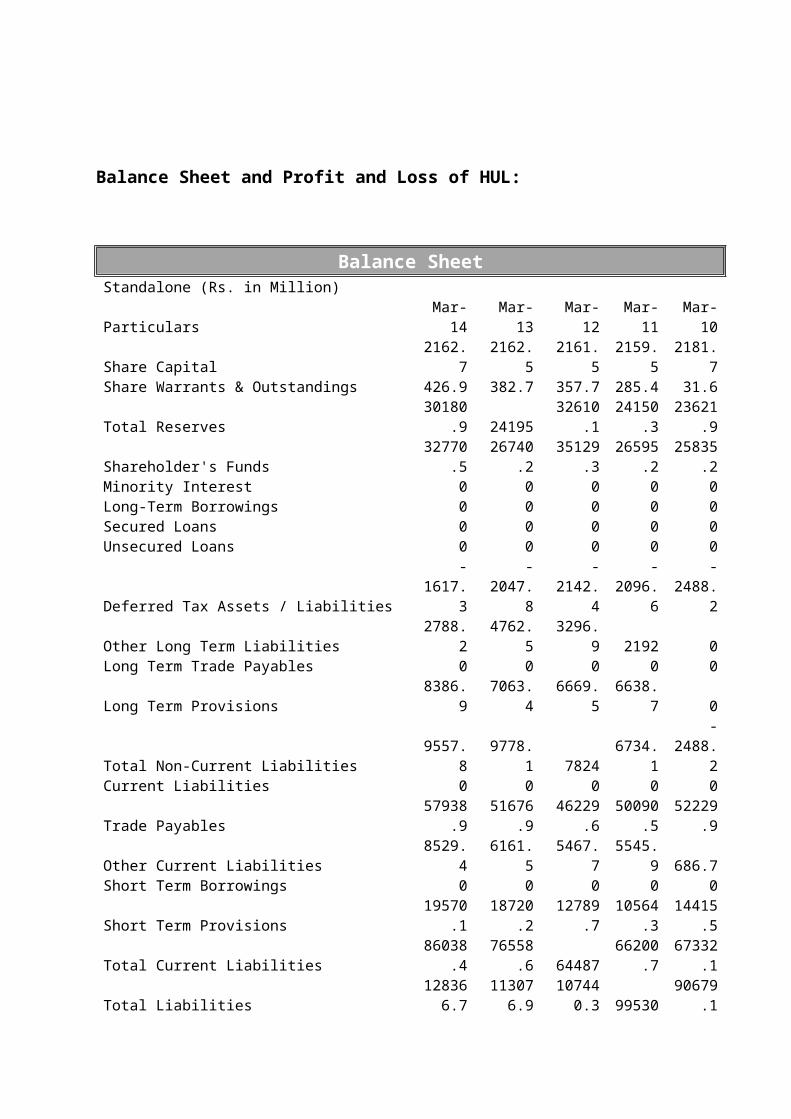
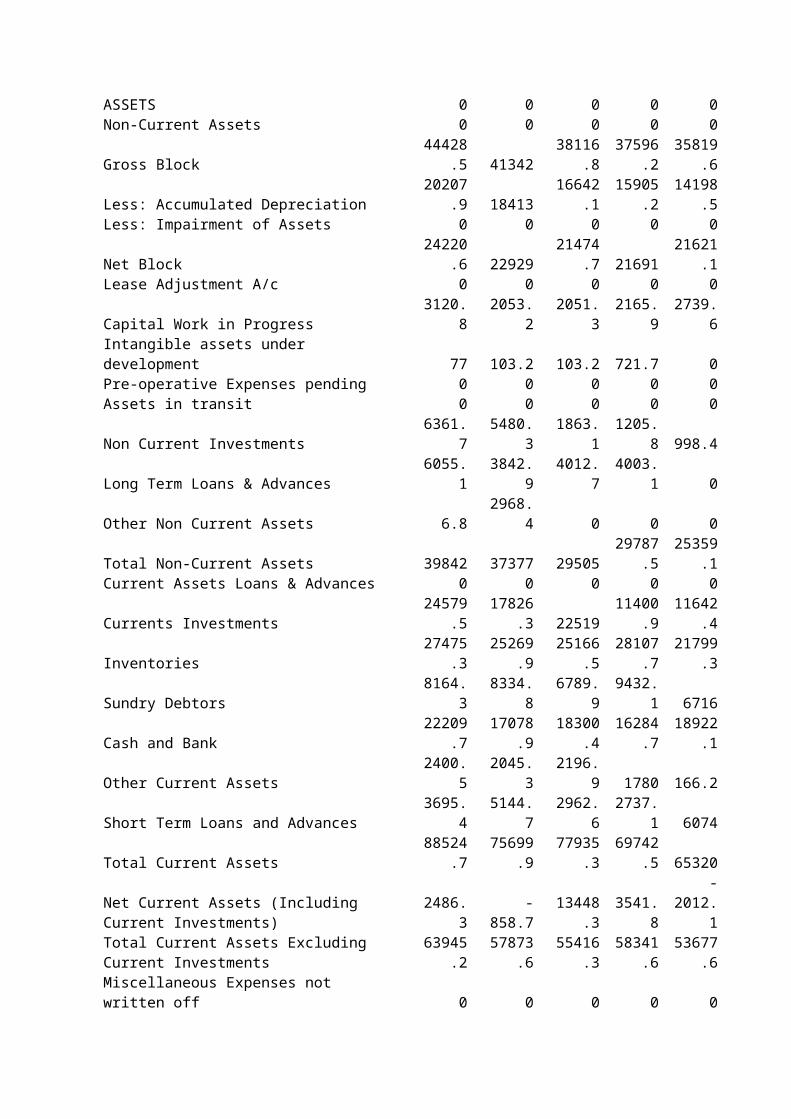
Balance Sheet and Profit and Loss of HUL:
Balance SheetStandalone (Rs. in Million)Particulars Mar-14 Mar-13 Mar-12 Mar-11 Mar-10Share Capital 2162.7 2162.5 2161.5 2159.5 2181.7Share Warrants & Outstandings 426.9 382.7 357.7 285.4 31.6
Total Reserves 30180.9 24195 32610.124150.
323621.
9
Shareholder's Funds 32770.5 26740.2 35129.326595.
225835.
2Minority Interest 0 0 0 0 0Long-Term Borrowings 0 0 0 0 0Secured Loans 0 0 0 0 0Unsecured Loans 0 0 0 0 0
Deferred Tax Assets / Liabilities -1617.3 -2047.8 -2142.4-
2096.6-
2488.2Other Long Term Liabilities 2788.2 4762.5 3296.9 2192 0Long Term Trade Payables 0 0 0 0 0Long Term Provisions 8386.9 7063.4 6669.5 6638.7 0
Total Non-Current Liabilities 9557.8 9778.1 7824 6734.1-
2488.2Current Liabilities 0 0 0 0 0
Trade Payables 57938.9 51676.9 46229.650090.
552229.
9Other Current Liabilities 8529.4 6161.5 5467.7 5545.9 686.7Short Term Borrowings 0 0 0 0 0
Short Term Provisions 19570.1 18720.2 12789.710564.
314415.
5
Total Current Liabilities 86038.4 76558.6 6448766200.
767332.
1
Total Liabilities128366.
7113076.
9107440.
3 9953090679.
1ASSETS 0 0 0 0 0Non-Current Assets 0 0 0 0 0
Gross Block 44428.5 41342 38116.837596.
235819.
6
Less: Accumulated Depreciation 20207.9 18413 16642.115905.
214198.
5Less: Impairment of Assets 0 0 0 0 0
Net Block 24220.6 22929 21474.7 2169121621.
1Lease Adjustment A/c 0 0 0 0 0Capital Work in Progress 3120.8 2053.2 2051.3 2165.9 2739.6Intangible assets under development 77 103.2 103.2 721.7 0Pre-operative Expenses pending 0 0 0 0 0Assets in transit 0 0 0 0 0Non Current Investments 6361.7 5480.3 1863.1 1205.8 998.4Long Term Loans & Advances 6055.1 3842.9 4012.7 4003.1 0Other Non Current Assets 6.8 2968.4 0 0 0
Total Non-Current Assets 39842 37377 2950529787.
525359.
1Current Assets Loans & Advances 0 0 0 0 0
Currents Investments 24579.5 17826.3 2251911400.
911642.
4Inventories 27475.3 25269.9 25166.5 28107. 21799.
7 3Sundry Debtors 8164.3 8334.8 6789.9 9432.1 6716
Cash and Bank 22209.7 17078.9 18300.416284.
718922.
1Other Current Assets 2400.5 2045.3 2196.9 1780 166.2Short Term Loans and Advances 3695.4 5144.7 2962.6 2737.1 6074
Total Current Assets 88524.7 75699.9 77935.369742.
5 65320Net Current Assets (Including Current Investments) 2486.3 -858.7 13448.3 3541.8
-2012.1
Total Current Assets Excluding Current Investments 63945.2 57873.6 55416.3
58341.6
53677.6
Miscellaneous Expenses not written off 0 0 0 0 0
Total Assets128366.
7113076.
9107440.
3 9953090679.
1Contingent Liabilities 8961.3 7688.7 7436.7 7489.6 4684.9Total Debt 0 0 0 0 0Book Value 14.95 12.19 16.08 12.18 11.82Adjusted Book Value 14.95 12.19 16.08 12.18 11.82
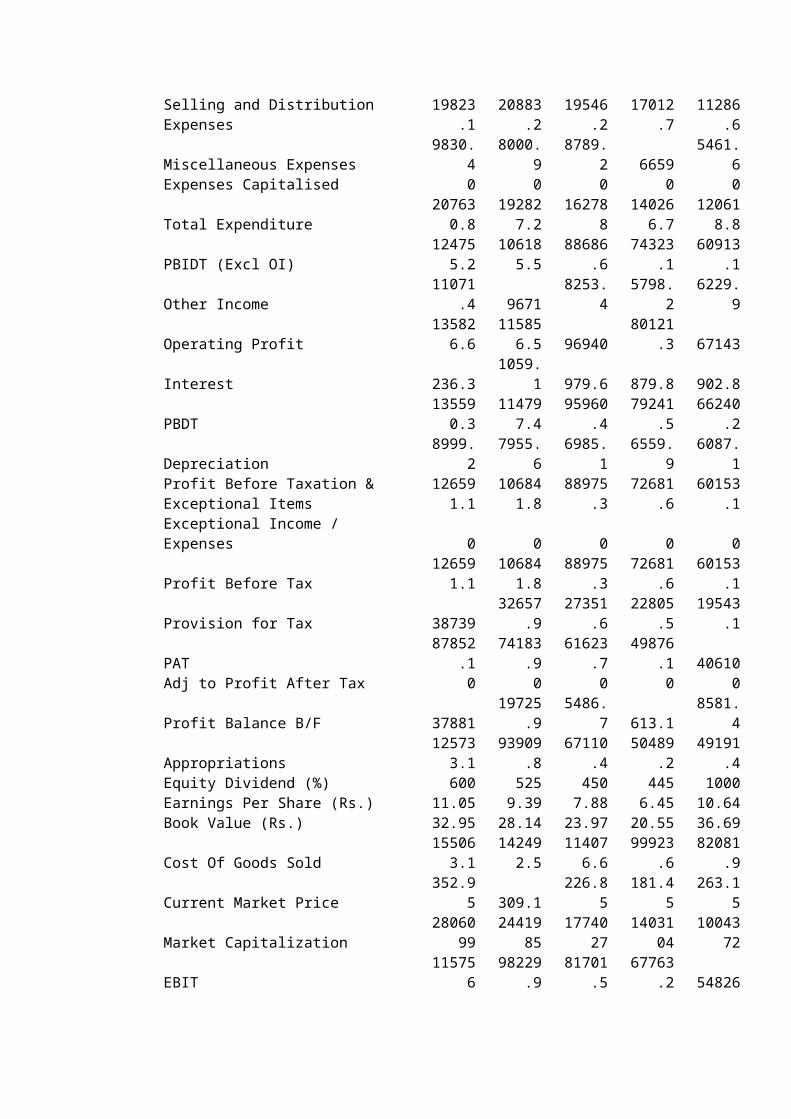
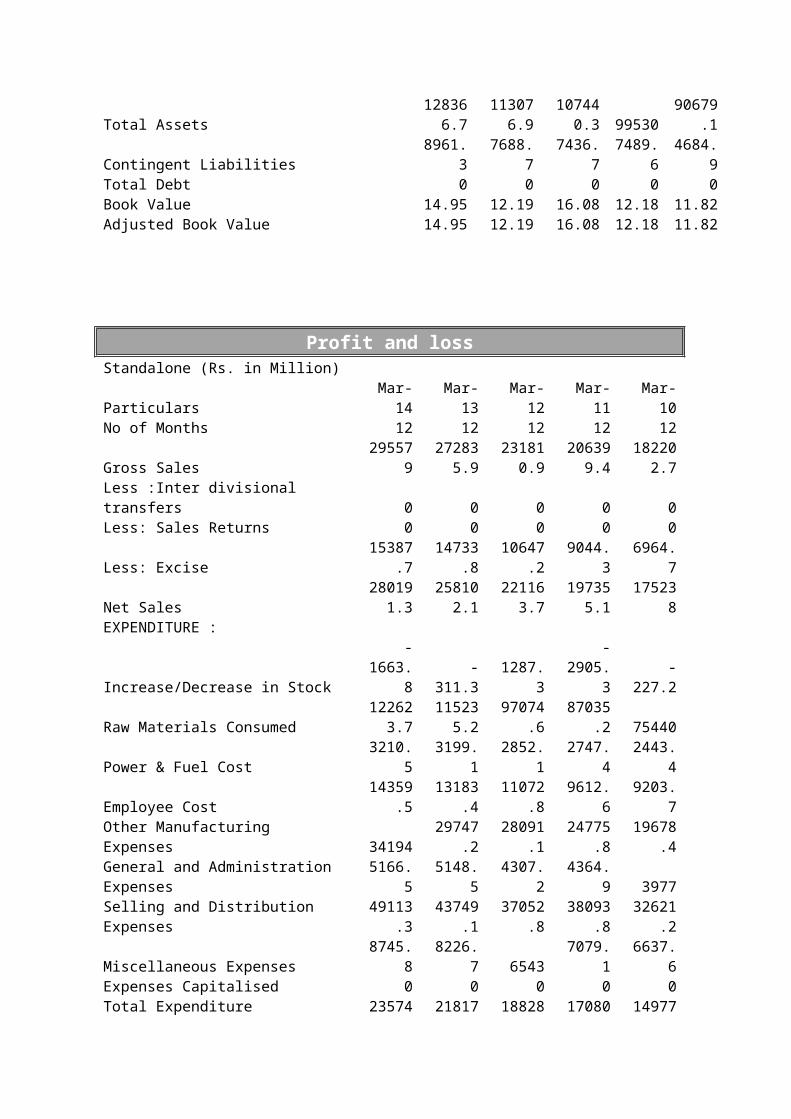
Profit and lossStandalone (Rs. in Million)Particulars Mar-14 Mar-13 Mar-12 Mar-11 Mar-10No of Months 12 12 12 12 12
Gross Sales 295579272835.
9231810.
9206399.
4182202.
7Less :Inter divisional transfers 0 0 0 0 0Less: Sales Returns 0 0 0 0 0Less: Excise 15387.7 14733.8 10647.2 9044.3 6964.7
Net Sales280191.
3258102.
1221163.
7197355.
1 175238EXPENDITURE :Increase/Decrease in Stock -1663.8 -311.3 1287.3 -2905.3 -227.2
Raw Materials Consumed122623.
7115235.
2 97074.6 87035.2 75440Power & Fuel Cost 3210.5 3199.1 2852.1 2747.4 2443.4Employee Cost 14359.5 13183.4 11072.8 9612.6 9203.7Other Manufacturing Expenses 34194 29747.2 28091.1 24775.8 19678.4General and Administration Expenses 5166.5 5148.5 4307.2 4364.9 3977Selling and Distribution Expenses 49113.3 43749.1 37052.8 38093.8 32621.2Miscellaneous Expenses 8745.8 8226.7 6543 7079.1 6637.6Expenses Capitalised 0 0 0 0 0
Total Expenditure235749.
5218177.
9188280.
9170803.
5149774.
1
PBIDT (Excl OI) 44441.8 39924.2 32882.8 26551.6 25463.9Other Income 6510.7 6174.3 2813.7 2961.1 3516.9Operating Profit 50952.5 46098.5 35696.5 29512.7 28980.8Interest 360.3 251.5 12.4 2.4 69.8PBDT 50592.2 45847 35684.1 29510.3 28911Depreciation 2595.1 2352.2 2182.5 2208.3 1840.3Profit Before Taxation & Exceptional Items 47997.1 43494.8 33501.6 27302 27070.7Exceptional Income / Expenses 2286.8 6084 1188.7 2068.3 0Profit Before Tax 50283.9 49578.8 34690.3 29370.3 27070.7Provision for Tax 11609 11612.1 7776.3 6310.6 6043.9PAT 38674.9 37966.7 26914 23059.7 21026.8Adj to Profit After Tax 0 0 0 0 0Profit Balance B/F 5352.8 17739.6 12356 8021.9 4763.3Appropriations 44027.7 55706.3 39270 31081.6 26783.6Equity Dividend (%) 1300 1850 750 650 650Earnings Per Share (Rs.) 17.88 17.56 12.45 10.68 9.64Book Value (Rs.) 14.95 12.19 16.08 12.18 11.82
Cost Of Goods Sold140193.
7131617.
7110999.
5 99395.2 87087.1Current Market Price 603.65 466.1 409.9 284.6 238.7
Market Capitalization130571
0100776
1886108.
3614493.
5520653.
2EBIT 41846.7 37572 30700.3 24343.3 23623.6
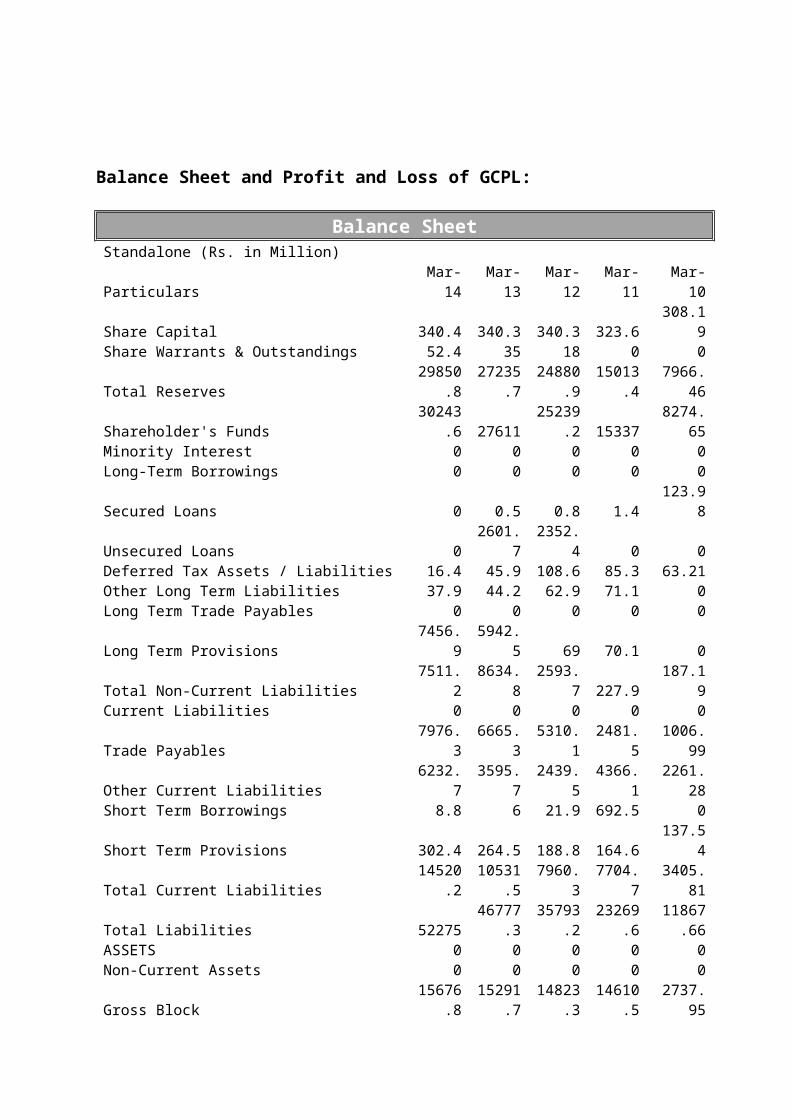
Balance Sheet and Profit and Loss of GCPL:
Balance SheetStandalone (Rs. in Million)Particulars Mar-14 Mar-13 Mar-12 Mar-11 Mar-10Share Capital 340.4 340.3 340.3 323.6 308.19Share Warrants & Outstandings 52.4 35 18 0 0
Total Reserves29850.
827235.
724880.
915013.
4 7966.46
Shareholder's Funds30243.
6 2761125239.
2 15337 8274.65Minority Interest 0 0 0 0 0
Long-Term Borrowings 0 0 0 0 0Secured Loans 0 0.5 0.8 1.4 123.98Unsecured Loans 0 2601.7 2352.4 0 0Deferred Tax Assets / Liabilities 16.4 45.9 108.6 85.3 63.21Other Long Term Liabilities 37.9 44.2 62.9 71.1 0Long Term Trade Payables 0 0 0 0 0Long Term Provisions 7456.9 5942.5 69 70.1 0Total Non-Current Liabilities 7511.2 8634.8 2593.7 227.9 187.19Current Liabilities 0 0 0 0 0Trade Payables 7976.3 6665.3 5310.1 2481.5 1006.99Other Current Liabilities 6232.7 3595.7 2439.5 4366.1 2261.28Short Term Borrowings 8.8 6 21.9 692.5 0Short Term Provisions 302.4 264.5 188.8 164.6 137.54
Total Current Liabilities14520.
210531.
5 7960.3 7704.7 3405.81
Total Liabilities 5227546777.
335793.
223269.
611867.6
6ASSETS 0 0 0 0 0Non-Current Assets 0 0 0 0 0
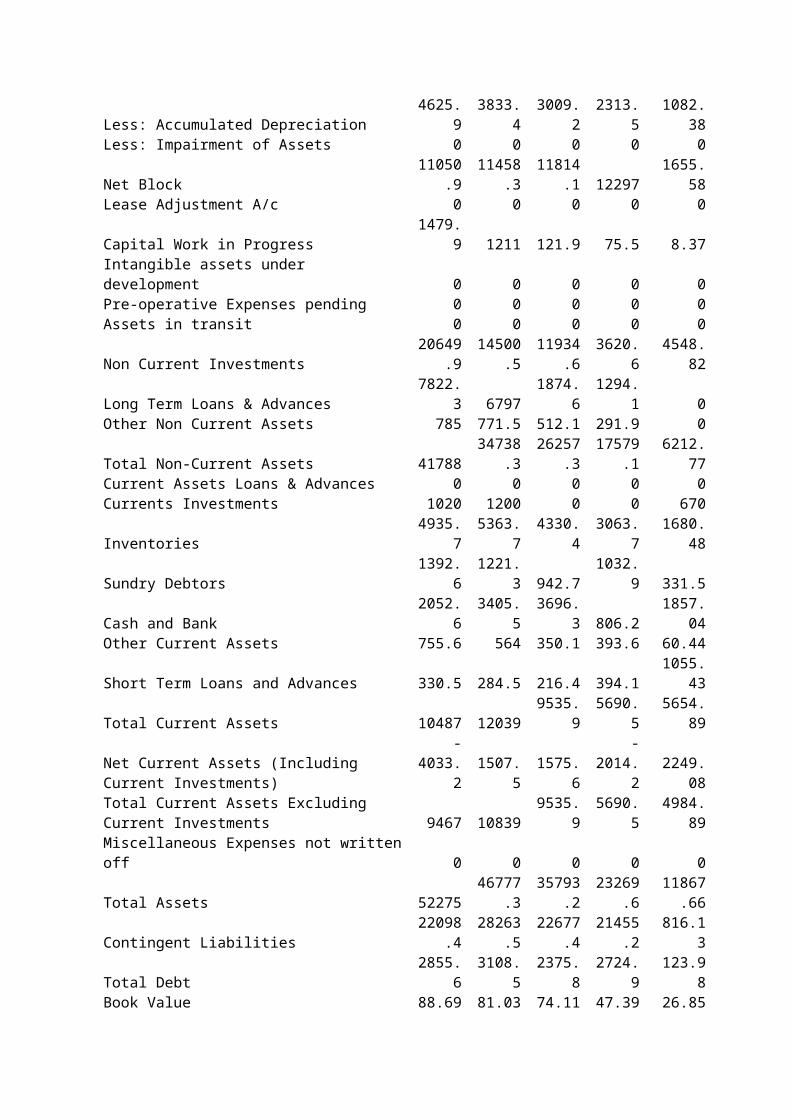
Gross Block15676.
815291.
714823.
314610.
5 2737.95Less: Accumulated Depreciation 4625.9 3833.4 3009.2 2313.5 1082.38Less: Impairment of Assets 0 0 0 0 0
Net Block11050.
911458.
311814.
1 12297 1655.58Lease Adjustment A/c 0 0 0 0 0Capital Work in Progress 1479.9 1211 121.9 75.5 8.37Intangible assets under development 0 0 0 0 0Pre-operative Expenses pending 0 0 0 0 0Assets in transit 0 0 0 0 0
Non Current Investments20649.
914500.
511934.
6 3620.6 4548.82Long Term Loans & Advances 7822.3 6797 1874.6 1294.1 0Other Non Current Assets 785 771.5 512.1 291.9 0
Total Non-Current Assets 4178834738.
326257.
317579.
1 6212.77Current Assets Loans & Advances 0 0 0 0 0Currents Investments 1020 1200 0 0 670Inventories 4935.7 5363.7 4330.4 3063.7 1680.48Sundry Debtors 1392.6 1221.3 942.7 1032.9 331.5Cash and Bank 2052.6 3405.5 3696.3 806.2 1857.04Other Current Assets 755.6 564 350.1 393.6 60.44Short Term Loans and Advances 330.5 284.5 216.4 394.1 1055.43Total Current Assets 10487 12039 9535.9 5690.5 5654.89Net Current Assets (Including Current Investments)
-4033.2 1507.5 1575.6
-2014.2 2249.08
Total Current Assets Excluding Current Investments 9467 10839 9535.9 5690.5 4984.89
Miscellaneous Expenses not written off 0 0 0 0 0
Total Assets 5227546777.
335793.
223269.
611867.6
6
Contingent Liabilities22098.
428263.
522677.
421455.
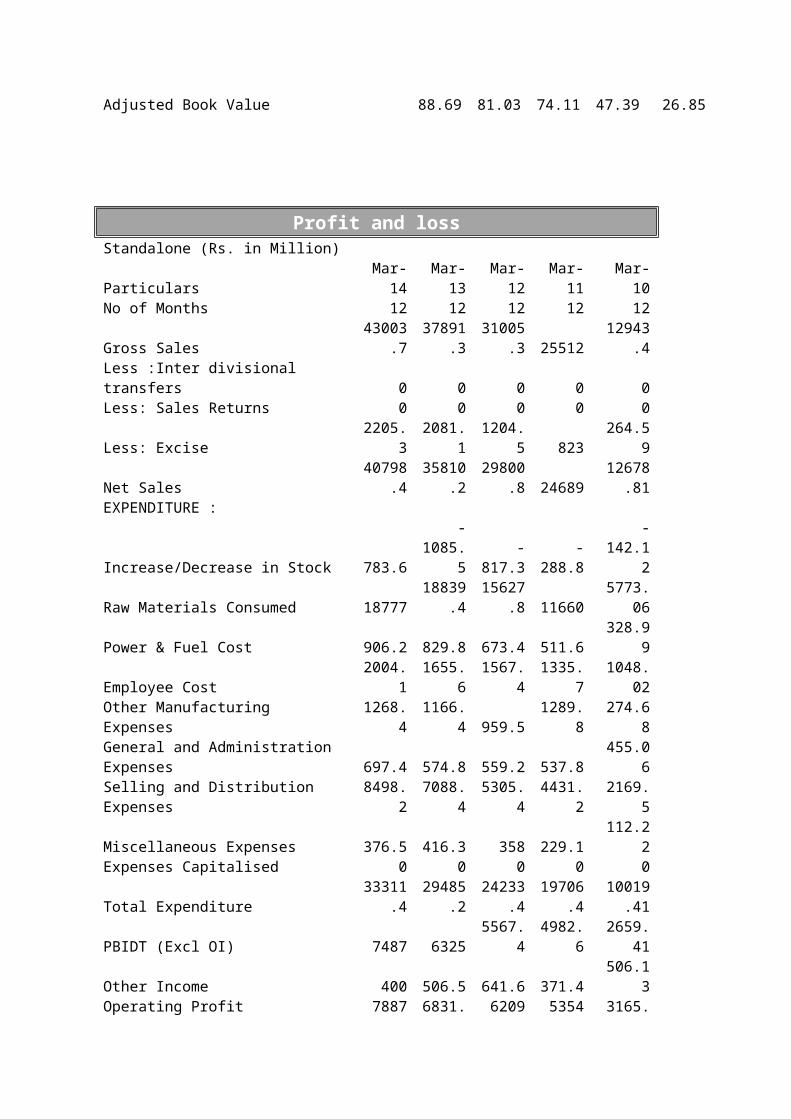
2 816.13Total Debt 2855.6 3108.5 2375.8 2724.9 123.98Book Value 88.69 81.03 74.11 47.39 26.85Adjusted Book Value 88.69 81.03 74.11 47.39 26.85
Profit and lossStandalone (Rs. in Million)Particulars Mar-14 Mar-13 Mar-12 Mar-11 Mar-10No of Months 12 12 12 12 12
Gross Sales43003.
737891.
331005.
3 25512 12943.4Less :Inter divisional transfers 0 0 0 0 0Less: Sales Returns 0 0 0 0 0Less: Excise 2205.3 2081.1 1204.5 823 264.59
Net Sales40798.
435810.
229800.
8 2468912678.8
1EXPENDITURE :
Increase/Decrease in Stock 783.6-
1085.5 -817.3 -288.8 -142.12
Raw Materials Consumed 1877718839.
415627.
8 11660 5773.06Power & Fuel Cost 906.2 829.8 673.4 511.6 328.99Employee Cost 2004.1 1655.6 1567.4 1335.7 1048.02Other Manufacturing Expenses 1268.4 1166.4 959.5 1289.8 274.68General and Administration Expenses 697.4 574.8 559.2 537.8 455.06Selling and Distribution Expenses 8498.2 7088.4 5305.4 4431.2 2169.5Miscellaneous Expenses 376.5 416.3 358 229.1 112.22Expenses Capitalised 0 0 0 0 0
Total Expenditure33311.
429485.
224233.
419706.
410019.4
1PBIDT (Excl OI) 7487 6325 5567.4 4982.6 2659.41Other Income 400 506.5 641.6 371.4 506.13Operating Profit 7887 6831.5 6209 5354 3165.54Interest 401.9 179.2 169.6 87.7 36.62PBDT 7485.1 6652.3 6039.4 5266.3 3128.92Depreciation 355.2 322.7 258.3 219.8 137.49Profit Before Taxation & Exceptional Items 7129.9 6329.6 5781.1 5046.5 2991.42Exceptional Income / Expenses 0 0 1809.5 403.1 0Profit Before Tax 7129.9 6329.6 7590.6 5449.6 2991.42
Provision for Tax 1481.5 1220.2 1546.7 1100 510.26PAT 5648.4 5109.4 6043.9 4349.6 2481.16Adj to Profit After Tax 0 0 0 0 0
Profit Balance B/F10100.
9 7698.2 4079.1 1742 981.46
Appropriations15749.
312807.
6 10123 6091.6 3462.62Equity Dividend (%) 525 500 475 450 425Earnings Per Share (Rs.) 16.59 15.01 17.76 13.44 8.05Book Value (Rs.) 88.69 81.03 74.11 47.39 26.85
Cost Of Goods Sold21687.
321324.
817868.
613507.
3 7150.07Current Market Price 851.7 779.25 479.65 365.4 261.45
Market Capitalization 289978 265256 163230 11825580583.7
6EBIT 7131.8 6002.3 5309.1 4762.8 2521.92
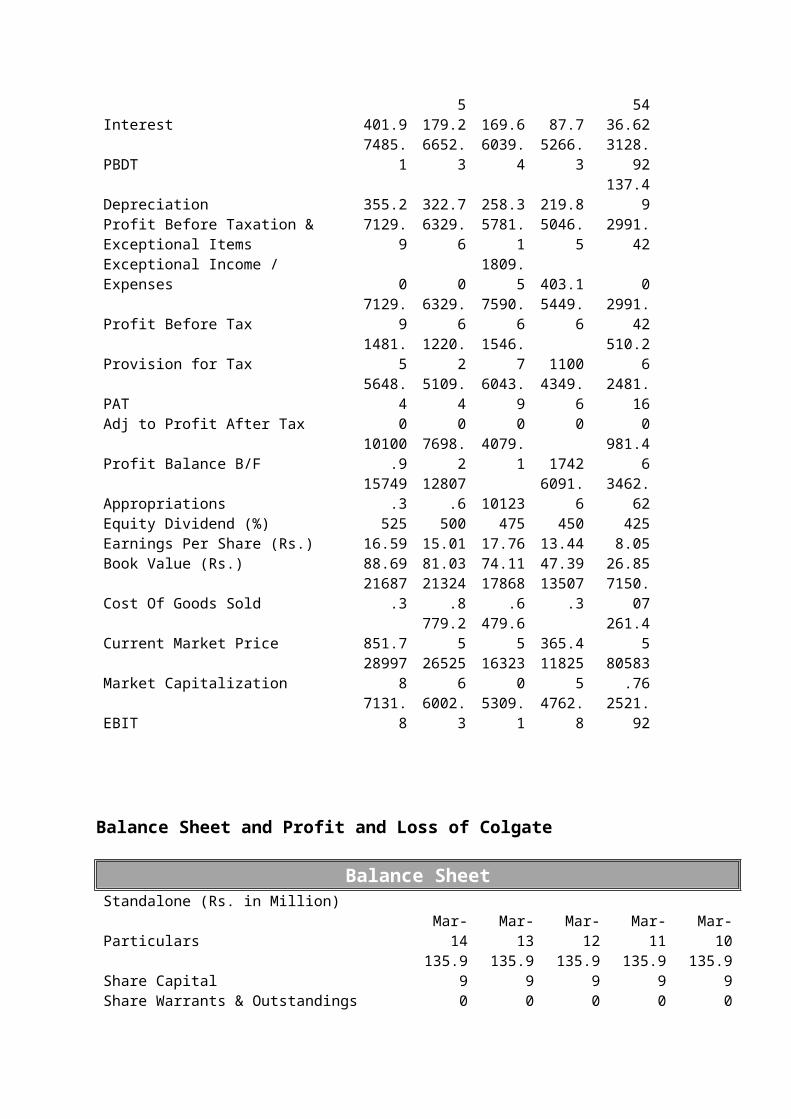
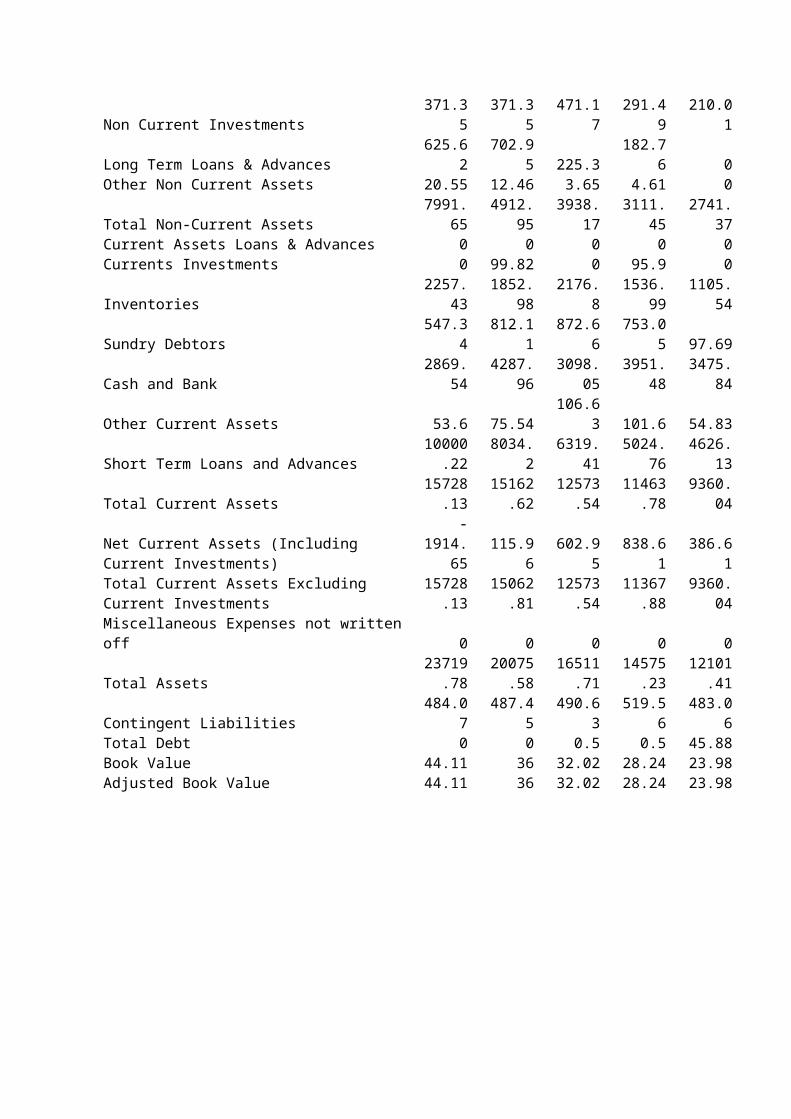
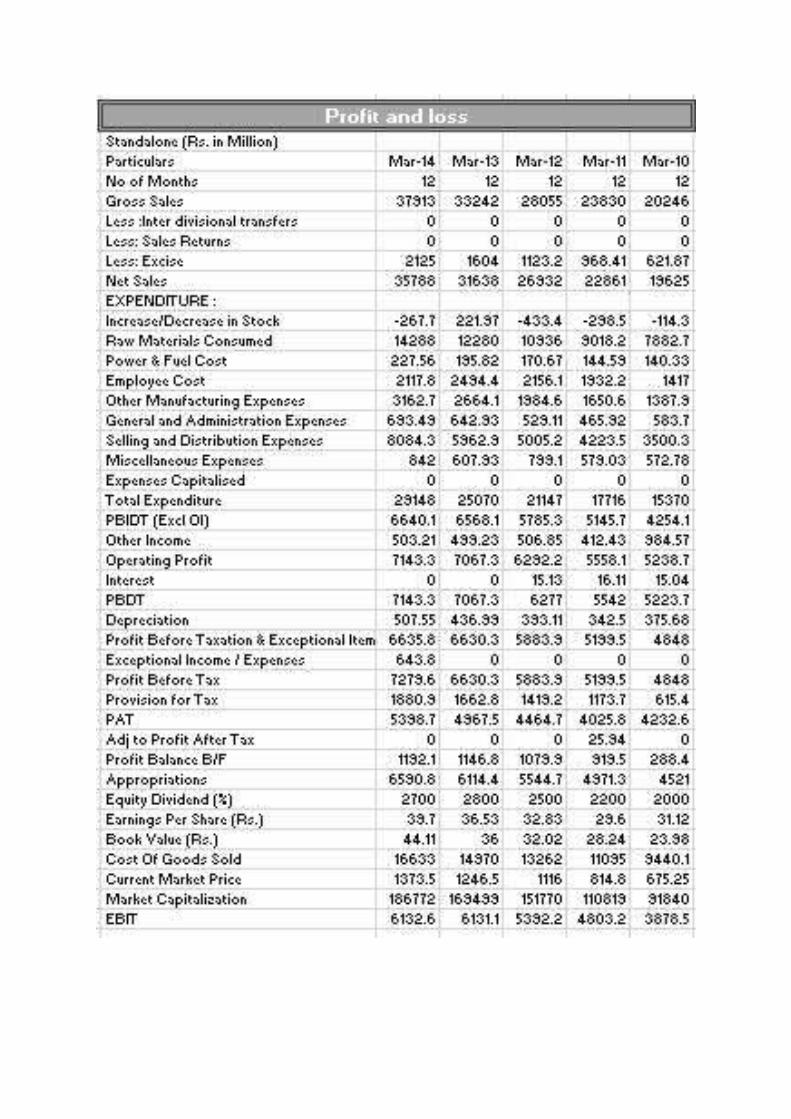
Balance Sheet and Profit and Loss of Colgate
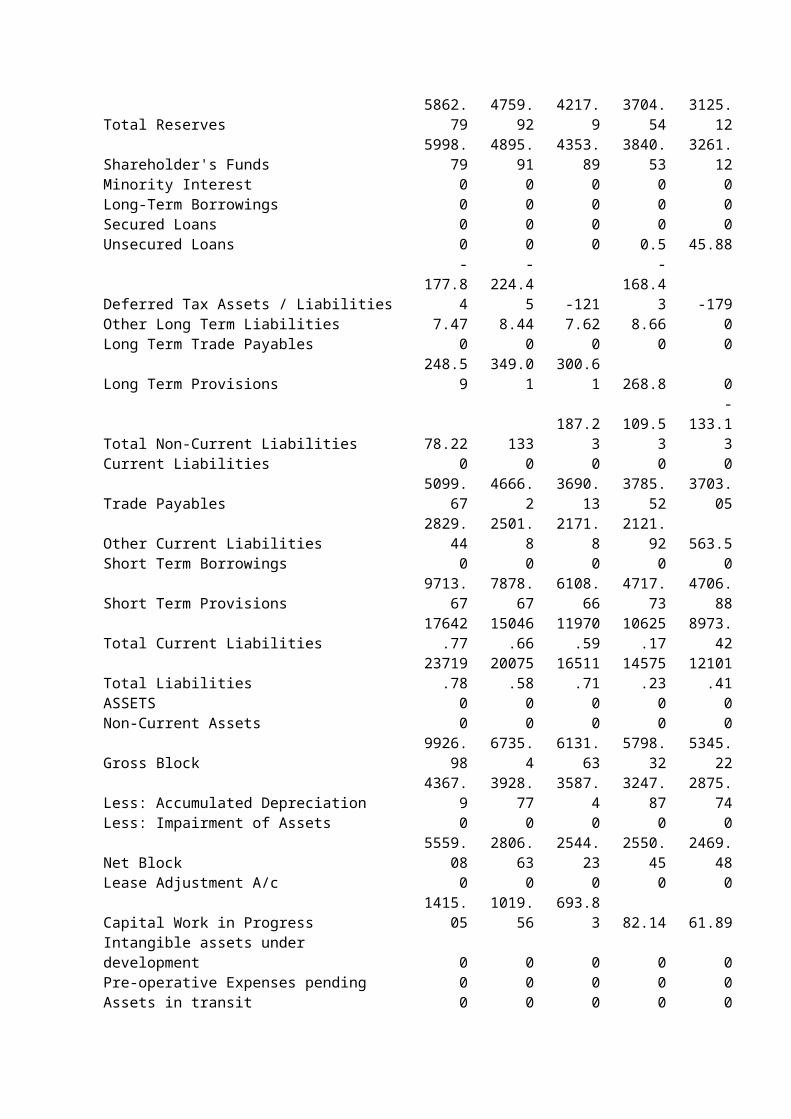
Balance SheetStandalone (Rs. in Million)Particulars Mar-14 Mar-13 Mar-12 Mar-11 Mar-10Share Capital 135.99 135.99 135.99 135.99 135.99Share Warrants & Outstandings 0 0 0 0 0Total Reserves 5862.79 4759.92 4217.9 3704.54 3125.12Shareholder's Funds 5998.79 4895.91 4353.89 3840.53 3261.12Minority Interest 0 0 0 0 0Long-Term Borrowings 0 0 0 0 0Secured Loans 0 0 0 0 0Unsecured Loans 0 0 0 0.5 45.88Deferred Tax Assets / Liabilities -177.84 -224.45 -121 -168.43 -179Other Long Term Liabilities 7.47 8.44 7.62 8.66 0Long Term Trade Payables 0 0 0 0 0Long Term Provisions 248.59 349.01 300.61 268.8 0Total Non-Current Liabilities 78.22 133 187.23 109.53 -133.13Current Liabilities 0 0 0 0 0Trade Payables 5099.67 4666.2 3690.13 3785.52 3703.05Other Current Liabilities 2829.44 2501.8 2171.8 2121.92 563.5Short Term Borrowings 0 0 0 0 0Short Term Provisions 9713.67 7878.67 6108.66 4717.73 4706.88
Total Current Liabilities17642.7
715046.6
611970.5
910625.1
7 8973.42
Total Liabilities23719.7
820075.5
816511.7
114575.2
312101.4
1
ASSETS 0 0 0 0 0Non-Current Assets 0 0 0 0 0Gross Block 9926.98 6735.4 6131.63 5798.32 5345.22Less: Accumulated Depreciation 4367.9 3928.77 3587.4 3247.87 2875.74Less: Impairment of Assets 0 0 0 0 0Net Block 5559.08 2806.63 2544.23 2550.45 2469.48Lease Adjustment A/c 0 0 0 0 0Capital Work in Progress 1415.05 1019.56 693.83 82.14 61.89Intangible assets under development 0 0 0 0 0Pre-operative Expenses pending 0 0 0 0 0Assets in transit 0 0 0 0 0Non Current Investments 371.35 371.35 471.17 291.49 210.01Long Term Loans & Advances 625.62 702.95 225.3 182.76 0Other Non Current Assets 20.55 12.46 3.65 4.61 0Total Non-Current Assets 7991.65 4912.95 3938.17 3111.45 2741.37Current Assets Loans & Advances 0 0 0 0 0Currents Investments 0 99.82 0 95.9 0Inventories 2257.43 1852.98 2176.8 1536.99 1105.54Sundry Debtors 547.34 812.11 872.66 753.05 97.69Cash and Bank 2869.54 4287.96 3098.05 3951.48 3475.84Other Current Assets 53.6 75.54 106.63 101.6 54.83
Short Term Loans and Advances10000.2
2 8034.2 6319.41 5024.76 4626.13
Total Current Assets15728.1
315162.6
212573.5
411463.7
8 9360.04Net Current Assets (Including Current Investments)
-1914.65 115.96 602.95 838.61 386.61
Total Current Assets Excluding Current Investments
15728.13
15062.81
12573.54
11367.88 9360.04
Miscellaneous Expenses not written off 0 0 0 0 0
Total Assets23719.7
820075.5
816511.7
114575.2
312101.4
1Contingent Liabilities 484.07 487.45 490.63 519.56 483.06Total Debt 0 0 0.5 0.5 45.88Book Value 44.11 36 32.02 28.24 23.98Adjusted Book Value 44.11 36 32.02 28.24 23.98
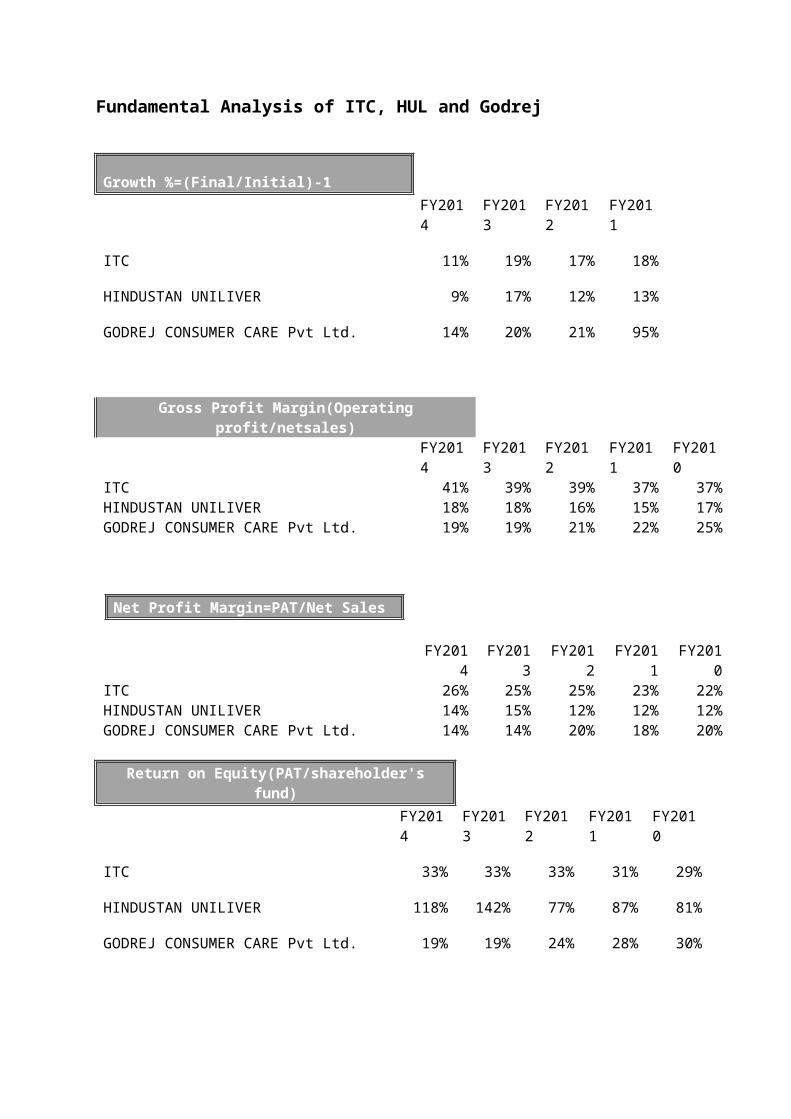
Fundamental Analysis of ITC, HUL and Godrej
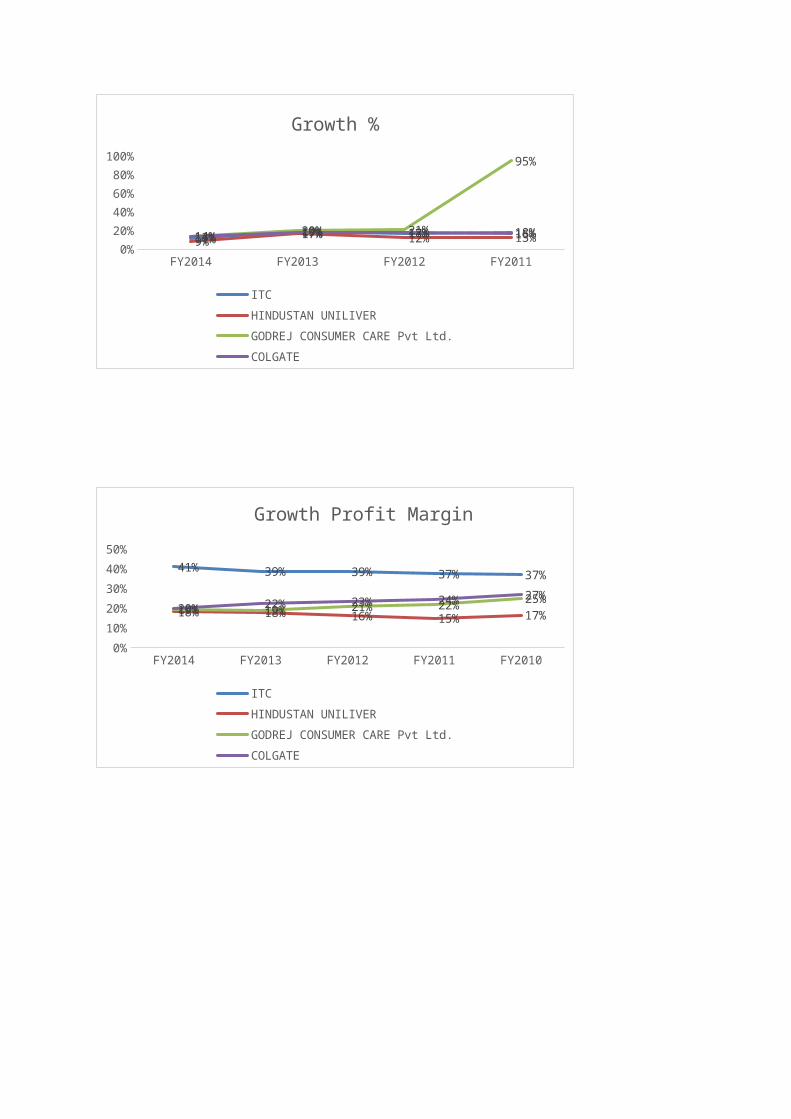
Growth %=(Final/Initial)-1
FY2014 FY2013 FY2012 FY2011
ITC 11% 19% 17% 18%
HINDUSTAN UNILIVER 9% 17% 12% 13%
GODREJ CONSUMER CARE Pvt Ltd. 14% 20% 21% 95%
Gross Profit Margin(Operating profit/netsales)FY2014 FY2013 FY2012 FY2011 FY2010
ITC 41% 39% 39% 37% 37%HINDUSTAN UNILIVER 18% 18% 16% 15% 17%GODREJ CONSUMER CARE Pvt Ltd. 19% 19% 21% 22% 25%
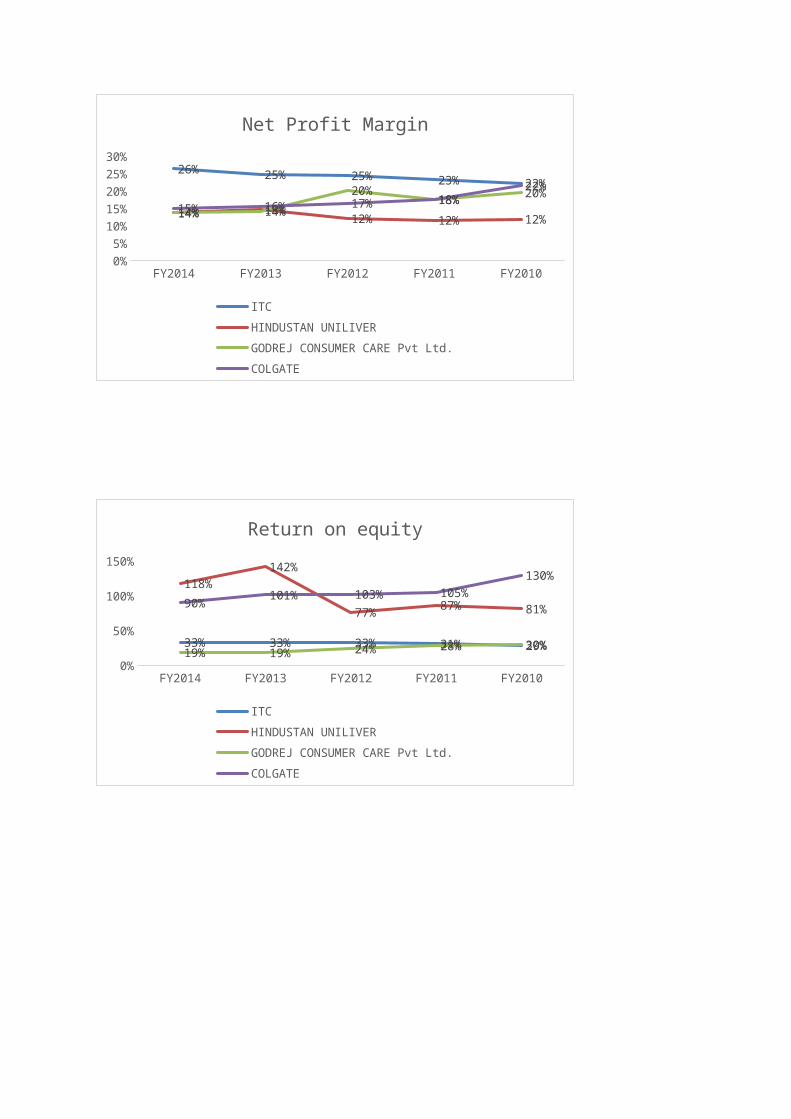
Net Profit Margin=PAT/Net Sales
FY2014 FY2013 FY2012 FY2011 FY2010ITC 26% 25% 25% 23% 22%HINDUSTAN UNILIVER 14% 15% 12% 12% 12%GODREJ CONSUMER CARE Pvt Ltd. 14% 14% 20% 18% 20%
Return on Equity(PAT/shareholder's fund)
FY2014 FY2013 FY2012 FY2011 FY2010
ITC 33% 33% 33% 31% 29%
HINDUSTAN UNILIVER 118% 142% 77% 87% 81%
GODREJ CONSUMER CARE Pvt Ltd. 19% 19% 24% 28% 30%
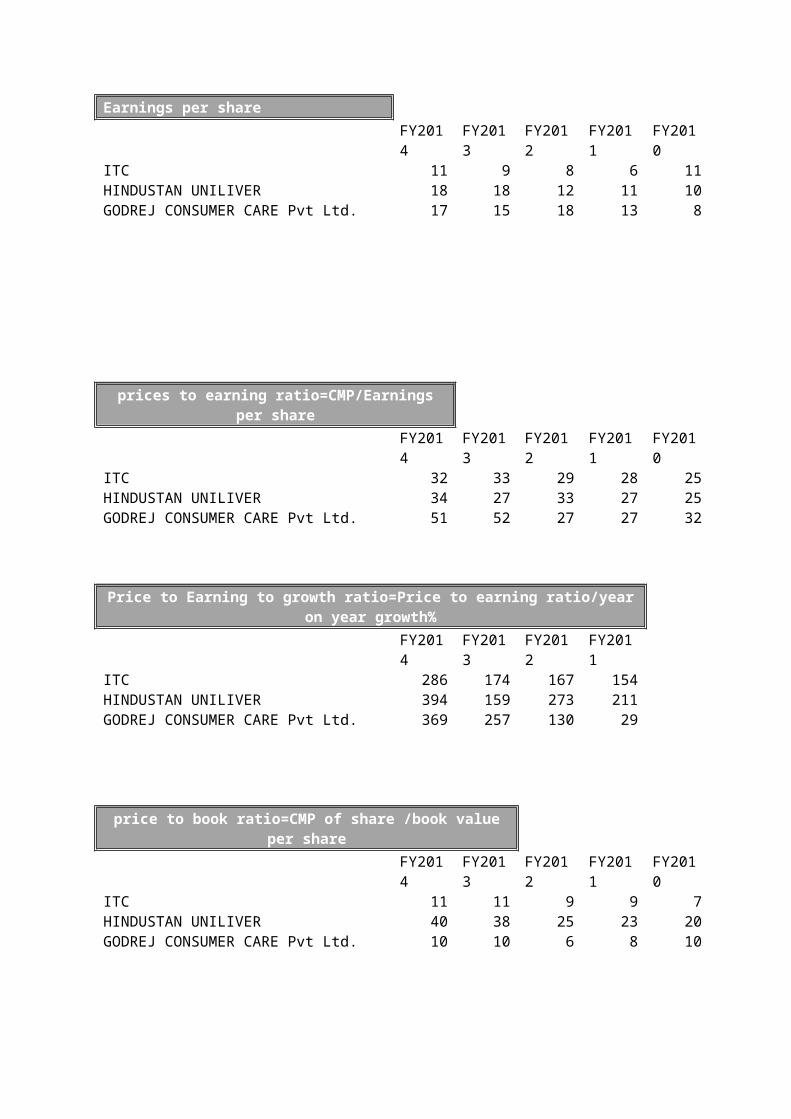
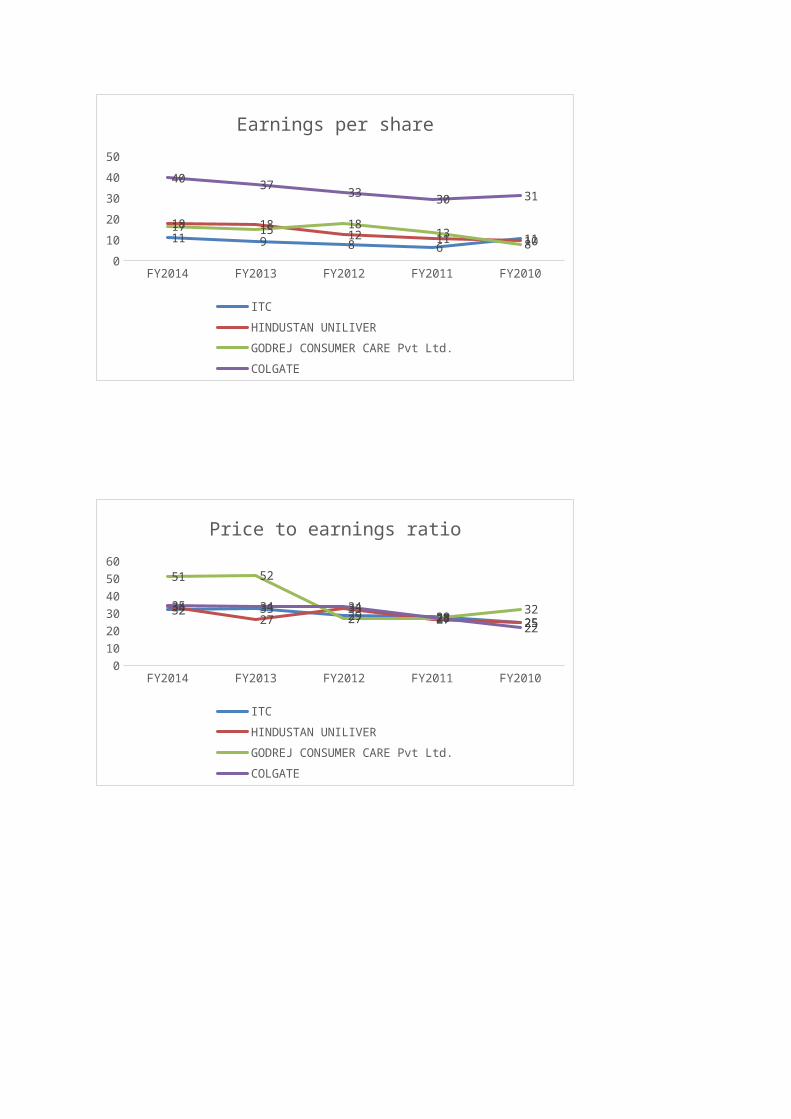
Earnings per shareFY2014 FY2013 FY2012 FY2011 FY2010
ITC 11 9 8 6 11HINDUSTAN UNILIVER 18 18 12 11 10GODREJ CONSUMER CARE Pvt Ltd. 17 15 18 13 8
prices to earning ratio=CMP/Earnings per shareFY2014 FY2013 FY2012 FY2011 FY2010
ITC 32 33 29 28 25HINDUSTAN UNILIVER 34 27 33 27 25GODREJ CONSUMER CARE Pvt Ltd. 51 52 27 27 32
Price to Earning to growth ratio=Price to earning ratio/year on year growth%FY2014 FY2013 FY2012 FY2011
ITC 286 174 167 154HINDUSTAN UNILIVER 394 159 273 211GODREJ CONSUMER CARE Pvt Ltd. 369 257 130 29
price to book ratio=CMP of share /book value per shareFY2014 FY2013 FY2012 FY2011 FY2010
ITC 11 11 9 9 7HINDUSTAN UNILIVER 40 38 25 23 20GODREJ CONSUMER CARE Pvt Ltd. 10 10 6 8 10
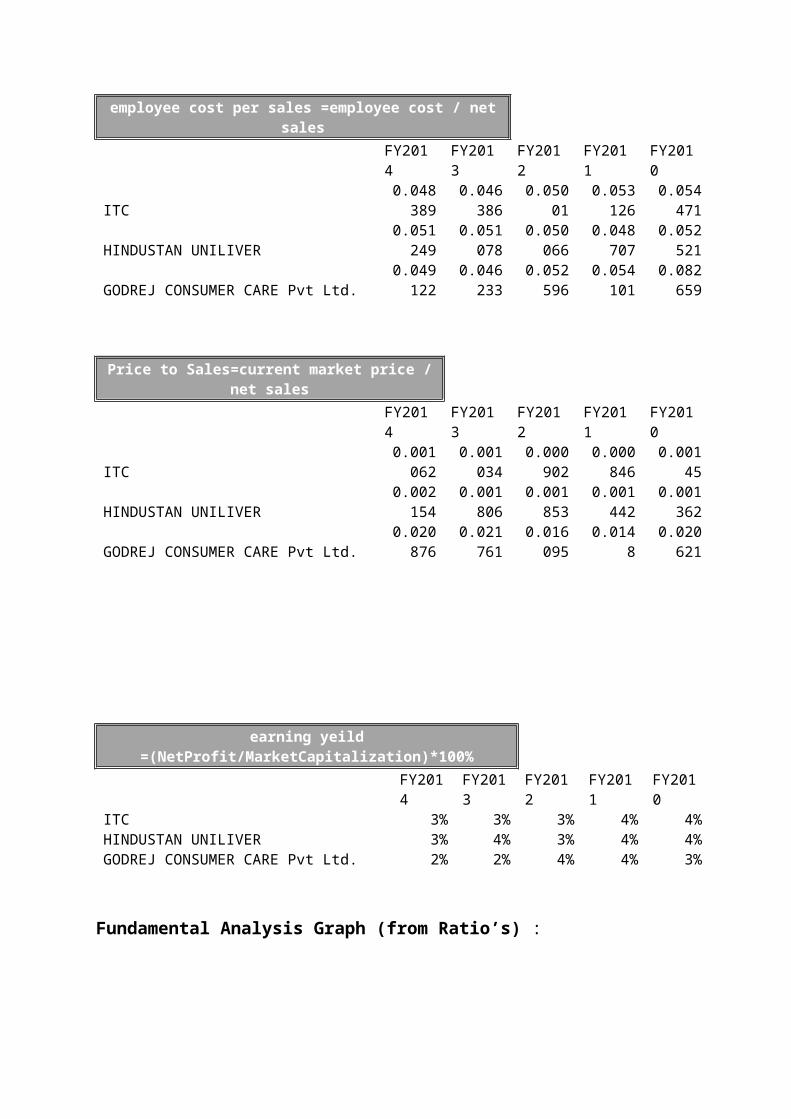
employee cost per sales =employee cost / net salesFY2014 FY2013 FY2012 FY2011 FY2010
ITC0.04838
90.04638
6 0.050010.05312
60.05447
1
HINDUSTAN UNILIVER0.05124
90.05107
80.05006
60.04870
70.05252
1
GODREJ CONSUMER CARE Pvt Ltd.0.04912
20.04623
30.05259
60.05410
10.08265
9
Price to Sales=current market price / net salesFY2014 FY2013 FY2012 FY2011 FY2010
ITC0.00106
20.00103
40.00090
20.00084
6 0.00145HINDUSTAN UNILIVER 0.00215 0.00180 0.00185 0.00144 0.00136
4 6 3 2 2
GODREJ CONSUMER CARE Pvt Ltd.0.02087
60.02176
10.01609
5 0.01480.02062
1
earning yeild =(NetProfit/MarketCapitalization)*100%FY2014 FY2013 FY2012 FY2011 FY2010
ITC 3% 3% 3% 4% 4%HINDUSTAN UNILIVER 3% 4% 3% 4% 4%GODREJ CONSUMER CARE Pvt Ltd. 2% 2% 4% 4% 3%
Fundamental Analysis Graph (from Ratio’s) :
FY2014 FY2013 FY2012 FY20110%
10%20%30%40%50%60%70%80%90%
100%
11%19% 17% 18%
9%17%
12% 13%14%20% 21%
95%
13% 17% 18% 16%
Growth %
ITC HINDUSTAN UNILIVERGODREJ CONSUMER CARE Pvt Ltd. COLGATE
FY2014 FY2013 FY2012 FY2011 FY20100%
5%10%15%
20%25%
30%35%40%45%
41%39% 39% 37% 37%
18% 18% 16% 15% 17%19% 19% 21% 22%
25%
20%22% 23% 24%
27%
Growth Profit Margin
ITC HINDUSTAN UNILIVERGODREJ CONSUMER CARE Pvt Ltd. COLGATE
FY2014 FY2013 FY2012 FY2011 FY20100%
5%
10%
15%
20%
25%
30%
26%25% 25% 23% 22%
14% 15%12% 12% 12%
14% 14%
20%18%
20%
15% 16% 17% 18%
22%
Net Profit Margin
ITC HINDUSTAN UNILIVERGODREJ CONSUMER CARE Pvt Ltd. COLGATE
FY2014 FY2013 FY2012 FY2011 FY20100%
20%
40%
60%
80%
100%
120%
140%
160%
33% 33% 33% 31% 29%
118%
142%
77%87% 81%
19% 19% 24% 28% 30%
90%101% 103% 105%
130%
Return on equity
ITC HINDUSTAN UNILIVERGODREJ CONSUMER CARE Pvt Ltd. COLGATE
FY2014 FY2013 FY2012 FY2011 FY20100
5
10
15
20
25
30
35
40
45
11 9 8 611
18 18
12 11 10
17 1518
13
8
4037
3330 31
Earnings per share
ITC HINDUSTAN UNILIVERGODREJ CONSUMER CARE Pvt Ltd. COLGATE
FY2014 FY2013 FY2012 FY2011 FY20100
10
20
30
40
50
60
32 3329 28
25
34
2733
27 25
51 52
27 273235 34 34
2822
Price to earnings ratio
ITC HINDUSTAN UNILIVERGODREJ CONSUMER CARE Pvt Ltd. COLGATE
FY2014 FY2013 FY2012 FY20110
50
100
150
200
250
300
350
400
450
286
174 167 154
394
159
273
211
369
257
130
29
264
195 191167
price to earnings to growth ratio
ITC HINDUSTAN UNILIVERGODREJ CONSUMER CARE Pvt Ltd. COLGATE
FY2014 FY2013 FY2012 FY2011 FY20100
5
10
15
20
25
30
35
40
45
11 11 9 9 7
4038
2523
20
10 106 8
10
3135 35
29 28
Price to book ratio
ITC HINDUSTAN UNILIVERGODREJ CONSUMER CARE Pvt Ltd. COLGATE
FY2014 FY2013 FY2012 FY2011 FY20100%
1%
2%
3%
4%
5%
3% 3%3% 4%
4%
3%
4%
3%
4%4%
2% 2%
4% 4%
3%3% 3% 3%
4%
5%
Earning Yeild
ITC HINDUSTAN UNILIVERGODREJ CONSUMER CARE Pvt Ltd. COLGATE
Concepts and Analysis
1. Earnings
The key element all investors look after is earnings. Before investing in a company you want to know how much the company is making in profits. Future earnings are a key factor as the future prospects of the company's business and potential growth opportunities are determinants of the stock price.
From the Earnings per share graph we can say that EPS is good in case of Colgate, when compared with other 3 companies.
2. Profit Margins
Amount of earnings do not tell the full story, increasing earnings are good but if the cost increases more than revenues then the profit margin is not improving. The profit margin measures how much the company keeps in earnings out of every Rupee of their revenues. This measure is therefore very useful for comparing similar companies, within the same industry.Higher profit margin indicates that the company has better control over its costs than its competitors.
From the Net profit Margin graph, we can say that Net Profit Margin is good in case of ITC Company.
3. Return on Equity (ROE)
Return of equity (ROE) is a financial ratio that does not account for the stock price. Since it ignores the price entirely it is by many thought of as THE most important financial measure. It can basically be thought of as the parent ratio that always needs to be considered.
This ratio is a measure of how efficient a company is in generating its profits.
From the Return on Equity graph, we can say that Return on Equity is good in case of ITC .
4. Price-to-Earnings (P/E)
A high P/E indicates that the stock is priced relatively high to its earnings, and companies with higher P/E therefore seem more expensive..
This ratio does not tell the full story since it does not account for growth. Normally, companies with high earnings growth are traded at higher P/E values than companies with more moderate growth rate. Accordingly, if the company is growing rapidly and is expected to maintain its growth in the future this current market price might not seem so expensive.
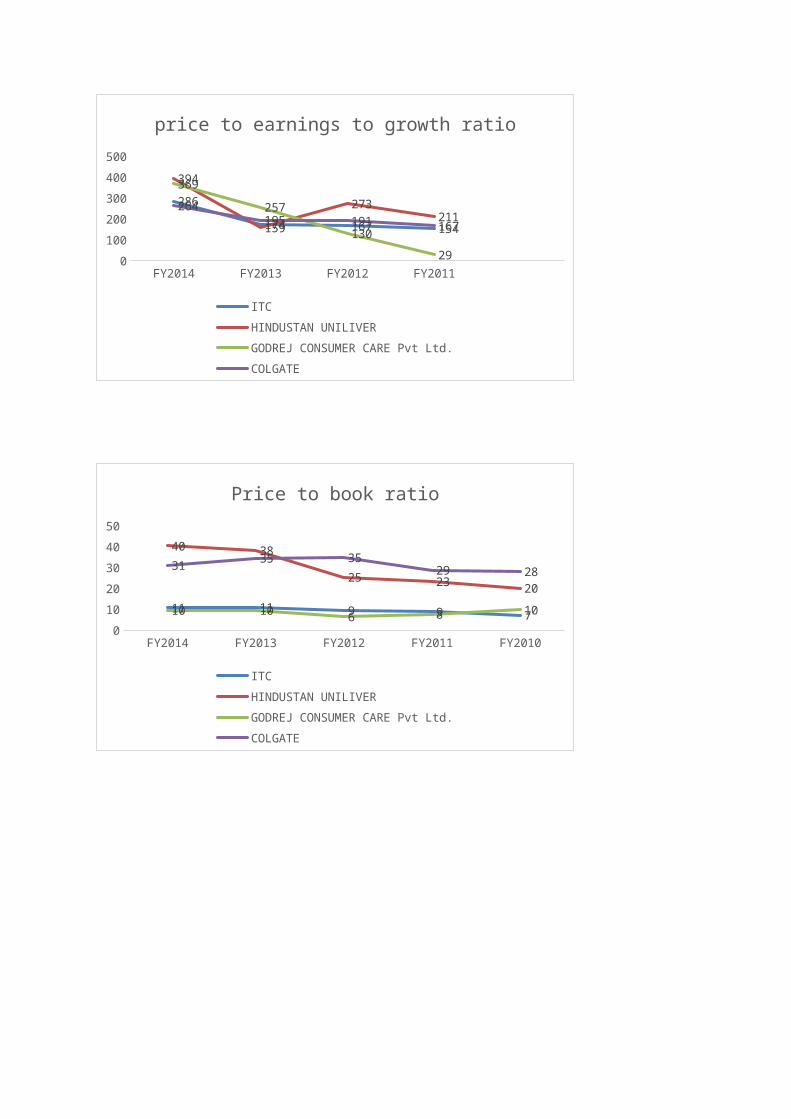
From the graph of P/E Godrej P/E ratio has increased so much whereas Colgate and ITC has almost consistent trend.
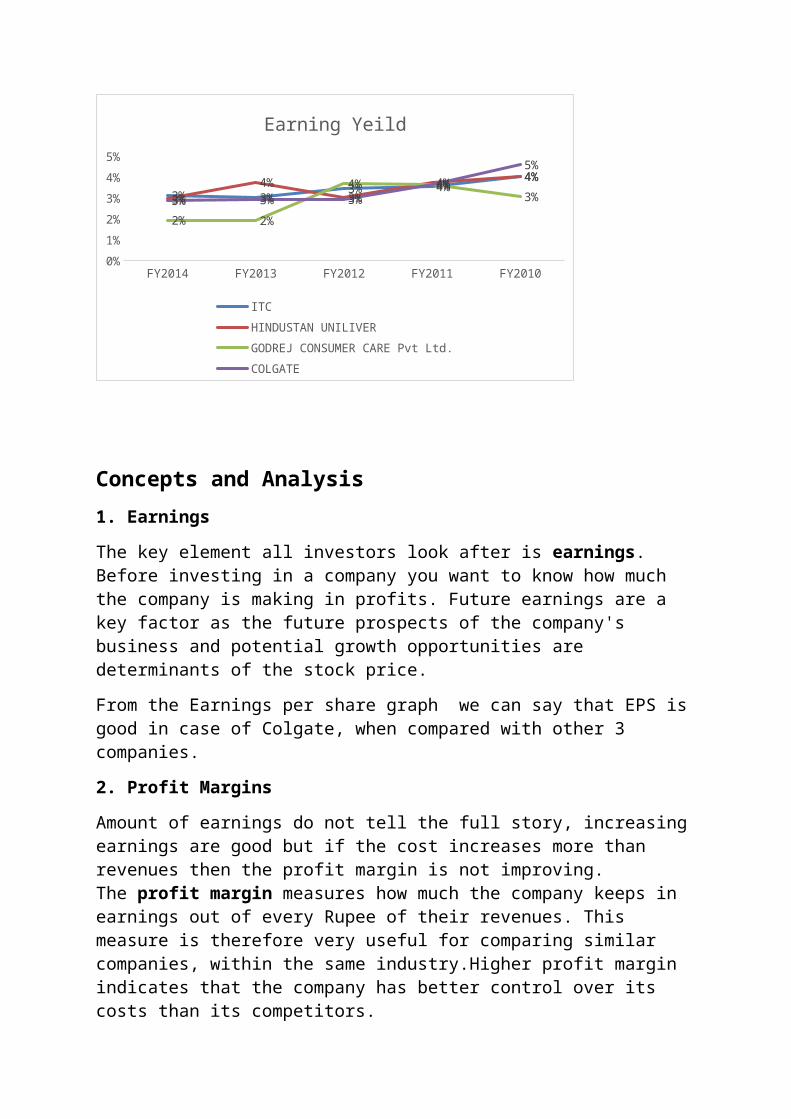
5.Earnings Yield:
As per the graph the Earning yield is good in case ITC.
6. Price-to-Book (P/B)
A price-to-book (P/B) ratio is used to compare a stock's market value to its book value. This ratio gives certain idea of whether you are paying too high price for the stock as it denotes what would be the residual value if the company went bankrupt today.According to the graph Hindustan Uniliver is good.
From all these above concepts ,Investor can choose ITC for the long term benefits which would arrive in the near future.
4.Technical Analysis
Technical analysis studies supply and demand in a market in order to determine what direction or trend will continue in the future, in other words ,technical analysis attempts to understand the what emotions markets has?
The Secondary Data is taken from Bombay Stock Exchange.
Let us examine the Technical Analysis of ITC,HUL,Godrej and Colgate with the use of Share Markets( from 1st April 2014 to 5th March 2015).
The Stock Market Data is Attached in the Annexure 1 .With the help of these data we will study the technical analysis by analysing the trend of the shares in the stock market.
Graph ITC
1-Apr-14 7-May-14 5-Jun-14 4-Jul-14 5-Aug-14 5-Sep-14 9-Oct-14 13-Nov-14 12-Dec-14 13-Jan-15 12-Feb-150
1000000
2000000
3000000
4000000
5000000
6000000
0
50
100
150
200
250
300
350
400
450
ITC
No.of Shares Close Price
Log Return Of ITC:
-10%
-8%
-6%
-4%
-2%
0%
2%
4%
6%
8%
Log Return
Graph of GCPL:
1-Apr-14 8-May-14 9-Jun-14 9-Jul-14 11-Aug-14 12-Sep-14 20-Oct-14 24-Nov-14 24-Dec-14 27-Jan-15 27-Feb-150
100000
200000
300000
400000
500000
600000
700000
800000
900000
0
200
400
600
800
1000
1200
1400
GCPL
No.of Shares Close Price
Log Returns of GCPL:
-10%
-8%
-6%
-4%
-2%
0%
2%
4%
6%
8%
Log Return
Graph of HUL:
1-Apr-14 7-May-14 5-Jun-14 4-Jul-14 5-Aug-14 5-Sep-14 9-Oct-14 13-Nov-14 12-Dec-14 13-Jan-15 12-Feb-150
100000
200000
300000
400000
500000
600000
700000
800000
900000
0
200
400
600
800
1000
1200
HUL
No.of Shares Close Price
Log Return of HUL:
-8%-6%-4%-2%0%2%4%6%8%
10%
Log Return
Graph of Colgate:
1-Apr-14 8-May-14 9-Jun-14 9-Jul-14 11-Aug-14 12-Sep-14 20-Oct-14 24-Nov-14 24-Dec-14 27-Jan-15 27-Feb-150
50000
100000
150000
200000
250000
300000
350000
400000
450000
500000
0
500
1000
1500
2000
2500
Chart Title
No.of Shares Close Price
Log Return of Colgate
-6%
-4%
-2%
0%
2%
4%
6%
8%
Log Return
Conclusion:
ITC:
1)The Volume is high and high price of the share is 399.55 on 25th Feb 2015,which is the highest price among the others.
2)We can find a mostly a horizontal trend with a very slow upward trend.
3)The log return value chart it is varying majorly between 2% and -2%
4)From the Analysis ,we can say that , it is good to invest ,if we seek for long term investment.
GCPL:
1)From the candle chart we can say that the Volume and high price of the share is 1203.75 on 5st March 2015,which is the highest price among the others.
2)We can find a slight upward trend with a horizontal trend till 21th Aug 2014
3) We can see horizontal trend and then slight upward trend from 21st Aug 2014 to 5th march 2015
4)The log return value chart it is majorly varying between 2% and -2%
5)From the Analysis ,we can say that , it is good to invest ,if we seek for long term investment.
Colgate:
1)From the candle chart we can say that the Volume and high price of the share is 2068.65 on 5st March 2015,which is the highest price among the others.
2)We can find a slight upward trend with a horizontal trend till 24th July 2014
3) We can see slight downward trend and quickly a horizontal trend and then slight upward trend from 24st July 2014 to 5th march 2015
4)The log return value chart it is majorly varying between 2% and -2%
5)From the Analysis ,we can say that , it is good to invest ,if we seek for long term investment.
HUL:
1) From the candle chart we can say that the Volume and high price of the share is 939 on 5th March 2015,which is the highest price among the others.
2) We can see mostly a horizontal trend with a upward trend slightly till 6th jan 2015.
3)From 6th jan 2015 there is a upward trend and then it became horizontal trend.
4)From the Analysis ,we can say that , it is good to invest ,if we seek for long term investment.7
Online International, Reviewed & Indexed Monthly Journal www.raijmr.com9 Online International, Reviewed & Indexed Monthly Journal www.raijmr.com
Refrences:
http://www.itcportal.com/about-itc/profile/index.aspx
http://www.colgate.co.in/app/Colgate/IN/HomePage.cvsp
http://www.godrejcp.com/about-us.aspx
http://www.hul.co.in/aboutus/ http://www.moneycontrol.com/ http://www.bseindia.com/ http://www.livemint.com/