Embed Size (px)
Citation preview

Goodrich CorporationFourth Quarter and Full Year 2008 Results
February 4, 2009

2
Certain statements made in this presentation are forward-looking statements within the meaning of the Private Securities Litigation Reform Act of 1995 regarding the Company's future plans, objectives and expected performance. The Company cautions readers that any such forward-looking statements are based on assumptions that the Company believes are reasonable, but are subject to a wide range of risks, and actual results may differ materially.
Important factors that could cause actual results to differ include, but are not limited to: demand for and market acceptance of new and existing products, such as the Airbus A350 XWB and A380, the Boeing 787 Dreamliner, the Embraer 190, the Dassault Falcon 7X, and the Lockheed Martin F-35 Lightning II and F-22 Raptor; the health of the commercial aerospace industry, including the impact of bankruptcies and/or mergers in the airline industry; global demand for aircraft spare parts and aftermarket services; and other factors discussed in the Company's filings with the Securities and Exchange Commission and in the Company's February 4, 2009 Fourth Quarter and Full Year 2008 Results press release.
The Company cautions you not to place undue reliance on the forward-looking statements contained in this presentation, which speak only as of the date on which such statements were made. The Company undertakes no obligation to release publicly any revisions to these forward-looking statements to reflect events or circumstances after the date on which such statements were made or to reflect the occurrence of unanticipated events.
Forward Looking Statements

3
Commercial Aerospace Environment

44
Fuel Price and GDP GrowthHistorical and Forecast
IMF Economic Growth Forecast(2007 to 2011)
Oil prices have begun to stabilize in the $40-60/bbl rangeIf economic situation deteriorates further, forward oil prices will likely decline
Source: Seabury Aviation & Aerospace; Bloomberg (WTI Oil); IMF WEO Update January 2009 (GDP)
Real GDP Growth %
Recent data suggest that global economy deteriorated sharply in Nov-Dec 2008Developed Asia, North America and Europe now all forecast for decline in 2009
Oil Price(2003 to Jan. 30, 2009)
$/bbl

55
Global Passenger Capacity2007-2009 Growth
Note: Scheduled passenger capacity onlySource: Seabury Aviation & Aerospace
Year-over-Year Change in Available-Seat-Miles (ASMs)
For most of 2008, capacity was increasing at near historical average rateRising fuel prices drove capacity cuts toward the end of 2008Carriers likely to continue cuts in early 2009 to counter declining demand

66
Aircraft Retirements2008-2009
1 Expected retirements from end of Dec. 2008 to end of Dec. 2009Note: Scheduled passenger aircraft only; Excludes potential for later return-to-serviceSource: Seabury Aviation & Aerospace; Announced capacity cuts
Aircraft1
1,018
1,366
348
Airlines continue to ground aircraftAlmost all capacity cuts have been old-gen aircraftOld aircraft relatively easier to retirePrudent planning for the future favors new equipment
747CL
77
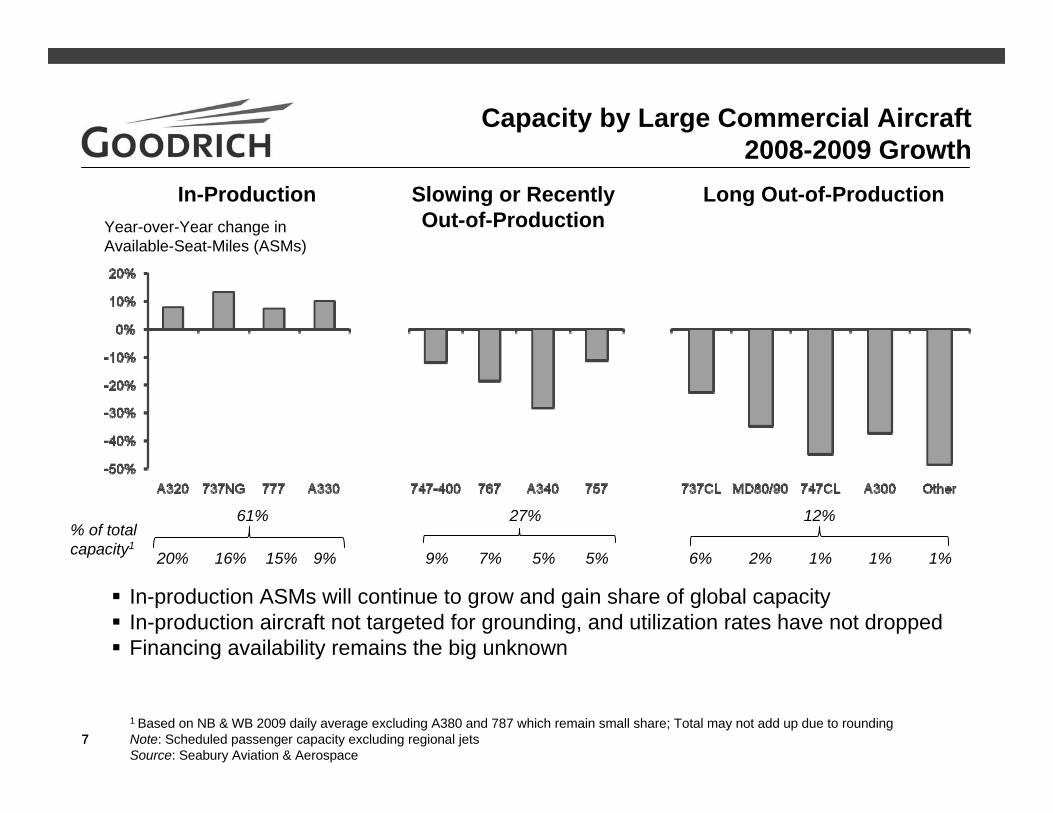
Capacity by Large Commercial Aircraft2008-2009 Growth
1 Based on NB & WB 2009 daily average excluding A380 and 787 which remain small share; Total may not add up due to rounding Note: Scheduled passenger capacity excluding regional jetsSource: Seabury Aviation & Aerospace
In-production ASMs will continue to grow and gain share of global capacityIn-production aircraft not targeted for grounding, and utilization rates have not droppedFinancing availability remains the big unknown
In-Production Slowing or Recently Out-of-Production
Long Out-of-ProductionYear-over-Year change in Available-Seat-Miles (ASMs)
% of total capacity1
20% 16% 15% 9% 9% 7% 5% 5% 6% 2% 1% 1% 1%
61% 27% 12%

8
Large Commercial AircraftFleet Demographics vs.
Goodrich Aftermarket Sales
In Service Fleet Demographics (1/1/08)
Recently Out-of-
Production 7%
In Production
60% Long Out-of-Production
31%
Goodrich is very well positioned on the newer, in-production airplanes
Goodrich Aftermarket Sales Distribution (Est. 2008)
Long Out-of-Production 8%
Recently Out-of-Production
8%
Long Out-of-Production707 727 747C 737CA310 DC8 DC9 DC10MD80 L1011
Long Out-of-Production(Less Vulnerable)
MD11 MD90
4%
2%
InProduction
80%

9
A320 Deliveries and Installed Base
0
50
100
150
200
250
300
350
400
450
1995 1996 1997 1998 1999 2000 2001 2002 2003 2004 2005 2006 2007 2008 2009 2010 2011 2012 20130
1000
2000
3000
4000
5000
6000
A320 Family Deliveries A320 Family Installed Base
Actual Estimated
Delivered Units
2002 – 2003 aftermarket sales based on installed base as of 1995, 2009 and on sales based on deliveries and installed base in 2002 and beyond
Installed Base
Installed base/deliveries subject to major overhaul in 2001
Installed base/deliveries
subject to major overhaul in 2009
Source: Airline Monitor, July 2008

10
Financial and Operational Highlights

11
Fourth Quarter 2008 Highlights
Completed the Rolls-Royce joint venture to develop and supply engine controls for Rolls-Royce aero engines
Goodrich retains the aftermarket products and services business associated with the joint venture's productsCash payment from Rolls-Royce used to fund worldwide pension plans
Selected by Airbus to supply wheels and carbon brakes for the A350 XWB family of aircraft
Received a contract from the U.S. Department of Defense (DOD) for the first operational satellite system in support of Operationally Responsive Space (ORS)
ORS is focused on the ability to quickly and affordably implement space capabilities that benefit the warfighter

12
Fourth Quarter and Full Year 2008 Results
Fourth Quarter 2008 ResultsFourth quarter 2008 sales of $1,695 million increased 2 percent over fourth quarter 2007 sales of $1,668 million
– Including significant sales declines associated with the Boeing strike Fourth quarter 2008 income per diluted share of $1.35 increased 31 percent over fourth quarter 2007 income per diluted share of $1.03 Total segment operating income margin increased to 16.3 percent, from 15.8 percent in the fourth quarter 2007Net cash provided by operating activities, minus capital expenditures, of $231 million
– 137% of fourth quarter 2008 net income
Full Year 2008 ResultsNet income per diluted share increased to $5.39, a 43 percent increase over 2007 net income of $3.78 Sales increased to $7.1 billion, an 10 percent increase over 2007 sales of $6.4 billion
– Predominantly organic growthGenerated net cash provided by operating activities, minus capital expenditures, of $502 million
– 75% of income from continuing operations

13
Full Year 2009 Outlook Full Year 2009 Outlook
Sales outlook of $7.1 - $7.2 billion – approximately 1 - 2% growth over 2008 results
– Large commercial OE sales expected to increase about 3 - 5%– Large commercial, regional business and general aviation aftermarket sales expected
to be approximately flatSome expected growth in large commercial aftermarket, offset by expectations for lower regional, business and general aviation aftermarket sales
– Sales outlook includes unfavorable sales impacts, compared to 2008, for:($180M) related to foreign currency exchange rate impacts, andApproximately ($150) million related to the formation of the Rolls-Royce engine controls joint venture
Outlook for net income and income per diluted share from continuing operations of $4.50 - $4.90, including:
– Higher pension expense of $0.55 per share, compared to 2008 pension expense– Full year 2009 tax rate of about 31 - 32%– Favorable foreign exchange translation costs approximately $5 million lower than in
2008Net cash provided by operating activities, minus capital expenditures, expected to be greater than 75% of net income

14
Delivering Sustained Sales Growthand Margin Expansion
3,000
3,500
4,000
4,500
5,000
5,500
6,000
6,500
7,000
7,500
Q42004
Q22005
Q42005
Q22006
Q42006
Q22007
Q42007
Q22008
Q42008
0.0%
2.0%
4.0%
6.0%
8.0%
10.0%
12.0%
14.0%
16.0%
18.0%
Q42004
Q22005
Q42005
Q22006
Q42006
Q22007
Q42007
2Q2008
4Q2008
$M$M Sales(Trailing Four Qtrs.) Segment Operating Income Margins
(Trailing Four Qtrs.)

15
Year-over-Year Financial Results

16
30%31%
27%29%
+0.5%
5%
2%
Change
$1.04$1.03
$1.35$1.35
Diluted EPS- Continuing Operations- Net Income
$133$131
$169$169
Income- Continuing Operations- Net Income
$264$276Segment operating income
15.8%16.3%- % of Sales
$1,668$1,695Sales
4th Qtr 2007
4th Qtr2008(Dollars in Millions, excluding EPS)
Fourth Quarter 2008 – Financial SummaryYear-over-Year Performance
17
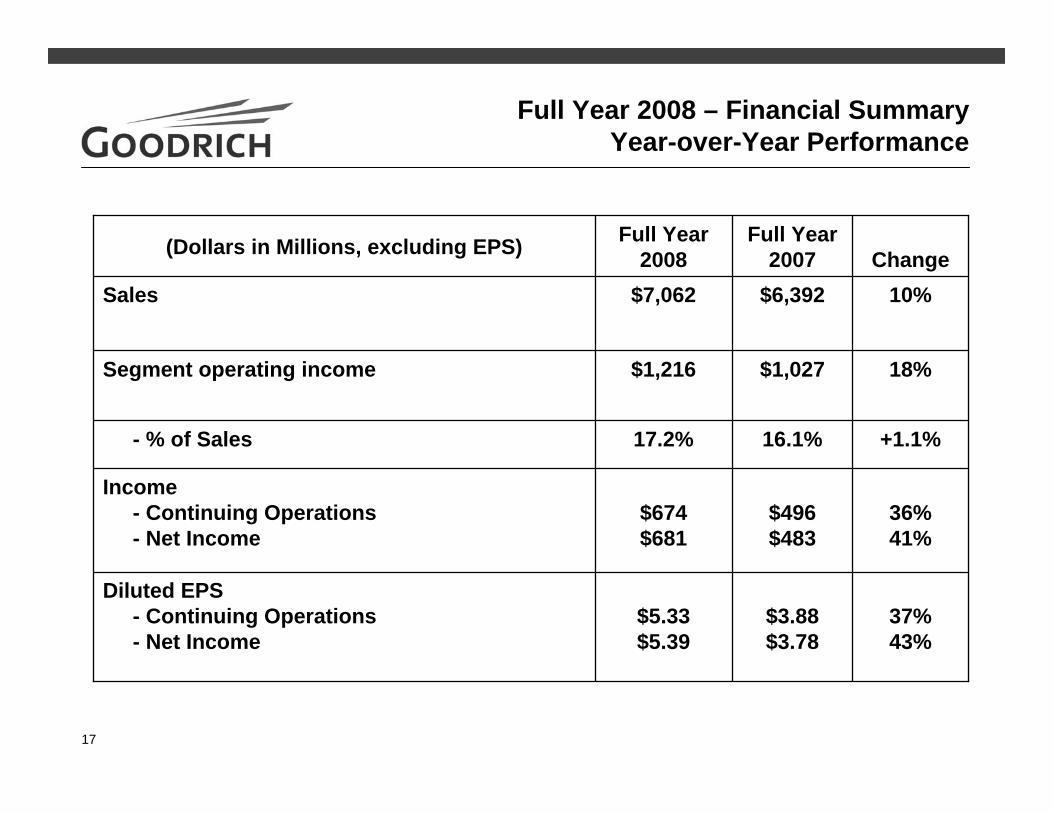
37%43%
36%41%
+1.1%
18%
10%Change
$3.88$3.78
$5.33$5.39
Diluted EPS- Continuing Operations- Net Income
$496$483
$674$681
Income- Continuing Operations- Net Income
$1,027$1,216Segment operating income
16.1%17.2%- % of Sales
$6,392$7,062Sales
Full Year2007
Full Year 2008(Dollars in Millions, excluding EPS)
Full Year 2008 – Financial SummaryYear-over-Year Performance

18
Fourth Quarter 2008Year-over-Year Financial Change Analysis
$0.12$15Gain on formation of JV
($0.09)($12)Northrop Grumman settlement in 2007$0.95$121$1,668Subtotal
$1.09$137$1,695Subtotal
$0.02$3Share-based compensation$0.01$2Long-term contracts – changes in estimates
$0.13$13$96Increased overall volume, efficiency, mix, reduced share count, other
$0.14$17Lower effective tax rate (excluding JV discrete benefit)
($0.02)($2)($69)Foreign exchange translation costs
$1.35$169$1,695Fourth Quarter 2008 – Continuing Operations
(Dollars in Millions)
$1,668
Sales
$1.04$133Fourth Quarter 2007 – Continuing Operations
Per Diluted Share
After-tax IncomeItem
Note: To the extent that this chart indicates non-GAAP comparisons, Goodrich feels that these comparisons are useful to show fourth quarter operating results for 2007 and 2008 in the most comparable manner.

19
Fourth Quarter 2008 Year-over-Year Segment Results
10.6%24.1%13.5%16.3%
$ 61$146$ 69$276
$ 579$ 603$ 513$1,695
4th Quarter2008 %$Dollars in Millions
+0.3%+0.8%(1.3%)+0.5%
N/AN/AN/AN/A
10.3%23.3%14.8%15.8%
Segment MarginActuation and Landing SystemsNacelles and Interior SystemsElectronic Systems
Overall Segment Margin
(8%)15%(4%)4%
($ 5)$20
($ 3)$12
$ 66$126$ 72$264
Segment OIActuation and Landing SystemsNacelles and Interior SystemsElectronic Systems
Total Segment OI
(9%)11%5%2%
($ 58)$ 60$ 25$27
$ 637$ 543$ 488$1,668
SalesActuation and Landing SystemsNacelles and Interior SystemsElectronic Systems
Total Sales
Change4th Quarter2007

20
Full Year 2008 Year-over-Year Segment Results
11.5%26.1%13.7%17.2%
$ 300$ 647$ 269$1,216
$2,615$2,486$1,961$7,062
Full Year2008 %$Dollars in Millions
+1.2%+1.6%+0.1%+1.1%
N/AN/AN/AN/A
10.3%24.5%13.6%16.1%
Segment MarginActuation and Landing SystemsNacelles and Interior SystemsElectronic Systems
Overall Segment Margin
21%22%8%
19%
$ 52$ 116$ 21$ 189
$ 248$ 531$ 248$1,027
Segment OIActuation and Landing SystemsNacelles and Interior SystemsElectronic Systems
Total Segment OI
9%15%8%
10%
$214$317$139$670
$2,401$2,169$1,822$6,392
SalesActuation and Landing SystemsNacelles and Interior SystemsElectronic Systems
Total Sales
ChangeFull Year2007

21
Summary Cash Flow Information
($22)($126)Pension Contributions - worldwide
$7$83Accrued expenses, other (including pension contributions)
($122)($95)Capital Expenditures
$326
$38
($29)
$65
$169
4th Quarter2008
$188
($3)
($9)
$62
$131
4th Quarter 2007
Cash Flow from Operations
Deferred income taxes and taxes payable
Working Capital – (increase)/decrease – defined as the sum of A/R, Inventory and A/P
Depreciation and Amortization
Net Income
Item(Dollars in Millions)

22
Sales by Market Channel

23
Full Year 2008 Sales by Market ChannelTotal Sales $7.062 Billion
Large Commercial AircraftAftermarket
29%Regional, Business &
General Aviation Aftermarket7%
Boeing Commercial OE
9%
Airbus Commercial OE
16%
Defense & Space, OE & Aftermarket
25%
Other 5%
OE
AM
Balanced business mix; aftermarket represents 45% of total sales
Regional, Business & Gen.
Av. OE9%
Total Commercial Aftermarket
36%
Total Commercial OE34%
Total Defense and Space25%

24
Segment Sales by Market Channel2008 Full Year Sales
Large Commercial AircraftAftermarket
24%
Regional, Business &
General Aviation
Aftermarket11%
Boeing Commercial OE
15%
Airbus Commercial
OE11%
Defense & Space, OE & Aftermarket
22%
Regional, Business & Gen. Av. OE
8%
Other9%
Large Commercial
AircraftAftermarket
45%
Regional, Business &
General Aviation Aftermarket
1%
Boeing Commercial OE
8%
Airbus Commercial
OE29%
Defense & Space, OE & Aftermarket
10%
Regional, Business & Gen. Av. OE
7%
Large Commercial Aircraft
Aftermarket 15%
Regional, Business & General Aviation
Aftermarket9%
Boeing Commercial
OE2%
Airbus Commercial
OE6%
Defense & Space, OE & Aftermarket
49%
Regional, Business & Gen. Av. OE
12%
Other7%
ElectronicSystems
Actuation and Landing Systems Nacelles and Interior Systems

25
Sales by Market Channel Full Year 2008 Change Analysis
2%
2%
7%
4%
15%
(11%)
4Q 2008 vs. 4Q 2007
(4%)
(2%)
1%
(9%)
(3%)
(4%)
4Q 2008 vs. 3Q 2008
Actual Goodrich Change Comparisons
FY 2008 vs. FY 2007
IGT, Other
US, UK Defense Budgets
ASMs, Age, Cycles, Fleet size
Aircraft Deliveries
Aircraft Deliveries
11%Defense and Space –OE and Aftermarket
16%Other
23%Regional, Business & General Aviation - OE
10%Goodrich Total Sales
9%Aftermarket – Large Commercial, Regional, Business and GA
7%Boeing and Airbus –OE Production

26
2009 Outlook

27
2008 Sales ExpectationsBy Market Channel
10%
16%
11%
9%
23%
7%*
2008 Goodrich Growth
1 - 2%*
2 – 5%
~5%
ApproximatelyFlat
~(10%)
3 - 5%
2009 Goodrich Expected Growth
Other5%
Defense and Space OE and Aftermarket
25%
Total 100%
Aftermarket (Commercial/Regional/Bus/GA)
36%
Regional/Bus/GA OE (Weighted)9%
MarketFull Year 2008
Sales Mix
Boeing OE Del.Airbus OE Del.
Total (GR Weight)
9%16%25%
*Includes unfavorable sales impacts, compared to 2008, of approximately $180 million, or 2 percent of sales, related to foreign currency exchange rate impacts and lower sales of approximately $150 million related to the formation of the Rolls-Royce engine controls joint venture

28
2009 OutlookP&L Summary ($M)
($15 - $55)$230 - $270$285Capital Expenditures
N/A>75%75%
Net cash provided by operating activities, minus capital expenditures, as a percent of income from continuing operations
N/A~31 - 32%30%Effective Tax Rate
(9 - 17%)$4.50 - $4.90$5.39- Reported
(8 - 16%)$4.50 - $4.90$5.33- Continuing Operations
EPS (Diluted)
+1 - 2%$7.1 - $7.2B*$7.1BSales
B/(W)Estimate
2009Actual2008
*Includes unfavorable sales impacts, compared to 2008, of approximately $180 million, or 2 percent of sales, related to foreign currency exchange rate impacts and lower sales of approximately $150 million related to the formation of the Rolls-Royce engine controls joint venture