Embed Size (px)
Citation preview
Greek Economic Outlook: Positive Sentiment - Improving Prospects
Economic Research & Investment StrategySeptember 2017
Ilias Lekkos [email protected] Irini Staggel [email protected] Aggelopoulou [email protected] Vlachou [email protected] Rotsika [email protected]
Short & Long-Term Perspectives of the Greek Economy
Alternative Macro Scenarios
Three Challenges to our Outlook
Greek SMEs Panorama
Emerging Trends and Opportunities in the New Greek Landscape
1
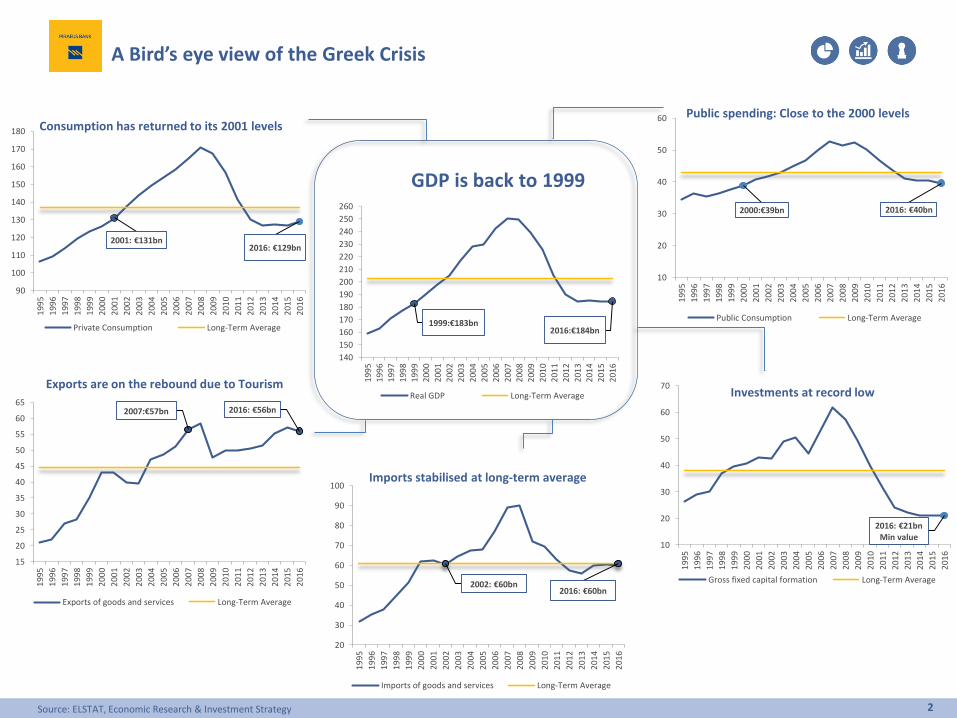
A Bird’s eye view of the Greek Crisis
Source: ELSTAT, Economic Research & Investment Strategy
1999:€183bn2016:€184bn
140
150
160
170
180
190
200
210
220
230
240
250
260
199
5
199
6
199
7
199
8
199
9
200
0
200
1
200
2
200
3
200
4
200
5
200
6
200
7
200
8
200
9
201
0
201
1
201
2
201
3
201
4
201
5
201
6
Real GDP Long-Term Average
2001: €131bn2016: €129bn
90
100
110
120
130
140
150
160
170
180
19
95
19
96
19
97
19
98
19
99
20
00
20
01
20
02
20
03
20
04
20
05
20
06
20
07
20
08
20
09
20
10
20
11
20
12
20
13
20
14
20
15
20
16
Private Consumption Long-Term Average
2000:€39bn 2016: €40bn
10
20
30
40
50
60
19
95
19
96
19
97
19
98
19
99
20
00
20
01
20
02
20
03
20
04
20
05
20
06
20
07
20
08
20
09
20
10
20
11
20
12
20
13
20
14
20
15
20
16
Public Consumption Long-Term Average
2016: €21bnMin value
10
20
30
40
50
60
70
199
5
199
6
199
7
199
8
199
9
200
0
200
1
200
2
200
3
200
4
200
5
200
6
200
7
200
8
200
9
201
0
201
1
201
2
201
3
201
4
201
5
201
6
Gross fixed capital formation Long-Term Average
2007:€57bn 2016: €56bn
15
20
25
30
35
40
45
50
55
60
65
199
5
199
6
199
7
199
8
199
9
200
0
200
1
200
2
200
3
200
4
200
5
200
6
200
7
200
8
200
9
201
0
201
1
201
2
201
3
201
4
201
5
201
6
Exports of goods and services Long-Term Average
2002: €60bn2016: €60bn
20
30
40
50
60
70
80
90
100
199
5
199
6
199
7
199
8
199
9
200
0
200
1
200
2
200
3
200
4
200
5
200
6
200
7
200
8
200
9
201
0
201
1
201
2
201
3
201
4
201
5
201
6
Imports of goods and services Long-Term Average
GDP is back to 1999
Consumption has returned to its 2001 levelsPublic spending: Close to the 2000 levels
Investments at record low
Imports stabilised at long-term average
Exports are on the rebound due to Tourism
2
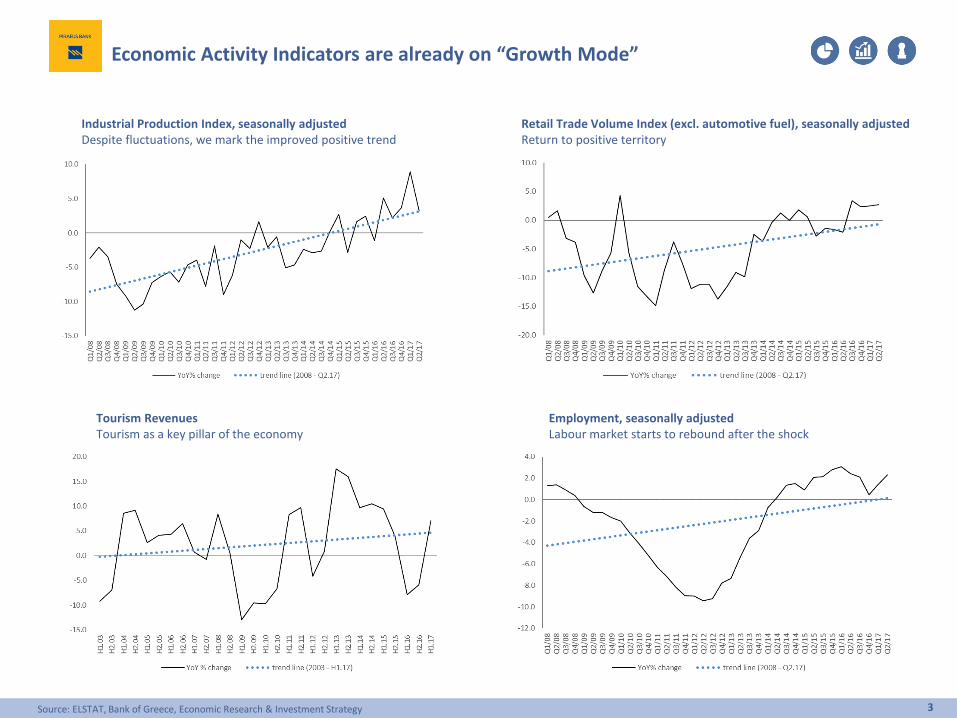
Economic Activity Indicators are already on “Growth Mode”
Industrial Production Index, seasonally adjusted Despite fluctuations, we mark the improved positive trend
Retail Trade Volume Index (excl. automotive fuel), seasonally adjusted Return to positive territory
Employment, seasonally adjusted Labour market starts to rebound after the shock
Tourism RevenuesTourism as a key pillar of the economy
3Source: ELSTAT, Bank of Greece, Economic Research & Investment Strategy
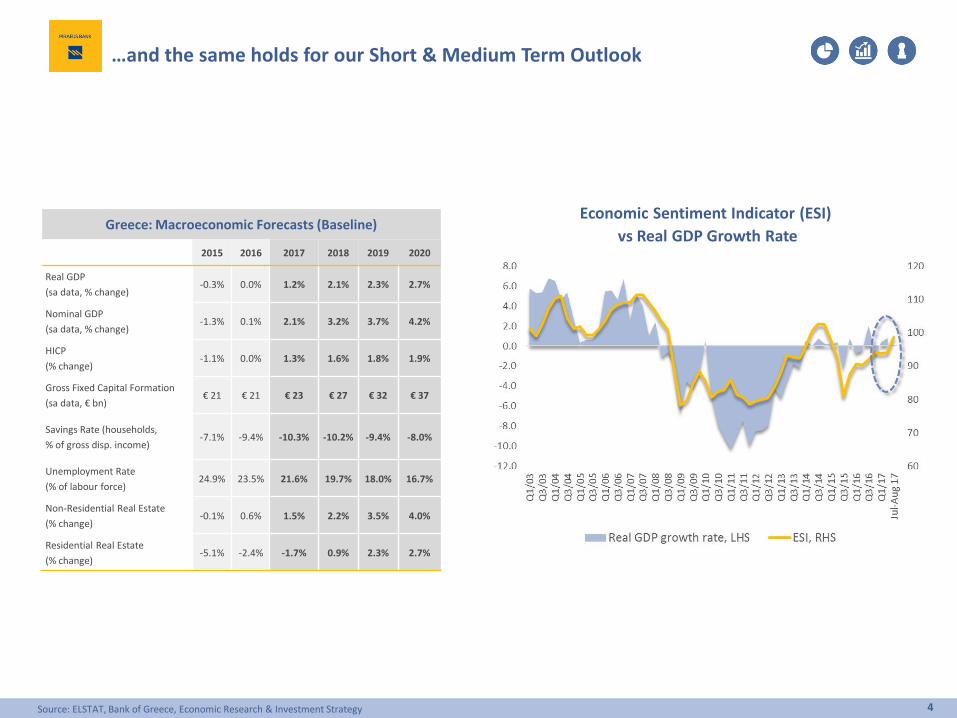
Greece: Macroeconomic Forecasts (Baseline)
2015 2016 2017 2018 2019 2020
Real GDP
(sa data, % change)-0.3% 0.0% 1.2% 2.1% 2.3% 2.7%
Nominal GDP
(sa data, % change)-1.3% 0.1% 2.1% 3.2% 3.7% 4.2%
HICP
(% change)-1.1% 0.0% 1.3% 1.6% 1.8% 1.9%
Gross Fixed Capital Formation
(sa data, € bn)€ 21 € 21 € 23 € 27 € 32 € 37
Savings Rate (households,
% of gross disp. income)-7.1% -9.4% -10.3% -10.2% -9.4% -8.0%
Unemployment Rate
(% of labour force)24.9% 23.5% 21.6% 19.7% 18.0% 16.7%
Non-Residential Real Estate
(% change)-0.1% 0.6% 1.5% 2.2% 3.5% 4.0%
Residential Real Estate
(% change)-5.1% -2.4% -1.7% 0.9% 2.3% 2.7%
…and the same holds for our Short & Medium Term Outlook
Economic Sentiment Indicator (ESI)
vs Real GDP Growth Rate
4Source: ELSTAT, Bank of Greece, Economic Research & Investment Strategy
Short & Long-Term Perspectives of the Greek Economy
Alternative Macro Scenarios
Three Challenges to our Outlook
Greek SMEs Panorama
Emerging Trends and Opportunities in the New Greek Landscape
5
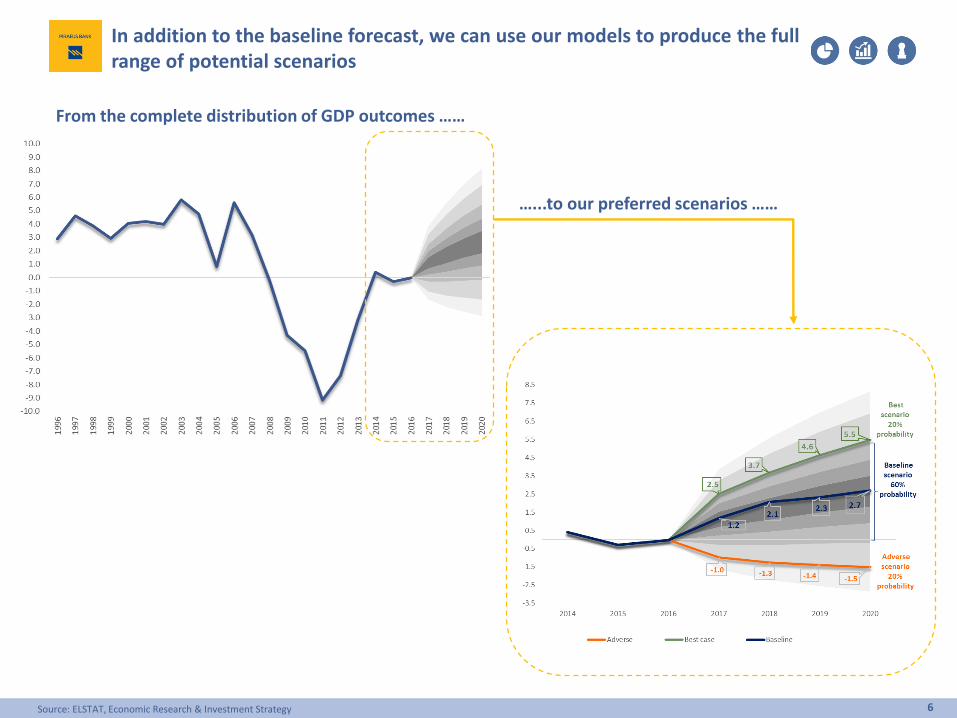
In addition to the baseline forecast, we can use our models to produce the full range of potential scenarios
…...to our preferred scenarios ……
6Source: ELSTAT, Economic Research & Investment Strategy
From the complete distribution of GDP outcomes ……
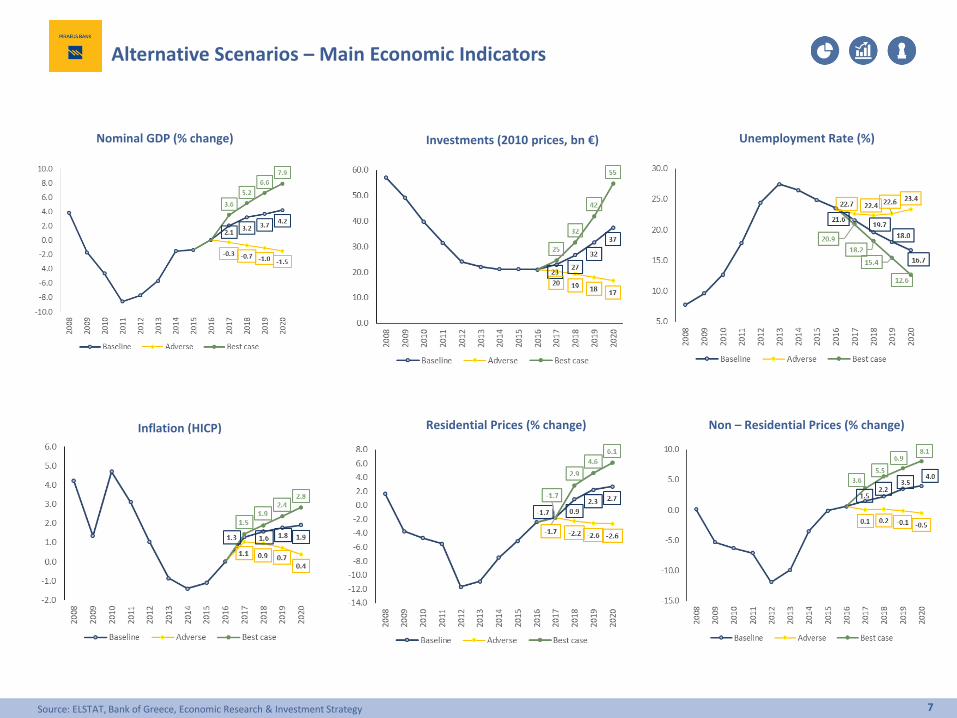
Alternative Scenarios – Main Economic Indicators
Unemployment Rate (%)Investments (2010 prices, bn €)
Non – Residential Prices (% change)Residential Prices (% change)Inflation (HICP)
Nominal GDP (% change)
7Source: ELSTAT, Bank of Greece, Economic Research & Investment Strategy
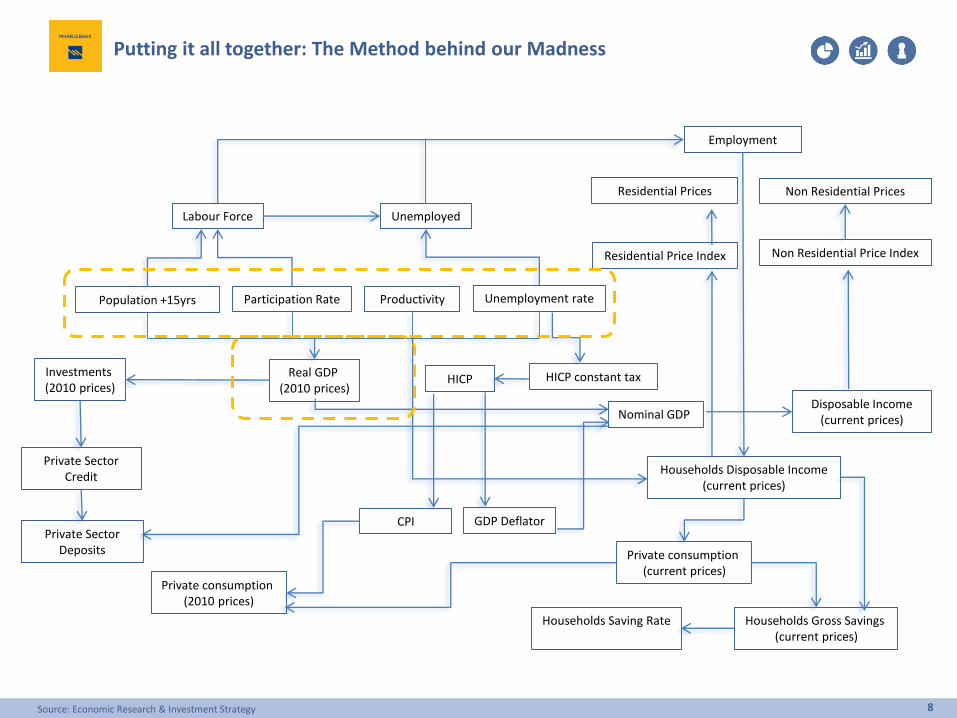
Putting it all together: The Method behind our Madness
8
Employment
Labour Force Unemployed
Non Residential PricesResidential Prices
Population +15yrs Participation Rate Productivity Unemployment rate
Households Saving Rate Households Gross Savings (current prices)
Private consumption (2010 prices)
Private consumption (current prices)
HICP
CPI
Non Residential Price IndexResidential Price Index
Investments(2010 prices)
Real GDP (2010 prices)
Disposable Income (current prices)
Private Sector Credit
GDP Deflator
Households Disposable Income (current prices)
Private Sector Deposits
Nominal GDP
HICP constant tax
Source: Economic Research & Investment Strategy
Short & Long-Term Perspective of the Greek Economy
Alternative Macro Scenarios
Three Challenges to our Outlook
Greek SMEs Panorama
Emerging Trends and Opportunities in the New Greek Landscape
9
50
70
90
110
130
150
170
190
19
95
19
96
19
97
19
98
19
99
20
00
20
01
20
02
20
03
20
04
20
05
20
06
20
07
20
08
20
09
20
10
20
11
20
12
20
13
20
14
20
15
20
16
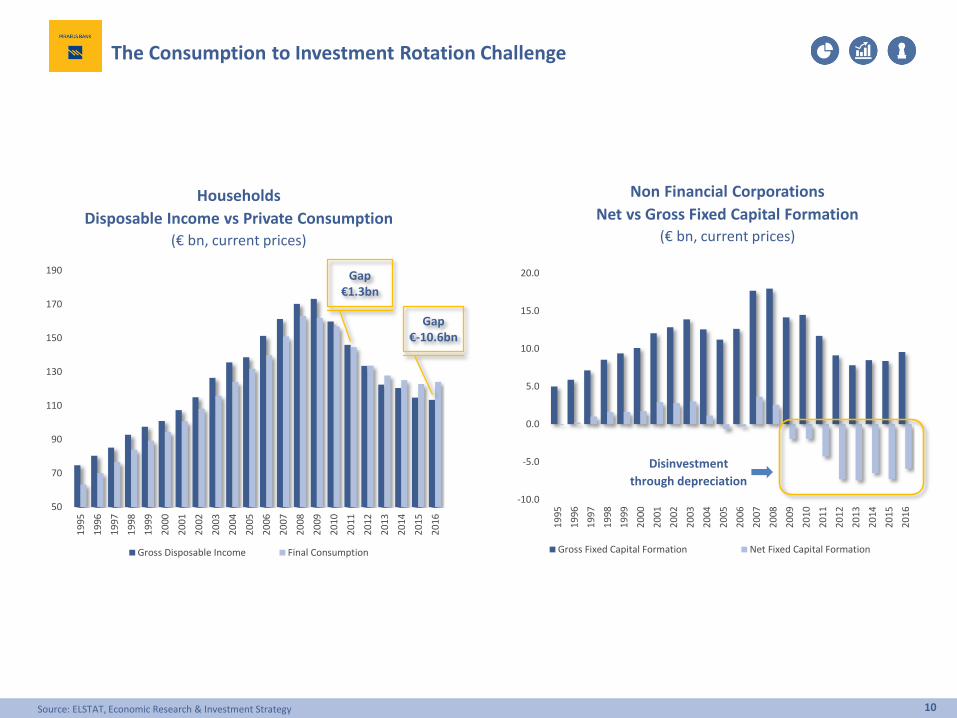
Gross Disposable Income Final Consumption
Gap€1.3bn
Households
Disposable Income vs Private Consumption
(€ bn, current prices)
Non Financial Corporations
Net vs Gross Fixed Capital Formation
(€ bn, current prices)
The Consumption to Investment Rotation Challenge
Gap€-10.6bn
-10.0
-5.0
0.0
5.0
10.0
15.0
20.0
19
95
19
96
19
97
19
98
19
99
20
00
20
01
20
02
20
03
20
04
20
05
20
06
20
07
20
08
20
09
20
10
20
11
20
12
20
13
20
14
20
15
20
16
Gross Fixed Capital Formation Net Fixed Capital Formation
Disinvestment
through depreciation
10Source: ELSTAT, Economic Research & Investment Strategy
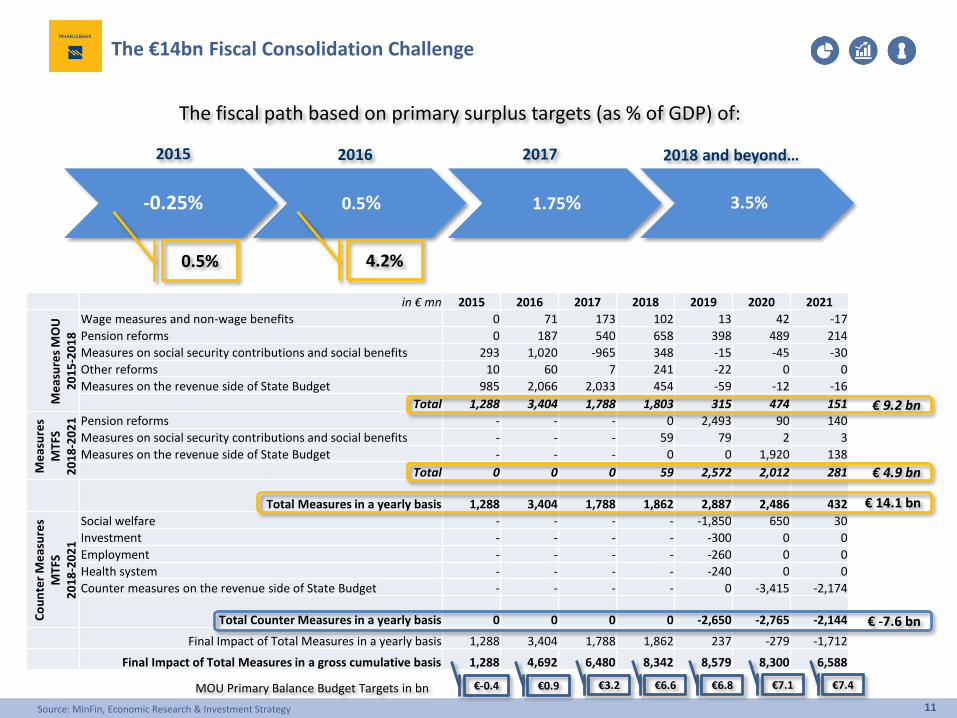
The €14bn Fiscal Consolidation Challenge
in € mn 2015 2016 2017 2018 2019 2020 2021
Me
asu
res
MO
U
20
15
-20
18
Wage measures and non-wage benefits 0 71 173 102 13 42 -17
Pension reforms 0 187 540 658 398 489 214
Measures on social security contributions and social benefits 293 1,020 -965 348 -15 -45 -30
Other reforms 10 60 7 241 -22 0 0
Measures on the revenue side of State Budget 985 2,066 2,033 454 -59 -12 -16
Total 1,288 3,404 1,788 1,803 315 474 151
Me
asu
res
MTF
S2
01
8-2
02
1 Pension reforms - - - 0 2,493 90 140
Measures on social security contributions and social benefits - - - 59 79 2 3
Measures on the revenue side of State Budget - - - 0 0 1,920 138
Total 0 0 0 59 2,572 2,012 281
Total Measures in a yearly basis 1,288 3,404 1,788 1,862 2,887 2,486 432
Co
un
ter
Me
asu
res
MTF
S 2
01
8-2
02
1
Social welfare - - - - -1,850 650 30
Investment - - - - -300 0 0
Employment - - - - -260 0 0
Health system - - - - -240 0 0
Counter measures on the revenue side of State Budget - - - - 0 -3,415 -2,174
Total Counter Measures in a yearly basis 0 0 0 0 -2,650 -2,765 -2,144
Final Impact of Total Measures in a yearly basis 1,288 3,404 1,788 1,862 237 -279 -1,712
Final Impact of Total Measures in a gross cumulative basis 1,288 4,692 6,480 8,342 8,579 8,300 6,588
€ 9.2 bn
€ 4.9 bn
€ 14.1 bn
€ -7.6 bn
€-0.4 €0.9 €3.2 €6.6 €6.8 €7.1 €7.4MOU Primary Balance Budget Targets in bn
-0.25% 0.5% 1.75% 3.5%
2015 2016 2017 2018 and beyond…
0.5%
The fiscal path based on primary surplus targets (as % of GDP) of:
4.2%
11Source: MinFin, Economic Research & Investment Strategy
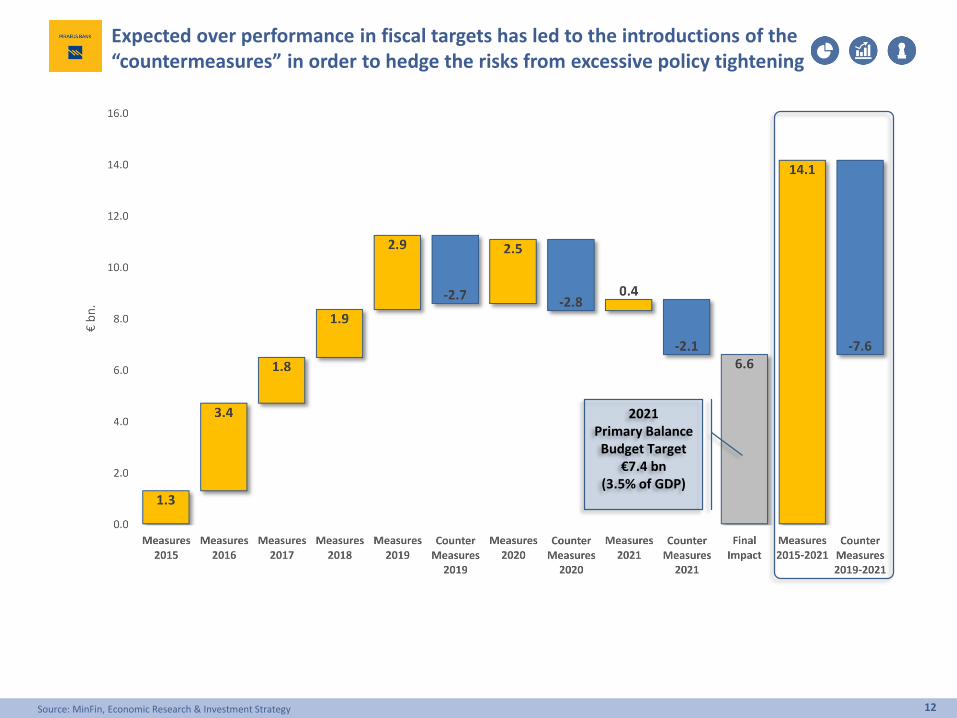
Expected over performance in fiscal targets has led to the introductions of the “countermeasures” in order to hedge the risks from excessive policy tightening
2021Primary Balance Budget Target
€7.4 bn(3.5% of GDP)
12Source: MinFin, Economic Research & Investment Strategy
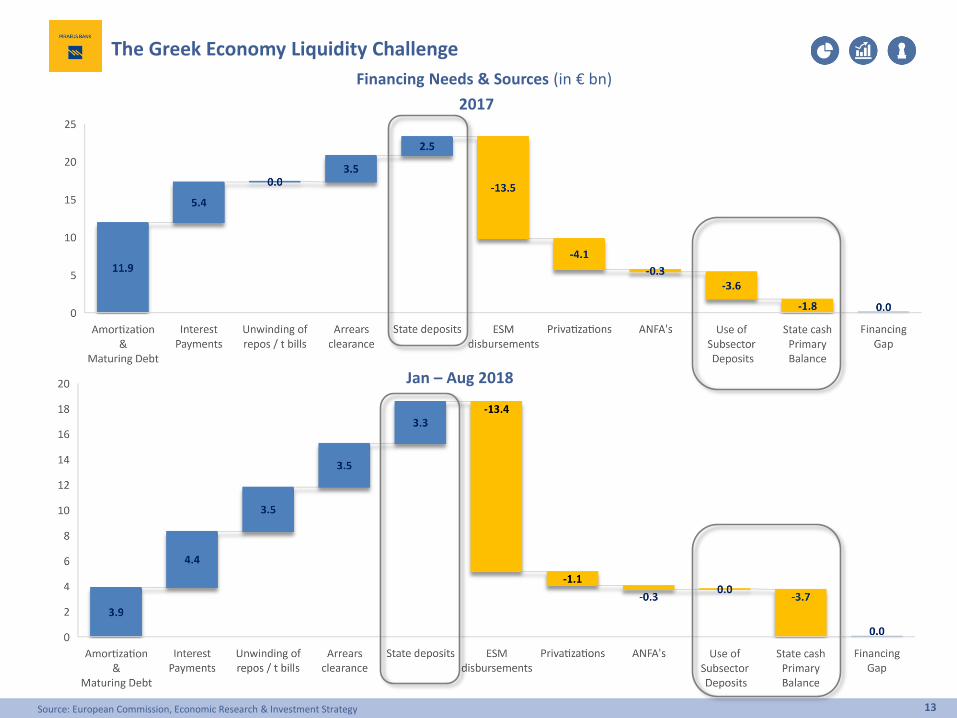
The Greek Economy Liquidity Challenge
2017
Jan – Aug 2018
Financing Needs & Sources (in € bn)
13Source: European Commission, Economic Research & Investment Strategy
Short & Long-Term Perspectives of the Greek Economy
Economic Outlook 2017- 2020, Alternative Scenarios
Three Challenges to our Outlook
Greek SMEs Panorama
Emerging Trends and Opportunities in the New Greek Landscape
14
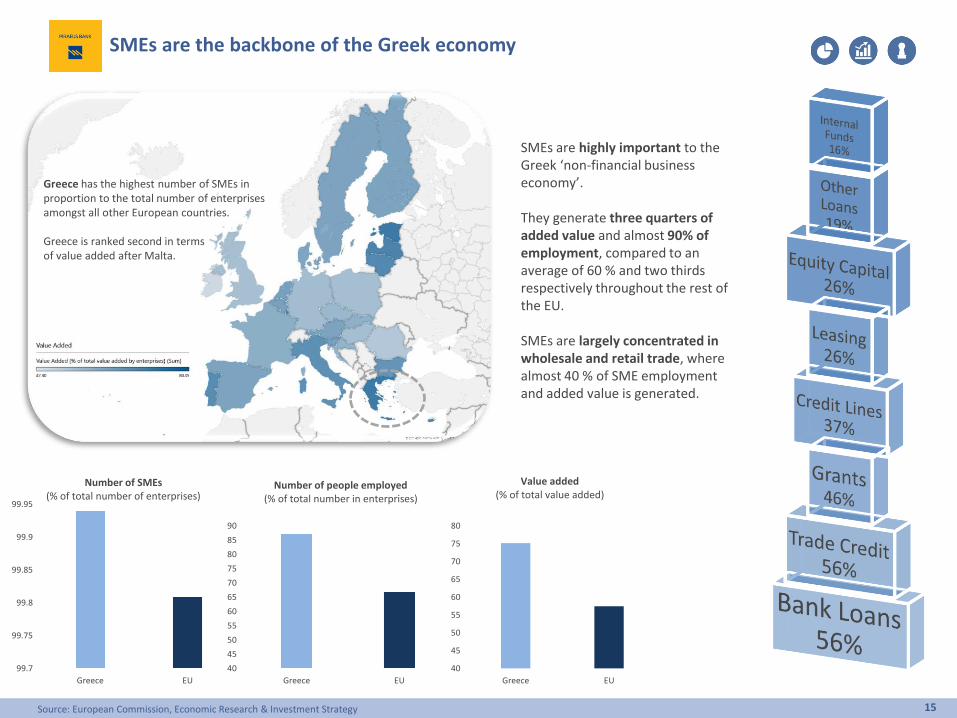
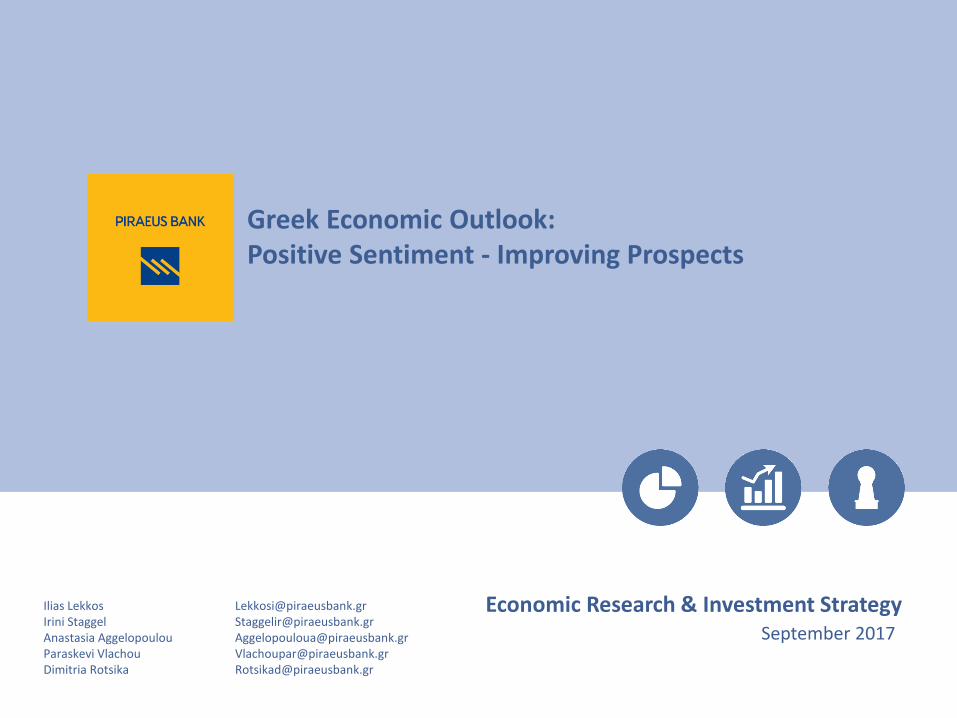
SMEs are the backbone of the Greek economy
15Source: European Commission, Economic Research & Investment Strategy
SMEs are highly important to the Greek ‘non-financial business economy’.
They generate three quarters of added value and almost 90% of employment, compared to an average of 60 % and two thirds respectively throughout the rest of the EU.
SMEs are largely concentrated in wholesale and retail trade, where almost 40 % of SME employment and added value is generated.
Greece has the highest number of SMEs in proportion to the total number of enterprises amongst all other European countries.
Greece is ranked second in terms of value added after Malta.
99.7
99.75
99.8
99.85
99.9
99.95
Greece EU
Number of SMEs (% of total number of enterprises)
40
45
50
55
60
65
70
75
80
85
90
Greece EU
Number of people employed (% of total number in enterprises)
40
45
50
55
60
65
70
75
80
Greece EU
Value added (% of total value added)
*Enterprise Rating System: July 2017 with emphasis on SMEs
Γενική ρευστότητα: 0,7
Άμεση ρευστότητα: 0,4
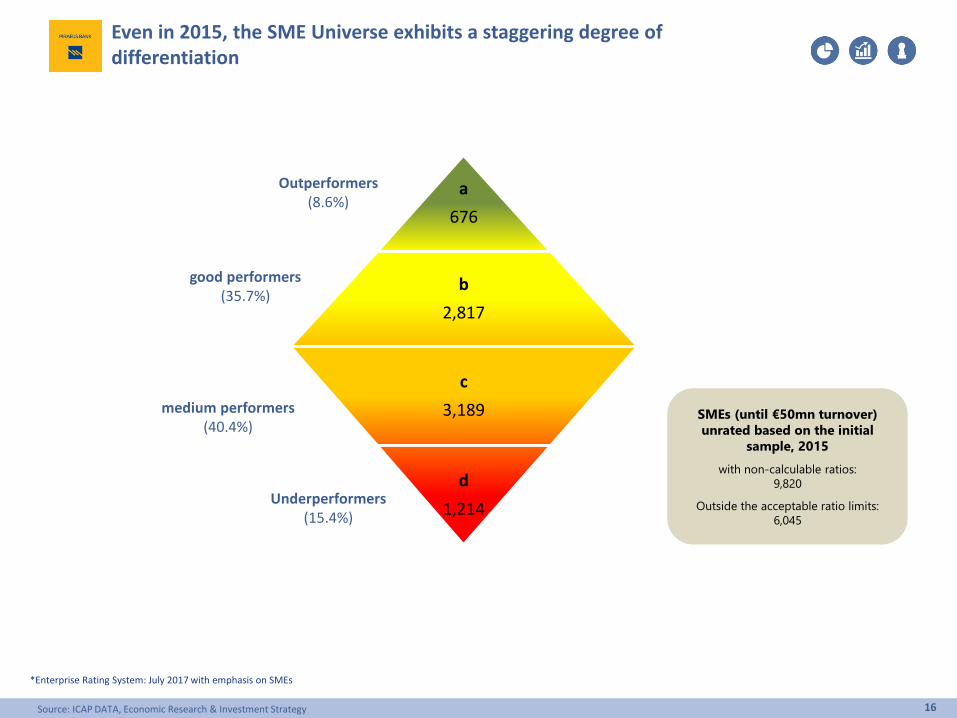
Outperformers(8.6%)
a
676
b
2,817
c
3,189
d
1,214
good performers(35.7%)
medium performers(40.4%)
Underperformers(15.4%)
Even in 2015, the SME Universe exhibits a staggering degree of differentiation
SMEs (until €50mn turnover)
unrated based on the initial
sample, 2015
with non-calculable ratios:
9,820
Outside the acceptable ratio limits:
6,045
16Source: ICAP DATA, Economic Research & Investment Strategy
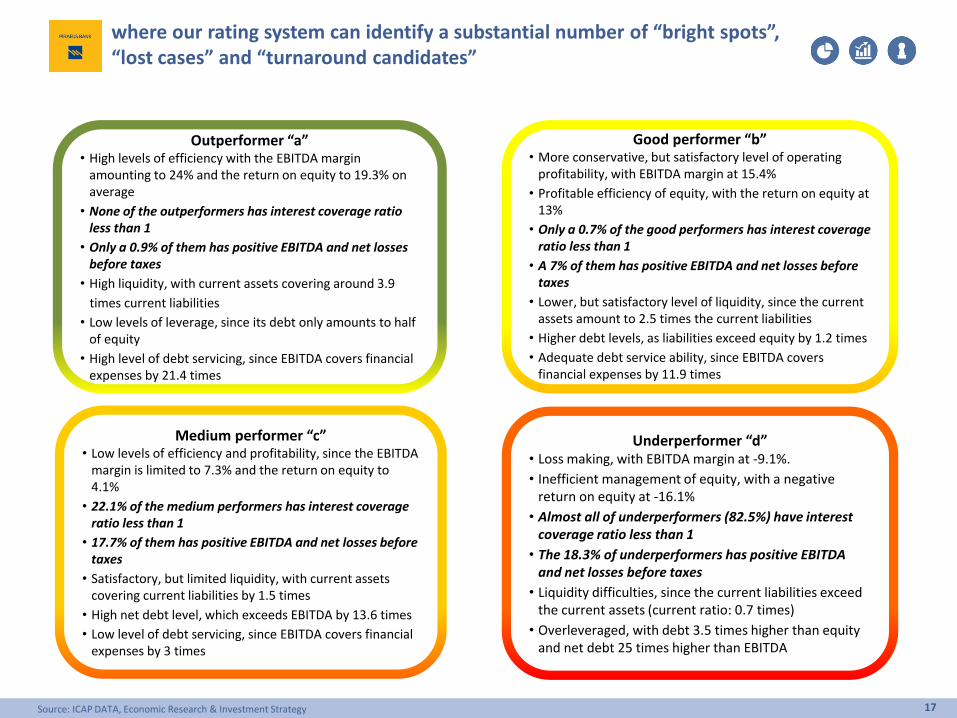
where our rating system can identify a substantial number of “bright spots”, “lost cases” and “turnaround candidates”
Γενική ρευστότητα: 0,7
Άμεση ρευστότητα: 0,4
Outperformer “a”• High levels of efficiency with the EBITDA margin
amounting to 24% and the return on equity to 19.3% on average
• None of the outperformers has interest coverage ratio less than 1
• Only a 0.9% of them has positive EBITDA and net losses before taxes
• High liquidity, with current assets covering around 3.9
times current liabilities
• Low levels of leverage, since its debt only amounts to half of equity
• High level of debt servicing, since EBITDA covers financial expenses by 21.4 times
Good performer “b”• More conservative, but satisfactory level of operating
profitability, with EBITDA margin at 15.4%
• Profitable efficiency of equity, with the return on equity at 13%
• Only a 0.7% of the good performers has interest coverage ratio less than 1
• A 7% of them has positive EBITDA and net losses before taxes
• Lower, but satisfactory level of liquidity, since the current assets amount to 2.5 times the current liabilities
• Higher debt levels, as liabilities exceed equity by 1.2 times
• Adequate debt service ability, since EBITDA covers financial expenses by 11.9 times
Medium performer “c”• Low levels of efficiency and profitability, since the EBITDA
margin is limited to 7.3% and the return on equity to 4.1%
• 22.1% of the medium performers has interest coverage ratio less than 1
• 17.7% of them has positive EBITDA and net losses before taxes
• Satisfactory, but limited liquidity, with current assets covering current liabilities by 1.5 times
• High net debt level, which exceeds EBITDA by 13.6 times
• Low level of debt servicing, since EBITDA covers financial expenses by 3 times
Underperformer “d”• Loss making, with EBITDA margin at -9.1%.
• Inefficient management of equity, with a negative return on equity at -16.1%
• Almost all of underperformers (82.5%) have interest coverage ratio less than 1
• The 18.3% of underperformers has positive EBITDA and net losses before taxes
• Liquidity difficulties, since the current liabilities exceed the current assets (current ratio: 0.7 times)
• Overleveraged, with debt 3.5 times higher than equity and net debt 25 times higher than EBITDA
17Source: ICAP DATA, Economic Research & Investment Strategy
Short & Long-Term Perspectives of the Greek Economy
Alternative Macro Scenarios
Three Challenges to our Outlook
Greek SMEs Panorama
Emerging Trends and Opportunities in the New Greek Landscape
18
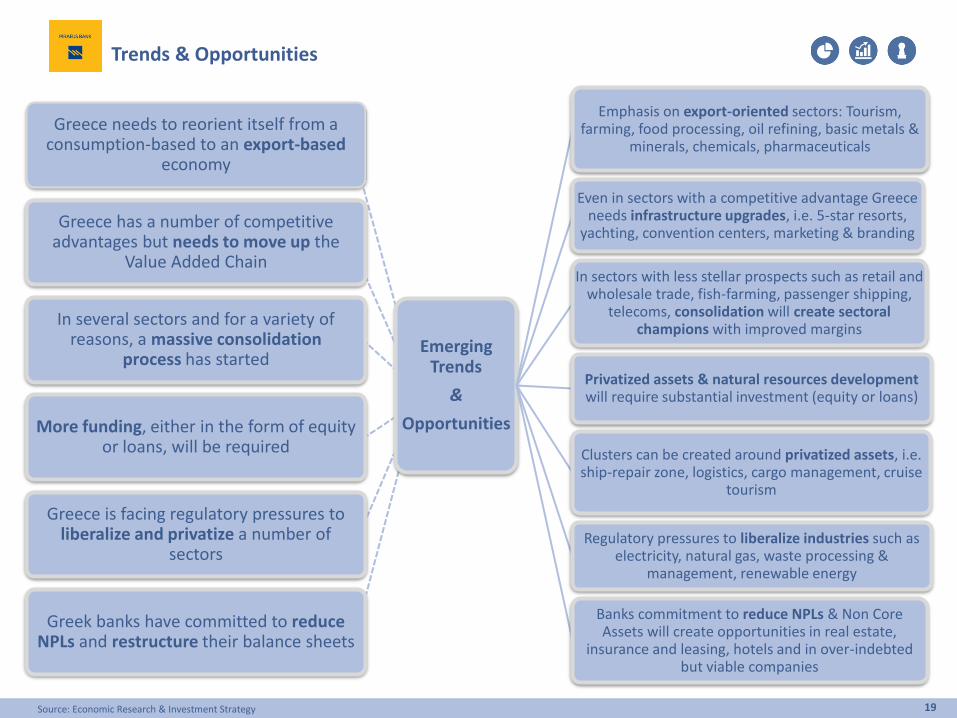
Trends & Opportunities
Emerging Trends
&
Opportunities
Emphasis on export-oriented sectors: Tourism, farming, food processing, oil refining, basic metals &
minerals, chemicals, pharmaceuticals
Even in sectors with a competitive advantage Greece needs infrastructure upgrades, i.e. 5-star resorts,
yachting, convention centers, marketing & branding
In sectors with less stellar prospects such as retail and wholesale trade, fish-farming, passenger shipping,
telecoms, consolidation will create sectoral champions with improved margins
Privatized assets & natural resources development will require substantial investment (equity or loans)
Clusters can be created around privatized assets, i.e. ship-repair zone, logistics, cargo management, cruise
tourism
Regulatory pressures to liberalize industries such as electricity, natural gas, waste processing &
management, renewable energy
Banks commitment to reduce NPLs & Non Core Assets will create opportunities in real estate,
insurance and leasing, hotels and in over-indebted but viable companies
Greece needs to reorient itself from a consumption-based to an export-based
economy
Greece has a number of competitive advantages but needs to move up the
Value Added Chain
In several sectors and for a variety of reasons, a massive consolidation
process has started
More funding, either in the form of equity or loans, will be required
Greece is facing regulatory pressures to liberalize and privatize a number of
sectors
Greek banks have committed to reduce NPLs and restructure their balance sheets
19Source: Economic Research & Investment Strategy
Disclaimer: This document is produced by the Economic Research & Investment Strategy Department of Piraeus Bank (hereinafter “the Bank”), which is supervised by the European Central Bank(ECB), in collaboration with the Bank of Greece and is sent or provided to third parties, without any obligation of its author. This document or any part of it should not be duplicated in any waywithout the prior written consent of its author.
The information or opinions included in this document are addressed to existing or potential clients in a general manner, without taking into account the particular circumstances, the investmentobjectives, the financial ability, the experience and/or knowledge of the potential recipients of this document and, as a result, they do not constitute or should not be considered neither as asolicitation or offer for the conduct of transactions in financial instruments or currencies nor as a recommendation or advice for decision making in relation to those. Taking into account theaforementioned, the recipient of the information contained in this document should proceed with his/her own research, analysis, and confirmation of the information which is included in thisdocument and seek for independent and professional legal, tax and investment advice, before proceeding with any investment decision making.
The information depicted in this document is relied on sources that the Bank considers to be reliable and is provided on an “as is” basis, however, the Bank cannot warrant as to their accuracy andcompleteness. The opinions and estimates herein are related to the trend of the local and international financial markets at the indicated date (prices at closing time) and are subject to changeswithout any prior notice. Notwithstanding the above, the Bank might include in this document investment researches, which have been conducted by third persons. In this case, the Bank does notmodify those researches, but it presents them on an “as is” basis, therefore, no responsibility is assumed in relation to the content of the aforementioned investment researches. The Bank is under noduty to update the information contained in this document. Considering the above, the Bank, the members of its Board of Directors and the relevant persons assume no responsibility for theinformation included in the present document and/or for the outcome of any investment decisions made according to such information.
Piraeus Bank Group is an organization with a significant presence in the Greek market and an increasing one in the international markets providing a wide range of investment services. In the contextof investment services offered by the Bank and/or any other Piraeus Group companies in general, there might be cases whereby conflict of interests may arise in relation to the information providedherein. Reference should be made to the fact that the Bank, the relevant persons and/or other Piraeus Group companies indicatively:a. Are not subject to any prohibition in relation to trading on own account or in the course of providing portfolio management services prior to the publication of this document or the acquisition of
any shares prior to any public offering or the acquisition of any other securities.b. May offer upon remuneration investment banking services to issuers for whom this document may contain information.c. May participate to the issuers’ share capital or acquire other securities issued by the aforementioned issuers or attract other financial interests from them.d. Might provide market making or underwriting services to issuers that might be mentioned in this document.e. Might have published papers the content of which is different or incompatible to the information presented herein.
The Bank as well as the other Piraeus Group's companies have enacted, implement and maintain an effective policy, which prevents circumstances that may give rise to conflicts of interests and thedissemination of any information among the departments (“chinese walls”) and they also constantly comply with the provisions and regulations relevant to inside information and market abuse. Also,the Bank confirms that it doesn’t have any kind of interest or conflict of interest with a) any other legal entity or person that could have participated in the preparation of the present document and b)with any other legal entity or person that couldn’t have participated in the preparation of the present document, but had access to it before its publication.
It is duly stated that: the investments described in the present document include investment risks, among which the risk of losing the entire capital invested. In particular, it is stated that;a. The figures presented herein refer to the past and that the past performance is not a reliable indicator of future performance.b. In case the figures refer to simulated past performance, that past performance is not a reliable indicator of future performance.c. The return on investments might be positively or negatively affected as a result of currency fluctuations, in case the figures are denominated in a foreign currency (other than Euro).d. Any forecasts in relation to future performance, may not be a reliable indicator of future performance.e. The tax treatment of the information as well as transactions pertained in this document, depends on each investor's individual circumstances and may be subject to change in the future. As a
result, the recipient should seek for independent advice in relation to the applicable tax legislation.
The distribution of the present document outside Greece and/or to persons governed by foreign law may be subject to restrictions or prohibitions according to the applicable legislation. Therefore,the recipient of the present should seek for independent advice in relation to the applicable legislation, in order to look into such restrictions and/or prohibitions.
20