Embed Size (px)
Citation preview
GLOBAL VALUE CHAINS AND DEVELOPMENT
1
Gary Gereffi Director, Duke CGGC
Duke University
APSI class on GVCs March 28, 2017
AGENDA
1. Origins of the GVC Framework
2. Clarifying Concepts: GVCs, Governance &
Upgrading
3. GVC Competition for US Market: China vs. Mexico
4. Small Countries and High Tech: Medical Devices
GVC in Costa Rica
WHERE DO GVCS COME FROM?
3

Where does the idea of Value Chains come from?
4
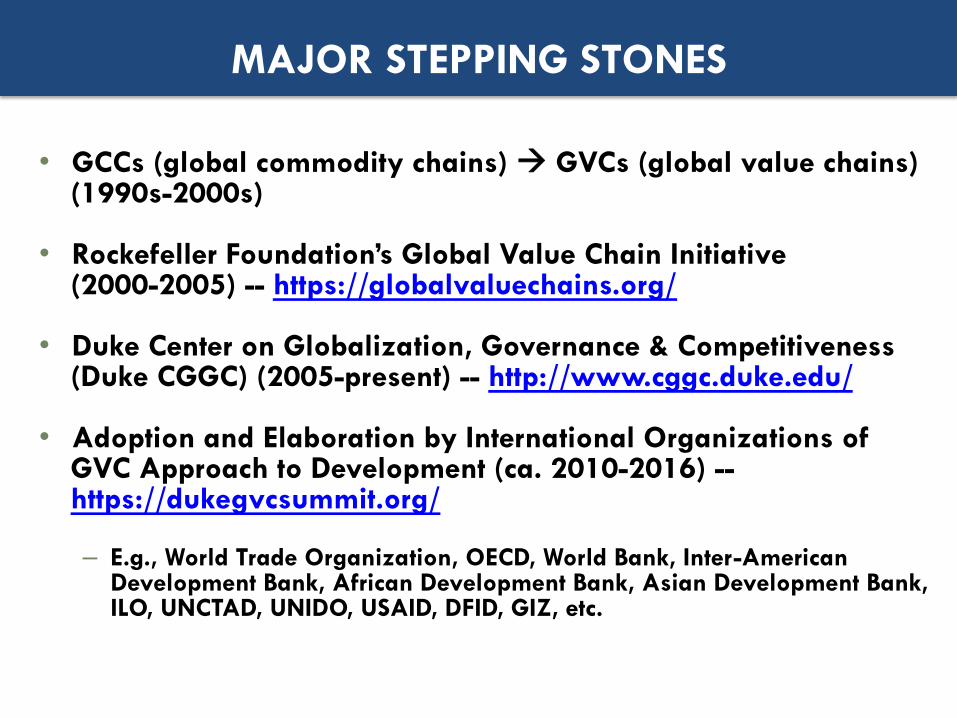
MAJOR STEPPING STONES
• GCCs (global commodity chains) à GVCs (global value chains) (1990s-2000s)
• Rockefeller Foundation’s Global Value Chain Initiative
(2000-2005) -- https://globalvaluechains.org/ • Duke Center on Globalization, Governance & Competitiveness
(Duke CGGC) (2005-present) -- http://www.cggc.duke.edu/
• Adoption and Elaboration by International Organizations of GVC Approach to Development (ca. 2010-2016) -- https://dukegvcsummit.org/
– E.g., World Trade Organization, OECD, World Bank, Inter-American
Development Bank, African Development Bank, Asian Development Bank, ILO, UNCTAD, UNIDO, USAID, DFID, GIZ, etc.
CLARIFYING GVC CONCEPTS
6
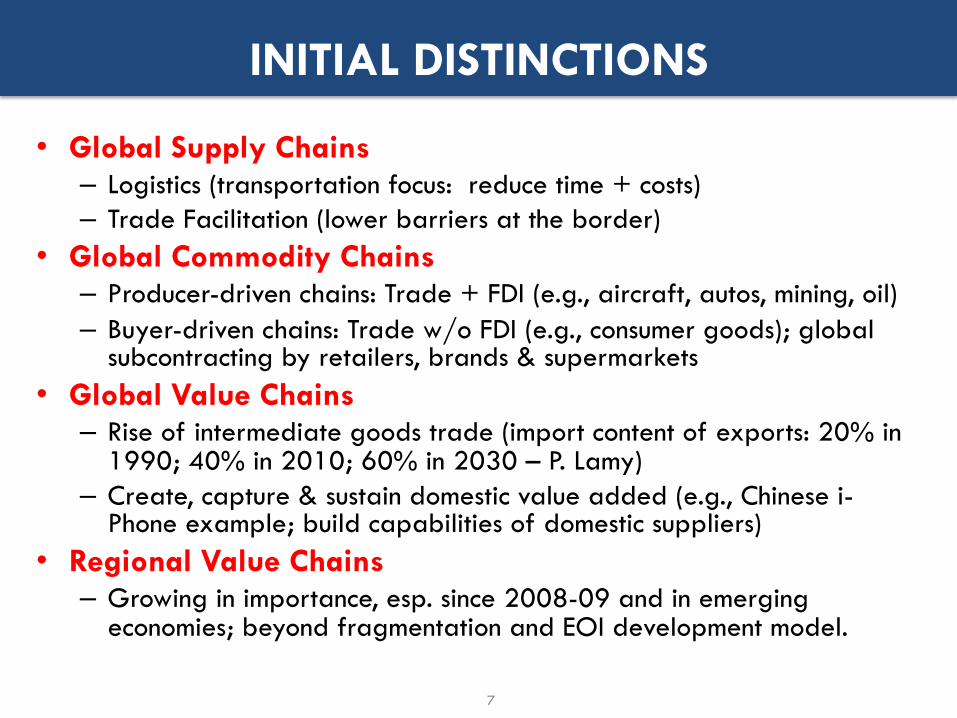
INITIAL DISTINCTIONS
• Global Supply Chains – Logistics (transportation focus: reduce time + costs) – Trade Facilitation (lower barriers at the border)
• Global Commodity Chains – Producer-driven chains: Trade + FDI (e.g., aircraft, autos, mining, oil) – Buyer-driven chains: Trade w/o FDI (e.g., consumer goods); global
subcontracting by retailers, brands & supermarkets • Global Value Chains
– Rise of intermediate goods trade (import content of exports: 20% in 1990; 40% in 2010; 60% in 2030 – P. Lamy)
– Create, capture & sustain domestic value added (e.g., Chinese i-Phone example; build capabilities of domestic suppliers)
• Regional Value Chains – Growing in importance, esp. since 2008-09 and in emerging
economies; beyond fragmentation and EOI development model.
7
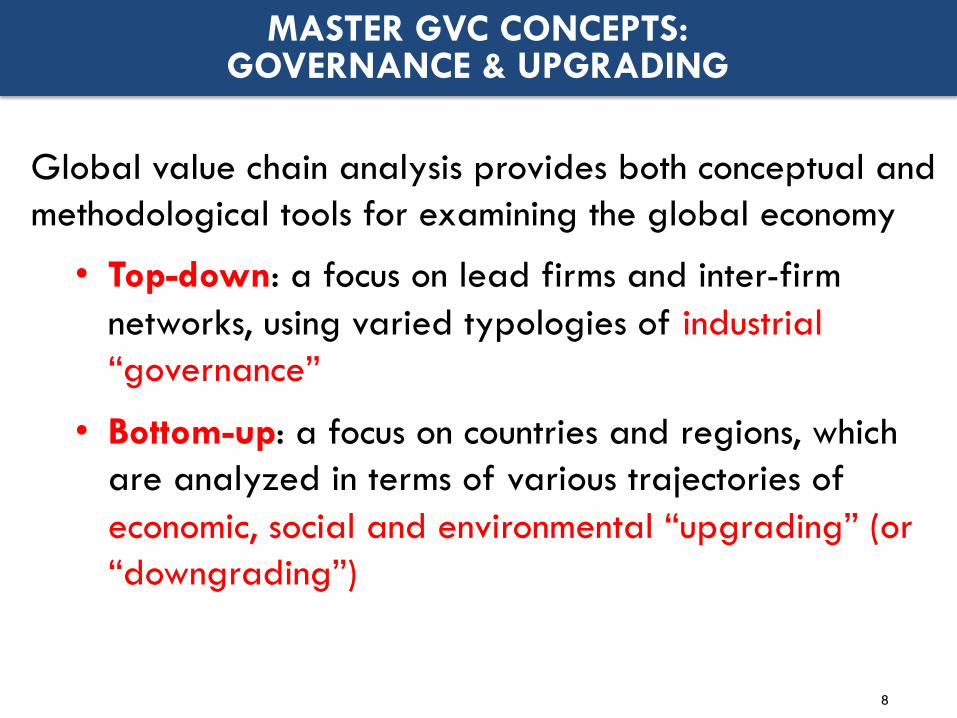
MASTER GVC CONCEPTS: GOVERNANCE & UPGRADING
8
Global value chain analysis provides both conceptual and methodological tools for examining the global economy
• Top-down: a focus on lead firms and inter-firm networks, using varied typologies of industrial “governance”
• Bottom-up: a focus on countries and regions, which are analyzed in terms of various trajectories of economic, social and environmental “upgrading” (or “downgrading”)
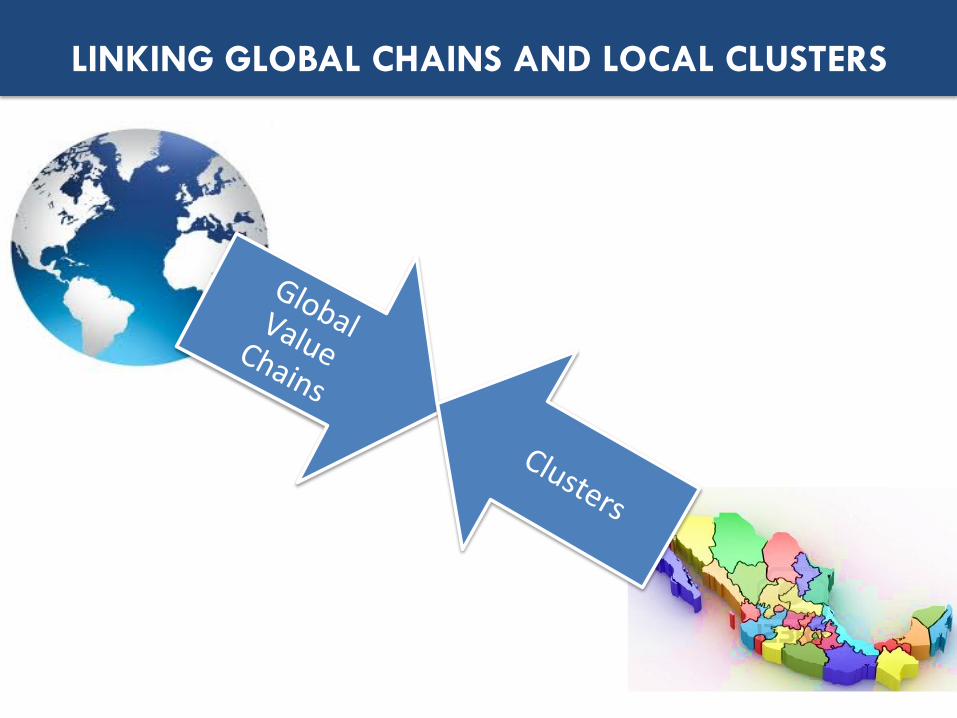
LINKING GLOBAL CHAINS AND LOCAL CLUSTERS
9
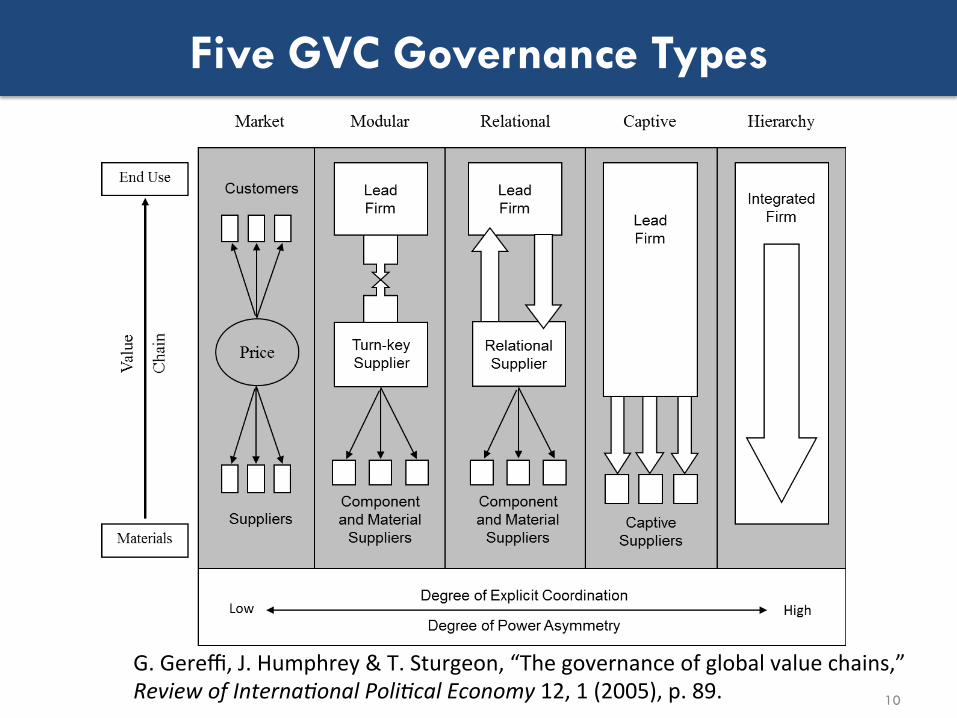
Five GVC Governance Types
10
G.Gereffi,J.Humphrey&T.Sturgeon,“Thegovernanceofglobalvaluechains,”ReviewofInterna.onalPoli.calEconomy12,1(2005),p.89.
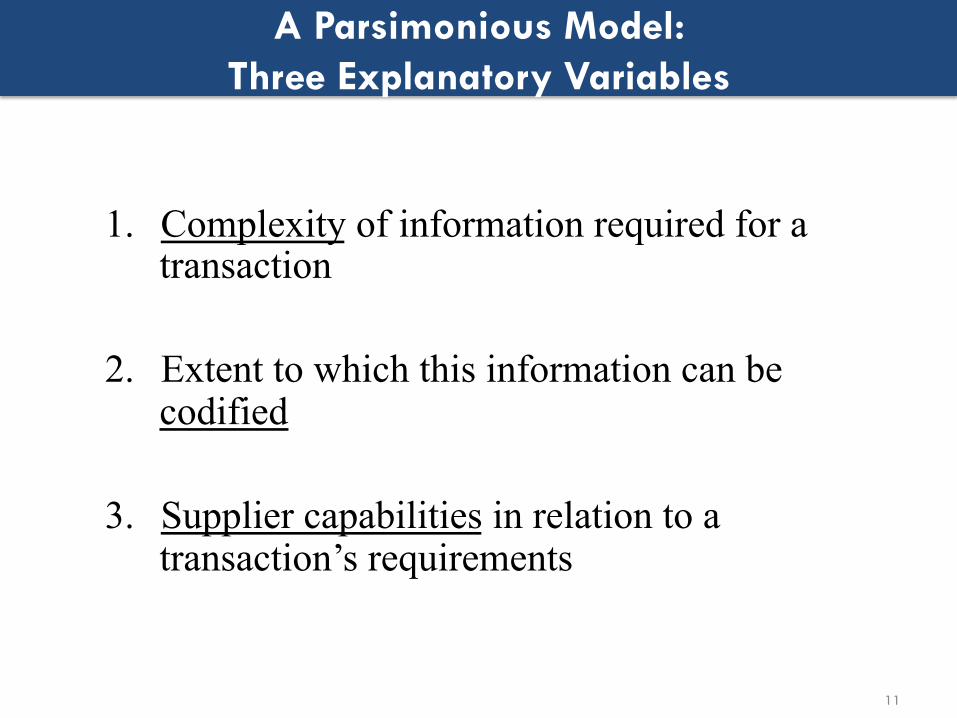
A Parsimonious Model: Three Explanatory Variables
11
1. Complexity of information required for a transaction
2. Extent to which this information can be
codified 3. Supplier capabilities in relation to a
transaction’s requirements
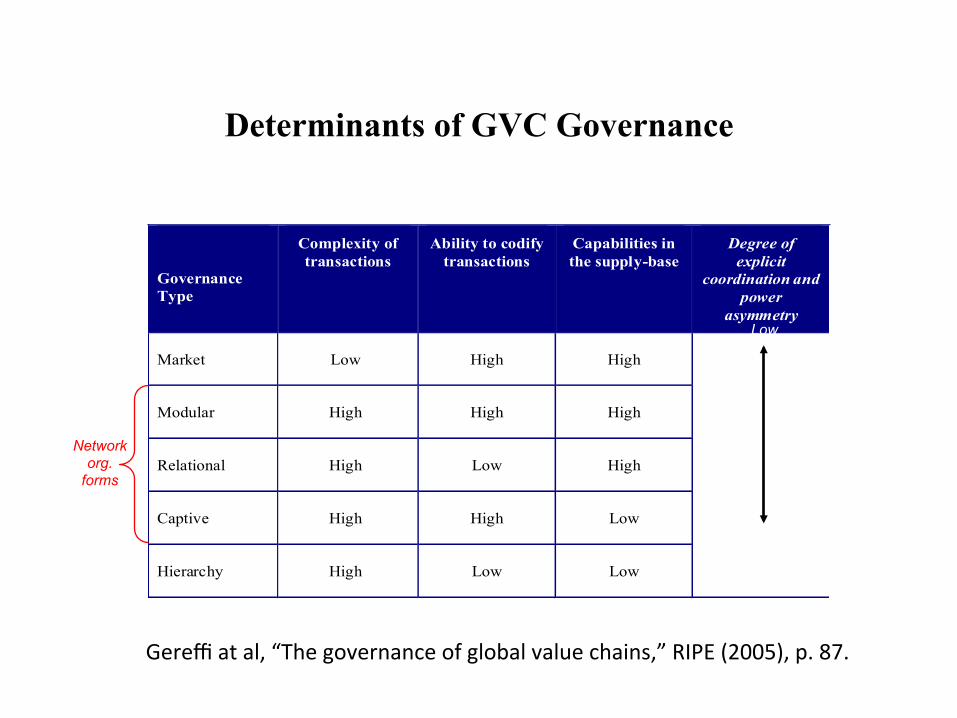
Determinants of GVC Governance
GovernanceType
Complexity oftransactions
Ability to codifytransactions
Capabilities inthe supply-base
Degree ofexplicit
coordination andpower
asymmetry
Market Low High High
Modular High High High
Relational High Low High
Captive High High Low
Hierarchy High Low Low
Low
High
Network org.
forms
Gereffiatal,“Thegovernanceofglobalvaluechains,”RIPE(2005),p.87.
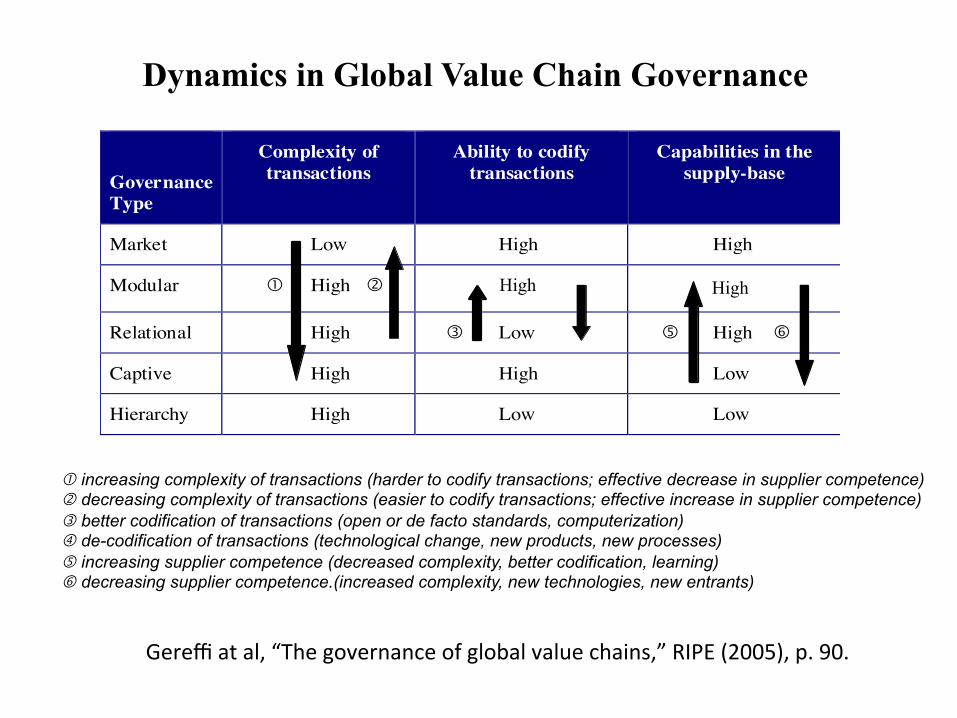
Dynamics in Global Value Chain Governance
GovernanceType
Complexity oftransactions
Ability to codifytransactions
Capabilities in thesupply-base
Market Low High High
Modular � High � High �
High
Relational High � Low � High �
Captive High High Low
Hierarchy High Low Low
� increasing complexity of transactions (harder to codify transactions; effective decrease in supplier competence) � decreasing complexity of transactions (easier to codify transactions; effective increase in supplier competence) � better codification of transactions (open or de facto standards, computerization) � de-codification of transactions (technological change, new products, new processes) � increasing supplier competence (decreased complexity, better codification, learning) � decreasing supplier competence.(increased complexity, new technologies, new entrants)
High High
Gereffiatal,“Thegovernanceofglobalvaluechains,”RIPE(2005),p.90.
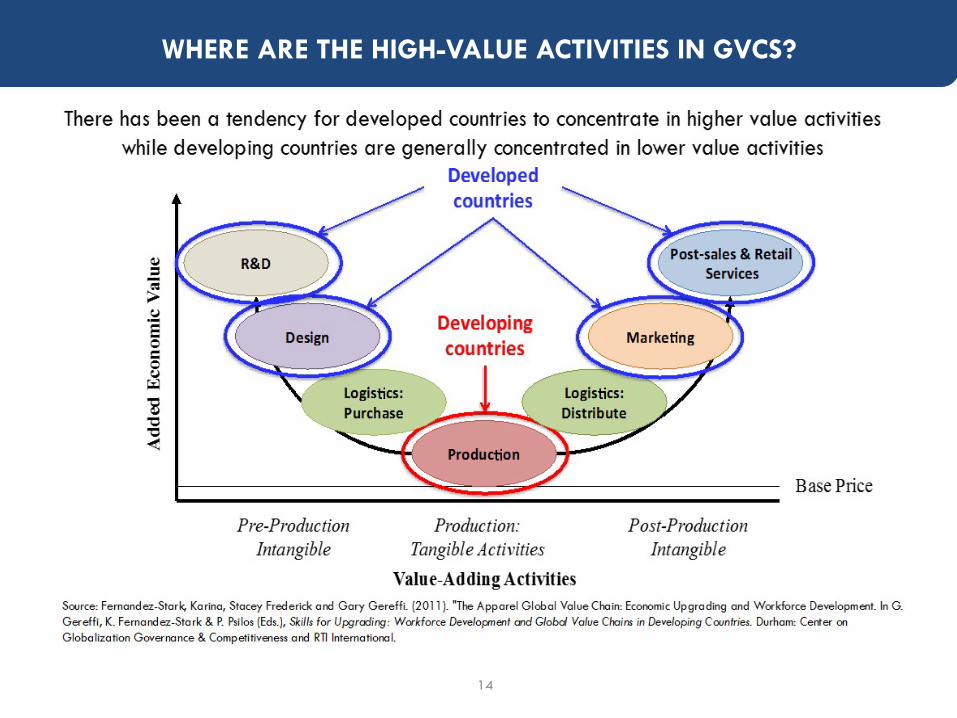
WHERE ARE THE HIGH-VALUE ACTIVITIES IN GVCS?
14
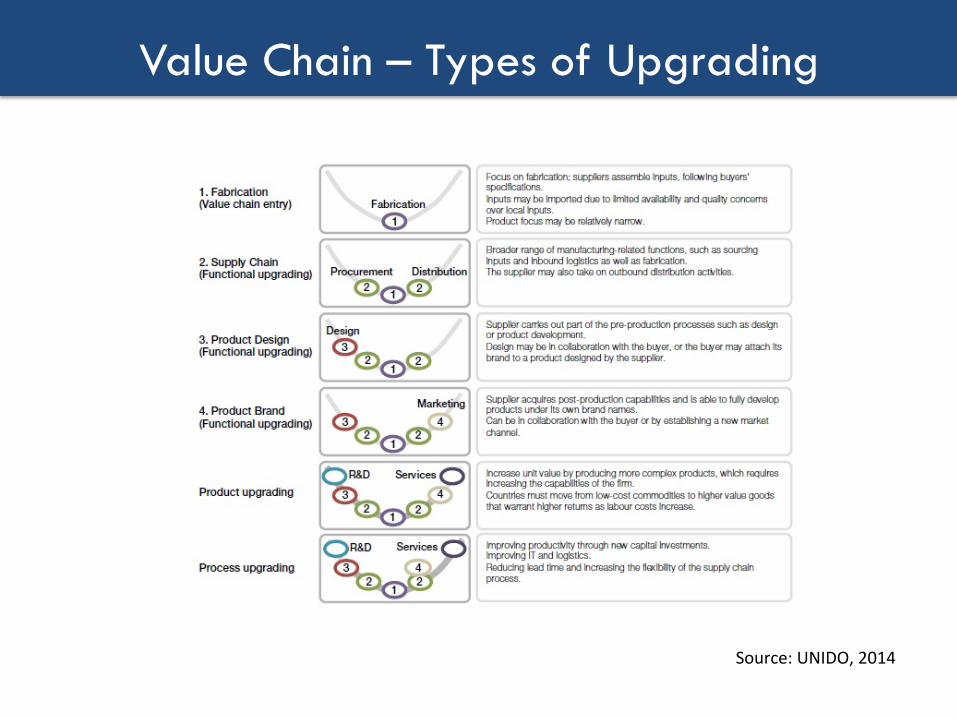
Value Chain – Types of Upgrading
Source:UNIDO,2014
GVC BATTLE FOR THE U.S. MARKET: CHINA VS. MEXICO
16
§ Head-to-headcompeUUoninU.S.market§ Chinaisworld’sleadingexporterofmanymanufactures,esp.consumergoods
§ ChinaandMexicoaretypicallyamongthetopthreeexporterstotheU.S.marketinmanyproductcategories
§ ChinaismovingaheadofMexicowithdominantmarketsharesintheUnitedStates,especiallyin2000-2005period
Mexicovs.China
17
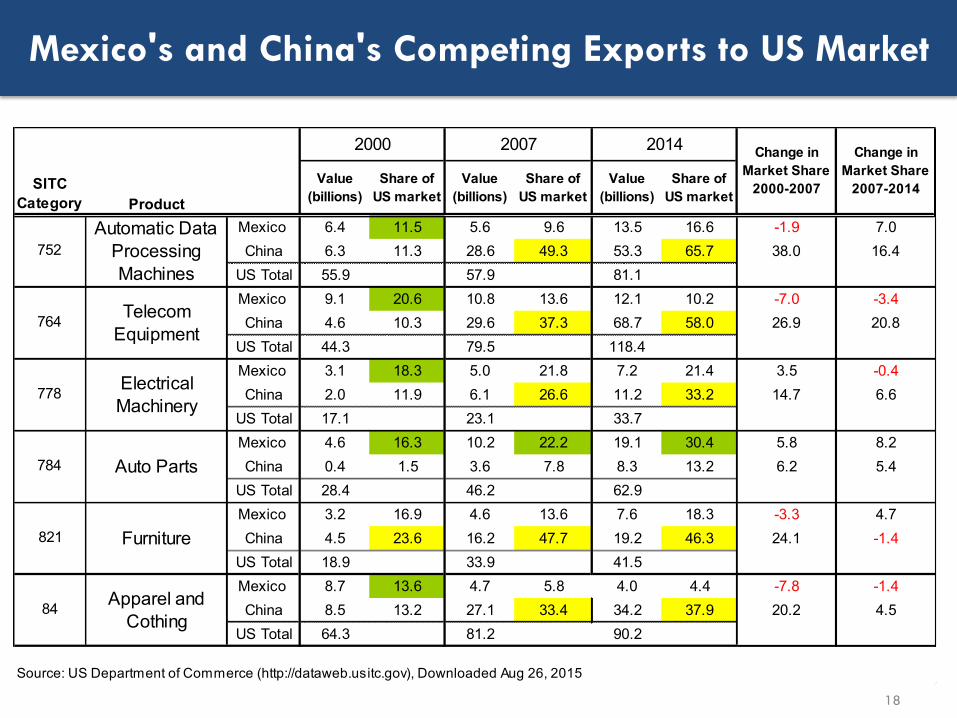
Mexico's and China's Competing Exports to US Market
18
SITC Category Product
Value (billions)
Share of US market
Value (billions)
Share of US market
Value (billions)
Share of US market
Mexico 6.4 11.5 5.6 9.6 13.5 16.6 -1.9 7.0China 6.3 11.3 28.6 49.3 53.3 65.7 38.0 16.4
US Total 55.9 57.9 81.1Mexico 9.1 20.6 10.8 13.6 12.1 10.2 -7.0 -3.4China 4.6 10.3 29.6 37.3 68.7 58.0 26.9 20.8
US Total 44.3 79.5 118.4Mexico 3.1 18.3 5.0 21.8 7.2 21.4 3.5 -0.4China 2.0 11.9 6.1 26.6 11.2 33.2 14.7 6.6
US Total 17.1 23.1 33.7Mexico 4.6 16.3 10.2 22.2 19.1 30.4 5.8 8.2China 0.4 1.5 3.6 7.8 8.3 13.2 6.2 5.4
US Total 28.4 46.2 62.9Mexico 3.2 16.9 4.6 13.6 7.6 18.3 -3.3 4.7China 4.5 23.6 16.2 47.7 19.2 46.3 24.1 -1.4
US Total 18.9 33.9 41.5Mexico 8.7 13.6 4.7 5.8 4.0 4.4 -7.8 -1.4China 8.5 13.2 27.1 33.4 34.2 37.9 20.2 4.5
US Total 64.3 81.2 90.2
Source: US Department of Commerce (http://dataweb.usitc.gov), Downloaded Aug 26, 2015
84 Apparel and Cothing
778 Electrical Machinery
784 Auto Parts
2007
821 Furniture
752Automatic Data
Processing Machines
764 Telecom Equipment
2014 Change in Market Share
2007-2014
Change in Market Share
2000-2007
2000

19 Source: USITC http://dataweb.usitc.gov downloaded Aug 26, 2015
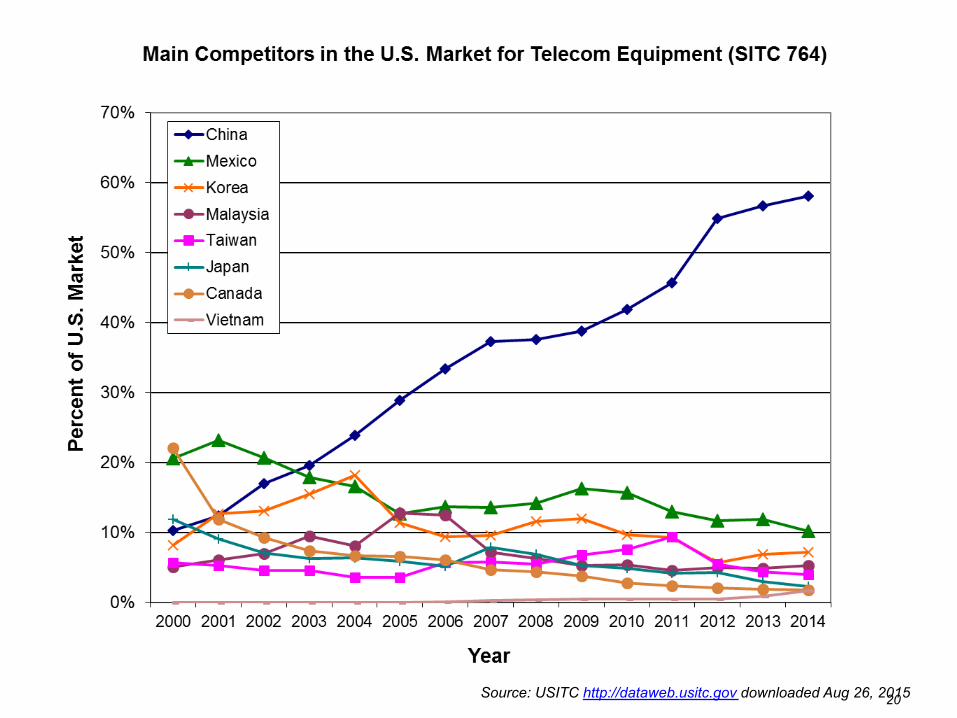
20 Source: USITC http://dataweb.usitc.gov downloaded Aug 26, 2015
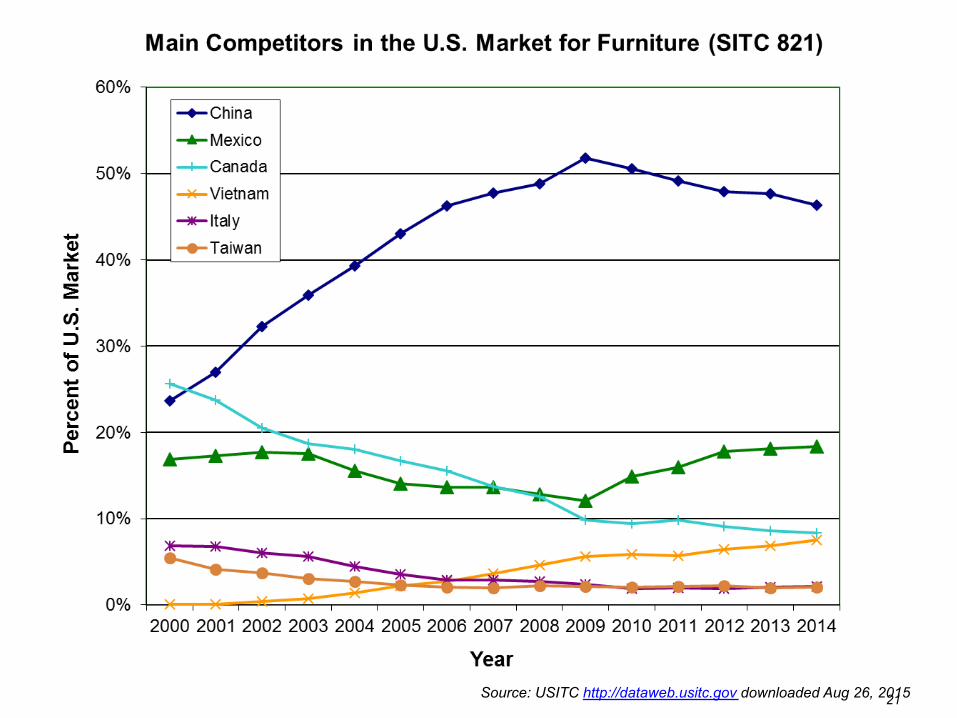
21 Source: USITC http://dataweb.usitc.gov downloaded Aug 26, 2015
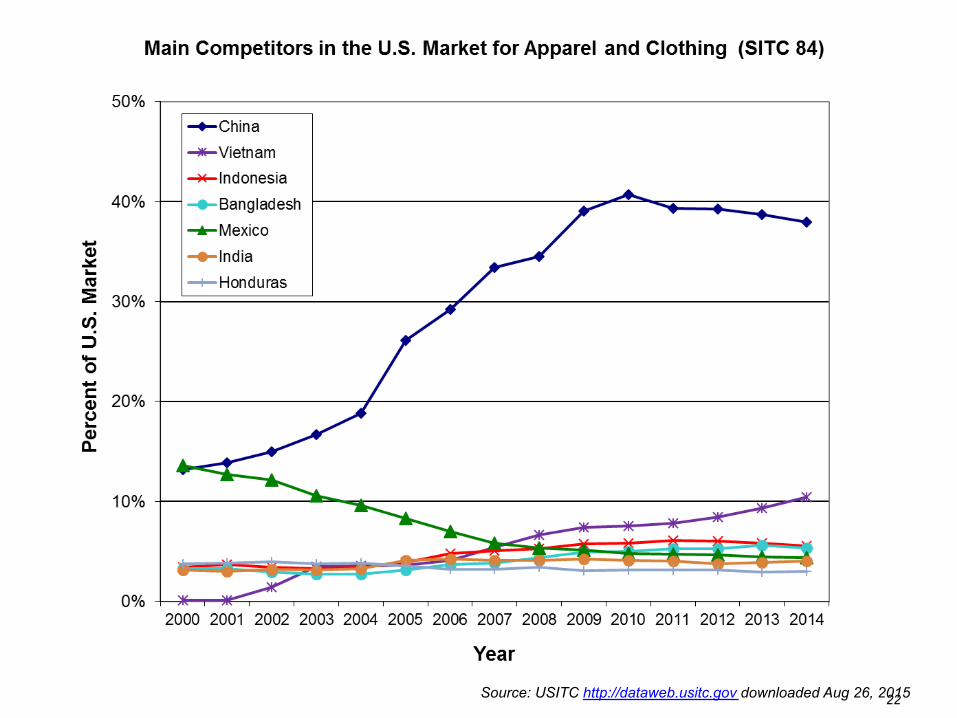
22 Source: USITC http://dataweb.usitc.gov downloaded Aug 26, 2015
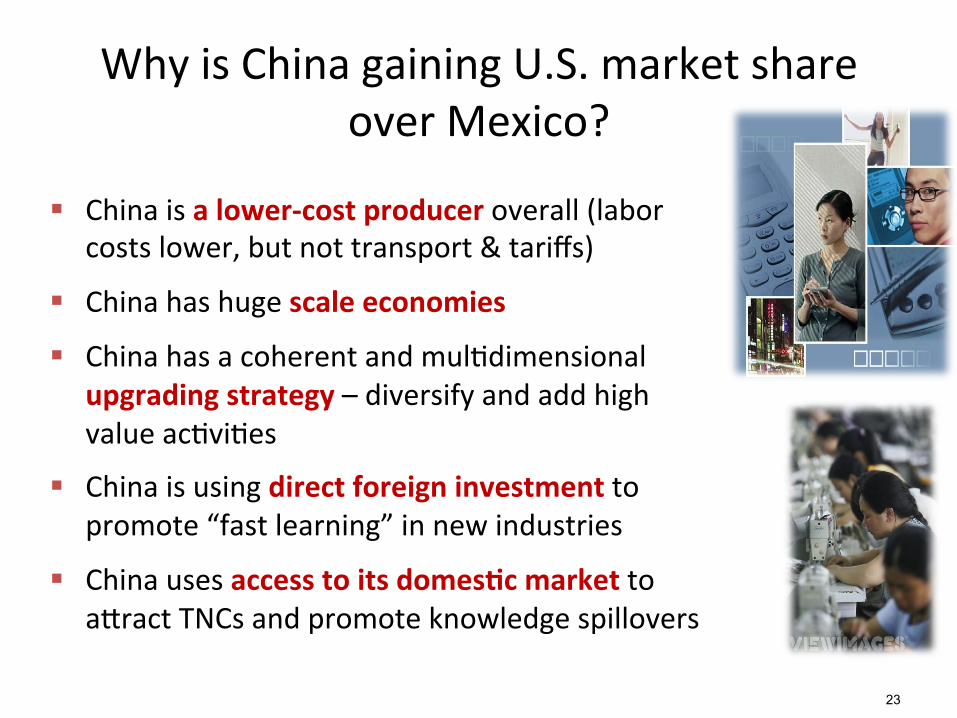
§ Chinaisalower-costproduceroverall(laborcostslower,butnottransport&tariffs)
§ Chinahashugescaleeconomies
§ ChinahasacoherentandmulUdimensionalupgradingstrategy–diversifyandaddhighvalueacUviUes
§ Chinaisusingdirectforeigninvestmenttopromote“fastlearning”innewindustries
§ Chinausesaccesstoitsdomes6cmarkettoa^ractTNCsandpromoteknowledgespillovers
WhyisChinagainingU.S.marketshareoverMexico?
23

China’s Supply Chain Cities in Apparel
Source: David Barboza, “In roaring China, sweaters are west of socks city,” New York Times, Dec. 24, 2004. 24
25
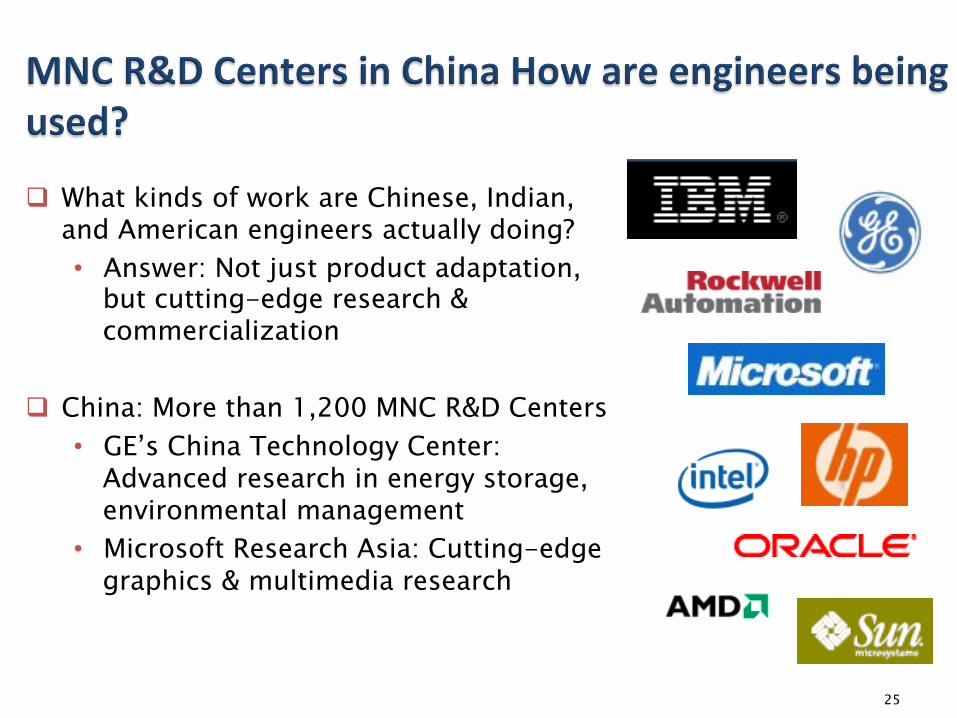
q What kinds of work are Chinese, Indian, and American engineers actually doing? • Answer: Not just product adaptation,
but cutting-edge research & commercialization
q China: More than 1,200 MNC R&D Centers • GE’s China Technology Center:
Advanced research in energy storage, environmental management
• Microsoft Research Asia: Cutting-edge graphics & multimedia research
© 2015 CGGC, Duke University
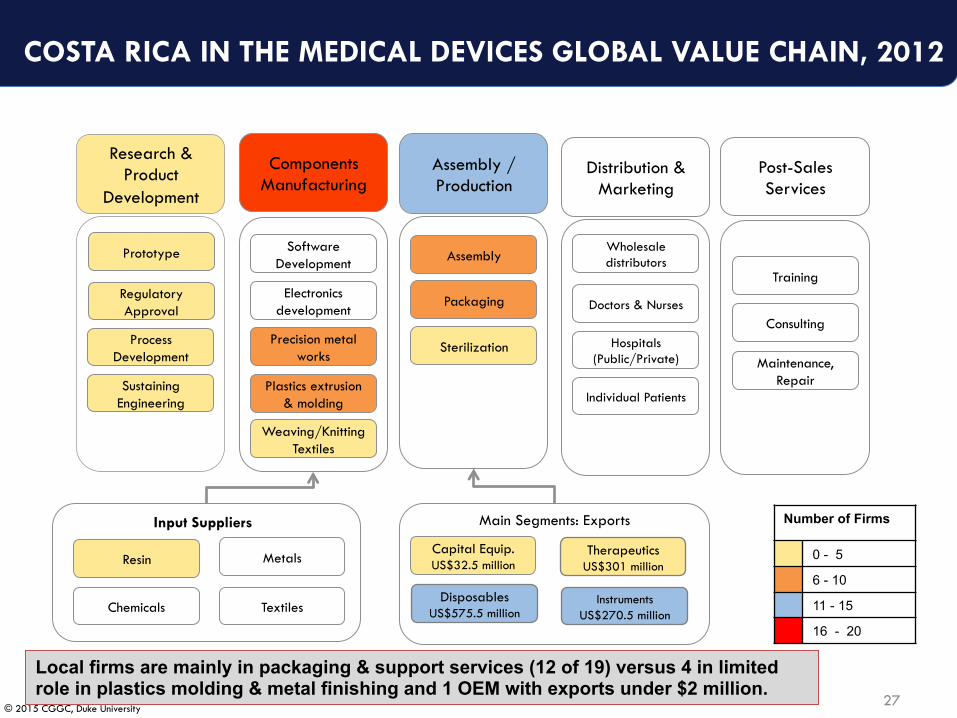
COSTA RICA IN THE MEDICAL DEVICES GVC
26
© 2015 CGGC, Duke University
Components Manufacturing
Plastics extrusion & molding
Precision metal works
Electronics development
Software Development
Weaving/Knitting Textiles
Assembly
Packaging
Sterilization
Assembly / Production
Distribution & Marketing
Resin Metals
Chemicals Textiles
Input Suppliers
Disposables US$575.5 million
Instruments US$270.5 million
Capital Equip. US$32.5 million
Therapeutics US$301 million
Main Segments: Exports
Post-Sales Services
Consulting
Maintenance, Repair
Training
Research & Product
Development
Regulatory Approval
Process Development
Sustaining Engineering
Prototype
Local firms are mainly in packaging & support services (12 of 19) versus 4 in limited role in plastics molding & metal finishing and 1 OEM with exports under $2 million.
Number of Firms
0 - 5
6 - 10
11 - 15
16 - 20
COSTA RICA IN THE MEDICAL DEVICES GLOBAL VALUE CHAIN, 2012
Wholesale distributors
Individual Patients
Doctors & Nurses
Hospitals (Public/Private)
27
© 2015 CGGC, Duke University
0
200
400
600
800
1,000
1,200 19
98
1999
2000
2001
2002
2003
2004
2005
2006
2007
2008
2009
2010
2011
Expo
rt V
alue
s ($
US
Mili
on)
Year
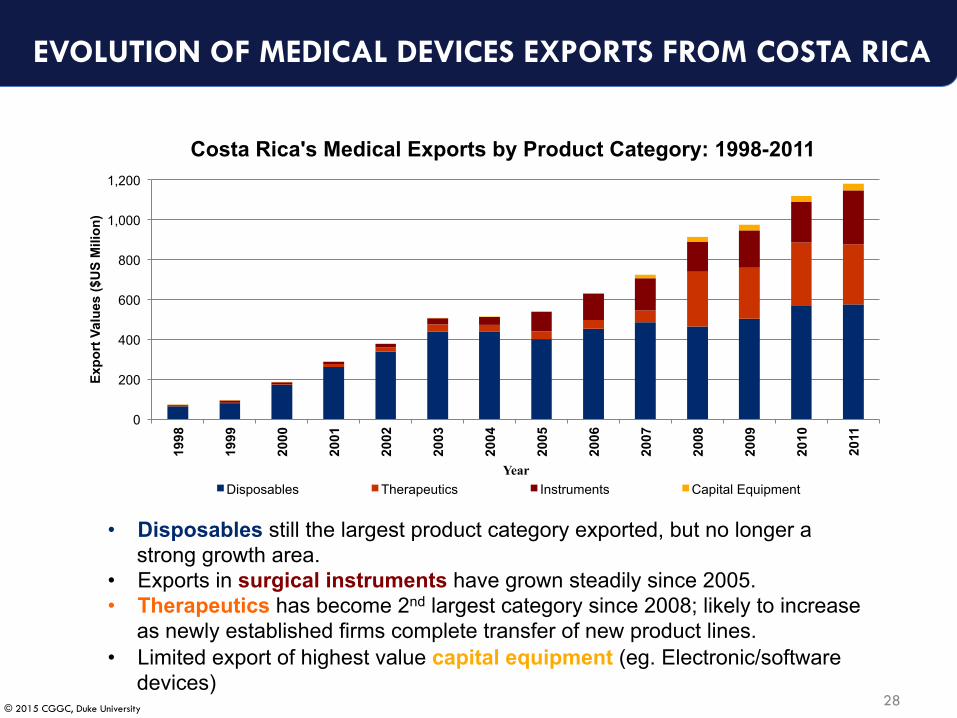
Costa Rica's Medical Exports by Product Category: 1998-2011
Disposables Therapeutics Instruments Capital Equipment
EVOLUTION OF MEDICAL DEVICES EXPORTS FROM COSTA RICA
• Disposables still the largest product category exported, but no longer a strong growth area.
• Exports in surgical instruments have grown steadily since 2005. • Therapeutics has become 2nd largest category since 2008; likely to increase
as newly established firms complete transfer of new product lines. • Limited export of highest value capital equipment (eg. Electronic/software
devices) 28
© 2015 CGGC, Duke University
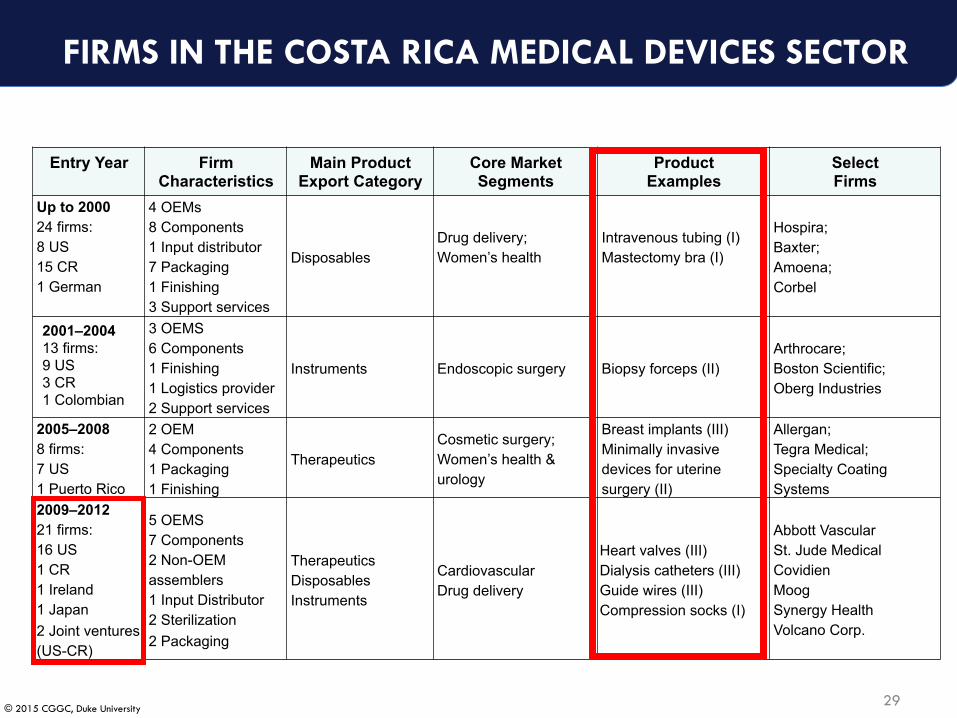
Entry Year Firm Characteristics
Main Product Export Category
Core Market Segments
Product Examples
Select Firms
Up to 2000 24 firms: 8 US 15 CR 1 German
4 OEMs 8 Components 1 Input distributor 7 Packaging 1 Finishing 3 Support services
Disposables Drug delivery; Women’s health
Intravenous tubing (I) Mastectomy bra (I)
Hospira; Baxter; Amoena; Corbel
2001–2004 13 firms: 9 US 3 CR 1 Colombian
3 OEMS 6 Components 1 Finishing 1 Logistics provider 2 Support services
Instruments Endoscopic surgery Biopsy forceps (II) Arthrocare; Boston Scientific; Oberg Industries
2005–2008 8 firms: 7 US 1 Puerto Rico
2 OEM 4 Components 1 Packaging 1 Finishing
Therapeutics Cosmetic surgery; Women’s health & urology
Breast implants (III) Minimally invasive devices for uterine surgery (II)
Allergan; Tegra Medical; Specialty Coating Systems
2009–2012 21 firms: 16 US 1 CR 1 Ireland 1 Japan 2 Joint ventures (US-CR)
5 OEMS 7 Components 2 Non-OEM assemblers 1 Input Distributor 2 Sterilization 2 Packaging
Therapeutics Disposables Instruments
Cardiovascular Drug delivery
Heart valves (III) Dialysis catheters (III) Guide wires (III) Compression socks (I)
Abbott Vascular St. Jude Medical Covidien Moog Synergy Health Volcano Corp.
FIRMS IN THE COSTA RICA MEDICAL DEVICES SECTOR
29
© 2015 CGGC, Duke University © 2015 CGGC, Duke University
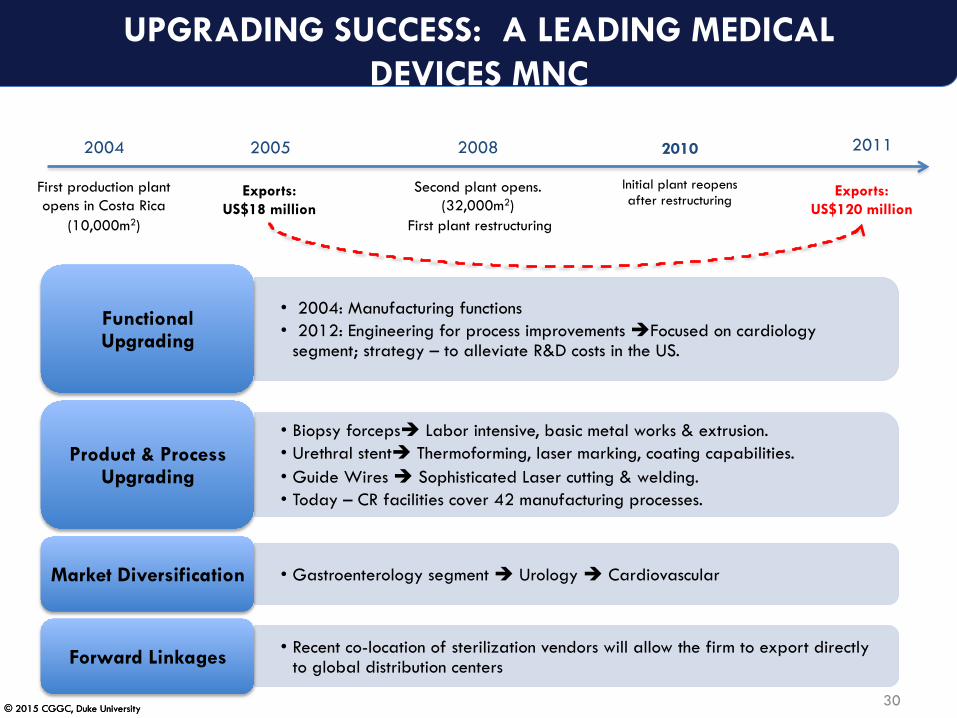
UPGRADING SUCCESS: A LEADING MEDICAL DEVICES MNC
2010
Initial plant reopens after restructuring
• 2004: Manufacturing functions • 2012: Engineering for process improvements èFocused on cardiology
segment; strategy – to alleviate R&D costs in the US.
Functional Upgrading
• Biopsy forcepsè Labor intensive, basic metal works & extrusion. • Urethral stentè Thermoforming, laser marking, coating capabilities. • Guide Wires è Sophisticated Laser cutting & welding. • Today – CR facilities cover 42 manufacturing processes.
Product & Process Upgrading
• Gastroenterology segment è Urology è Cardiovascular Market Diversification
• Recent co-location of sterilization vendors will allow the firm to export directly to global distribution centers Forward Linkages
2004
First production plant opens in Costa Rica
(10,000m2)
2008
Second plant opens. (32,000m2)
First plant restructuring
2005 2011
Exports: US$18 million
Exports: US$120 million
30
© 2015 CGGC, Duke University
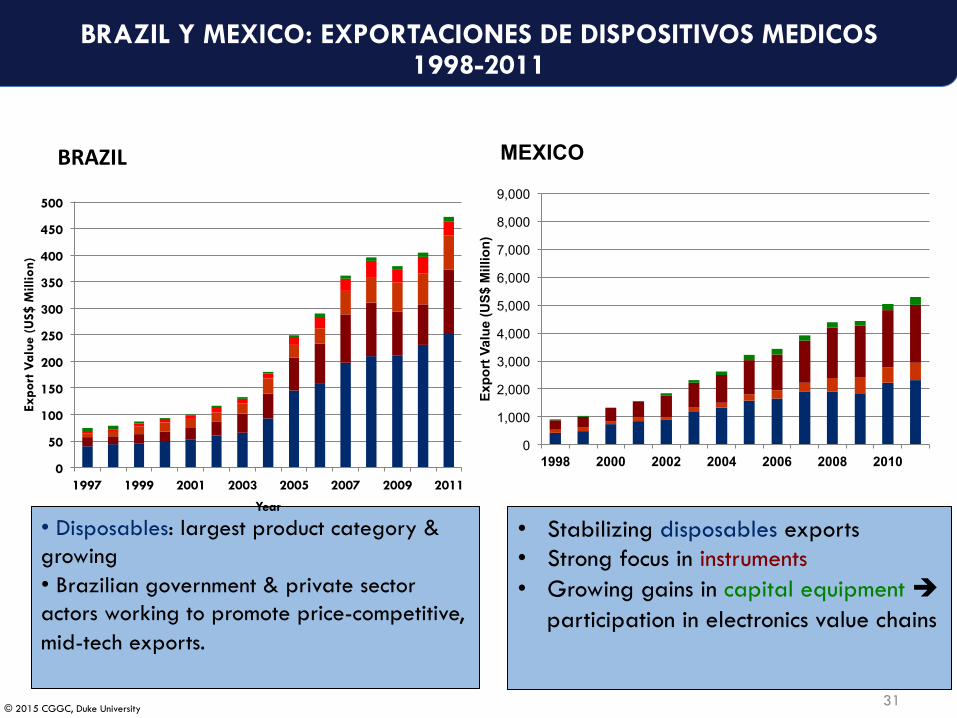
BRAZIL Y MEXICO: EXPORTACIONES DE DISPOSITIVOS MEDICOS 1998-2011
0
1,000
2,000
3,000
4,000
5,000
6,000
7,000
8,000
9,000
1998 2000 2002 2004 2006 2008 2010
Expo
rt V
alue
(US$
Mill
ion)
MEXICO
• Disposables: largest product category & growing • Brazilian government & private sector actors working to promote price-competitive, mid-tech exports.
• Stabilizing disposables exports • Strong focus in instruments • Growing gains in capital equipment è
participation in electronics value chains
0
50
100
150
200
250
300
350
400
450
500
1997 1999 2001 2003 2005 2007 2009 2011
Expo
rt V
alue
(U
S$ M
illio
n)
Year
BRAZIL
31
© 2015 CGGC, Duke University
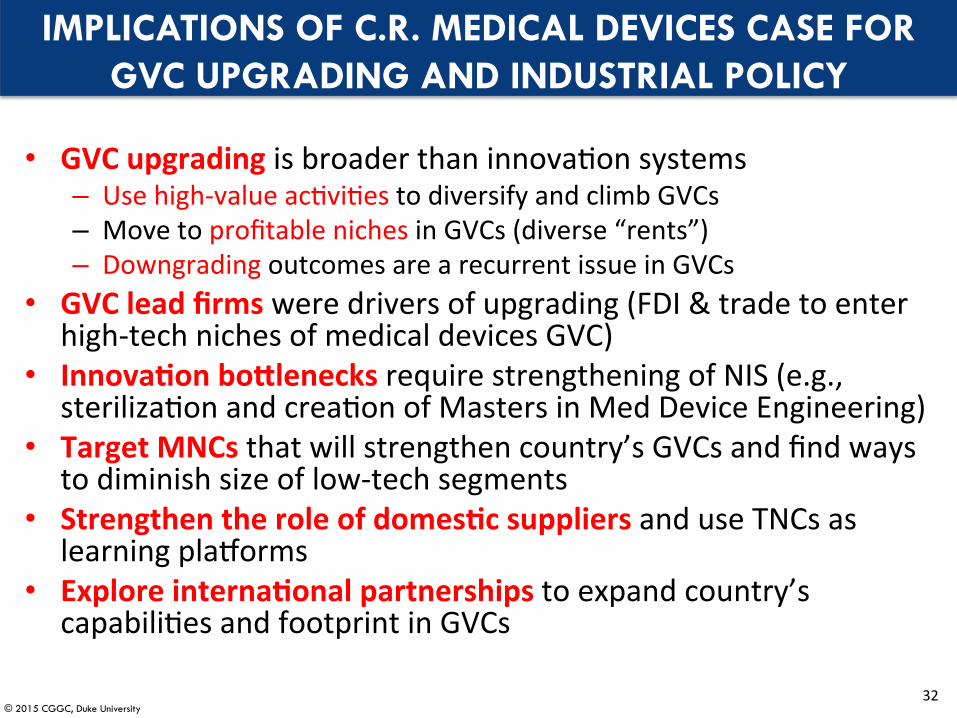
IMPLICATIONS OF C.R. MEDICAL DEVICES CASE FOR GVC UPGRADING AND INDUSTRIAL POLICY
• GVCupgradingisbroaderthaninnovaUonsystems– Usehigh-valueacUviUestodiversifyandclimbGVCs– MovetoprofitablenichesinGVCs(diverse“rents”)– DowngradingoutcomesarearecurrentissueinGVCs
• GVCleadfirmsweredriversofupgrading(FDI&tradetoenterhigh-technichesofmedicaldevicesGVC)
• Innova6onboClenecksrequirestrengtheningofNIS(e.g.,sterilizaUonandcreaUonofMastersinMedDeviceEngineering)
• TargetMNCsthatwillstrengthencountry’sGVCsandfindwaystodiminishsizeoflow-techsegments
• Strengthentheroleofdomes6csuppliersanduseTNCsaslearningplaforms
• Exploreinterna6onalpartnershipstoexpandcountry’scapabiliUesandfootprintinGVCs
32
NEWTRENDSINGVCs&THEROLEOFEMERGINGECONOMIES
34
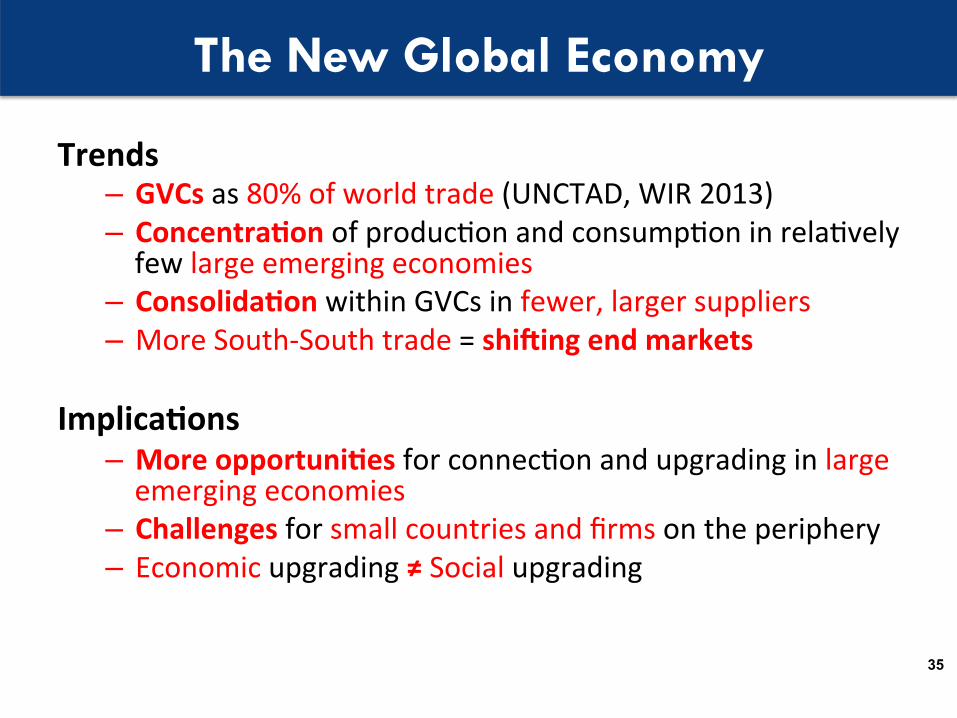
The New Global Economy
Trends– GVCsas80%ofworldtrade(UNCTAD,WIR2013)– Concentra6onofproducUonandconsumpUoninrelaUvelyfewlargeemergingeconomies
– Consolida6onwithinGVCsinfewer,largersuppliers– MoreSouth-Southtrade=shiQingendmarkets
Implica6ons– Moreopportuni6esforconnecUonandupgradinginlargeemergingeconomies
– Challengesforsmallcountriesandfirmsontheperiphery– Economicupgrading≠Socialupgrading
35
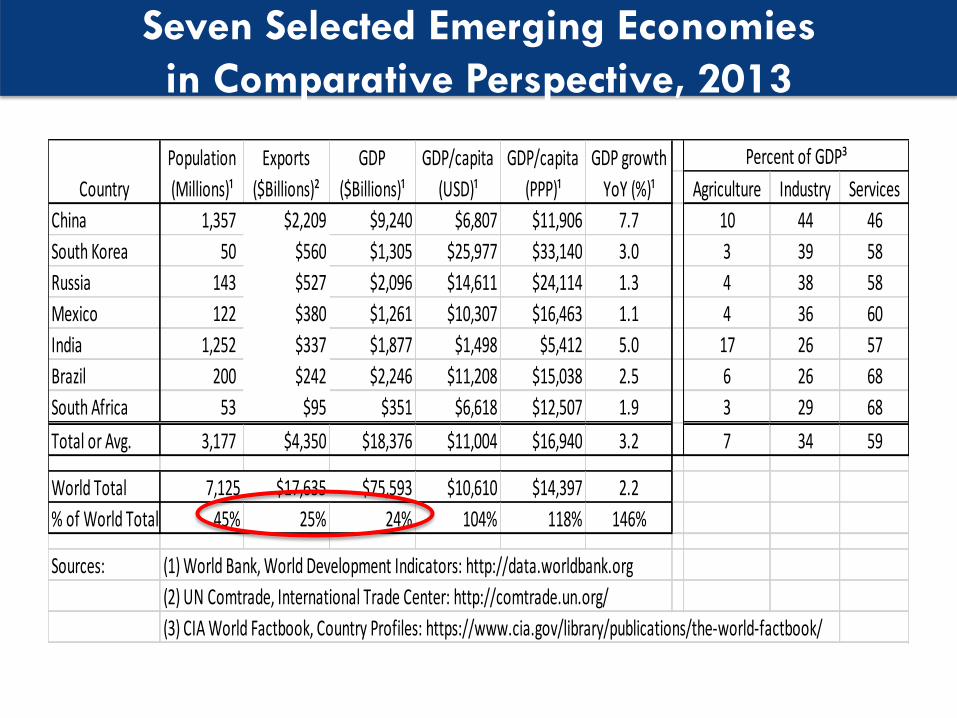
Seven Selected Emerging Economies in Comparative Perspective, 2013
Agriculture Industry ServicesChina 1,357 $2,209 $9,240 $6,807 $11,906 7.7 10 44 46SouthKorea 50 $560 $1,305 $25,977 $33,140 3.0 3 39 58Russia 143 $527 $2,096 $14,611 $24,114 1.3 4 38 58Mexico 122 $380 $1,261 $10,307 $16,463 1.1 4 36 60India 1,252 $337 $1,877 $1,498 $5,412 5.0 17 26 57Brazil 200 $242 $2,246 $11,208 $15,038 2.5 6 26 68SouthAfrica 53 $95 $351 $6,618 $12,507 1.9 3 29 68TotalorAvg. 3,177 $4,350 $18,376 $11,004 $16,940 3.2 7 34 59
WorldTotal 7,125 $17,635 $75,593 $10,610 $14,397 2.2%ofWorldTotal 45% 25% 24% 104% 118% 146%
Sources: (1)WorldBank,WorldDevelopmentIndicators:http://data.worldbank.org(2)UNComtrade,InternationalTradeCenter:http://comtrade.un.org/(3)CIAWorldFactbook,CountryProfiles:https://www.cia.gov/library/publications/the-world-factbook/
Exports($Billions)²
Population(Millions)¹Country
PercentofGDP³GDPgrowthYoY(%)¹
GDP/capita(PPP)¹
GDP/capita(USD)¹
GDP($Billions)¹

Emerging Economy Export Profiles (Percentages of total exports: 2013)
PrimaryProducts
ResourceBased
Low-TechMedium-Tech High-Tech
PrimaryProducts
ResourceBased
Low-TechMedium-Tech High-Tech
China 3% 8% 32% 23% 34% 2,209 786% -4 0 -10 4 11SouthKorea 2% 17% 9% 43% 28% 560 226% 0 6 -8 10 -8Russia 55% 29% 2% 8% 2% 527 412% 6 10 -3 -3 -2Mexico 16% 8% 9% 42% 22% 380 129% 3 3 -6 4 -6India 14% 38% 20% 18% 8% 337 702% 0 9 -19 7 3Brazil 33% 33% 5% 21% 4% 242 340% 13 6 -7 -4 -8SouthAfrica 25% 31% 6% 27% 3% 95 265% 8 1 -3 1 -1
*Exportstotalsdonotincludeuncategorizedexports,andthereforetheymaynotequal100%. Legend: x≤-6 -5≤x<0 0≤x≤9 x≥10
Changeintotalexport
value,2000-2013
Percentagepointchangeinshareofexportsbysector,2000-2013
Shareofexportsbysectorin2013* TotalExportValue
($Billions)
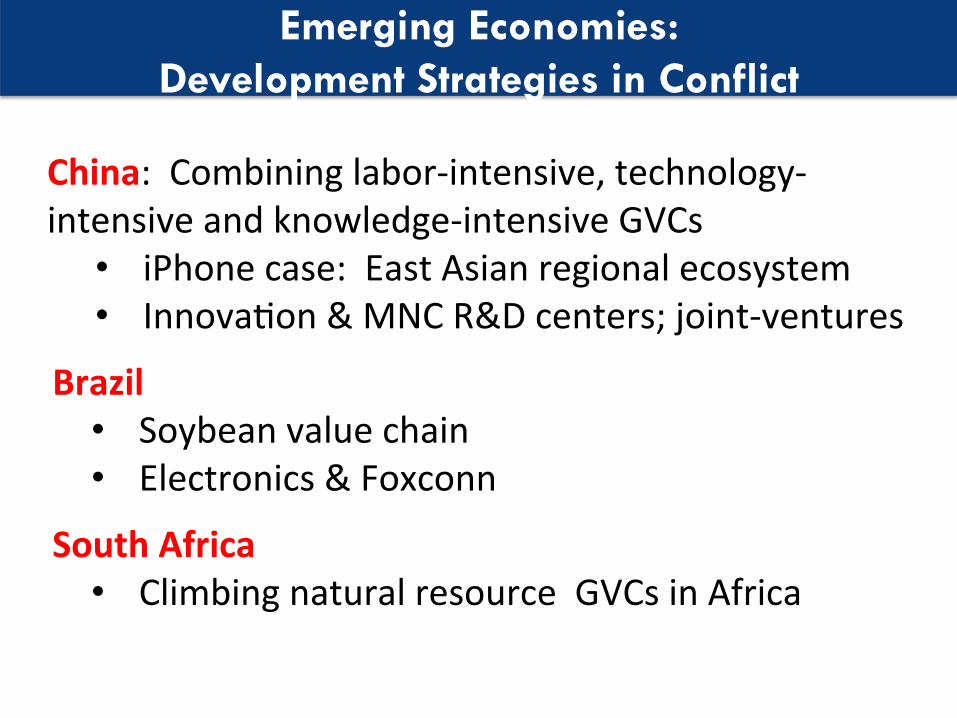
Emerging Economies: Development Strategies in Conflict
China:Combininglabor-intensive,technology-intensiveandknowledge-intensiveGVCs
• iPhonecase:EastAsianregionalecosystem• InnovaUon&MNCR&Dcenters;joint-ventures
Brazil• Soybeanvaluechain• Electronics&Foxconn
SouthAfrica• ClimbingnaturalresourceGVCsinAfrica
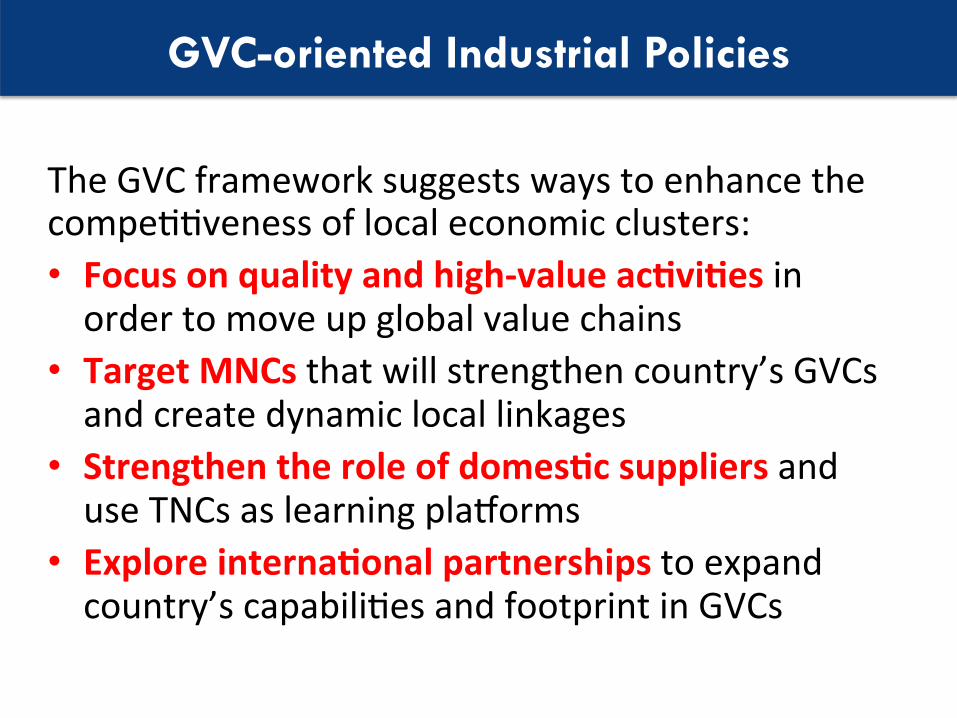
GVC-oriented Industrial Policies
TheGVCframeworksuggestswaystoenhancethecompeUUvenessoflocaleconomicclusters:• Focusonqualityandhigh-valueac6vi6esinordertomoveupglobalvaluechains
• TargetMNCsthatwillstrengthencountry’sGVCsandcreatedynamiclocallinkages
• Strengthentheroleofdomes6csuppliersanduseTNCsaslearningplaforms
• Exploreinterna6onalpartnershipstoexpandcountry’scapabiliUesandfootprintinGVCs