Embed Size (px)
Citation preview
The hidden treasure of high frequency dynamics:
from intrinsic time to 12 new scaling laws
Richard Olsen
OLSENLiquidity Investing
Dec 2009 2The intrinsic time framework
OLSENLiquidity Investing
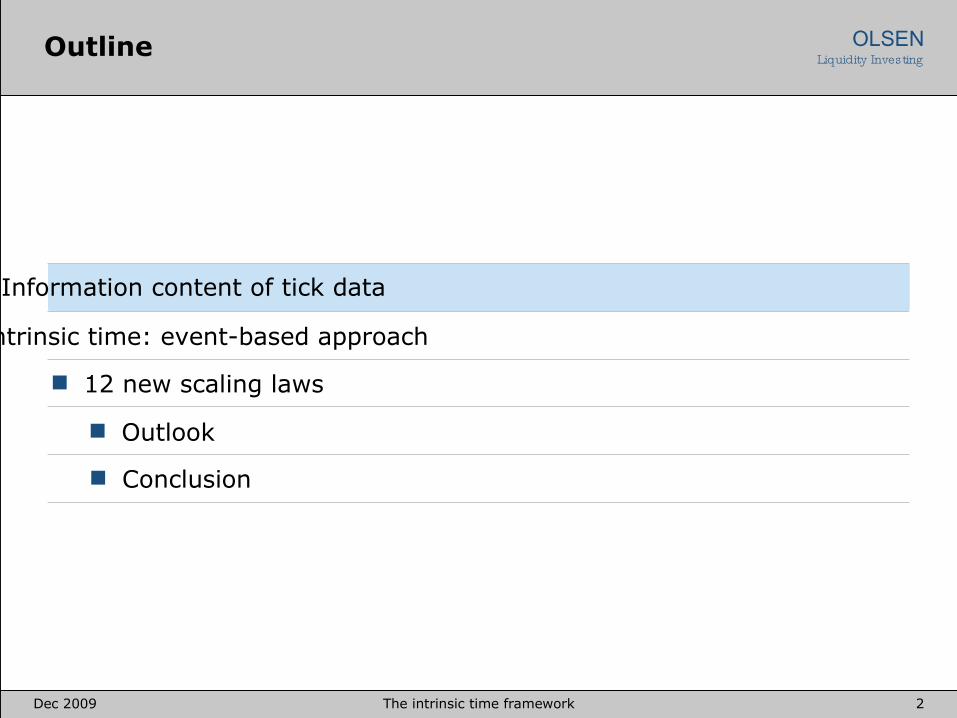
Information content of tick data
Intrinsic time: event-based approach
12 new scaling laws
Outlook
Outline
Conclusion
Dec 2009 3The intrinsic time framework
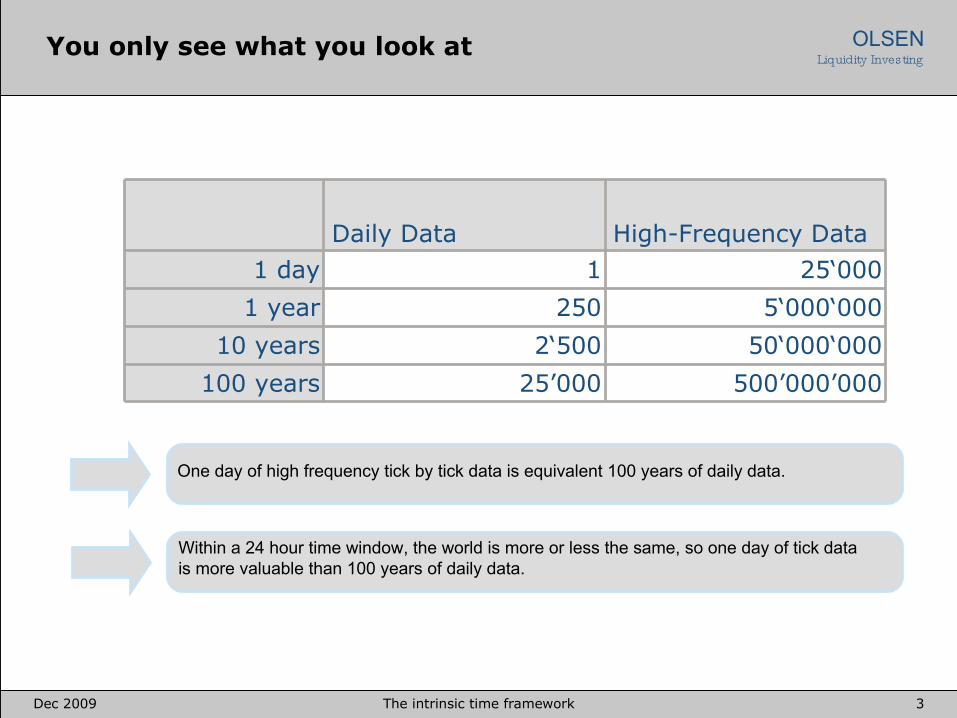
OLSENLiquidity InvestingYou only see what you look at
Daily Data High-Frequency Data
1 day 1 25‘000
1 year 250 5‘000‘000
10 years 2‘500 50‘000‘000
100 years 25’000 500’000’000
Within a 24 hour time window, the world is more or less the same, so one day of tick data is more valuable than 100 years of daily data.
One day of high frequency tick by tick data is equivalent 100 years of daily data.
Dec 2009 4The intrinsic time framework
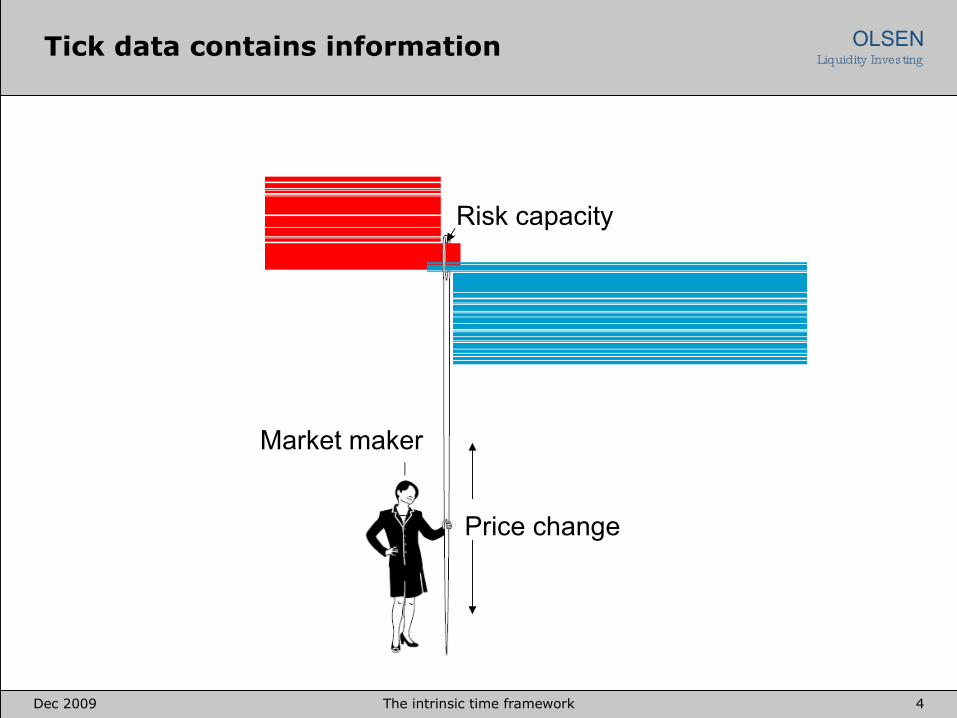
OLSENLiquidity InvestingTick data contains information
Risk capacity
Market maker
Price change
Dec 2009 5The intrinsic time framework
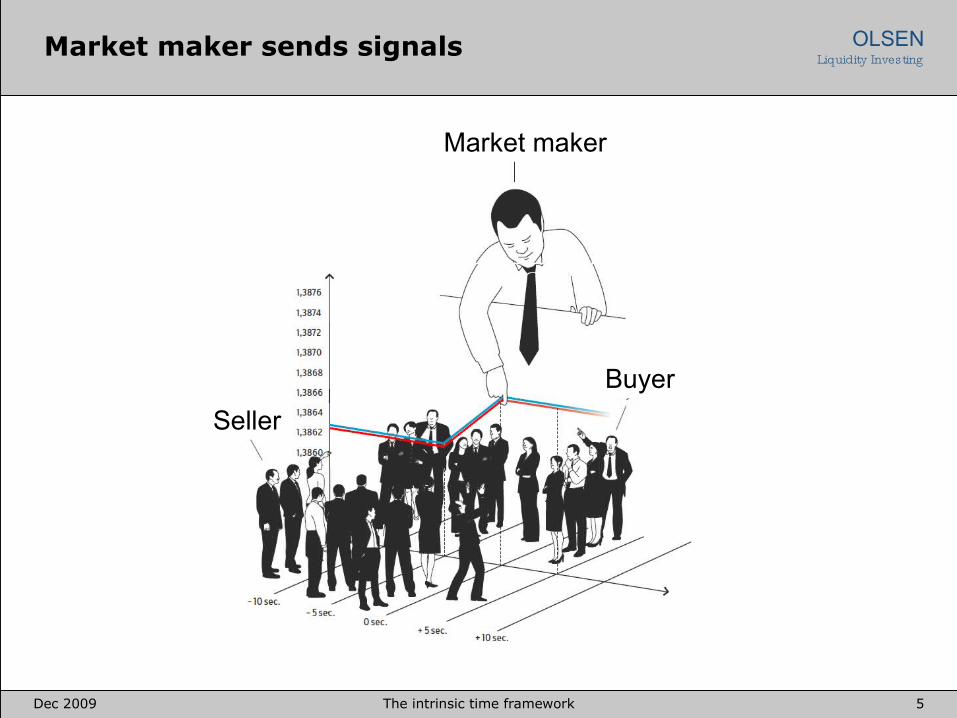
OLSENLiquidity InvestingMarket maker sends signals
Market maker
Buyer
Seller
Dec 2009 6The intrinsic time framework
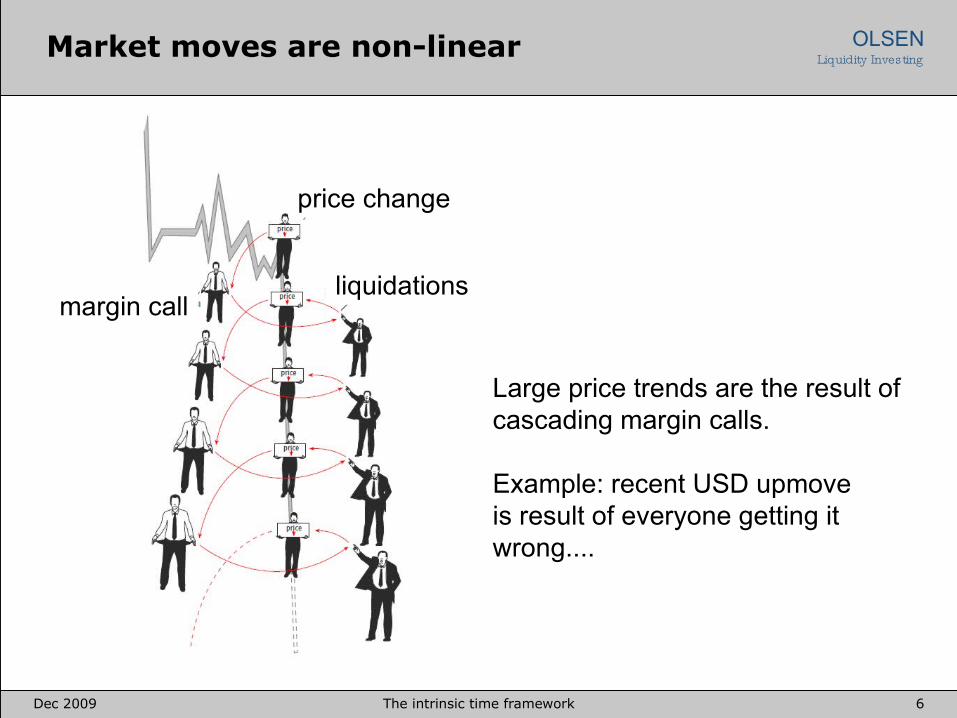
OLSENLiquidity InvestingMarket moves are non-linear
price change
liquidationsmargin call
Large price trends are the result of cascading margin calls.
Example: recent USD upmoveis result of everyone getting it wrong....
Dec 2009 7The intrinsic time framework
OLSENLiquidity Investing
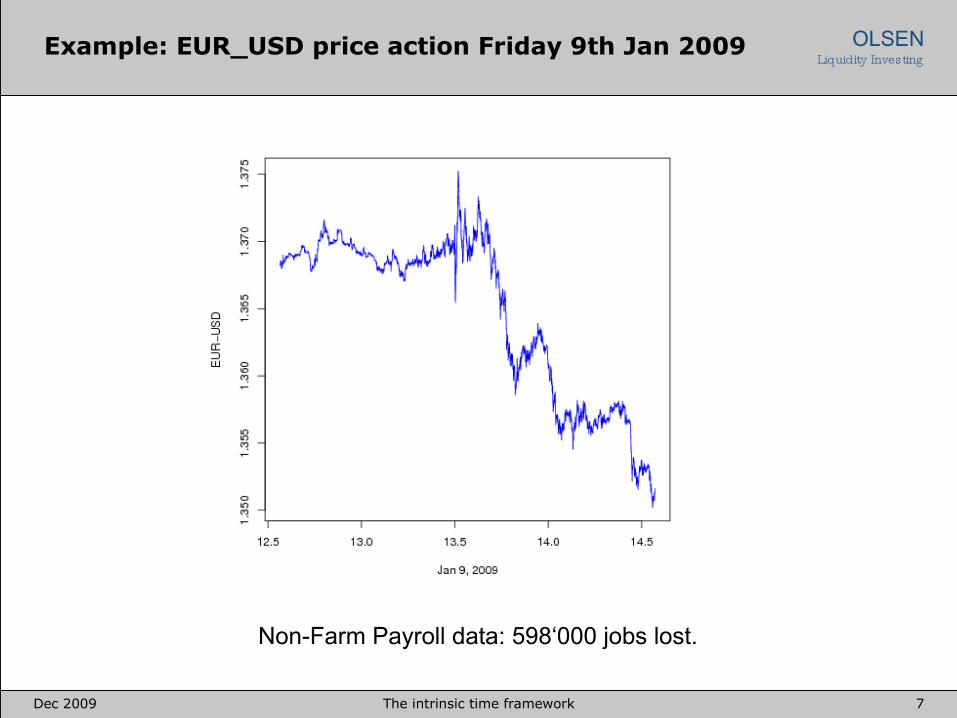
Example: EUR_USD price action Friday 9th Jan 2009
Non-Farm Payroll data: 598‘000 jobs lost.
Dec 2009 8The intrinsic time framework
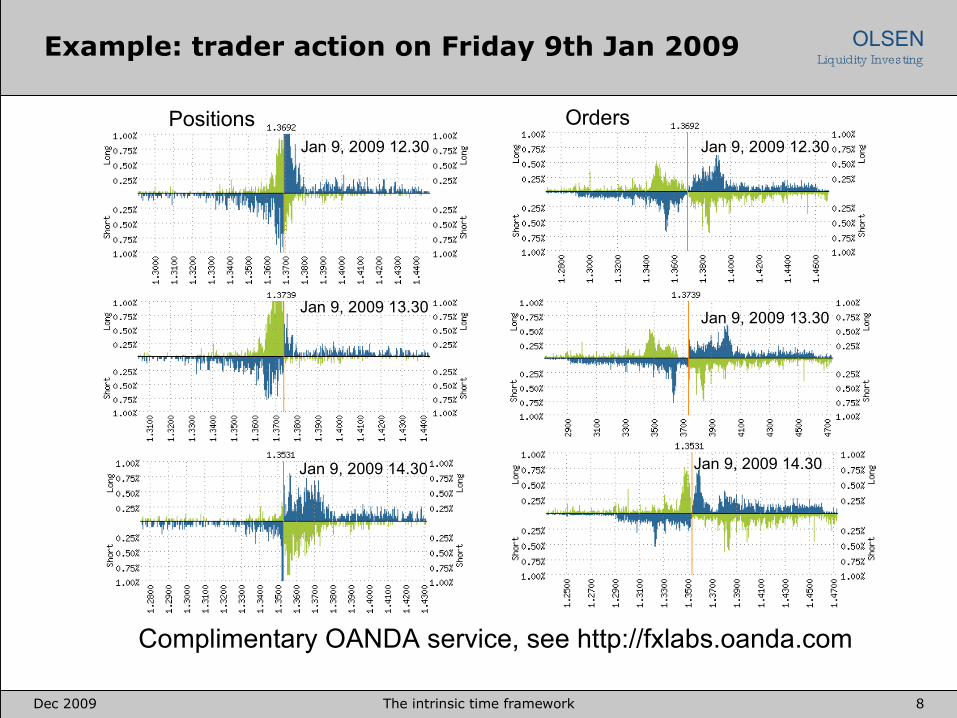
OLSENLiquidity InvestingExample: trader action on Friday 9th Jan 2009
OrdersPositionsJan 9, 2009 12.30
Jan 9, 2009 13.30
Jan 9, 2009 14.30
Jan 9, 2009 12.30
Jan 9, 2009 13.30
Jan 9, 2009 14.30
Complimentary OANDA service, see http://fxlabs.oanda.com
Dec 2009 9The intrinsic time framework
OLSENLiquidity Investing
Information content of tick data
Intrinsic time: event-based approach
Scaling laws
Outlook
Outline
Conclusion
Dec 2009 10The intrinsic time framework
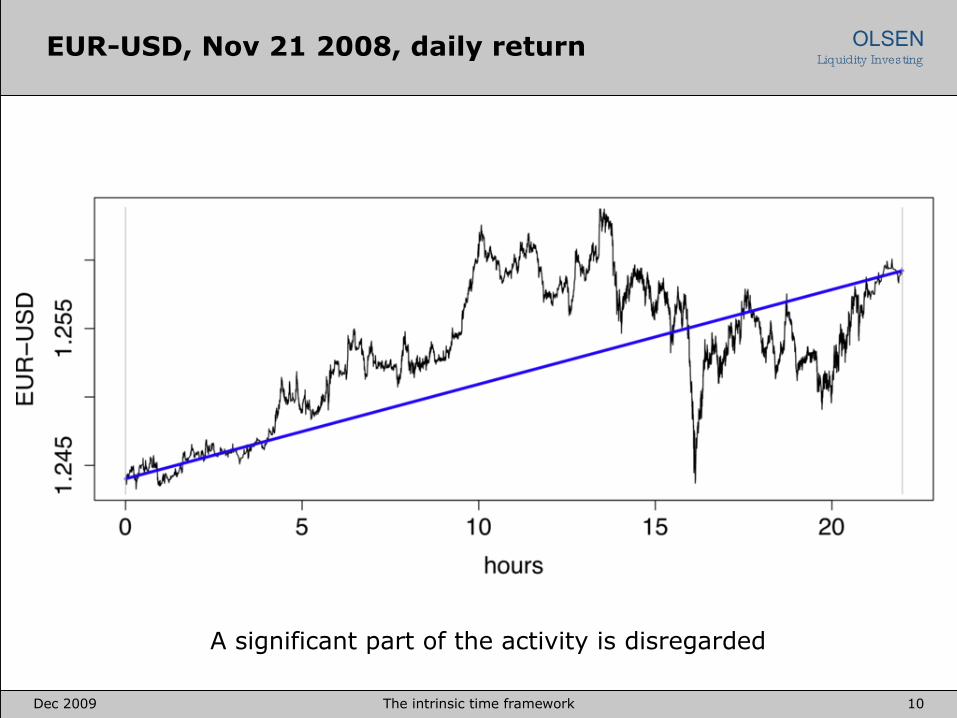
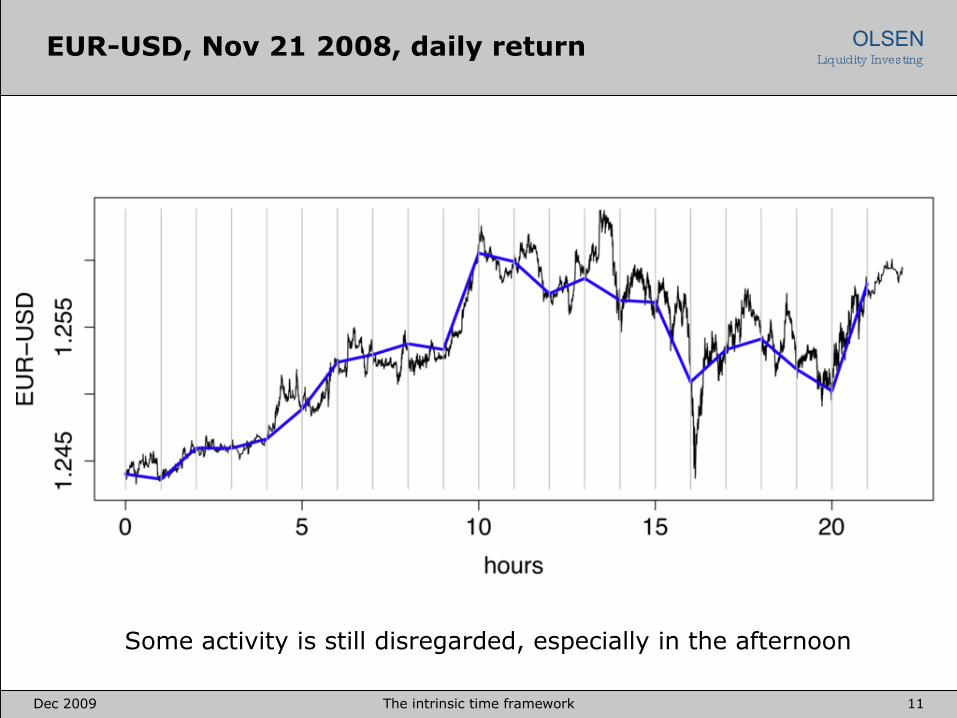
OLSENLiquidity InvestingEUR-USD, Nov 21 2008, daily return
A significant part of the activity is disregarded
Dec 2009 11The intrinsic time framework
OLSENLiquidity InvestingEUR-USD, Nov 21 2008, daily return
Some activity is still disregarded, especially in the afternoon
Dec 2009 12The intrinsic time framework
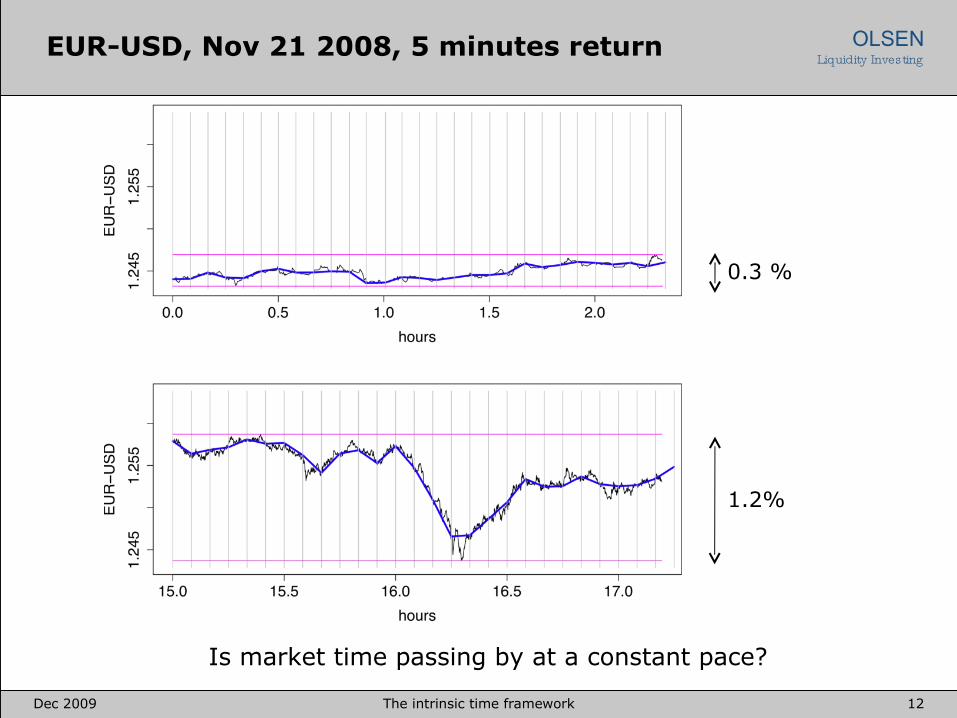
OLSENLiquidity InvestingEUR-USD, Nov 21 2008, 5 minutes return
0.3 %
1.2%
Is market time passing by at a constant pace?
Dec 2009 13The intrinsic time framework
OLSENLiquidity InvestingIn need of an event-based approach?
We have observed seasonailty and that time can speed up!
Why? The time series of prices is the result of the actions of
all traders
Can we address these issues within a top-down approach with a
unique notion of time? We believe this is close to impossible
Addtional units of time: intrinsic time
Price move occurences represent event and are unit of time
Important as the market is populated by a large variety of traders
sleeping at different time, with different profit objectives and
different risk appetite
Dec 2009 14The intrinsic time framework
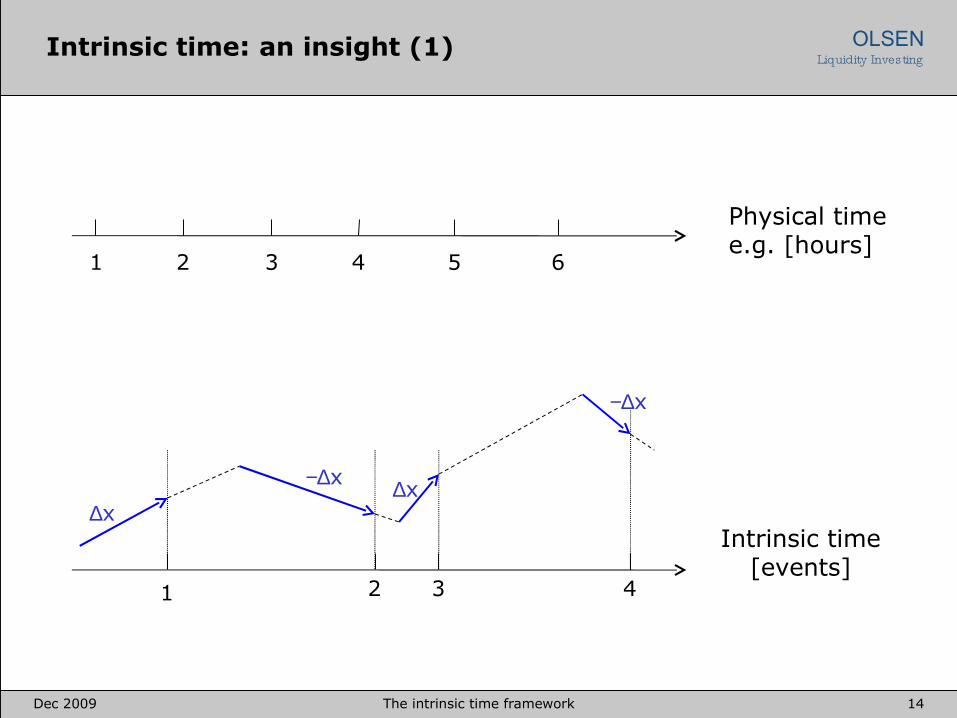
OLSENLiquidity InvestingIntrinsic time: an insight (1)
Physical timee.g. [hours]
1 2 3 4 5 6
Intrinsic time[events]
1 2 3 4
∆x
−∆x
−∆x
∆x
Dec 2009 15The intrinsic time framework
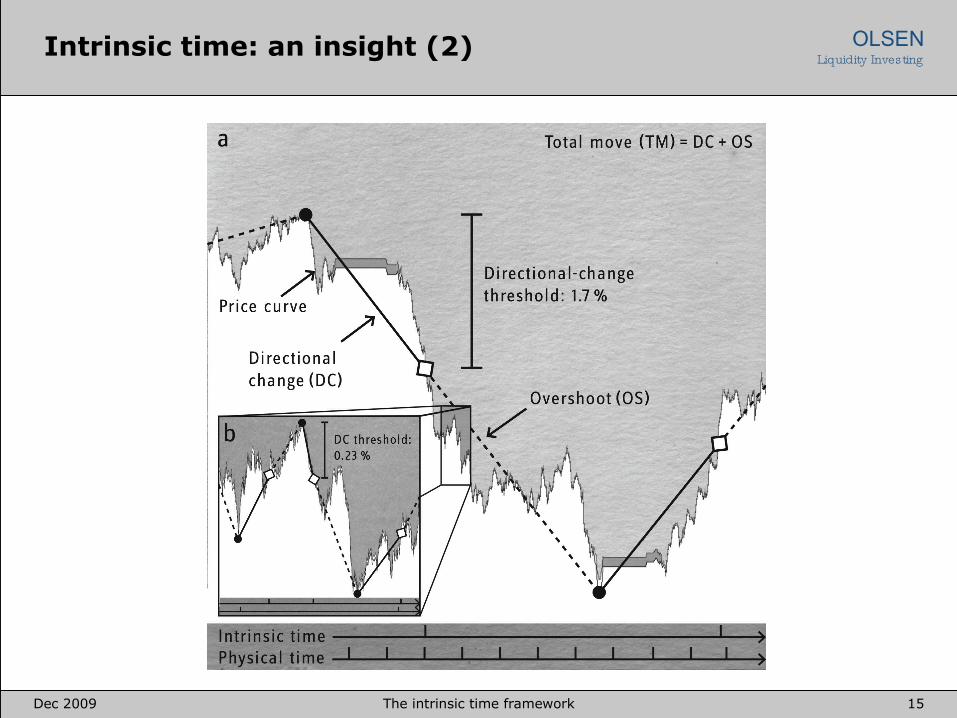
OLSENLiquidity InvestingIntrinsic time: an insight (2)
Dec 2009 16The intrinsic time framework
OLSENLiquidity InvestingIntrinsic time: pros and cons
Pros:
Full activity at a given price scales is observed
Seasonality and herding can be handled
Overshoot sections quantify the departure from the current price
level
Map how market participants see the market
Cope with the discountinuous nature of the market
Cons:
Relation to physical time and to price scales need to be
established
Volatility has to be defined
Dec 2009 17The intrinsic time framework
OLSENLiquidity Investing
Information content of tick data
Intrinsic time: event-based approach
Scaling laws
Outlook
Outline
Conclusion
Dec 2009 18The intrinsic time framework
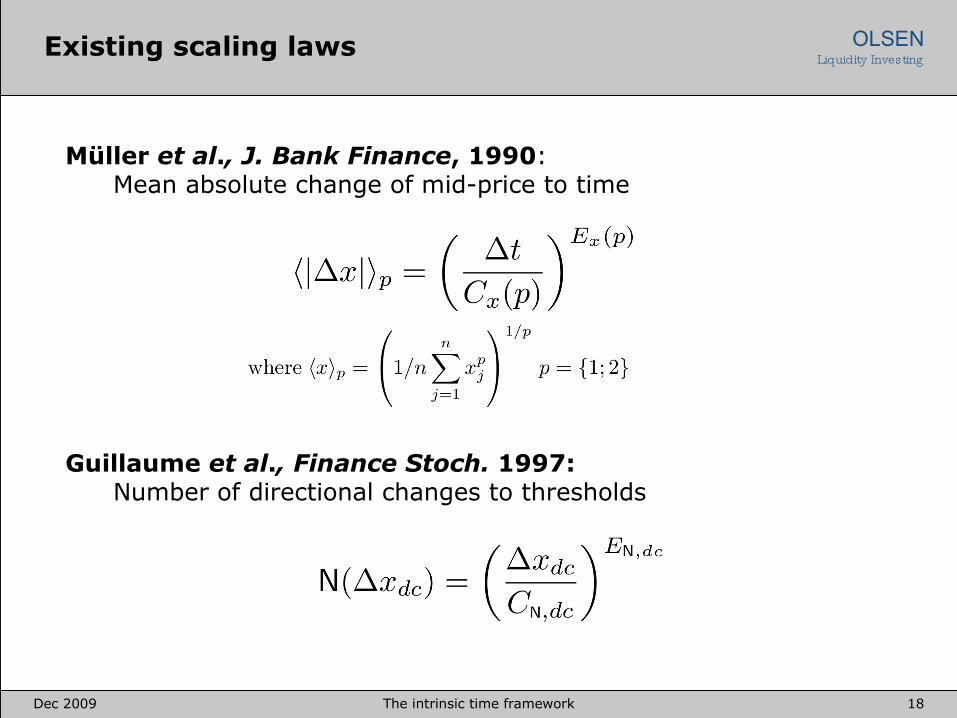
OLSENLiquidity InvestingExisting scaling laws
Müller et al., J. Bank Finance, 1990: Mean absolute change of mid-price to time
Guillaume et al., Finance Stoch. 1997:Number of directional changes to thresholds
Dec 2009 19The intrinsic time framework
OLSENLiquidity InvestingHigh-frequency FX data
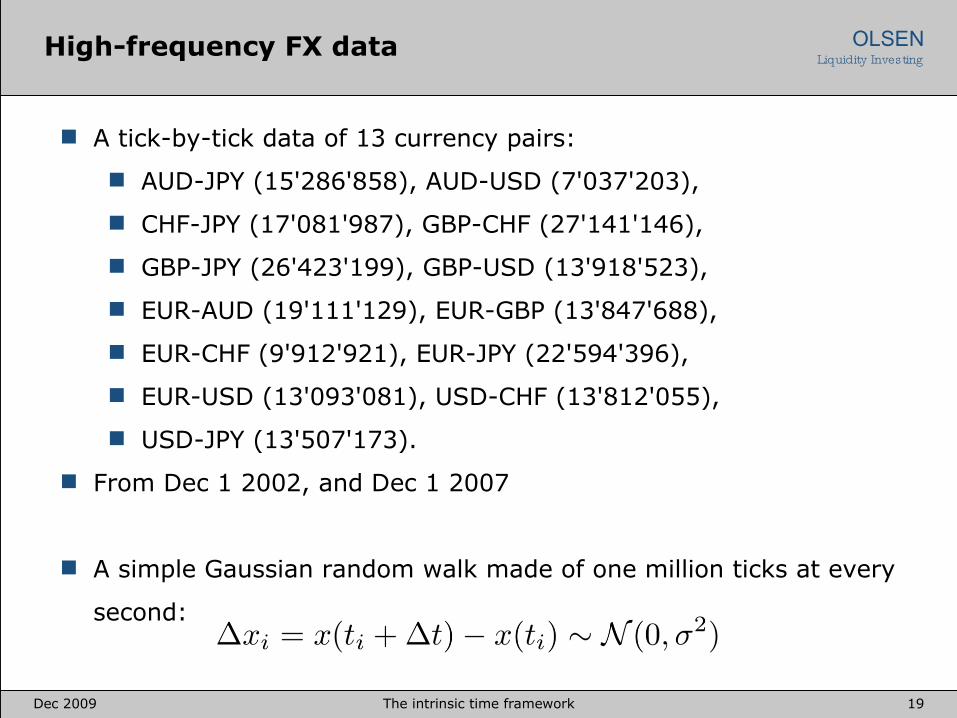
A tick-by-tick data of 13 currency pairs:
AUD-JPY (15'286'858), AUD-USD (7'037'203),
CHF-JPY (17'081'987), GBP-CHF (27'141'146),
GBP-JPY (26'423'199), GBP-USD (13'918'523),
EUR-AUD (19'111'129), EUR-GBP (13'847'688),
EUR-CHF (9'912'921), EUR-JPY (22'594'396),
EUR-USD (13'093'081), USD-CHF (13'812'055),
USD-JPY (13'507'173).
From Dec 1 2002, and Dec 1 2007
A simple Gaussian random walk made of one million ticks at every
second:
Dec 2009 20The intrinsic time framework
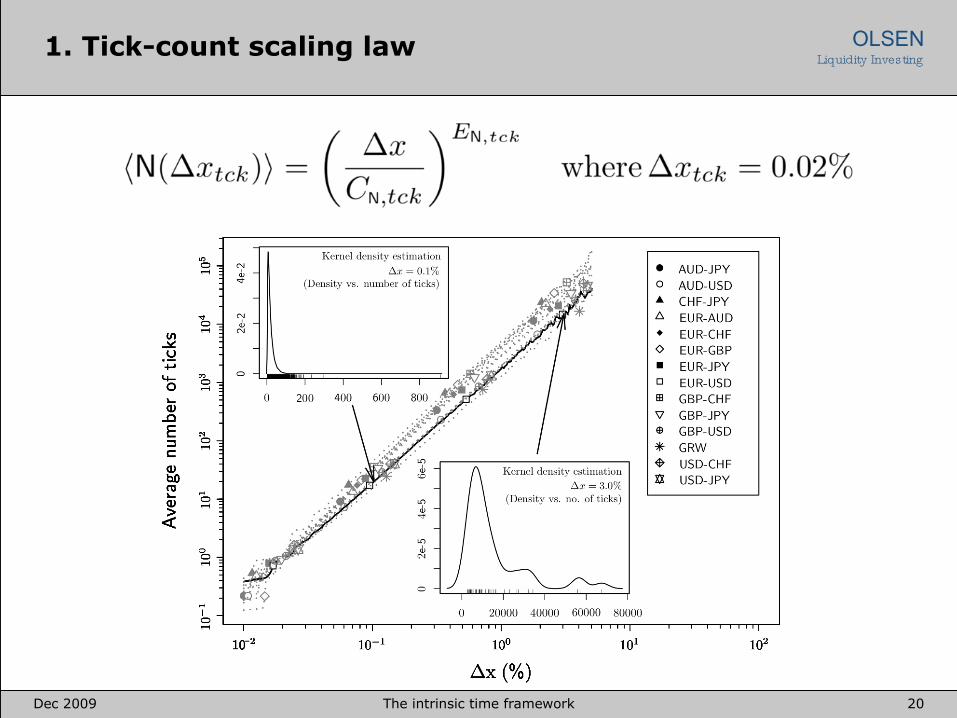
OLSENLiquidity Investing1. Tick-count scaling law
Dec 2009 21The intrinsic time framework
OLSENLiquidity InvestingOther laws at a glance (1)
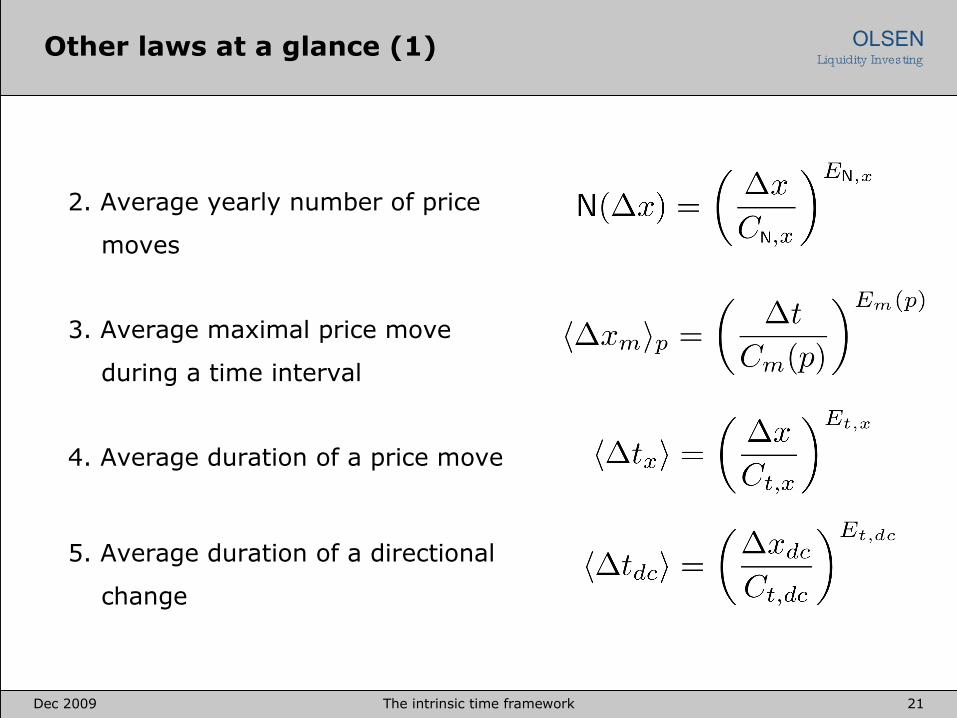
2. Average yearly number of price
moves
3. Average maximal price move
during a time interval
4. Average duration of a price move
5. Average duration of a directional
change
Dec 2009 22The intrinsic time framework
OLSENLiquidity InvestingOther laws at a glance (2)
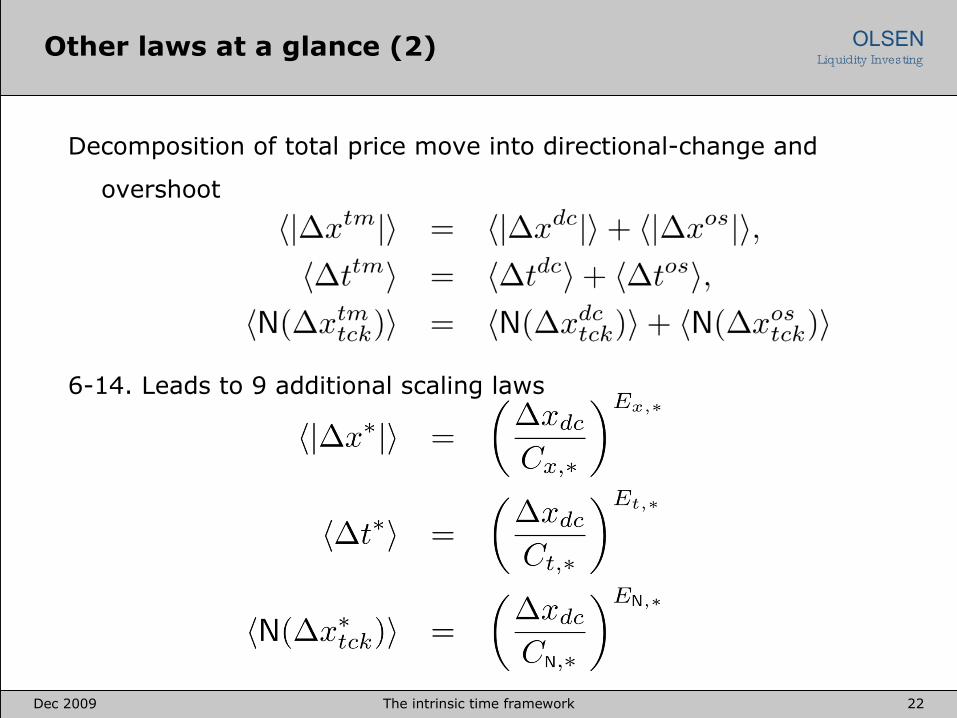
Decomposition of total price move into directional-change and
overshoot
6-14. Leads to 9 additional scaling laws
Dec 2009 23The intrinsic time framework
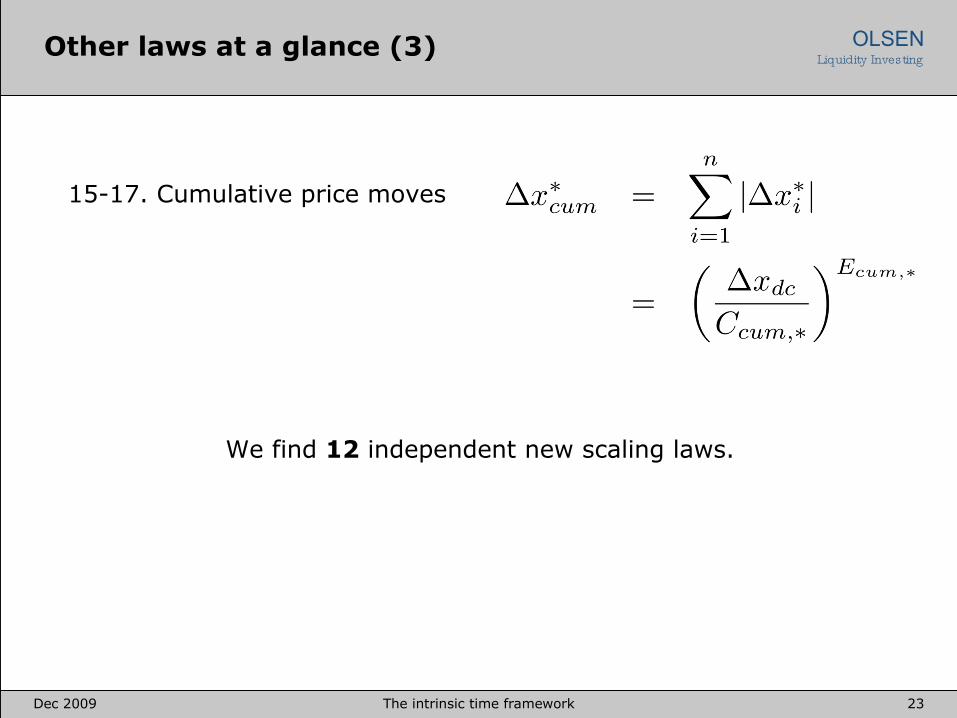
OLSENLiquidity InvestingOther laws at a glance (3)
15-17. Cumulative price moves
We find 12 independent new scaling laws.
Dec 2009 24The intrinsic time framework
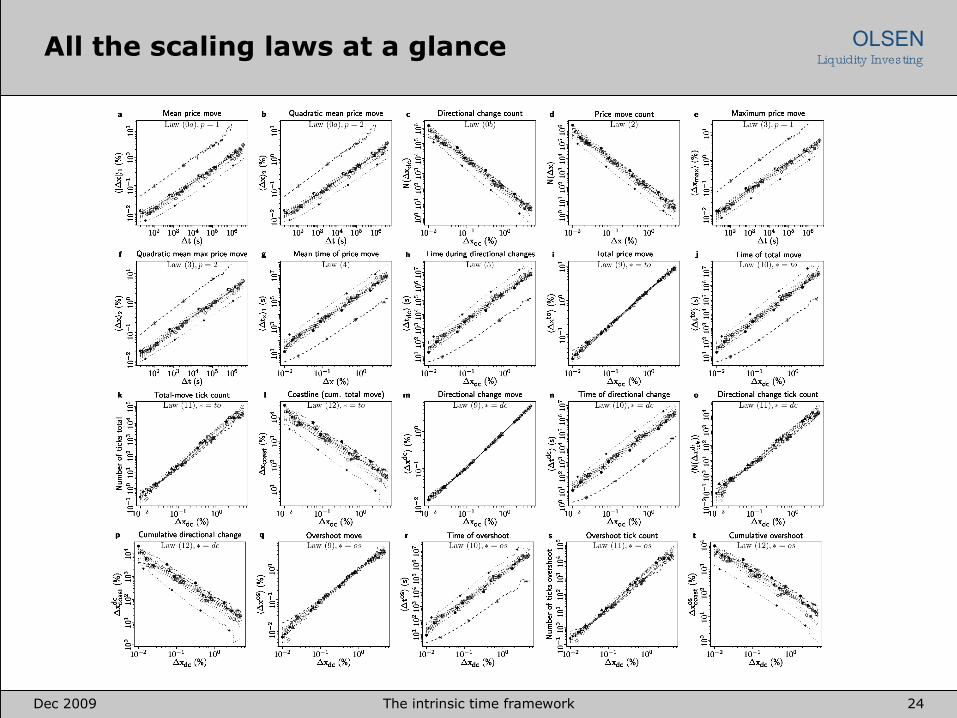
OLSENLiquidity InvestingAll the scaling laws at a glance
Dec 2009 25The intrinsic time framework
OLSENLiquidity InvestingThe coastline of prices (1)
The coastline associated to a price scale is the sum of all price
moves of a given price scale.
Why is it important?
quantifies the profit potential
allows for active management of positions
A variation (transaction costs taken into account) of the total
move scaling law allows us to estimate its average length
0.05%: 1604%
0.1%: 1463%
1%: 161%
5%: 34.5%
The GRW shows up to a factor 2 times smaller coastline
Dec 2009 26The intrinsic time framework
OLSENLiquidity InvestingThe coastline of prices (2)
For 0.05% threshold, daily length: EUR-CHF 1.8%, AUD-JPY 9.1%
The coastline measures on average 6.4% per day
On average, daily a mean maximal move of 0.6% is observed
On average it takes 220 days to observe a 6.4% price move
Dec 2009 27The intrinsic time framework
OLSENLiquidity Investing
Information content of tick data
Intrinsic time: event-based approach
Scaling laws
Outlook
Outline
Conclusion
Dec 2009 28The intrinsic time framework
OLSENLiquidity InvestingOutlook (1)
Sparsity of data to explain macro trends
Treasure of tick by tick data: resource for model building
Comprehensive data repository of observed and synthetic data
Self-similar model building
Intrinsic time approach
Dec 2009 29The intrinsic time framework
OLSENLiquidity InvestingOutlook (2)
Call to action: global economic crisis
Global information system
Collaboration
Data repository
Descriptive economics
Actual deliverables: real time services
Dec 2009 30The intrinsic time framework
OLSENLiquidity Investing
Motivation
Intrinsic time: event-based approach
Scaling laws
Outlook
Outline
Conclusion
Dec 2009 31The intrinsic time framework
OLSENLiquidity InvestingFinance as the next computer technology
· other industries have succeeded, why not economics and finance?
· human beings, complexity, unforeseen events.
· high frequency finance, new concepts, significant financial resouces.
· Yes, it is feasible · Thank you.
Dec 2009 32The intrinsic time framework
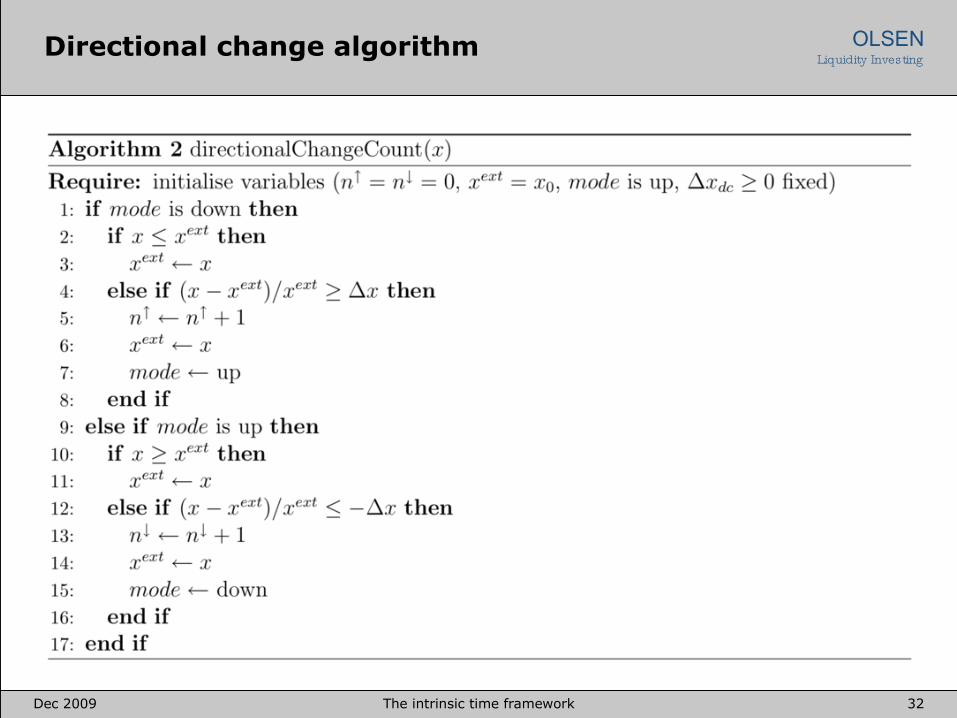
OLSENLiquidity InvestingDirectional change algorithm
Dec 2009 33The intrinsic time framework
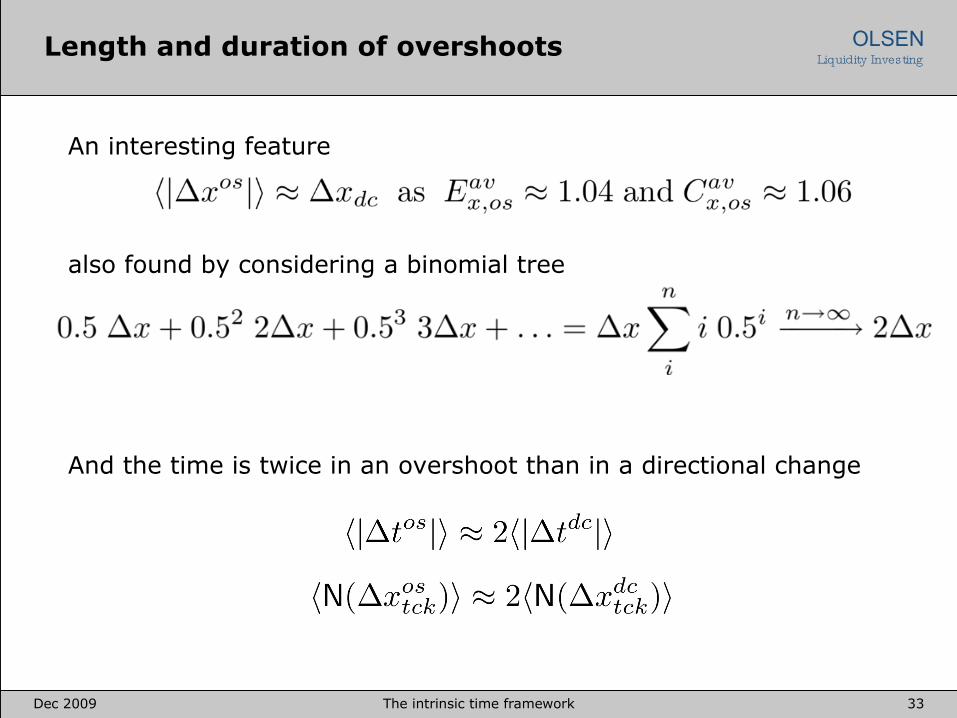
OLSENLiquidity InvestingLength and duration of overshoots
An interesting feature
also found by considering a binomial tree
And the time is twice in an overshoot than in a directional change
Dec 2009 34The intrinsic time framework
OLSENLiquidity InvestingComparison with a GRW
A GRW has strikingly similar properties than the average
properties of the market data
Noticable difference: average maximum price move is 8 times
larger than observed with the market data
Duration of price move
Exponent 0.500 when p=2
Average exponent 0.457 for market data, p=2
It is not 0.500 for any other law
Dec 2009 35The intrinsic time framework
OLSENLiquidity InvestingExploring the space of scaling law (1)
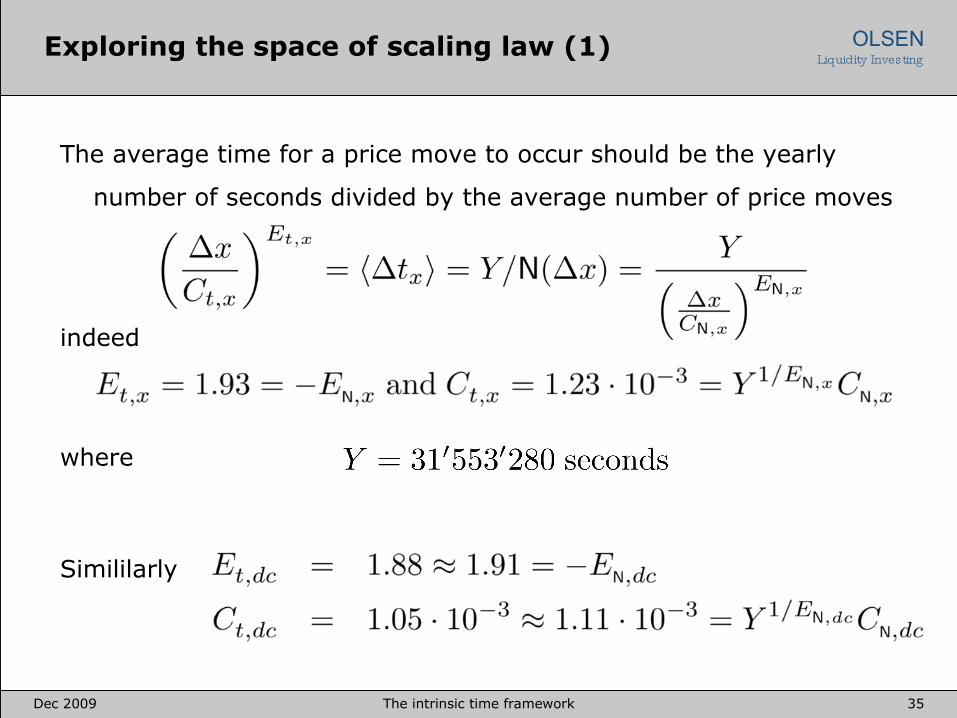
where
Simililarly
The average time for a price move to occur should be the yearly
number of seconds divided by the average number of price moves
indeed
Dec 2009 36The intrinsic time framework
OLSENLiquidity InvestingExploring the space of scaling law (2)
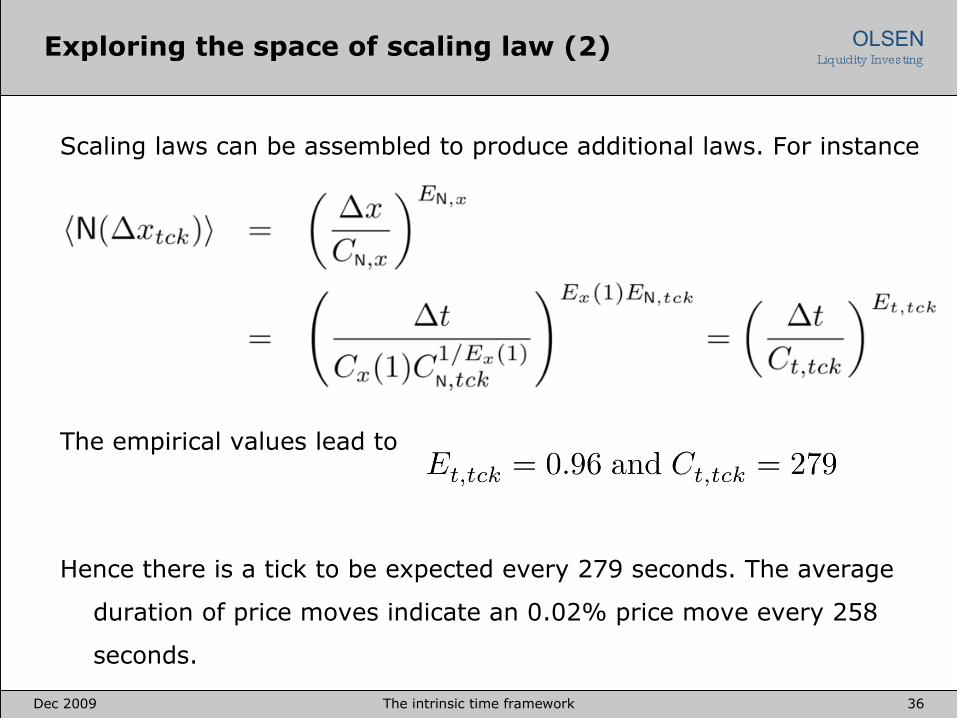
The empirical values lead to
Hence there is a tick to be expected every 279 seconds. The average
duration of price moves indicate an 0.02% price move every 258
seconds.
Scaling laws can be assembled to produce additional laws. For instance