Embed Size (px)
Citation preview
India : Economic Growth (GDP)July-Sept 2014
FINALYTIKSINDIA-in-FOCUS
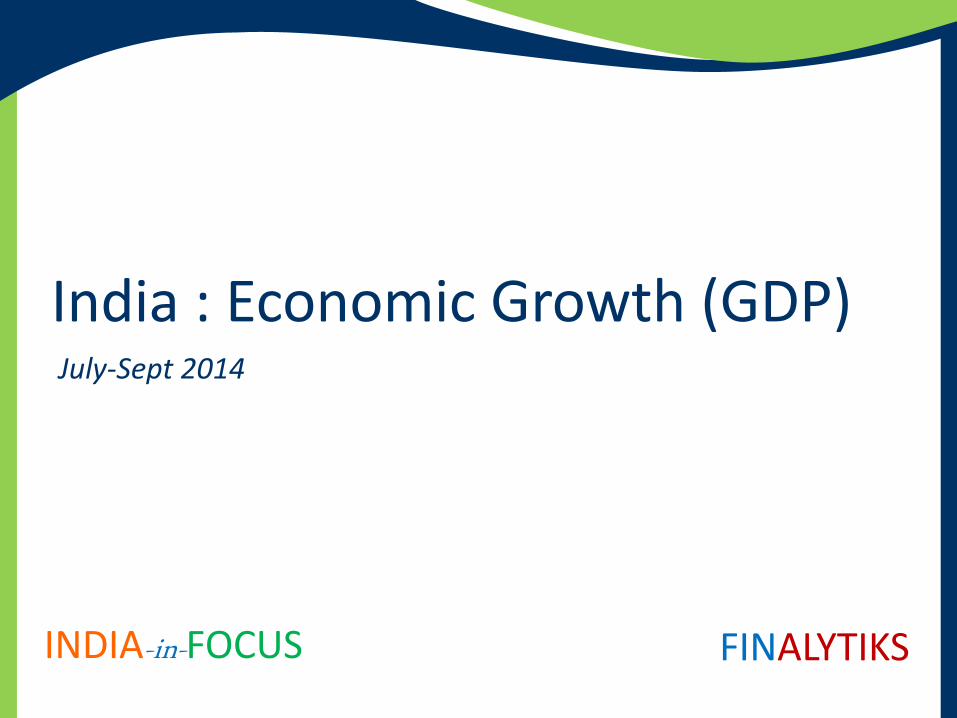
Economic growth slowsIndian economy grew @5.3% in Jul-Sept 2014 quarter (YoY), lower than the 10-quarter high of 5.7% recorded in the previous quarter, but better than 4.7% in FY14 (Apr'13-Mar'14)
Slow down due to lower Industrial (@ 2.2%) and Agricultural (@ 3.2%) growth during the quarter. But services sector grew @ 7.1%
Private spending grew at 5.8%; Fixed Capital formation was flat; Government expenditure expanded @ 10.1%
Economy is expected to grow @ 5.5% in FY15 and 6.5% in FY16 (Apr-Mar)
New government's policy decisions key to growth revival; Central bank is expected to cut policy rates by early 2015
GDP Growth at Factor cost
Source : CSO; Compiled by : Finalytiks
4.6%
5.7%
5.3%
0%
2%
4%
6%
8%
10%
12%
Q1
FY1
0
Q2
FY1
0
Q3
FY1
0
Q4
FY1
0
Q1
FY1
1
Q2
FY1
1
Q3
FY1
1
Q4
FY1
1
Q1
FY1
2
Q2
FY1
2
Q3
FY1
2
Q4
FY1
2
Q1
FY1
3
Q2
FY1
3
Q3
FY1
3
Q4
FY1
3
Q1
FY1
4
Q2
FY1
4
Q3
FY1
4
Q4
FY1
4
Q1
FY1
5
Q2
FY1
5
Q1 FY15 Q2 FY15
5.7% 5.3%q
GDP at Factor Cost
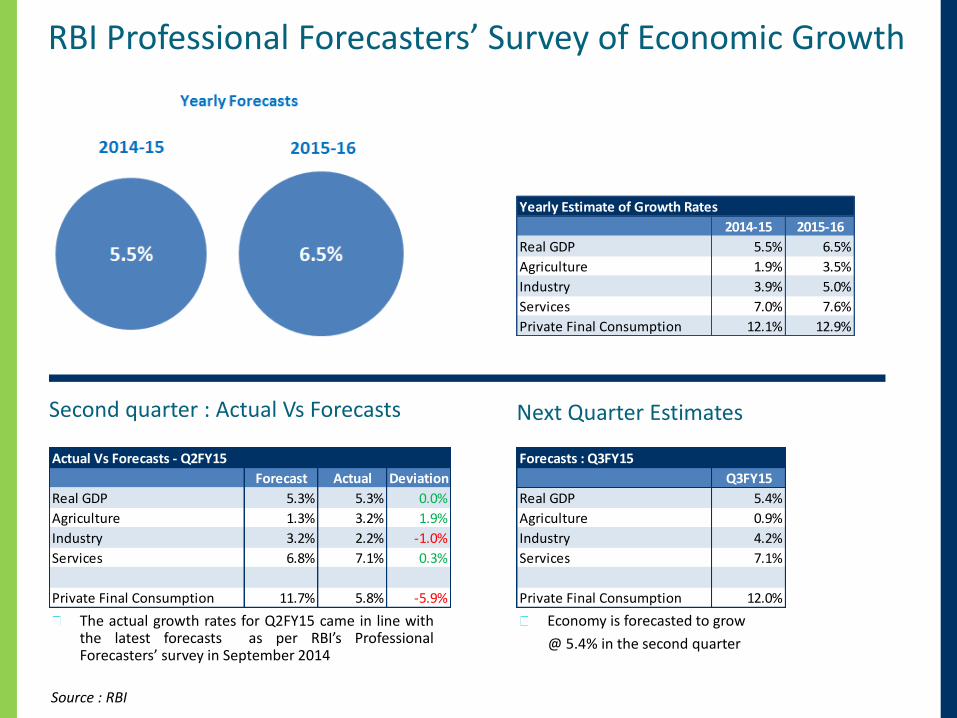
RBI Professional Forecasters’ Survey of Economic Growth
Second quarter : Actual Vs Forecasts
The actual growth rates for Q2FY15 came in line withthe latest forecasts as per RBI’s ProfessionalForecasters’ survey in September 2014
Source : RBI
Economy is forecasted to grow
@ 5.4% in the second quarter
Next Quarter Estimates
Yearly Estimate of Growth Rates
2014-15 2015-16
Real GDP 5.5% 6.5%
Agriculture 1.9% 3.5%
Industry 3.9% 5.0%
Services 7.0% 7.6%
Private Final Consumption 12.1% 12.9%
Actual Vs Forecasts - Q2FY15
Forecast Actual Deviation
Real GDP 5.3% 5.3% 0.0%
Agriculture 1.3% 3.2% 1.9%
Industry 3.2% 2.2% -1.0%
Services 6.8% 7.1% 0.3%
Private Final Consumption 11.7% 5.8% -5.9%
Forecasts : Q3FY15
Q3FY15
Real GDP 5.4%
Agriculture 0.9%
Industry 4.2%
Services 7.1%
Private Final Consumption 12.0%

Key trigger events to watch forGovernment policies will determine the course of India’s growth
The change of government has given a fillip to investor confidence in India. The policy decisions on the much awaitedeconomic reforms (infrastructure, mining & financial sector) are going to be the key trigger points for the Indian economy.Apart from these, the budget to be presented by end of February 2015 is one of the most eagerly awaited events in the nextone year
The central bank’s (RBI) decision on the policy rates is a much awaited event. It kept the policy rates unchanged in the latestpolicy review meeting, but sounded dovish. Inflation is below RBI’s Jan 2015 target of 8%. The central bank is concernedabout upside risks to its inflation target. The market widely expects deep cuts in policy rates starting H1 CY15
12-month moving average of GDP growth, points to mild recovery after bottoming out in early 2014
GDP growth at Factor cost & 12-Month Moving Average
Source : CSO; Compiled by : Finalytiks
5.3%
5.0%
4%
5%
6%
7%
8%
9%
10%
11%
12%
Q1
FY1
0
Q2
FY1
0
Q3
FY1
0
Q4
FY1
0
Q1
FY1
1
Q2
FY1
1
Q3
FY1
1
Q4
FY1
1
Q1
FY1
2
Q2
FY1
2
Q3
FY1
2
Q4
FY1
2
Q1
FY1
3
Q2
FY1
3
Q3
FY1
3
Q4
FY1
3
Q1
FY1
4
Q2
FY1
4
Q3
FY1
4
Q4
FY1
4
Q1
FY1
5
Q2
FY1
5
GDP at factor cost 12-Month Moving Average

Economy slows
Q1 FY15 Q2 FY15 Q1 FY15 Q2 FY15
5.7% 5.3% 5.9% 6.0%
Q1 FY15 Q2 FY15 Q1 FY15 Q2 FY15 Q1 FY15 Q2 FY15
3.8% 3.2% 4.2% 2.2% 6.8% 7.1%
Q1 FY15 Q2 FY15 Q1 FY15 Q2 FY15 Q1 FY15 Q2 FY15
8.8% 10.1% 5.6% 5.8% 7.0% 0.0%
Q1 FY15 Q2 FY15 Q1 FY15 Q2 FY15 Q1 FY15 Q2 FY15
11.5% -1.6% -0.4% 1.1% -30.2% 13.4%
Imports Net Exports (Negative)
p
Gross Domestic Product Growth - Current Vs. Previous QuarterGDP at Factor Cost GDP at Market Price
Economic Activity Based Classification (at Factor cost)Agriculture & Allied Industry Services
q p
q pq
p p q
q p
Expenditure Based Classification (at Market prices)
Government Final
Consumption Expenditure
Private Final
Consumption Expenditure
Gross Fixed
Capital Formation
Exports
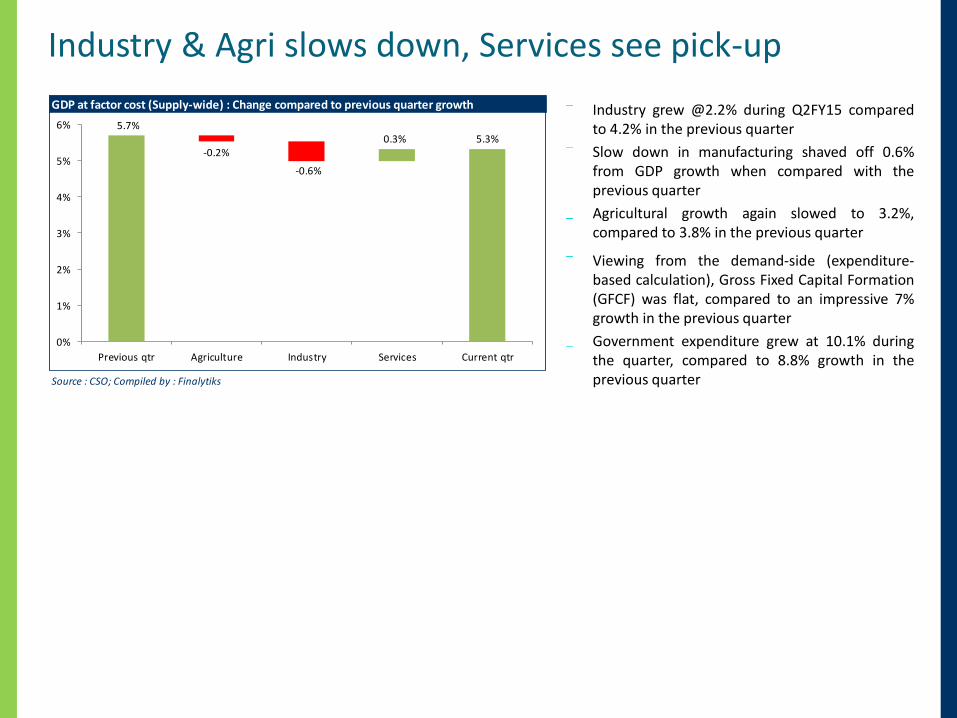
Industry & Agri slows down, Services see pick-up
Industry grew @2.2% during Q2FY15 comparedto 4.2% in the previous quarter
Slow down in manufacturing shaved off 0.6%from GDP growth when compared with theprevious quarter
Agricultural growth again slowed to 3.2%,compared to 3.8% in the previous quarter
Viewing from the demand-side (expenditure-based calculation), Gross Fixed Capital Formation(GFCF) was flat, compared to an impressive 7%growth in the previous quarter
Government expenditure grew at 10.1% duringthe quarter, compared to 8.8% growth in theprevious quarter
GDP at factor cost (Supply-wide) : Change compared to previous quarter growth
Source : CSO; Compiled by : Finalytiks
5.7%
-0.2%
-0.6%
0.3% 5.3%
0%
1%
2%
3%
4%
5%
6%
Previous qtr Agriculture Industry Services Current qtr

GDP : at factor cost (Supply-side)Agriculture grew @3.2% compared to 3.8% in the previousquarter. This is slightly lower than the CAGR of 3.9% overthe past 10 years
Industry grew @2.2% compared to 4.2% in the previousquarter, way lower than 10-year CAGR of 6.6%
Services sector continued to support the economicgrowth, and grew @7.1% during the quarter, compared to6.8% during the previous quarter. But again, this is lowerthan 10-year CAGR of 8.9%
Agriculture growth (YoY %)
Source : CSO; Compiled by : Finalytiks
6.3%
3.8%
3.2%
-2%
0%
2%
4%
6%
8%
10%
12%
14%
Q1
FY1
0
Q2
FY1
0
Q3
FY1
0
Q4
FY1
0
Q1
FY1
1
Q2
FY1
1
Q3
FY1
1
Q4
FY1
1
Q1
FY1
2
Q2
FY1
2
Q3
FY1
2
Q4
FY1
2
Q1
FY1
3
Q2
FY1
3
Q3
FY1
3
Q4
FY1
3
Q1
FY1
4
Q2
FY1
4
Q3
FY1
4
Q4
FY1
4
Q1
FY1
5
Q2
FY1
5
Industrial growth (YoY %)
Source : CSO; Compiled by : Finalytiks
-0.2%
4.2%
2.2%
-2%
0%
2%
4%
6%
8%
10%
12%
14%
16%
18%
Q1
FY1
0
Q2
FY1
0
Q3
FY1
0
Q4
FY1
0
Q1
FY1
1
Q2
FY1
1
Q3
FY1
1
Q4
FY1
1
Q1
FY1
2
Q2
FY1
2
Q3
FY1
2
Q4
FY1
2
Q1
FY1
3
Q2
FY1
3
Q3
FY1
3
Q4
FY1
3
Q1
FY1
4
Q2
FY1
4
Q3
FY1
4
Q4
FY1
4
Q1
FY1
5
Q2
FY1
5
Services growth (YoY %)
Source : CSO; Compiled by : Finalytiks
6.4%6.8%
7.1%
0%
2%
4%
6%
8%
10%
12%
14%
Q1
FY1
0
Q2
FY1
0
Q3
FY1
0
Q4
FY1
0
Q1
FY1
1
Q2
FY1
1
Q3
FY1
1
Q4
FY1
1
Q1
FY1
2
Q2
FY1
2
Q3
FY1
2
Q4
FY1
2
Q1
FY1
3
Q2
FY1
3
Q3
FY1
3
Q4
FY1
3
Q1
FY1
4
Q2
FY1
4
Q3
FY1
4
Q4
FY1
4
Q1
FY1
5
Q2
FY1
5

GDP : Sector wiseServices sector, representing >60% of theeconomy, contributed 4.4% out of total growth of5.3%. That is roughly 83% contribution out oftotal growth
Industry, representing ~26% of the economy,contributed 0.6% to the total growth
Agriculture contributed 0.4% to GDP growth. Itrepresents ~11% of the economy
Contribution to Total GDP growth by each sector
Source : CSO; Compiled by : Finalytiks
4.5% 4.6%4.4% 4.4% 4.7%
5.2%
4.6% 4.6%
5.7%5.3%
-1%
0%
1%
2%
3%
4%
5%
6%
7%
Q1FY13 Q2FY13 Q3FY13 Q4FY13 Q1FY14 Q2FY14 Q3FY14 Q4FY14 Q1FY15 Q2FY15
Agriculture & allied Industry Services GDP at factor cost
Sector wise composition of GDP in second quarter of Financial year
Agriculture Industry Services
10.8% 25.9% 63.3%
Source : CSO; Compiled by : Finalytiks
0%
10%
20%
30%
40%
50%
60%
70%
80%
90%
100%
Q2FY05 Q2FY06 Q2FY07 Q2FY08 Q2FY09 Q2FY10 Q2FY11 Q2FY12 Q2FY13 Q2FY14 Q2FY15

GDP : Industrial GrowthManufacturing growth was @0.1% compared to 3.5%. Theprevious quarter growth was the highest in the past 10quarters
Construction grew @4.6% compared to 4.8% in the previousquarter
Electricity, Gas & Water supply slowed to 8.7%, compared to10.2% in the previous quarter. The previous quarter growthwas the highest in the past 3 years
Mining grew @1.9%, compared to 2.1% in the previousquarter. Mining continued to grow for two quarters, aftercontracting for 8 consecutive quarters
Manufacturing growth (YoY %)
Source : CSO; Compiled by : Finalytiks
-1.4%
3.5%
0.1%
-0.2%
4.2%2.2%
-5%
0%
5%
10%
15%
20%
25%
Q1
FY1
0
Q2
FY1
0
Q3
FY1
0
Q4
FY1
0
Q1
FY1
1
Q2
FY1
1
Q3
FY1
1
Q4
FY1
1
Q1
FY1
2
Q2
FY1
2
Q3
FY1
2
Q4
FY1
2
Q1
FY1
3
Q2
FY1
3
Q3
FY1
3
Q4
FY1
3
Q1
FY1
4
Q2
FY1
4
Q3
FY1
4
Q4
FY1
4
Q1
FY1
5
Q2
FY1
5
Manufacturing Industry
Construction growth (YoY %)
Source : CSO; Compiled by : Finalytiks
0.7%
4.8% 4.6%
-0.2%
4.2%
2.2%
-4%
-2%
0%
2%
4%
6%
8%
10%
12%
14%
16%
18%
Q1
FY1
0
Q2
FY1
0
Q3
FY1
0
Q4
FY1
0
Q1
FY1
1
Q2
FY1
1
Q3
FY1
1
Q4
FY1
1
Q1
FY1
2
Q2
FY1
2
Q3
FY1
2
Q4
FY1
2
Q1
FY1
3
Q2
FY1
3
Q3
FY1
3
Q4
FY1
3
Q1
FY1
4
Q2
FY1
4
Q3
FY1
4
Q4
FY1
4
Q1
FY1
5
Q2
FY1
5Construction Industry
Mining & Electricity growth (YoY %)
Source : CSO; Compiled by : Finalytiks
-0.4%
2.1% 1.9%
7.2%
10.2%
8.7%
-6%
-4%
-2%
0%
2%
4%
6%
8%
10%
12%
Q1
FY1
0
Q2
FY1
0
Q3
FY1
0
Q4
FY1
0
Q1
FY1
1
Q2
FY1
1
Q3
FY1
1
Q4
FY1
1
Q1
FY1
2
Q2
FY1
2
Q3
FY1
2
Q4
FY1
2
Q1
FY1
3
Q2
FY1
3
Q3
FY1
3
Q4
FY1
3
Q1
FY1
4
Q2
FY1
4
Q3
FY1
4
Q4
FY1
4
Q1
FY1
5
Q2
FY1
5
Mining & Quarrying Electricity, Gas & Water supply
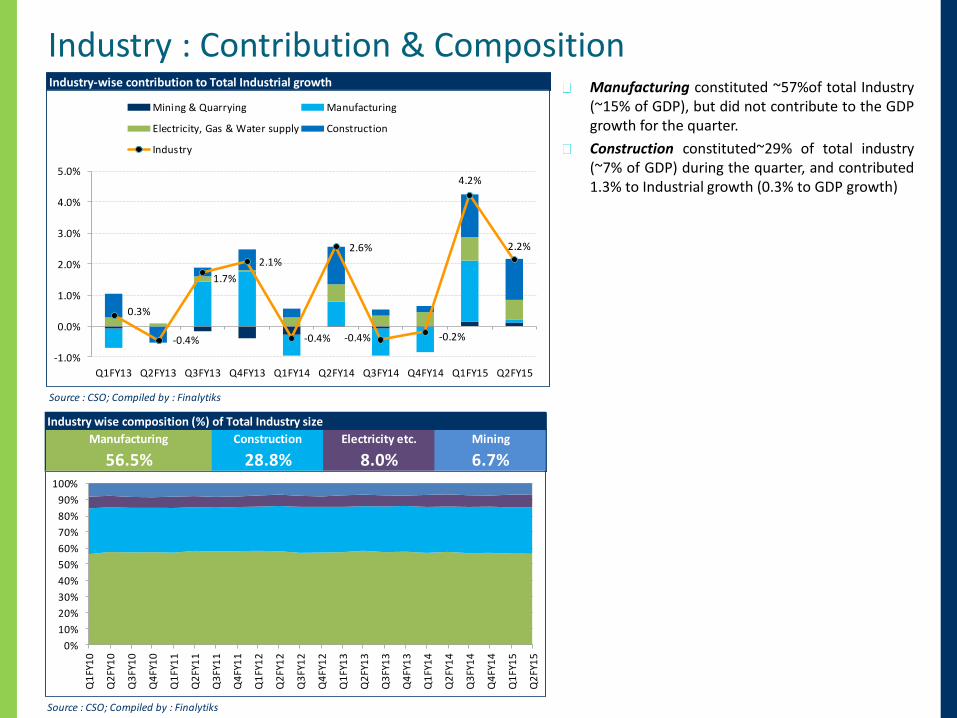
Industry : Contribution & CompositionManufacturing constituted ~57%of total Industry(~15% of GDP), but did not contribute to the GDPgrowth for the quarter.
Construction constituted~29% of total industry(~7% of GDP) during the quarter, and contributed1.3% to Industrial growth (0.3% to GDP growth)
Industry-wise contribution to Total Industrial growth
Source : CSO; Compiled by : Finalytiks
0.3%
-0.4%
1.7%
2.1%
-0.4%
2.6%
-0.4% -0.2%
4.2%
2.2%
-1.0%
0.0%
1.0%
2.0%
3.0%
4.0%
5.0%
Q1FY13 Q2FY13 Q3FY13 Q4FY13 Q1FY14 Q2FY14 Q3FY14 Q4FY14 Q1FY15 Q2FY15
Mining & Quarrying Manufacturing
Electricity, Gas & Water supply Construction
Industry
Industry wise composition (%) of Total Industry size
Manufacturing Construction Electricity etc. Mining
56.5% 28.8% 8.0% 6.7%
Source : CSO; Compiled by : Finalytiks
0%
10%
20%
30%
40%
50%
60%
70%
80%
90%
100%
Q1
FY1
0
Q2
FY1
0
Q3
FY1
0
Q4
FY1
0
Q1
FY1
1
Q2
FY1
1
Q3
FY1
1
Q4
FY1
1
Q1
FY1
2
Q2
FY1
2
Q3
FY1
2
Q4
FY1
2
Q1
FY1
3
Q2
FY1
3
Q3
FY1
3
Q4
FY1
3
Q1
FY1
4
Q2
FY1
4
Q3
FY1
4
Q4
FY1
4
Q1
FY1
5
Q2
FY1
5

GDP : Services sectorTrade, Hotels, Transport & Communication slowed downto 3.8% YoY. The sector has been slowing since Q1FY12,and has grown below 5% in 11 out of the past 13 quarters
Finance, Insurance, Real estate & Business services slowedto 9.5%, compared to 10.4% in the previous quarter. Thissector is one of the fastest growing sectors. The sector hasgrown at above 10% for 32 out of the past 38 quarters(since the beginning of 2004-05 series). Current quartergrowth is the lowest in the past 14 quarters
Community, Social & Personal services grew @9.6%compared to 9.1% in the previous quarter. This is in linewith increase in government spending of 10.1% during thequarter
Trade, Hotels, Transport, Communication
Source : CSO; Compiled by : Finalytiks
3.9%
2.8%
3.8%
0%
2%
4%
6%
8%
10%
12%
14%
16%
18%
Q1
FY1
0
Q2
FY1
0
Q3
FY1
0
Q4
FY1
0
Q1
FY1
1
Q2
FY1
1
Q3
FY1
1
Q4
FY1
1
Q1
FY1
2
Q2
FY1
2
Q3
FY1
2
Q4
FY1
2
Q1
FY1
3
Q2
FY1
3
Q3
FY1
3
Q4
FY1
3
Q1
FY1
4
Q2
FY1
4
Q3
FY1
4
Q4
FY1
4
Q1
FY1
5
Q2
FY1
5
Finance, Insurance, Real estate, Business services
Source : CSO; Compiled by : Finalytiks
12.4%
10.4%
9.5%
0%
2%
4%
6%
8%
10%
12%
14%
16%
Q1
FY1
0
Q2
FY1
0
Q3
FY1
0
Q4
FY1
0
Q1
FY1
1
Q2
FY1
1
Q3
FY1
1
Q4
FY1
1
Q1
FY1
2
Q2
FY1
2
Q3
FY1
2
Q4
FY1
2
Q1
FY1
3
Q2
FY1
3
Q3
FY1
3
Q4
FY1
3
Q1
FY1
4
Q2
FY1
4
Q3
FY1
4
Q4
FY1
4
Q1
FY1
5
Q2
FY1
5
Community, Social & Personal services
Source : CSO; Compiled by : Finalytiks
3.3%
9.1%9.6%
-5%
0%
5%
10%
15%
20%
Q1
FY1
0
Q2
FY1
0
Q3
FY1
0
Q4
FY1
0
Q1
FY1
1
Q2
FY1
1
Q3
FY1
1
Q4
FY1
1
Q1
FY1
2
Q2
FY1
2
Q3
FY1
2
Q4
FY1
2
Q1
FY1
3
Q2
FY1
3
Q3
FY1
3
Q4
FY1
3
Q1
FY1
4
Q2
FY1
4
Q3
FY1
4
Q4
FY1
4
Q1
FY1
5
Q2
FY1
5

Services Sector : Contribution & Composition
Trade, Hotels, Transport & Communicationcontributed 1.6% out of the total services sectorgrowth of 7.1%. Despite having the highestweight among services sector (~42% of servicessector), it was the lowest contributor to growthamong the three services sectors. The sectorconstitutes 27% of the GDP and contributed just1% to GDP growth.
Financing, Insurance, Real estate & Businessservices continued to contribute strongly togrowth, contributing 3.2% to services sectorgrowth. This sector was also the top contributorto GDP growth, adding 2% out of the GDP growthof 5.3%. Since the slowdown of Trade etc., fromFY 2011-12, Financing etc. has been the topcontributor to GDP growth
Community, Social & Personal servicescontributed 2.2% to services sector growth and1.3% to total GDP growth (constitutes ~23% ofservices; ~15% of GDP).
Contribution to Services sector growth
Source : CSO; Compiled by : Finalytiks
7.2%
6.3%
7.2%
6.4%6.8% 7.1%
0%
1%
2%
3%
4%
5%
6%
7%
8%
Q1FY13 Q2FY13 Q3FY13 Q4FY13 Q1FY14 Q2FY14
Trade, Hotels, Transpt & Communi Finance, Insur, Real est & Bus serv
Community, Social & Personal Serv Services
Composition of Services Sector
Trade, Hotels, Transport & Financing, Insurance, Real Community, Social &
Communication Estate & Business Services Personal Services
42.2% 34.8% 23.0%
Source : CSO; Compiled by : Finalytiks
0%
10%
20%
30%
40%
50%
60%
70%
80%
90%
100%
Q1
FY1
0
Q2
FY1
0
Q3
FY1
0
Q4
FY1
0
Q1
FY1
1
Q2
FY1
1
Q3
FY1
1
Q4
FY1
1
Q1
FY1
2
Q2
FY1
2
Q3
FY1
2
Q4
FY1
2
Q1
FY1
3
Q2
FY1
3
Q3
FY1
3
Q4
FY1
3
Q1
FY1
4
Q2
FY1
4
Q3
FY1
4
Q4
FY1
4
Q1
FY1
5
Q2
FY1
5

GDP – Quarterly Growth : Supply-side Sector wise GDP Growth (at Factor Cost)
Q1FY13 Q2FY13 Q3FY13 Q4FY13 Q1FY14 Q2FY14 Q3FY14 Q4FY14 Q1FY15 Q2FY15
Agriculture, Forestry & Fishing 1.8% 1.8% 0.8% 1.6% 4.0% 5.0% 3.7% 6.3% 3.8% 3.2%
Mining & Quarrying -1.1% -0.1% -2.0% -4.8% -3.9% 0.0% -1.2% -0.4% 2.1% 1.9%
Manufacturing -1.1% 0.0% 2.5% 3.0% -1.2% 1.3% -1.5% -1.4% 3.5% 0.1%
Electricity, Gas & Water Supply 4.2% 1.3% 2.6% 0.9% 3.8% 7.8% 5.0% 7.2% 10.2% 8.7%
Construction 2.8% -1.9% 1.0% 2.4% 1.1% 4.4% 0.6% 0.7% 4.8% 4.6%
Total Industry 0.3% -0.4% 1.7% 2.1% -0.4% 2.6% -0.4% -0.2% 4.2% 2.2%
Trade, Hotels, Transport & Communication 4.0% 5.6% 5.9% 4.8% 1.6% 3.6% 2.9% 3.9% 2.8% 3.8%
Financing, Insurance, Real Estate & Business Services 11.7% 10.6% 10.2% 11.2% 12.9% 12.1% 14.1% 12.4% 10.4% 9.5%
Community, Social & Personal Services 7.6% 7.4% 4.0% 2.8% 10.6% 3.6% 5.7% 3.3% 9.1% 9.6%
Total Services 7.2% 7.6% 6.9% 6.3% 7.2% 6.3% 7.2% 6.4% 6.8% 7.1%
GDP At Factor Cost 4.5% 4.6% 4.4% 4.4% 4.7% 5.2% 4.6% 4.6% 5.7% 5.3%
Red highlight means that growth rate has improved compared to the previous quarter, Green highlight indicates that it has decreased
Sector wise contribution to GDP Growth (at Factor Cost)Q1FY13 Q2FY13 Q3FY13 Q4FY13 Q1FY14 Q2FY14 Q3FY14 Q4FY14 Q1FY15 Q2FY15
Agriculture, Forestry & Fishing 0.3% 0.2% 0.1% 0.2% 0.5% 0.6% 0.6% 0.9% 0.5% 0.4%
Mining & Quarrying 0.0% 0.0% 0.0% -0.1% -0.1% 0.0% 0.0% 0.0% 0.0% 0.0%
Manufacturing -0.2% 0.0% 0.4% 0.5% -0.2% 0.2% -0.2% -0.2% 0.5% 0.0%
Electricity, Gas & Water Supply 0.1% 0.0% 0.0% 0.0% 0.1% 0.2% 0.1% 0.1% 0.2% 0.2%
Construction 0.2% -0.1% 0.1% 0.2% 0.1% 0.3% 0.0% 0.1% 0.4% 0.3%
Total Industry contribution to GDP 0.1% -0.1% 0.5% 0.6% -0.1% 0.7% -0.1% -0.1% 1.1% 0.6%
Trade, Hotels, Transport & Communication 1.1% 1.5% 1.5% 1.3% 0.4% 1.0% 0.8% 1.1% 0.7% 1.0%
Financing, Insurance, Real Estate And Business Services 2.1% 2.0% 1.8% 1.9% 2.5% 2.4% 2.6% 2.3% 2.2% 2.0%
Community, Social & Personal Services 0.9% 1.0% 0.5% 0.4% 1.3% 0.5% 0.7% 0.4% 1.1% 1.3%
Total Services sector contribution to GDP 4.1% 4.5% 3.8% 3.6% 4.2% 3.9% 4.0% 3.8% 4.1% 4.4%
GDP At Factor Cost (Total) 4.5% 4.6% 4.4% 4.4% 4.7% 5.2% 4.6% 4.6% 5.7% 5.3%
Red highlight means that contribution to GDP growth rate has improved compared to the previous quarter, Green highlight indicates that it has decreased
Source : CSO; Compiled by : Finalytiks

GDP – Yearly Growth : Supply-side Sector wise GDP Growth (at Factor Cost)
Industry/Items 2006-07 2007-08 2008-09 2009-10 2010-11 2011-12 2012-13 2013-14
Agriculture, Forestry & Fishing 4.2% 5.8% 0.1% 0.8% 8.6% 5.0% 1.4% 4.7%
Mining & Quarrying 7.5% 3.7% 2.1% 5.9% 6.5% 0.1% -2.2% -1.4%
Manufacturing 14.3% 10.3% 4.3% 11.3% 8.9% 7.4% 1.1% -0.7%
Electricity, Gas & Water Supply 9.3% 8.3% 4.6% 6.2% 5.3% 8.4% 2.3% 5.9%
Construction 10.3% 10.8% 5.3% 6.7% 5.7% 10.8% 1.1% 1.6%
Total Industry 12.2% 9.7% 4.4% 9.2% 7.6% 7.8% 1.0% 0.4%
Trade, Hotels, Transport & Communication 11.6% 10.9% 7.5% 10.4% 12.2% 4.3% 5.1% 3.0%
Financing, Insurance, Real Estate And Business Services 14.0% 12.0% 12.0% 9.7% 10.0% 11.3% 10.9% 12.9%
Community, Social & Personal Services 2.8% 6.9% 12.5% 11.7% 4.2% 4.9% 5.3% 5.6%
Total Services 10.1% 10.3% 10.0% 10.5% 9.7% 6.6% 7.0% 6.8%
GDP At Factor Cost 9.6% 9.3% 6.7% 8.6% 8.9% 6.7% 4.5% 4.7%
Red highlight means that growth rate has improved compared to the previous year, Green highlight indicates that it has decreased
Sector wise contribution to GDP Growth (at Factor Cost)2006-07 2007-08 2008-09 2009-10 2010-11 2011-12 2012-13 2013-14
Agriculture, Forestry & Fishing 0.8% 1.0% 0.0% 0.1% 1.3% 0.7% 0.2% 0.7%
Mining & Quarrying 0.2% 0.1% 0.1% 0.1% 0.2% 0.0% 0.0% 0.0%
Manufacturing 2.2% 1.6% 0.7% 1.8% 1.4% 1.2% 0.2% -0.1%
Electricity, Gas & Water Supply 0.2% 0.2% 0.1% 0.1% 0.1% 0.2% 0.0% 0.1%
Construction 0.8% 0.9% 0.4% 0.5% 0.4% 0.8% 0.1% 0.1%
Total Industry contribution to GDP 3.4% 2.8% 1.3% 2.6% 2.1% 2.2% 0.3% 0.1%
Trade, Hotels, Transport & Communication 2.9% 2.8% 1.9% 2.7% 3.2% 1.2% 1.4% 0.8%
Financing, Insurance, Real Estate And Business Services 2.1% 1.9% 1.9% 1.6% 1.7% 2.0% 2.0% 2.5%
Community, Social & Personal Services 0.4% 0.9% 1.6% 1.5% 0.6% 0.6% 0.7% 0.7%
Total Services sector contribution to GDP 5.4% 5.5% 5.4% 5.9% 5.5% 3.8% 4.0% 4.0%
GDP At Factor Cost (Total) 9.6% 9.3% 6.7% 8.6% 8.9% 6.7% 4.5% 4.7%
Red highlight means that contribution to GDP growth rate has improved compared to the previous year, Green highlight indicates that it has decreased
Source : CSO; Compiled by : Finalytiks

GDP : Expenditure (Demand-side)
Government spending increased by 10.1% during thequarter, compared to 8.8% in the previous quarter.Government expenditure constituted ~11% of theeconomy
Private consumption continued to disappoint with aslow growth of 5.8% compared to 5.6% recorded in theprevious quarter. Private consumption constituted~60% of GDP
Gross Fixed Capital Formation was flat, compared to avery impressive 7% in the previous quarter
Contribution of each demand-side component to Total GDP growth (at Market Price)
Source : CSO; Compiled by : Finalytiks
4.2% 5.2%
4.4%
6.1% 5.9% 6.0%
-6%
-4%
-2%
0%
2%
4%
6%
8%
10%
Q1FY13 Q2FY13 Q3FY13 Q4FY13 Q1FY14 Q2FY14
Government FCE Private FCE Gross Fixed CF
Change in stock Valuables Net exports
Discrepancies GDP at market prices
Composition of GDP from Demand (expenditure) side
Source : CSO; Compiled by : Finalytiks
-20%
0%
20%
40%
60%
80%
100%
120%
-20%
0%
20%
40%
60%
80%
100%
120%
20
09-1
0: Q
1
20
09-1
0: Q
2
20
09-1
0: Q
3
20
09-1
0: Q
4
20
10-1
1: Q
1
20
10-1
1: Q
2
20
10-1
1: Q
3
20
10-1
1: Q
4
20
11-1
2: Q
1
20
11-1
2: Q
2
20
11-1
2: Q
3
20
11-1
2: Q
4
20
12-1
3: Q
1
20
12-1
3: Q
2
20
12-1
3: Q
3
20
12-1
3: Q
4
20
13-1
4: Q
1
20
13-1
4: Q
2
20
13-1
4: Q
3
20
13-1
4: Q
4
20
14-1
5: Q
1
20
14-1
5: Q
2
Government FCE Private FCE Gross Fixed Capital Formation Others Net exports
Q1 FY15 Q2 FY15 Q1 FY15 Q2 FY15 Q1 FY15 Q2 FY15
8.8% 10.1% 5.6% 5.8% 7.0% 0.0%
Q1 FY15 Q2 FY15 Q1 FY15 Q2 FY15 Q1 FY15 Q2 FY15
11.5% -1.6% -0.4% 1.1% -30.2% 13.4%
Imports Net Exports (Negative)
p
p p q
q p
Expenditure Based Classification (at Market prices)
Government Final
Consumption Expenditure
Private Final
Consumption Expenditure
Gross Fixed
Capital Formation
Exports

GDP : Government expenditureGovernment expenditure picked up furtherduring the quarter
Higher government expenditure had a positiveimpact on Community, Social & Personalservices, which grew by 9.6%, compared to 9.1%in the previous quarter
Lower spending by the government to containfiscal deficit in the fourth quarter of FY 2013-14led to government consumption contracting by0.4% in Q4FY14
Fiscal deficit has reached ~90% of the full yearestimated deficit as at the end of October 2014.This is at the same level as at the end of October2013
Government Final Consumption Expenditure
Source : CSO; Compiled by : Finalytiks
-0.4%
8.8%
10.1%
-5%
0%
5%
10%
15%
20%
25%
30%
Q1
FY1
0
Q2
FY1
0
Q3
FY1
0
Q4
FY1
0
Q1
FY1
1
Q2
FY1
1
Q3
FY1
1
Q4
FY1
1
Q1
FY1
2
Q2
FY1
2
Q3
FY1
2
Q4
FY1
2
Q1
FY1
3
Q2
FY1
3
Q3
FY1
3
Q4
FY1
3
Q1
FY1
4
Q2
FY1
4
Q3
FY1
4
Q4
FY1
4
Q1
FY1
5
Q2
FY1
5
Fiscal deficit build up (% of Full year fiscal deficit)
Source : Ministry of Finance; Compiled by : Finalytiks
75.0%
90.1%
89.6%
0%
20%
40%
60%
80%
100%
120%
Apr May Jun Jul Aug Sep Oct Nov Dec Jan Feb Mar
2012-13 2013-14 2014-15
Govt expenditure Vs Community, Social & Personal services
Source : CSO; Compiled by : Finalytiks
-0.4%
8.8%
10.1%
3.3%
9.1%
9.6%
-5%
0%
5%
10%
15%
20%
25%
30%
Q1
FY1
0
Q2
FY1
0
Q3
FY1
0
Q4
FY1
0
Q1
FY1
1
Q2
FY1
1
Q3
FY1
1
Q4
FY1
1
Q1
FY1
2
Q2
FY1
2
Q3
FY1
2
Q4
FY1
2
Q1
FY1
3
Q2
FY1
3
Q3
FY1
3
Q4
FY1
3
Q1
FY1
4
Q2
FY1
4
Q3
FY1
4
Q4
FY1
4
Q1
FY1
5
Q2
FY1
5
Govt final consumption exp Community, Social & Personal serv

GDP : Private consumptionPrivate consumption was the black-spot in theGDP numbers, growing at 5.8% growth in thecurrent quarter, compared to 5.6% in the previousquarter
12-month moving average shows a growing trend
Private consumption constitutes ~60% of theGDP, when viewed from the demand-side, andhence is the most important factor in GDPgrowth. Lack of major turn-around in privatespending is a cause of worry
After ruling at high levels for 2 years, retail-levelinflation has come down of late
With RBI determined to contain inflationarypressures, interest rates are yet to come down.Hence credit-based purchases might be gettingpostponed, as consumers are unwilling to take onhigher-rate debt
Inflation is below RBI’s Jan 2015 target of 8%. RBIleft interest rates unchanged in the previousmonetary policy review, citing upside risks to itsinflation target. RBI is not expected to cut interestrates this year, but sounded dovish in the lastpolicy briefing. The market widely expects deepcuts in policy rates starting 1HCY15
Private Final Consumption Expenditure & 12-month moving average
Source : CSO; Compiled by : Finalytiks
5.6%5.8%
4.9%5.6%
0%
2%
4%
6%
8%
10%
12%
14%
Q1
FY1
0
Q2
FY1
0
Q3
FY1
0
Q4
FY1
0
Q1
FY1
1
Q2
FY1
1
Q3
FY1
1
Q4
FY1
1
Q1
FY1
2
Q2
FY1
2
Q3
FY1
2
Q4
FY1
2
Q1
FY1
3
Q2
FY1
3
Q3
FY1
3
Q4
FY1
3
Q1
FY1
4
Q2
FY1
4
Q3
FY1
4
Q4
FY1
4
Q1
FY1
5
Q2
FY1
5
Private Final Consumption Expenditure 12-month moving average growth

GDP : Fixed Capital FormationGross Fixed Capital Formation, did not grow inthe current quarter, compared to a growth of 7%in the previous quarter.
12-month moving average point to upwardmovement, from near-contraction growth rates,experienced in the past two years
Private spending has to pick up, to giveconfidence for corporates to invest in capex
Gross Fixed Capital Formation & 12-month moving average
Source : CSO; Compiled by : Finalytiks
-0.9%
7.0%
0.0%
1.4%
-5%
0%
5%
10%
15%
20%
25%
Q1
FY1
0
Q2
FY1
0
Q3
FY1
0
Q4
FY1
0
Q1
FY1
1
Q2
FY1
1
Q3
FY1
1
Q4
FY1
1
Q1
FY1
2
Q2
FY1
2
Q3
FY1
2
Q4
FY1
2
Q1
FY1
3
Q2
FY1
3
Q3
FY1
3
Q4
FY1
3
Q1
FY1
4
Q2
FY1
4
Q3
FY1
4
Q4
FY1
4
Q1
FY1
5
Q2
FY1
5
Gross Fixed Capital Formation 12-month moving average growth

GDP : Exports & ImportsExports, after growing at double digits for theconsecutive 4 quarters, contracted by 1.6% duringthe quarter
Imports grew at 1.1%, after shrinking for 3consecutive quarters
Net exports (which is negative, i.e., on net basis,India is importing goods) have widened, withimports growing and exports contracting
Exports & Imports
Source : CSO; Compiled by : Finalytiks
11.5%
-1.6%
-0.4%1.1%
-20%
-10%
0%
10%
20%
30%
40%Q
1FY
10
Q2
FY1
0
Q3
FY1
0
Q4
FY1
0
Q1
FY1
1
Q2
FY1
1
Q3
FY1
1
Q4
FY1
1
Q1
FY1
2
Q2
FY1
2
Q3
FY1
2
Q4
FY1
2
Q1
FY1
3
Q2
FY1
3
Q3
FY1
3
Q4
FY1
3
Q1
FY1
4
Q2
FY1
4
Q3
FY1
4
Q4
FY1
4
Q1
FY1
5
Q2
FY1
5
Exports Imports
Net exports (Negative)
Source : CSO; Compiled by : Finalytiks
-47.5%
-30.2%
13.4%
-60%
-40%
-20%
0%
20%
40%
60%
80%
100%
120%
Q1
FY1
0
Q2
FY1
0
Q3
FY1
0
Q4
FY1
0
Q1
FY1
1
Q2
FY1
1
Q3
FY1
1
Q4
FY1
1
Q1
FY1
2
Q2
FY1
2
Q3
FY1
2
Q4
FY1
2
Q1
FY1
3
Q2
FY1
3
Q3
FY1
3
Q4
FY1
3
Q1
FY1
4
Q2
FY1
4
Q3
FY1
4
Q4
FY1
4
Q1
FY1
5
Q2
FY1
5

GDP : Exports – Rupee & Growth of Major economies
Indian Rupee (INR) has depreciated significantlyover the past 2 years. Though as per RealEffective Exchange Rates (36-countries, trade-weighted), INR continues to be in over-valuedterritory, the degree of over-valuation hassignificantly reduced (REER value more than 100shows over-valuation)
With EU growth in positive territory (YoY basis, to enable comparison with India) major developed countries have recovered from recession, and the growth rates have stabilised
Despite Japan falling in to recession recently, pick-up in EU & US augurs well for the export sector, with INR depreciation adding to the cost-competitiveness of Indian goods.
Major Global Economics : GDP growth YoY
Source: OECD
-8%
-6%
-4%
-2%
0%
2%
4%
6%
8%
10%
12%
Q1
-200
9
Q2
-200
9
Q3
-200
9
Q4
-200
9
Q1
-201
0
Q2
-201
0
Q3
-201
0
Q4
-201
0
Q1
-201
1
Q2
-201
1
Q3
-201
1
Q4
-201
1
Q1
-201
2
Q2
-201
2
Q3
-201
2
Q4
-201
2
Q1
-201
3
Q2
-201
3
Q3
-201
3
Q4
-201
3
Q1
-201
4
Q2
-201
4
Q3
-201
4
G20 China EU (28 countries) US
REER Vs Nominal rates
Source: RBI, Compiled by : Finalytiks
90
95
100
105
110
115
120 30
35
40
45
50
55
60
65
70
Ap
r-0
4
Oct
-04
Ap
r-0
5
Oct
-05
Ap
r-0
6
Oct
-06
Ap
r-0
7
Oct
-07
Ap
r-0
8
Oct
-08
Ap
r-0
9
Oct
-09
Ap
r-1
0
Oct
-10
Ap
r-1
1
Oct
-11
Ap
r-1
2
Oct
-12
Ap
r-1
3
Oct
-13
Ap
r-1
4
Oct
-14
INR/USD Nominal (LHS) CPI based REER (RHS)
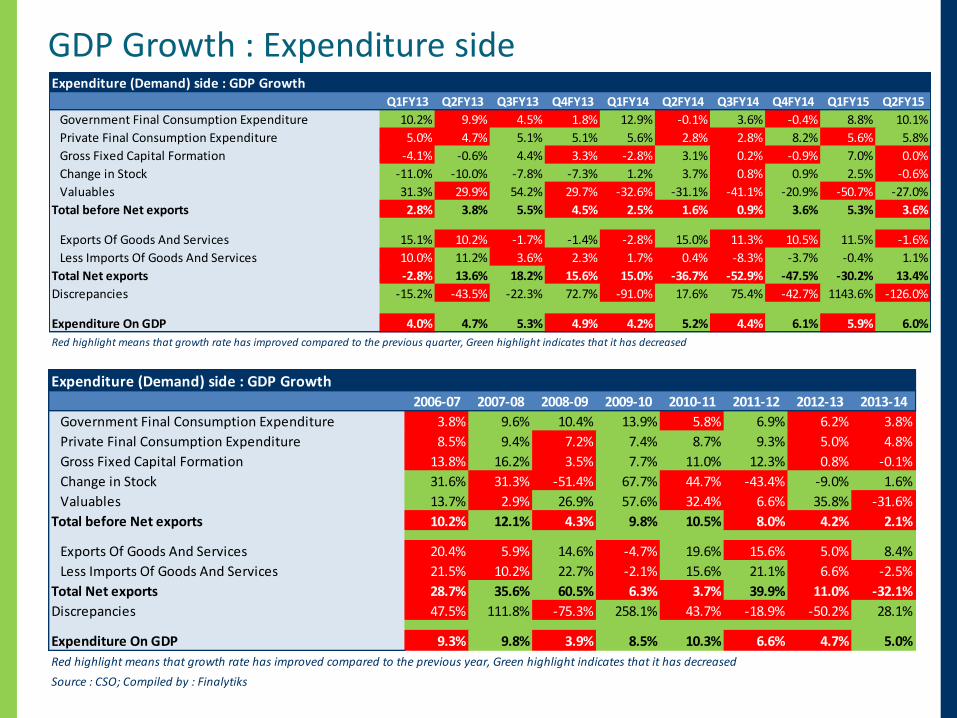
GDP Growth : Expenditure sideExpenditure (Demand) side : GDP Growth
Q1FY13 Q2FY13 Q3FY13 Q4FY13 Q1FY14 Q2FY14 Q3FY14 Q4FY14 Q1FY15 Q2FY15
Government Final Consumption Expenditure 10.2% 9.9% 4.5% 1.8% 12.9% -0.1% 3.6% -0.4% 8.8% 10.1%
Private Final Consumption Expenditure 5.0% 4.7% 5.1% 5.1% 5.6% 2.8% 2.8% 8.2% 5.6% 5.8%
Gross Fixed Capital Formation -4.1% -0.6% 4.4% 3.3% -2.8% 3.1% 0.2% -0.9% 7.0% 0.0%
Change in Stock -11.0% -10.0% -7.8% -7.3% 1.2% 3.7% 0.8% 0.9% 2.5% -0.6%
Valuables 31.3% 29.9% 54.2% 29.7% -32.6% -31.1% -41.1% -20.9% -50.7% -27.0%
Total before Net exports 2.8% 3.8% 5.5% 4.5% 2.5% 1.6% 0.9% 3.6% 5.3% 3.6%
Exports Of Goods And Services 15.1% 10.2% -1.7% -1.4% -2.8% 15.0% 11.3% 10.5% 11.5% -1.6%
Less Imports Of Goods And Services 10.0% 11.2% 3.6% 2.3% 1.7% 0.4% -8.3% -3.7% -0.4% 1.1%
Total Net exports -2.8% 13.6% 18.2% 15.6% 15.0% -36.7% -52.9% -47.5% -30.2% 13.4%
Discrepancies -15.2% -43.5% -22.3% 72.7% -91.0% 17.6% 75.4% -42.7% 1143.6% -126.0%
Expenditure On GDP 4.0% 4.7% 5.3% 4.9% 4.2% 5.2% 4.4% 6.1% 5.9% 6.0%
Red highlight means that growth rate has improved compared to the previous quarter, Green highlight indicates that it has decreased
Expenditure (Demand) side : GDP Growth2006-07 2007-08 2008-09 2009-10 2010-11 2011-12 2012-13 2013-14
Government Final Consumption Expenditure 3.8% 9.6% 10.4% 13.9% 5.8% 6.9% 6.2% 3.8%
Private Final Consumption Expenditure 8.5% 9.4% 7.2% 7.4% 8.7% 9.3% 5.0% 4.8%
Gross Fixed Capital Formation 13.8% 16.2% 3.5% 7.7% 11.0% 12.3% 0.8% -0.1%
Change in Stock 31.6% 31.3% -51.4% 67.7% 44.7% -43.4% -9.0% 1.6%
Valuables 13.7% 2.9% 26.9% 57.6% 32.4% 6.6% 35.8% -31.6%
Total before Net exports 10.2% 12.1% 4.3% 9.8% 10.5% 8.0% 4.2% 2.1%
Exports Of Goods And Services 20.4% 5.9% 14.6% -4.7% 19.6% 15.6% 5.0% 8.4%
Less Imports Of Goods And Services 21.5% 10.2% 22.7% -2.1% 15.6% 21.1% 6.6% -2.5%
Total Net exports 28.7% 35.6% 60.5% 6.3% 3.7% 39.9% 11.0% -32.1%
Discrepancies 47.5% 111.8% -75.3% 258.1% 43.7% -18.9% -50.2% 28.1%
Expenditure On GDP 9.3% 9.8% 3.9% 8.5% 10.3% 6.6% 4.7% 5.0%
Red highlight means that growth rate has improved compared to the previous year, Green highlight indicates that it has decreased
Source : CSO; Compiled by : Finalytiks
Appendix / DisclaimerAll growth rates / changes mentioned in this article are changes over the same period of previous year (i.e., year-on-year). This is because, India does not publish seasonally adjusted numbers of GDP / inflation
Disclaimer : The information set forth herein has been obtained or derived from sources generally available to the publicand believed by the author to be reliable, but the author does not make any representation or warranty, express orimplied, as to its accuracy or completeness. The information is not intended to be used as the basis of any investmentdecisions by any person or entity. This information does not constitute investment advice, nor is it an offer or asolicitation of an offer to buy or sell any security. Readers are advised to do their own research before undertakinginvestment actions.
Your feedback is very valuable to me. Kindly send your feedback to [email protected]

FINALYTIKS
INDIA-in-FOCUS