Embed Size (px)
Citation preview
ING Orange
RGB= 255, 98, 0
ING Light Grey
RGB= 168, 168, 168
ING Indigo
RGB= 82, 81, 153
ING Sky
RGB= 96, 166, 218
Colour Guidelines
ING Fuchsia
RGB= 171, 0, 102
ING Lime
RGB= 208, 217, 60
ING Leaf
RGB= 52, 150, 81
ING Mid Grey
RGB= 118, 118, 118
Text Colour
RGB= 51, 51, 51
Full Year 2015 Results
Ralph Hamers, CEO ING Group
ING Bank posts 2015 underlying net profit of EUR 4,219 million
Amsterdam • 4 February 2016

ING Orange
RGB= 255, 98, 0
ING Light Grey
RGB= 168, 168, 168
ING Indigo
RGB= 82, 81, 153
ING Sky
RGB= 96, 166, 218
Colour Guidelines
ING Fuchsia
RGB= 171, 0, 102
ING Lime
RGB= 208, 217, 60
ING Leaf
RGB= 52, 150, 81
ING Mid Grey
RGB= 118, 118, 118
Text Colour
RGB= 51, 51, 51
No content below the grey line
2
…resulting in strong results…
• Underlying net result ING Bank rose to EUR 4,219 mln in 2015, up 23.2% from 2014
• Fourth quarter 2015 underlying result before tax ING Bank EUR 1,202 mln
…boosting our capital ratios...
• Fully-loaded CET 1 ratio ING Group rose from 12.3% to 12.7%, above the regulatory fully-loaded requirement, currently 12.5%
• Pro-forma Group CET1 on a fully-loaded basis of 13.4%
Continued growth in customer numbers and lending…
• Our retail customer base grew by over 1.4 mln to 34.4 mln at year-end
• Our core lending franchises grew by EUR 21.7 bln or 4.2% in 2015, in line with our guidance
…and enabling us to pay an attractive dividend
• We propose to pay a full-year dividend of EUR 2,515 mln or EUR 0.65 per share
• We aim to pay a progressive dividend over time
Strong full year results boost capital and enable us to pay an attractive dividend
ING Orange
RGB= 255, 98, 0
ING Light Grey
RGB= 168, 168, 168
ING Indigo
RGB= 82, 81, 153
ING Sky
RGB= 96, 166, 218
Colour Guidelines
ING Fuchsia
RGB= 171, 0, 102
ING Lime
RGB= 208, 217, 60
ING Leaf
RGB= 52, 150, 81
ING Mid Grey
RGB= 118, 118, 118
Text Colour
RGB= 51, 51, 51
No content below the grey line
ING continues to make progress on strategic initiatives
3
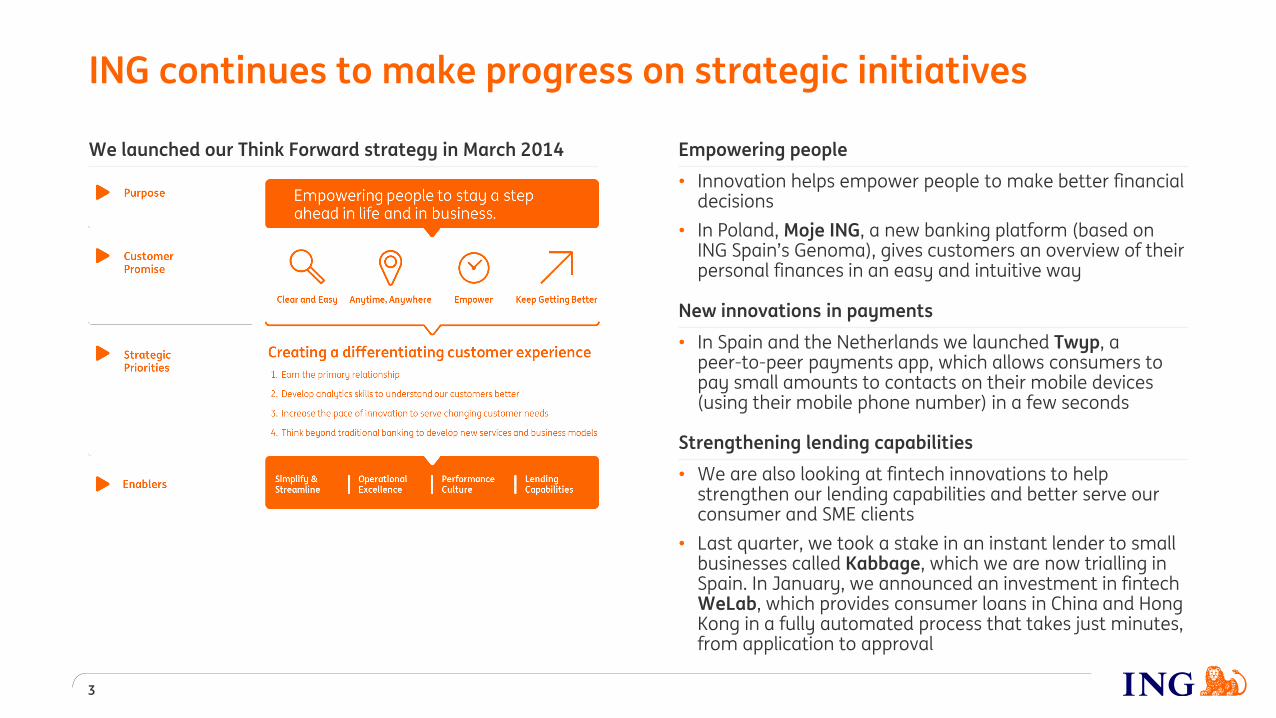
Empowering people
• Innovation helps empower people to make better financial decisions
• In Poland, Moje ING, a new banking platform (based on ING Spain’s Genoma), gives customers an overview of their personal finances in an easy and intuitive way
New innovations in payments
• In Spain and the Netherlands we launched Twyp, a peer-to-peer payments app, which allows consumers to pay small amounts to contacts on their mobile devices (using their mobile phone number) in a few seconds
Strengthening lending capabilities
• We are also looking at fintech innovations to help strengthen our lending capabilities and better serve our consumer and SME clients
• Last quarter, we took a stake in an instant lender to small businesses called Kabbage, which we are now trialling in Spain. In January, we announced an investment in fintech WeLab, which provides consumer loans in China and Hong Kong in a fully automated process that takes just minutes, from application to approval
We launched our Think Forward strategy in March 2014
ING Orange
RGB= 255, 98, 0
ING Light Grey
RGB= 168, 168, 168
ING Indigo
RGB= 82, 81, 153
ING Sky
RGB= 96, 166, 218
Colour Guidelines
ING Fuchsia
RGB= 171, 0, 102
ING Lime
RGB= 208, 217, 60
ING Leaf
RGB= 52, 150, 81
ING Mid Grey
RGB= 118, 118, 118
Text Colour
RGB= 51, 51, 51
No content below the grey line
Our customer growth continued in 2015 …
4
31.7
33.0
34.4
2013 2014 2015
7.88.4
8.9
>10
2013 2014 2015 Ambition 2017
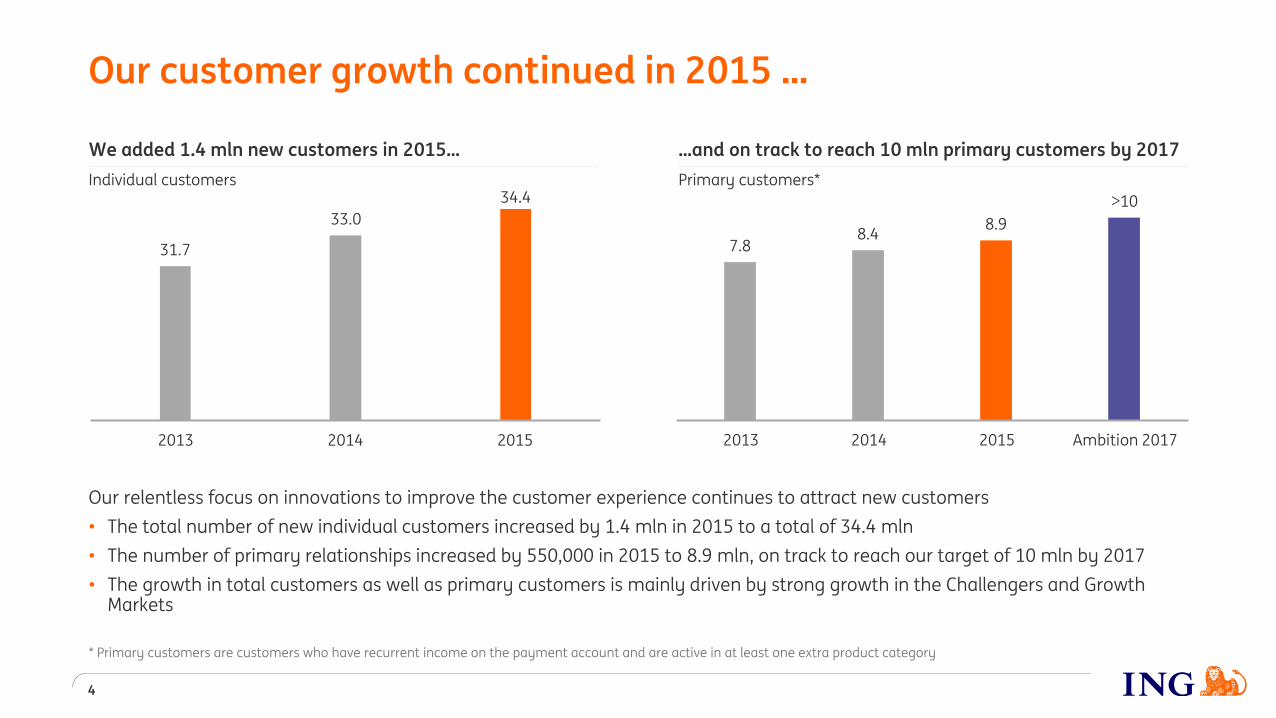
* Primary customers are customers who have recurrent income on the payment account and are active in at least one extra product category
Our relentless focus on innovations to improve the customer experience continues to attract new customers
• The total number of new individual customers increased by 1.4 mln in 2015 to a total of 34.4 mln
• The number of primary relationships increased by 550,000 in 2015 to 8.9 mln, on track to reach our target of 10 mln by 2017
• The growth in total customers as well as primary customers is mainly driven by strong growth in the Challengers and Growth Markets
We added 1.4 mln new customers in 2015…
Individual customers
…and on track to reach 10 mln primary customers by 2017
Primary customers*

ING Orange
RGB= 255, 98, 0
ING Light Grey
RGB= 168, 168, 168
ING Indigo
RGB= 82, 81, 153
ING Sky
RGB= 96, 166, 218
Colour Guidelines
ING Fuchsia
RGB= 171, 0, 102
ING Lime
RGB= 208, 217, 60
ING Leaf
RGB= 52, 150, 81
ING Mid Grey
RGB= 118, 118, 118
Text Colour
RGB= 51, 51, 51
No content below the grey line
…resulting in ongoing deposit and loan growth
5
475489
509
2013 2014 2015
499514
533
2013 2014 2015
85%
13% 2%
Retail Banking
Wholesale Banking
Corporate Line
Customer deposits (in EUR bln) Customer lending (in EUR bln)
Customer deposits, breakdown (in%) Attractive funding profile
• 61% of the balance sheet is funded by customer deposits
• 85% of customer deposits is retail-based
• Comfortable loan-to-deposit ratio of 1.04 as per 31 December 2015

ING Orange
RGB= 255, 98, 0
ING Light Grey
RGB= 168, 168, 168
ING Indigo
RGB= 82, 81, 153
ING Sky
RGB= 96, 166, 218
Colour Guidelines
ING Fuchsia
RGB= 171, 0, 102
ING Lime
RGB= 208, 217, 60
ING Leaf
RGB= 52, 150, 81
ING Mid Grey
RGB= 118, 118, 118
Text Colour
RGB= 51, 51, 51
No content below the grey line
532.7
513.5
2.81.5
3.810.9
7.8
2.51.7
-3.1-3.8-0.3
-1.7
-2.9
31/12/14 Retail NL Retail
Belgium
Retail
Germany
Retail
Other
CGM*
WB IL* WB GL&TS*WB Other* Corporate
Line
WUB
run-off /
transfers**
Lease and
other
run-off /
sales***
Bank
Treasury
FX / Other 31/12/15
Customer lending 2015 (in EUR bln)
Core lending franchises grew by EUR 21.7 bln or 4.2% in 2015
6
Core lending businesses: EUR 21.7 bln
• Our core lending franchises grew by EUR 21.7 bln or 4.2% in 2015, in line with our guidance
• Wholesale Banking increased by EUR 13.0 bln driven by Industry Lending and Transaction Services
• Retail Banking outside of the Netherlands increased by EUR 11.9 bln, both in mortgage and non-mortgage lending
* C&GM is Challenger & Growth Markets; IL is Industry Lending; GL&TS is General Lending & Transaction Services; Other includes Financial Markets ** WUB run-off was EUR -2.2 bln and transfer to NN was EUR -1.6 bln; *** Lease run-off was EUR -1.4 bln in 2015; Other run-off /sales was EUR -1.7 bln and refers to Australian white label mortgage portfolio that was partly sold in 1H15
ING Orange
RGB= 255, 98, 0
ING Light Grey
RGB= 168, 168, 168
ING Indigo
RGB= 82, 81, 153
ING Sky
RGB= 96, 166, 218
Colour Guidelines
ING Fuchsia
RGB= 171, 0, 102
ING Lime
RGB= 208, 217, 60
ING Leaf
RGB= 52, 150, 81
ING Mid Grey
RGB= 118, 118, 118
Text Colour
RGB= 51, 51, 51
No content below the grey line
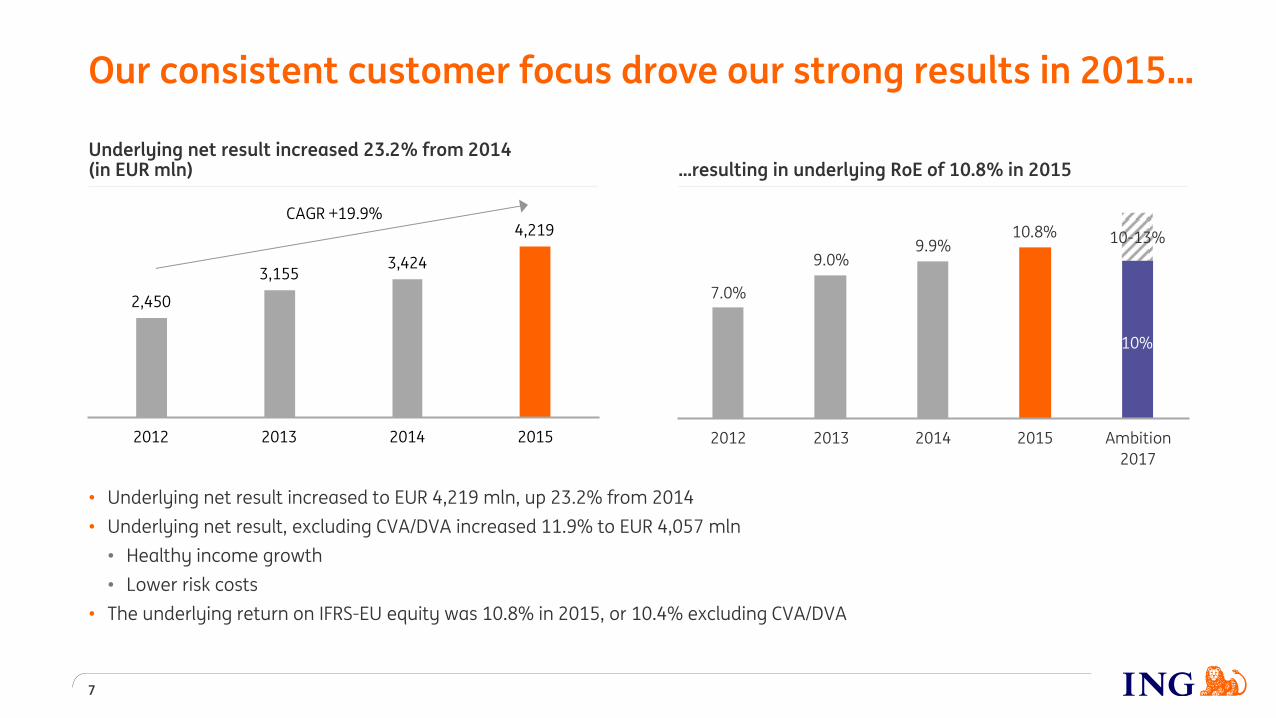
Underlying net result increased 23.2% from 2014 (in EUR mln)
10%
10.8%9.9%
7.0%
9.0%
2012 2013 2014 2015 Ambition
2017
2,450
3,1553,424
4,219
2012 2013 2014 2015
CAGR +19.9%
…resulting in underlying RoE of 10.8% in 2015
• Underlying net result increased to EUR 4,219 mln, up 23.2% from 2014
• Underlying net result, excluding CVA/DVA increased 11.9% to EUR 4,057 mln
• Healthy income growth
• Lower risk costs
• The underlying return on IFRS-EU equity was 10.8% in 2015, or 10.4% excluding CVA/DVA
7
Our consistent customer focus drove our strong results in 2015…
10-13%
ING Orange
RGB= 255, 98, 0
ING Light Grey
RGB= 168, 168, 168
ING Indigo
RGB= 82, 81, 153
ING Sky
RGB= 96, 166, 218
Colour Guidelines
ING Fuchsia
RGB= 171, 0, 102
ING Lime
RGB= 208, 217, 60
ING Leaf
RGB= 52, 150, 81
ING Mid Grey
RGB= 118, 118, 118
Text Colour
RGB= 51, 51, 51
No content below the grey line
2.1 2.3 1.6 1.3
74 83
55 44
2012 2013 2014 2015
Loan losses (in EUR bln)bps (of RWA)
15.0 15.2 15.616.3
2012 2013 2014 2015
11.0 11.3 11.612.2
2012 2013 2014 2015
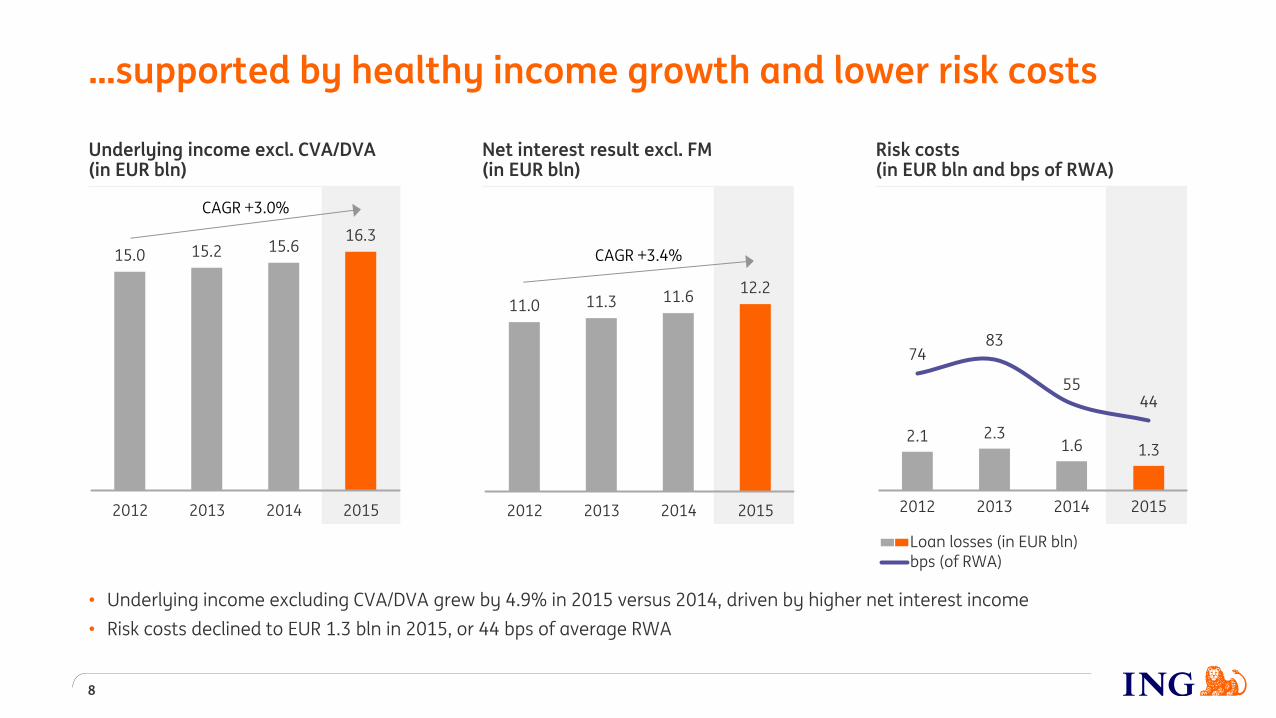
Risk costs (in EUR bln and bps of RWA)
Net interest result excl. FM (in EUR bln)
Underlying income excl. CVA/DVA (in EUR bln)
…supported by healthy income growth and lower risk costs
8
CAGR +3.4%
CAGR +3.0%
• Underlying income excluding CVA/DVA grew by 4.9% in 2015 versus 2014, driven by higher net interest income
• Risk costs declined to EUR 1.3 bln in 2015, or 44 bps of average RWA

ING Orange
RGB= 255, 98, 0
ING Light Grey
RGB= 168, 168, 168
ING Indigo
RGB= 82, 81, 153
ING Sky
RGB= 96, 166, 218
Colour Guidelines
ING Fuchsia
RGB= 171, 0, 102
ING Lime
RGB= 208, 217, 60
ING Leaf
RGB= 52, 150, 81
ING Mid Grey
RGB= 118, 118, 118
Text Colour
RGB= 51, 51, 51
No content below the grey line
Pre-tax result ING Bank* (in EUR mln)
9
4,997
5,734
2014 2015
+14.8%
Pre-tax result Retail Banking (in EUR mln)
Pre-tax result Wholesale Banking* (in EUR mln)
* Excluding CVA/DVA
Breakdown pre-tax result Retail Banking
Breakdown pre-tax result Wholesale Banking*
3,3493,928
2014 2015
+17.3%
Strong contribution from both Retail and Wholesale Banking
2,202 2,379
2014 2015
+8.0%
38%
21%
26%
15%
Netherlands
Belgium
Germany
Other Challengers & Growth Markets
61% 20%
13% 6%
Industry Lending
General Lending & Transaction Services
Financial Markets*
Bank Treasury, RE & Other

ING Orange
RGB= 255, 98, 0
ING Light Grey
RGB= 168, 168, 168
ING Indigo
RGB= 82, 81, 153
ING Sky
RGB= 96, 166, 218
Colour Guidelines
ING Fuchsia
RGB= 171, 0, 102
ING Lime
RGB= 208, 217, 60
ING Leaf
RGB= 52, 150, 81
ING Mid Grey
RGB= 118, 118, 118
Text Colour
RGB= 51, 51, 51
No content below the grey line
72% 6%
15%
7%
Mortgages
Consumer loans
Wholesale Banking
Other / Bank Treasury
597
771
1,012
2013 2014 2015
Retail Banking Wholesale Banking
ING Germany’s pre-tax profit increased to EUR 1,152 mln in 2015, reaching above EUR 1 bln for the first time
10
866
634
CAGR +34.8%
43%
22%
13%
12%
7% 3%
Savings
Mortgages
Consumer loans
WB
Investm. products
Payment accounts
765 837
917 51%
47% 43%
2013 2014 2015
Expenses Cost/income ratio
…resulting in a diversified income profile…
…with strong cost discipline, while selectively investing in the business
Cost/income ratio (%)
1,152
Pre-tax profit ING Germany above EUR 1 bln for the first time (in EUR mln)
Diversifying our Balance Sheet…
Customer lending (in %)
2013 2014 2015
WB lending Consumer lending
…by growing consumer lending and Wholesale Banking lending… (in EUR bln)
CAGR +47%
8.9 12.2
19.2

ING Orange
RGB= 255, 98, 0
ING Light Grey
RGB= 168, 168, 168
ING Indigo
RGB= 82, 81, 153
ING Sky
RGB= 96, 166, 218
Colour Guidelines
ING Fuchsia
RGB= 171, 0, 102
ING Lime
RGB= 208, 217, 60
ING Leaf
RGB= 52, 150, 81
ING Mid Grey
RGB= 118, 118, 118
Text Colour
RGB= 51, 51, 51
No content below the grey line
0.2%0.1%0.3%-0.1%
12.3%12.7%
13.4%
3Q15 Net
profit
Equity
stakes / FX*
RWA** Other*** 4Q15 Pro-forma
after full
divestment
NN Group
0.2%0.3%
-0.1%
11.3%
11.6%
3Q15 Net profit Equity stakes
/ FX*
RWA** 4Q15
Capital position strengthens further
11
• Bank CET 1 capital increased to 11.6% due to a positive net profit impact of 26 bps in 4Q15 and an increase in the revaluation reserves of our equity stakes, partly offset by an increase in RWA
• Group CET 1 capital increased to 12.7%, largely mirroring developments of the Bank, and including a EUR 600 mln release from interim profits that had not been not included in capital in the first nine months of 2015
• Pro-forma Group CET 1 capital ratio after full divestment of NN Group would be 13.4% in 4Q15
ING Bank fully-loaded CET 1 ratio increased to 11.6% ING Group pro-forma fully-loaded CET1 ratio at 13.4% after 2015 final dividend payment
* Impact includes capital and related RWA movements ** Impact RWA is excl. RWA impact revaluation reserves/FX *** Other includes EUR 0.6 bln release from ‘interim profits not included in CET 1 capital

ING Orange
RGB= 255, 98, 0
ING Light Grey
RGB= 168, 168, 168
ING Indigo
RGB= 82, 81, 153
ING Sky
RGB= 96, 166, 218
Colour Guidelines
ING Fuchsia
RGB= 171, 0, 102
ING Lime
RGB= 208, 217, 60
ING Leaf
RGB= 52, 150, 81
ING Mid Grey
RGB= 118, 118, 118
Text Colour
RGB= 51, 51, 51
No content below the grey line
Group CET 1 ratio comfortably in excess of fully-loaded requirement
9.5% 9.5% 9.5% 9.5%
0.75% 1.5% 2.25% 3.0%
Pro-forma
fully-loaded
4Q15*
Phased-in
1/1/2016
Phased-in
1/1/2017
Phased-in
1/1/2018
Fully-loaded
1/1/2019
ING
Management buffer
Dutch Systemic Risk Buffer (SRB)
SREP
Group CET 1 exceeds fully-loaded requirements; we propose to pay a full-year dividend of EUR 2,515 mln or EUR 0.65 per share
12
>10.25%
• The capital requirement (SREP), set by the ECB, that the Group has to meet on a consolidated basis is 9.5%
• The systemic risk buffer (SRB), set by the DNB, that the Group has to meet on a consolidated basis is currently 3% of RWA, phased-in over 4 years
• Consequently, ING will introduce a new target for Group CET 1
• We are committed to maintaining a healthy Group CET1 ratio in excess of prevailing fully-loaded CET1 requirements, currently 12.5%, and growing into a comfortable management buffer over time
• We aim to pay a progressive dividend over time
>11.0% >11.75% >12.5% 13.4%*
Fully-loaded requirement
* Pro-forma after full divestment of NN Group
We propose to pay a full-year dividend of EUR 0.65 per share
0.240.12
0.41
4Q14 2015
Interim Dividend Final Dividend
EUR 0.12 EUR 0.65
ING Orange
RGB= 255, 98, 0
ING Light Grey
RGB= 168, 168, 168
ING Indigo
RGB= 82, 81, 153
ING Sky
RGB= 96, 166, 218
Colour Guidelines
ING Fuchsia
RGB= 171, 0, 102
ING Lime
RGB= 208, 217, 60
ING Leaf
RGB= 52, 150, 81
ING Mid Grey
RGB= 118, 118, 118
Text Colour
RGB= 51, 51, 51
No content below the grey line
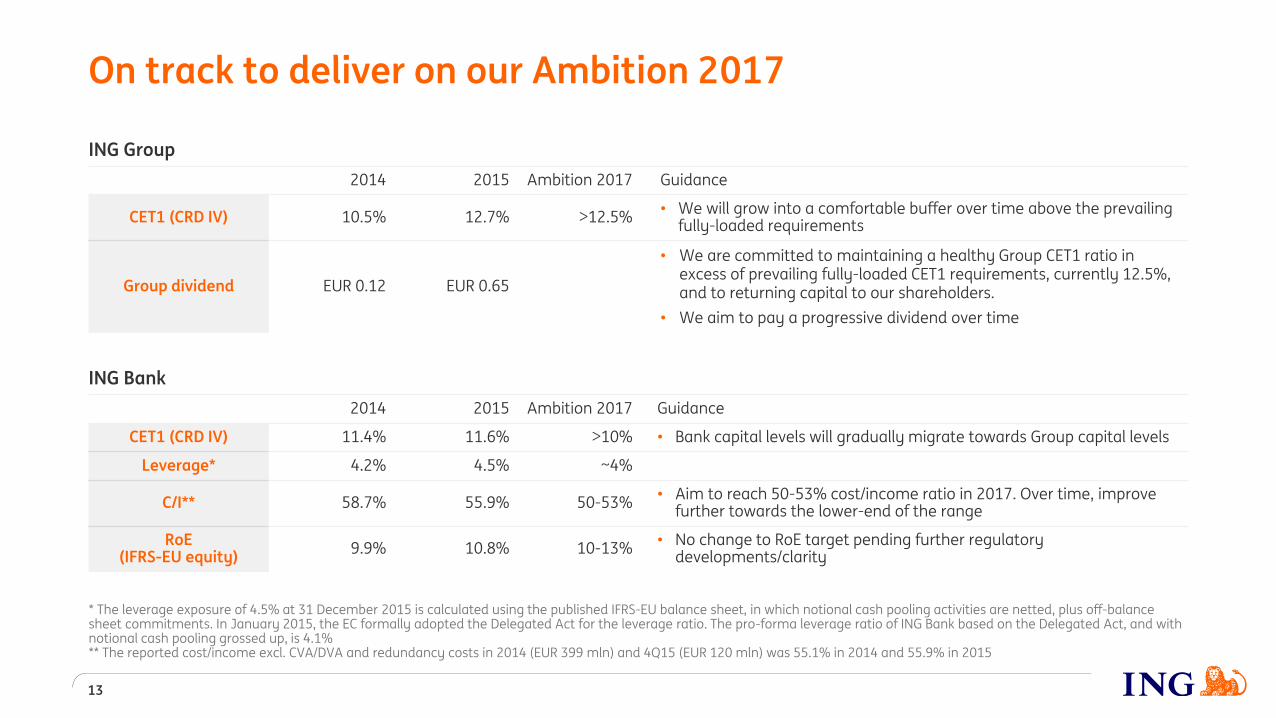
On track to deliver on our Ambition 2017
ING Group
2014 2015 Ambition 2017 Guidance
CET1 (CRD IV) 10.5% 12.7% >12.5% • We will grow into a comfortable buffer over time above the prevailing
fully-loaded requirements
Group dividend EUR 0.12 EUR 0.65
• We are committed to maintaining a healthy Group CET1 ratio in excess of prevailing fully-loaded CET1 requirements, currently 12.5%, and to returning capital to our shareholders.
• We aim to pay a progressive dividend over time
13
ING Bank
2014 2015 Ambition 2017 Guidance
CET1 (CRD IV) 11.4% 11.6% >10% • Bank capital levels will gradually migrate towards Group capital levels
Leverage* 4.2% 4.5% ~4%
C/I** 58.7% 55.9% 50-53% • Aim to reach 50-53% cost/income ratio in 2017. Over time, improve
further towards the lower-end of the range
RoE (IFRS-EU equity)
9.9% 10.8% 10-13% • No change to RoE target pending further regulatory
developments/clarity
* The leverage exposure of 4.5% at 31 December 2015 is calculated using the published IFRS-EU balance sheet, in which notional cash pooling activities are netted, plus off-balance sheet commitments. In January 2015, the EC formally adopted the Delegated Act for the leverage ratio. The pro-forma leverage ratio of ING Bank based on the Delegated Act, and with notional cash pooling grossed up, is 4.1% ** The reported cost/income excl. CVA/DVA and redundancy costs in 2014 (EUR 399 mln) and 4Q15 (EUR 120 mln) was 55.1% in 2014 and 55.9% in 2015

ING Orange
RGB= 255, 98, 0
ING Light Grey
RGB= 168, 168, 168
ING Indigo
RGB= 82, 81, 153
ING Sky
RGB= 96, 166, 218
Colour Guidelines
ING Fuchsia
RGB= 171, 0, 102
ING Lime
RGB= 208, 217, 60
ING Leaf
RGB= 52, 150, 81
ING Mid Grey
RGB= 118, 118, 118
Text Colour
RGB= 51, 51, 51
No content below the grey line
4Q15 results
14
ING Orange
RGB= 255, 98, 0
ING Light Grey
RGB= 168, 168, 168
ING Indigo
RGB= 82, 81, 153
ING Sky
RGB= 96, 166, 218
Colour Guidelines
ING Fuchsia
RGB= 171, 0, 102
ING Lime
RGB= 208, 217, 60
ING Leaf
RGB= 52, 150, 81
ING Mid Grey
RGB= 118, 118, 118
Text Colour
RGB= 51, 51, 51
No content below the grey line
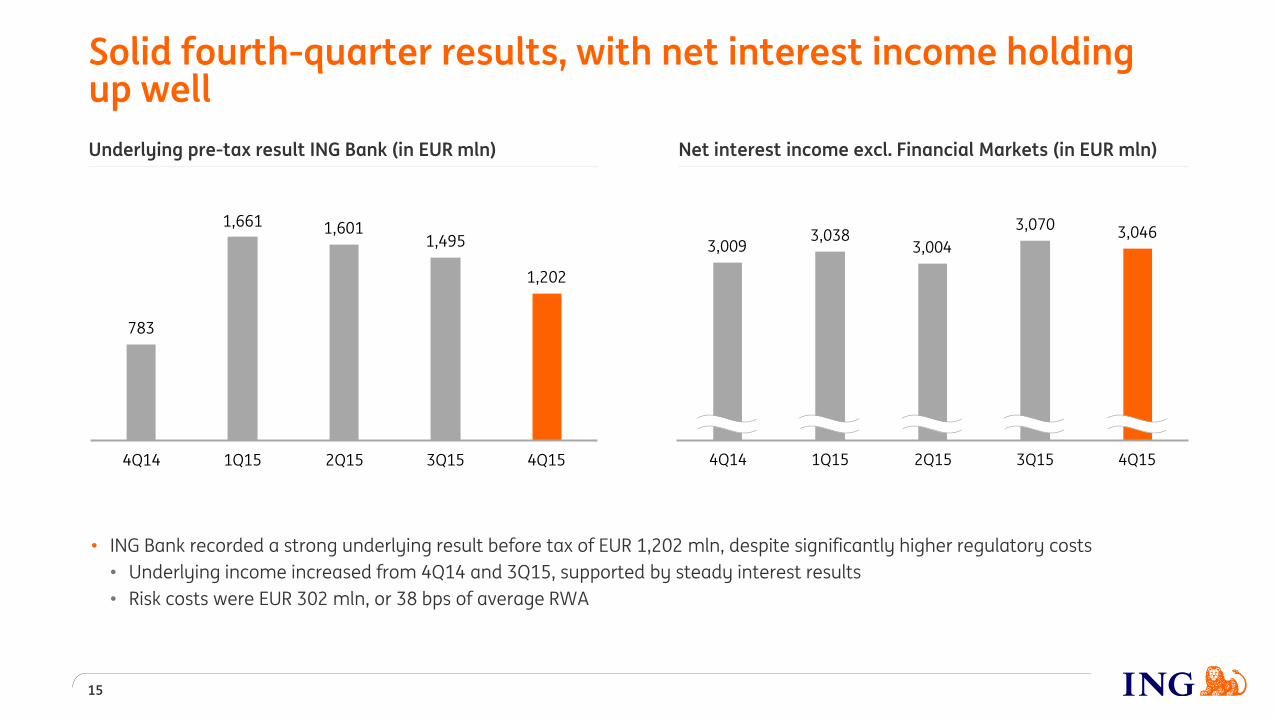
Net interest income excl. Financial Markets (in EUR mln) Underlying pre-tax result ING Bank (in EUR mln)
Solid fourth-quarter results, with net interest income holding up well
783
1,661 1,6011,495
1,202
4Q14 1Q15 2Q15 3Q15 4Q15
15
3,0463,070
3,0043,038
3,009
4Q14 1Q15 2Q15 3Q15 4Q15
• ING Bank recorded a strong underlying result before tax of EUR 1,202 mln, despite significantly higher regulatory costs
• Underlying income increased from 4Q14 and 3Q15, supported by steady interest results
• Risk costs were EUR 302 mln, or 38 bps of average RWA
ING Orange
RGB= 255, 98, 0
ING Light Grey
RGB= 168, 168, 168
ING Indigo
RGB= 82, 81, 153
ING Sky
RGB= 96, 166, 218
Colour Guidelines
ING Fuchsia
RGB= 171, 0, 102
ING Lime
RGB= 208, 217, 60
ING Leaf
RGB= 52, 150, 81
ING Mid Grey
RGB= 118, 118, 118
Text Colour
RGB= 51, 51, 51
No content below the grey line
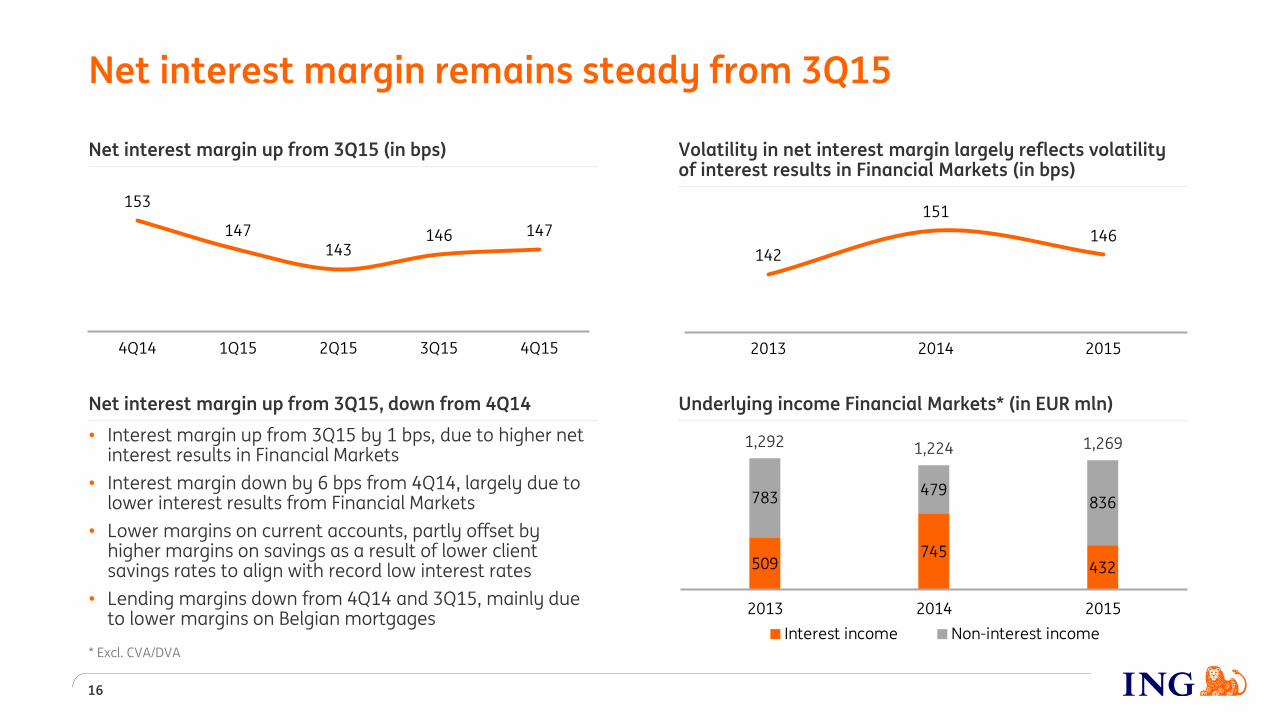
Net interest margin up from 3Q15 (in bps)
Net interest margin remains steady from 3Q15
16
Volatility in net interest margin largely reflects volatility of interest results in Financial Markets (in bps)
Underlying income Financial Markets* (in EUR mln)
509745
432
783479
836
2013 2014 2015
Interest income Non-interest income
1,292 1,224 1,269
142
151
146
2013 2014 2015
Net interest margin up from 3Q15, down from 4Q14
• Interest margin up from 3Q15 by 1 bps, due to higher net interest results in Financial Markets
• Interest margin down by 6 bps from 4Q14, largely due to lower interest results from Financial Markets
• Lower margins on current accounts, partly offset by higher margins on savings as a result of lower client savings rates to align with record low interest rates
• Lending margins down from 4Q14 and 3Q15, mainly due to lower margins on Belgian mortgages
* Excl. CVA/DVA
153
147 143
146 147
4Q14 1Q15 2Q15 3Q15 4Q15

ING Orange
RGB= 255, 98, 0
ING Light Grey
RGB= 168, 168, 168
ING Indigo
RGB= 82, 81, 153
ING Sky
RGB= 96, 166, 218
Colour Guidelines
ING Fuchsia
RGB= 171, 0, 102
ING Lime
RGB= 208, 217, 60
ING Leaf
RGB= 52, 150, 81
ING Mid Grey
RGB= 118, 118, 118
Text Colour
RGB= 51, 51, 51
No content below the grey line
532.7529.0
3.91.61.2
3.40.4 -2.4-0.6-1.2-1.6 -0.6
-0.5
30/09/15 Retail NL Retail
Belgium
Retail
Germany
Retail
Other
CGM*
WB IL* WB GL&TS* WB Other* WUB run-
off /
transfers**
Lease run-
off
Bank
Treasury
FX / Other 31/12/15
Customer lending 4Q15 (in EUR bln)
Our core lending franchises grew by EUR 4.5 bln in 4Q15, driven by Wholesale Banking
17
Core lending businesses: EUR 4.5 bln
* C&GM is Challenger & Growth Markets; IL is Industry Lending; GL&TS is General Lending & Transaction Services; Other includes Financial Markets ** WUB run-off was EUR -0.7 bln and transfer to NN was EUR -0.5 bln
• Our core lending franchises grew by EUR 4.5 bln in 4Q15, driven by Wholesale Banking
• Wholesale Banking increased by EUR 3.8 bln driven by Industry Lending, both in Structured Finance and Real Estate Finance
• Retail Banking increased by EUR 0.7 bln, principally outside of the Benelux
• Our core lending franchises grew by EUR 21.7 bln in FY 2015, or 4.2%, in line with our guidance
ING Orange
RGB= 255, 98, 0
ING Light Grey
RGB= 168, 168, 168
ING Indigo
RGB= 82, 81, 153
ING Sky
RGB= 96, 166, 218
Colour Guidelines
ING Fuchsia
RGB= 171, 0, 102
ING Lime
RGB= 208, 217, 60
ING Leaf
RGB= 52, 150, 81
ING Mid Grey
RGB= 118, 118, 118
Text Colour
RGB= 51, 51, 51
No content below the grey line
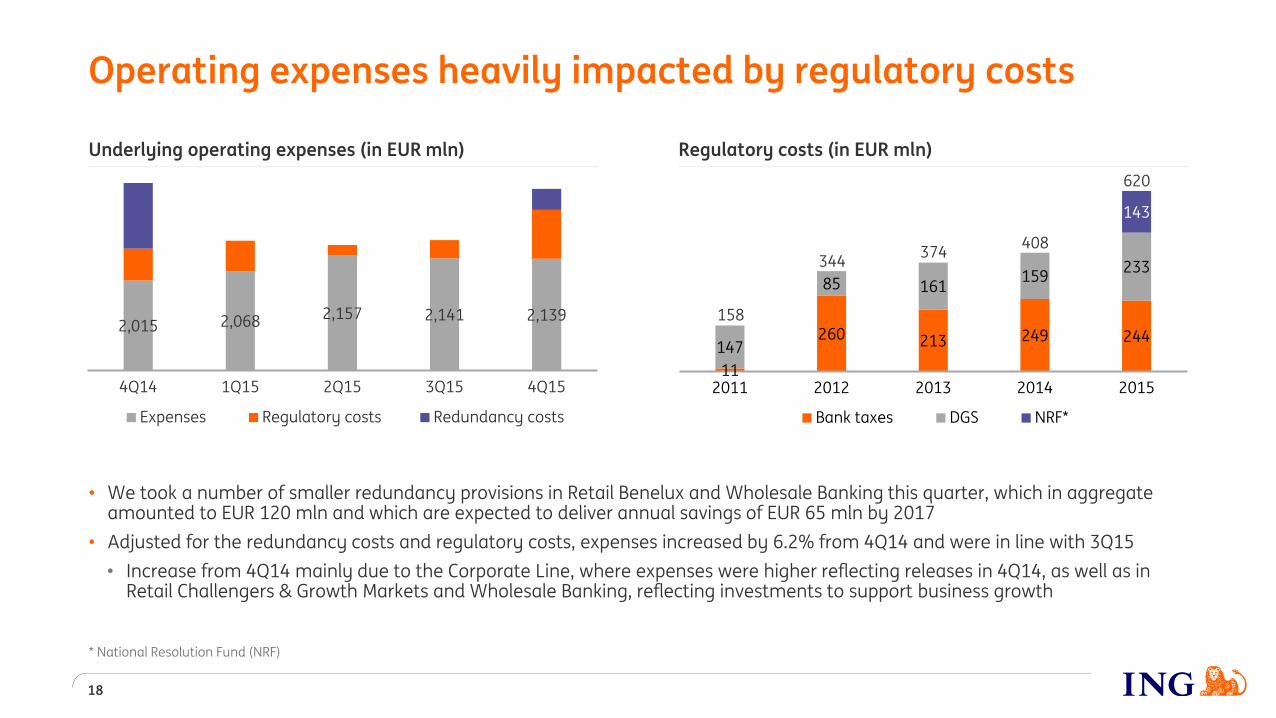
Operating expenses heavily impacted by regulatory costs
• We took a number of smaller redundancy provisions in Retail Benelux and Wholesale Banking this quarter, which in aggregate amounted to EUR 120 mln and which are expected to deliver annual savings of EUR 65 mln by 2017
• Adjusted for the redundancy costs and regulatory costs, expenses increased by 6.2% from 4Q14 and were in line with 3Q15
• Increase from 4Q14 mainly due to the Corporate Line, where expenses were higher reflecting releases in 4Q14, as well as in Retail Challengers & Growth Markets and Wholesale Banking, reflecting investments to support business growth
2,015 2,068 2,157 2,141 2,139
4Q14 1Q15 2Q15 3Q15 4Q15
Expenses Regulatory costs Redundancy costs
18
11
260 213 249 244 147
85 161 159
233
143
2011 2012 2013 2014 2015
Bank taxes DGS NRF*
408
158
344 374
620
* National Resolution Fund (NRF)
Underlying operating expenses (in EUR mln) Regulatory costs (in EUR mln)

ING Orange
RGB= 255, 98, 0
ING Light Grey
RGB= 168, 168, 168
ING Indigo
RGB= 82, 81, 153
ING Sky
RGB= 96, 166, 218
Colour Guidelines
ING Fuchsia
RGB= 171, 0, 102
ING Lime
RGB= 208, 217, 60
ING Leaf
RGB= 52, 150, 81
ING Mid Grey
RGB= 118, 118, 118
Text Colour
RGB= 51, 51, 51
No content below the grey line
Risk costs (in EUR mln)
165 153 140 82 59
18 48 40
16 65
65 59 62
66 80
152 173
111
97 97
4Q14 1Q15 2Q15 3Q15 4Q15
Wholesale Banking
Retail Challengers & Growth Markets
Retail Belgium
Retail Netherlands
Risk costs amounted to EUR 302 mln or 38 bps of RWA and NPL ratio improved to 2.5%
302
353
261
19
• Risk costs were EUR 302 mln, or 38 bps of RWA, down from 4Q14, but up from 3Q15 due to higher risk costs in Retail Banking
• NPL ratio down to 2.5%, with improvements in both Retail Banking and Wholesale Banking
400 432
3.0% 3.0%
2.8%
2.6% 2.5%
3.3% 3.3%
3.1%
2.9% 2.8%
2.8% 2.8%
2.6% 2.5%
2.4%
4Q14 1Q15 2Q15 3Q15 4Q15
NPL ratio ING Bank
NPL ratio Wholesale Banking
NPL ratio Retail Banking
NPL ratio
ING Orange
RGB= 255, 98, 0
ING Light Grey
RGB= 168, 168, 168
ING Indigo
RGB= 82, 81, 153
ING Sky
RGB= 96, 166, 218
Colour Guidelines
ING Fuchsia
RGB= 171, 0, 102
ING Lime
RGB= 208, 217, 60
ING Leaf
RGB= 52, 150, 81
ING Mid Grey
RGB= 118, 118, 118
Text Colour
RGB= 51, 51, 51
No content below the grey line
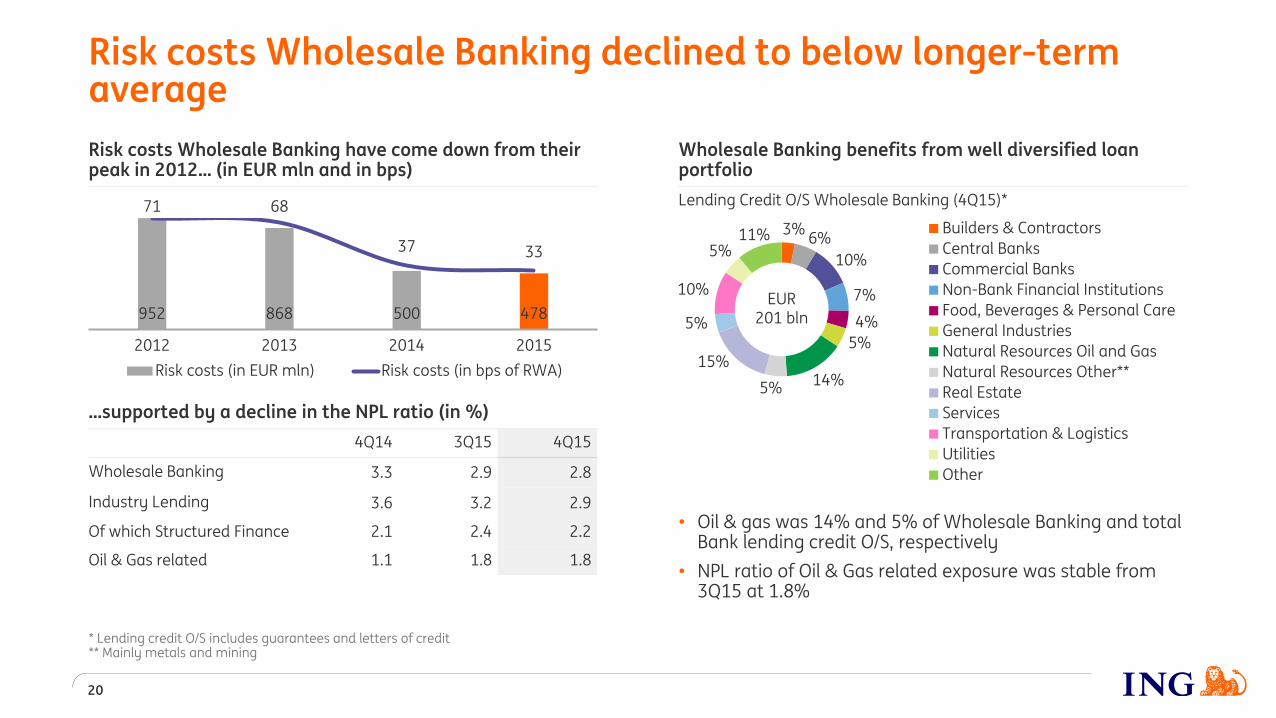
Risk costs Wholesale Banking declined to below longer-term average
20
3% 6%
10%
7%
4%
5%
14% 5%
15%
5%
10%
5% 11% Builders & Contractors
Central Banks
Commercial Banks
Non-Bank Financial Institutions
Food, Beverages & Personal Care
General Industries
Natural Resources Oil and Gas
Natural Resources Other**
Real Estate
Services
Transportation & Logistics
Utilities
Other
* Lending credit O/S includes guarantees and letters of credit ** Mainly metals and mining
Risk costs Wholesale Banking have come down from their peak in 2012… (in EUR mln and in bps)
…supported by a decline in the NPL ratio (in %)
4Q14 3Q15 4Q15
Wholesale Banking 3.3 2.9 2.8
Industry Lending 3.6 3.2 2.9
Of which Structured Finance 2.1 2.4 2.2
Oil & Gas related 1.1 1.8 1.8
Wholesale Banking benefits from well diversified loan portfolio
Lending Credit O/S Wholesale Banking (4Q15)*
• Oil & gas was 14% and 5% of Wholesale Banking and total Bank lending credit O/S, respectively
• NPL ratio of Oil & Gas related exposure was stable from 3Q15 at 1.8%
EUR 201 bln 952 868 500 478
71 68
37 33
2012 2013 2014 2015
Risk costs (in EUR mln) Risk costs (in bps of RWA)

ING Orange
RGB= 255, 98, 0
ING Light Grey
RGB= 168, 168, 168
ING Indigo
RGB= 82, 81, 153
ING Sky
RGB= 96, 166, 218
Colour Guidelines
ING Fuchsia
RGB= 171, 0, 102
ING Lime
RGB= 208, 217, 60
ING Leaf
RGB= 52, 150, 81
ING Mid Grey
RGB= 118, 118, 118
Text Colour
RGB= 51, 51, 51
No content below the grey line
Lending to the Oil & Gas Industry is well diversified and oil price risk is manageable
85% of lending is not directly exposed to oil price risk
On EUR 3.8 bln of exposure, we may see higher loan losses if oil prices remain at current or lower levels
Lending credit O/S
In EUR bln In %
Trade and Commodity Finance
• Trade-related exposure; short-term self-liquidating trade finance, generally for major trading companies, either pre-sold or price hedged, not exposing the Bank to oil price risk
12.2 42%
Export Finance • ECA covered loans in oil & gas: typically 95-100% credit
insured 1.7 6%
Corporate Lending • Corporate Loans in oil & gas sector: predominantly loans to
investment grade integrated oil companies 5.7 20%
Midstream • E.g. pipelines, tank farms, LNG terminals, etc.: these assets
typically generate revenues from long-term tariff-based contracts, not affected by oil price movements
4.9 17%
Other Offshore Services Companies*
• Diversified portfolio of companies active in pipe laying, heavy lifting, subsea services, etc. Corporate guaranteed
0.7 2%
Offshore Drilling Companies
• Loans to finance drilling rigs, generally backed by 2-5 yr charter contracts and corporate guaranteed
1.0 3%
Reserve Based Lending**
• Financing based on borrower’s oil & gas assets. Loans secured by reserves of oil & gas. Includes smaller independent oil & gas producers
2.8 10%
Total Oil & Gas related exposure
EUR 29 bln
21
• Our reserve based lending and offshore drilling portfolios of EUR 3.8 bln in total could result in higher risk costs if oil prices were to stay at USD 30 per barrel or below and remain there for an extended period of time
* ING has very limited activity in oil field services sector in the US ** Individual RBL clients have different compositions in oil and gas but overall portfolio composition is approximately 60% oil and 40% gas
Somewhat exposed to oil price risk

ING Orange
RGB= 255, 98, 0
ING Light Grey
RGB= 168, 168, 168
ING Indigo
RGB= 82, 81, 153
ING Sky
RGB= 96, 166, 218
Colour Guidelines
ING Fuchsia
RGB= 171, 0, 102
ING Lime
RGB= 208, 217, 60
ING Leaf
RGB= 52, 150, 81
ING Mid Grey
RGB= 118, 118, 118
Text Colour
RGB= 51, 51, 51
No content below the grey line
Wrap up
22

ING Orange
RGB= 255, 98, 0
ING Light Grey
RGB= 168, 168, 168
ING Indigo
RGB= 82, 81, 153
ING Sky
RGB= 96, 166, 218
Colour Guidelines
ING Fuchsia
RGB= 171, 0, 102
ING Lime
RGB= 208, 217, 60
ING Leaf
RGB= 52, 150, 81
ING Mid Grey
RGB= 118, 118, 118
Text Colour
RGB= 51, 51, 51
No content below the grey line
Wrap up
23
…resulting in strong results…
• Underlying net result ING Bank rose to EUR 4,219 mln in 2015, up 23.2% from 2014
• Fourth quarter 2015 underlying result before tax ING Bank EUR 1,202 mln
…boosting our capital ratios...
• Fully-loaded CET 1 ratio ING Group rose from 12.3% to 12.7%, above the regulatory fully-loaded requirement, currently 12.5%
• Pro-forma Group CET1 on a fully-loaded basis of 13.4%
Continued growth in customer numbers and lending…
• Our retail customer base grew by over 1.4 mln to 34.4 mln at year-end
• Our core lending franchises grew by EUR 21.7 bln or 4.2% in 2015, in line with our guidance
…and enabling us to pay an attractive dividend
• We propose to pay a full-year dividend of EUR 2,515 mln or EUR 0.65 per share
• We aim to pay a progressive dividend over time
ING Orange
RGB= 255, 98, 0
ING Light Grey
RGB= 168, 168, 168
ING Indigo
RGB= 82, 81, 153
ING Sky
RGB= 96, 166, 218
Colour Guidelines
ING Fuchsia
RGB= 171, 0, 102
ING Lime
RGB= 208, 217, 60
ING Leaf
RGB= 52, 150, 81
ING Mid Grey
RGB= 118, 118, 118
Text Colour
RGB= 51, 51, 51
No content below the grey line
Appendix
24

ING Orange
RGB= 255, 98, 0
ING Light Grey
RGB= 168, 168, 168
ING Indigo
RGB= 82, 81, 153
ING Sky
RGB= 96, 166, 218
Colour Guidelines
ING Fuchsia
RGB= 171, 0, 102
ING Lime
RGB= 208, 217, 60
ING Leaf
RGB= 52, 150, 81
ING Mid Grey
RGB= 118, 118, 118
Text Colour
RGB= 51, 51, 51
No content below the grey line
Fully-loaded common equity Tier 1 capital (in EUR bln and %)
-4.1-1.4 -1.6 0.50.6 41.847.840.8
ING Group
Shareholders'
Equity
FI deductions Interim profit not
included in CET 1
capital
Other deductions ING Group CET1
fully-loaded
FI deductions Gain on sale ING Group CET 1
fully-loaded
Pro-forma Group CET1 already exceeds regulatory requirement on a fully-loaded basis
0.841.8 42.7
ING Group CET1
fully-loaded
FI deductions ING Group CET1
fully-loaded
Pro-forma for full divestment of remaining stake NN
Reduction stake NN Group to 14.1% in January 2016
25
>12.5%
13.0%* 12.7%*
Actual 31 December 2015
13.4%*,**
Required Fully-
loaded
Dutch Systemic
Risk Buffer (SRB)
SREP
• On 5 January 2016, ING reduced its stake in NN Group to 16.2%, resulting in a EUR 0.5 bln profit and a 30 bps uplift in ING Group CET 1
• On 28 January 2016, ING announced the exchange of the final tranche of the mandatory exchangeable notes resulting in a reduction of ING’s stake in NN Group to 14.1%
* ING Group fully-loaded CET1 ratio is based on RWAs of EUR 321.2 bln; Pro-forma for sale NN stake in January is based on RWAs of EUR 321.3 bln and for full divestments is based on RWAs of EUR 319.2 bln ** Based on share price NN Group of EUR 30.34

ING Orange
RGB= 255, 98, 0
ING Light Grey
RGB= 168, 168, 168
ING Indigo
RGB= 82, 81, 153
ING Sky
RGB= 96, 166, 218
Colour Guidelines
ING Fuchsia
RGB= 171, 0, 102
ING Lime
RGB= 208, 217, 60
ING Leaf
RGB= 52, 150, 81
ING Mid Grey
RGB= 118, 118, 118
Text Colour
RGB= 51, 51, 51
No content below the grey line
Capital growth supported by strong profitability
26
Bank fully-loaded CET 1 ratio development during 4Q15 (amounts in EUR bln and %)
Capital RWA Ratio Change
Actuals September 2015 35.0 310.3 11.3%
Net profit 0.8 +0.26%
Equity stakes* 0.7 2.0 +0.15%
FX 0.3 2.6 0.00%
RWA** 3.4 -0.11%
Actuals December 2015 36.8 318.2 11.6% +0.30%
Group fully-loaded CET 1 ratio development during 4Q15 (amounts in EUR bln and %)
Capital RWA Ratio Change
Actuals September 2015 38.7 313.8 12.3%
Net profit 0.8 +0.26%
Equity stakes* 0.4 1.1 +0.07%
FX 0.3 2.6 -0.01%
RWA 3.7 -0.14%
Other*** 0.6 +0.19%
Actuals December 2015 40.8 321.2 12.7% +0.37%
* Includes higher valuation Bank of Beijing (impact of 12bps); Group negatively impacted by higher deduction for significant investments in financial institutions amounting to EUR 0.3 bln due to a higher market value for Bank of Being ** Increase RWA reflects negative impact from model updates (-36 bps), partly offset by positive impact from risk migration (12 bps) and other (13 bps) *** Other includes EUR 0.6 bln release from ‘interim profits not included in CET 1 capital’

ING Orange
RGB= 255, 98, 0
ING Light Grey
RGB= 168, 168, 168
ING Indigo
RGB= 82, 81, 153
ING Sky
RGB= 96, 166, 218
Colour Guidelines
ING Fuchsia
RGB= 171, 0, 102
ING Lime
RGB= 208, 217, 60
ING Leaf
RGB= 52, 150, 81
ING Mid Grey
RGB= 118, 118, 118
Text Colour
RGB= 51, 51, 51
No content below the grey line
Client savings rates
Netherlands (profijtrekening)** Belgium (Oranje boekje) Germany (core savings rate) Other EU Direct units***
1.10
0.800.70 0.60
4Q14 3Q15 4Q15 Jan. 16
We further reduced client savings rates in December 2015 and January 2016 to align with record low interest rates
27
30%
18% 28%
24%
Netherlands
Belgium
Germany
Other Challengers & Growth Markets
We further reduced savings rates in 4Q15 and 1Q16
• In the December 2015, we reduced savings rates in the Netherlands, Germany and France
• ING further reduced client savings rates in January 2016 in the Netherlands and Spain
• We will continue to review our client rate propositions given the low interest rate environment
EUR 435 bln
Retail customer deposits, breakdown by business segment* (in %, 4Q15)
0.80
0.20 0.20 0.20
4Q14 3Q15 4Q15 Jan. 16
0.83
0.50 0.47 0.37
4Q14 3Q15 4Q15 Jan. 16
0.800.60 0.50 0.50
4Q14 3Q15 4Q15 Jan. 16
* Around 80% are savings/deposits and around 20% are current accounts ** Rate for savings up to EUR 25,000 is 60 bps, for savings between EUR 25,000-75,000 is 70 bps and for savings higher than EUR 75,000 is 90 bps *** Unweighted average core savings rates in France, Italy and Spain

ING Orange
RGB= 255, 98, 0
ING Light Grey
RGB= 168, 168, 168
ING Indigo
RGB= 82, 81, 153
ING Sky
RGB= 96, 166, 218
Colour Guidelines
ING Fuchsia
RGB= 171, 0, 102
ING Lime
RGB= 208, 217, 60
ING Leaf
RGB= 52, 150, 81
ING Mid Grey
RGB= 118, 118, 118
Text Colour
RGB= 51, 51, 51
No content below the grey line
Regulatory costs by segment (2015) Regulatory costs (in EUR mln)*
Cost/income ratio (in %)***
62.4
57.8 56.2 55.1 55.9 61.3
55.5 53.8 52.5 52.1
2011 2012 2013 2014 2015
Cost/income ratio Cost/income ratio excl. regulatory costs
Regulatory costs continue to increase and weigh heavily on the expense base
11
260 213 249 244147
85 161 159 233
143
2011 2012 2013 2014 2015
Bank taxes DGS** NRF**
408
158
344 374
28
620 16%
25%
16%
14%
23%
6%
Retail NetherlandsRetail BelgiumRetail GermanyRetail Other C&GMWholesale BankingCorporate Line
Regulatory costs expected to increase further in 2016
• The regulatory costs for 2015 amounted to EUR 620 mln, up by EUR 212 mln from 2014
• We expect regulatory costs to increase further to around EUR 850 mln, including the expected Bank tax in Poland, in 2016****
• In 2016, roughly half of the regulatory costs is expected to be booked in the first quarter
* In addition to the regulatory costs in 2014 that were booked in expenses, we paid EUR 304 mln (booked in special items) for the nationalisation of SNS ** Deposit Guarantee Scheme (DGS and National Resolution Fund (NRF) *** Excluding CVA/DVA (EUR -273 mln in 2014 and EUR 224 mln in 2015) and redundancy provisions (EUR 399 mln in 2014 and EUR 120 mln in 4Q15) **** 2016 is an estimate and subject to change
EUR 620 mln

ING Orange
RGB= 255, 98, 0
ING Light Grey
RGB= 168, 168, 168
ING Indigo
RGB= 82, 81, 153
ING Sky
RGB= 96, 166, 218
Colour Guidelines
ING Fuchsia
RGB= 171, 0, 102
ING Lime
RGB= 208, 217, 60
ING Leaf
RGB= 52, 150, 81
ING Mid Grey
RGB= 118, 118, 118
Text Colour
RGB= 51, 51, 51
No content below the grey line
Retail Banking* (in %)
Lending credit outstandings ING Bank are well diversified
29
33%
9%
9% 11%
16%
3%
13%
6%
Mortgages Netherlands
Other lending Netherlands
Mortgages Belgium
Other lending Belgium
Mortgages Germany
Other lending Germany
Mortgages Other C&GM
Other lending Other C&GM
ING Bank* (in %) Wholesale Banking* (in %)
* 31 December 2015 lending and money market credit risk outstanding, including guarantees and letters of credit (off-balance sheet positions)
• ING Bank has a well diversified and well collateralized loan book with a strong focus on own-originated mortgages
• 66% of the portfolio is retail-based
66%
34%
Retail Banking
Wholesale Banking
43%
13%
21%
14%
7% 2%
Structured Finance
Real Estate Finance
General Lending
Transaction Services
FM, Bank Treasury, Real Estate & Other
General Lease run-off
EUR 593 bln
EUR 393 bln
EUR 201 bln
ING Orange
RGB= 255, 98, 0
ING Light Grey
RGB= 168, 168, 168
ING Indigo
RGB= 82, 81, 153
ING Sky
RGB= 96, 166, 218
Colour Guidelines
ING Fuchsia
RGB= 171, 0, 102
ING Lime
RGB= 208, 217, 60
ING Leaf
RGB= 52, 150, 81
ING Mid Grey
RGB= 118, 118, 118
Text Colour
RGB= 51, 51, 51
No content below the grey line
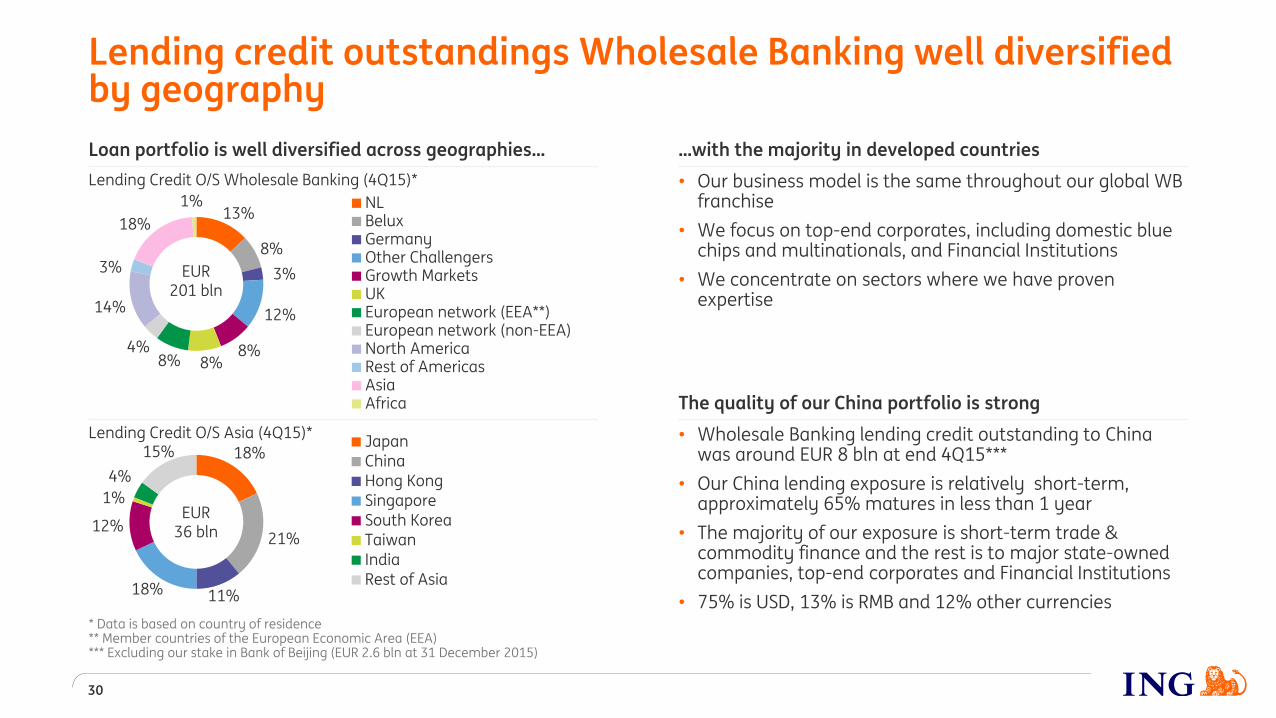
Loan portfolio is well diversified across geographies…
Lending Credit O/S Wholesale Banking (4Q15)*
Lending Credit O/S Asia (4Q15)*
18%
21%
11% 18%
12%
1%
4%
15% JapanChinaHong KongSingaporeSouth KoreaTaiwanIndiaRest of Asia
13%
8%
3%
12%
8% 8% 8%
4%
14%
3%
18%
1% NLBeluxGermanyOther ChallengersGrowth MarketsUKEuropean network (EEA**)European network (non-EEA)North AmericaRest of AmericasAsiaAfrica
Lending credit outstandings Wholesale Banking well diversified by geography
30
* Data is based on country of residence ** Member countries of the European Economic Area (EEA) *** Excluding our stake in Bank of Beijing (EUR 2.6 bln at 31 December 2015)
...with the majority in developed countries
• Our business model is the same throughout our global WB franchise
• We focus on top-end corporates, including domestic blue chips and multinationals, and Financial Institutions
• We concentrate on sectors where we have proven expertise
The quality of our China portfolio is strong
• Wholesale Banking lending credit outstanding to China was around EUR 8 bln at end 4Q15***
• Our China lending exposure is relatively short-term, approximately 65% matures in less than 1 year
• The majority of our exposure is short-term trade & commodity finance and the rest is to major state-owned companies, top-end corporates and Financial Institutions
• 75% is USD, 13% is RMB and 12% other currencies
EUR 201 bln
EUR 36 bln

ING Orange
RGB= 255, 98, 0
ING Light Grey
RGB= 168, 168, 168
ING Indigo
RGB= 82, 81, 153
ING Sky
RGB= 96, 166, 218
Colour Guidelines
ING Fuchsia
RGB= 171, 0, 102
ING Lime
RGB= 208, 217, 60
ING Leaf
RGB= 52, 150, 81
ING Mid Grey
RGB= 118, 118, 118
Text Colour
RGB= 51, 51, 51
No content below the grey line
51%
13%
10%
26%
Natural Resources
Commercial Banks
Transportation & Logistics
Other
NPL ratio and Coverage ratio Russia
4Q15 4Q14 3Q15
NPL ratio 3% 3% 3%
Coverage ratio 18% 16% 17%
Lending outstanding per currency
Lending breakdown by Industry
The quality of our Russian portfolio remains strong
Exposure ING Bank to Russia (in EUR mln)
4Q15 4Q14 Change
4Q-4Q 3Q15 Change
4Q-3Q
Total Lending Credit O/S 5,752 6,189 -437 5,696 56
Other* 361 843 -482 487 -126
Total outstanding 6,113 7,032 -919 6,183 -70
Undrawn committed Facilities 841 1,050 -209 673 168
Note: data is based on country of residence
31
* Other includes Investments, trading exposure and pre-settlement
• Total outstanding to Russia has been reduced by EUR 919 mln from 4Q14 and EUR 70 mln from 3Q15
• The lending exposure to Russia covered by Export Credit Agencies (ECA) is approximately EUR 1 bln
• Focus on mitigated exposures; ECA-covered, pre-export facilities, offshore collateralized and shorter tenors
• The quality of the portfolio remains strong with the NPL ratio stable at 3%
64% 26%
10%
USD
EUR
Local currency

ING Orange
RGB= 255, 98, 0
ING Light Grey
RGB= 168, 168, 168
ING Indigo
RGB= 82, 81, 153
ING Sky
RGB= 96, 166, 218
Colour Guidelines
ING Fuchsia
RGB= 171, 0, 102
ING Lime
RGB= 208, 217, 60
ING Leaf
RGB= 52, 150, 81
ING Mid Grey
RGB= 118, 118, 118
Text Colour
RGB= 51, 51, 51
No content below the grey line
35%
23%
14%
9%
19%
Natural ResourcesFood, Beverages & PersonalGeneral IndustriesUtilitiesOther
73% 15%
12%
USD
EUR
Local currency
The quality of our Ukraine portfolio continues to be under pressure, but manageable
32
* Other includes Investments, trading exposure and pre-settlement
• The NPL ratio remained high at 54% in 4Q15, reflecting the economic recession in Ukraine
• The coverage ratio increased to 60% in 4Q15 from 57% in 3Q15
Lending outstanding per currency
Lending breakdown by Industry
Exposure ING Bank to Ukraine (in EUR mln)
4Q15 4Q14 Change
4Q-4Q 3Q15 Change
4Q-3Q
Total Lending Credit O/S 1,286 1,214 72 1,168 118
Other* -2 12 -12 0 -2
Total outstanding 1,285 1,226 59 1,168 117
Undrawn committed Facilities 33 44 -11 116 -83
Note: data is based on country of residence
NPL ratio and Coverage ratio Ukraine
4Q15 4Q14 3Q15
NPL ratio 54% 35% 55%
Coverage ratio 60% 50% 57%

ING Orange
RGB= 255, 98, 0
ING Light Grey
RGB= 168, 168, 168
ING Indigo
RGB= 82, 81, 153
ING Sky
RGB= 96, 166, 218
Colour Guidelines
ING Fuchsia
RGB= 171, 0, 102
ING Lime
RGB= 208, 217, 60
ING Leaf
RGB= 52, 150, 81
ING Mid Grey
RGB= 118, 118, 118
Text Colour
RGB= 51, 51, 51
No content below the grey line
Lending outstanding per currency
Lending breakdown by maturity
82%
13% 5%
USD
EUR
Other
Lending to the broader oil & gas industry is largely short-term and with Investment Grade companies
33
• Risk costs and the NPL ratio remained low during 2015
• 85% of oil & gas exposure, of which the majority is short-term self liquidating trade finance, is not directly exposed to oil price risk
• Our reserve based lending portfolio and offshore drilling portfolio of EUR 3.8 bln in total may see higher risk costs if oil prices were to stay at USD 30 per barrel or below and remain there for an extended period of time
Lending Credit O/S ING Bank to oil & gas industry (in EUR bln)
4Q15 4Q14 Change
4Q-4Q 3Q15 Change
4Q-3Q
Total Lending Credit O/S 29.1 27.2 1.9 27.6 1.5
NPL ratio and Coverage ratio oil & gas
4Q15 4Q14 3Q15
NPL ratio 1.8% 1.1% 1.8%
Coverage ratio 21% 15% 16%
62% 4%
34%
< 1 yr
1-2 yr
> 2 yr
61% 39%
Investment Grade
Non-Investment Grade
Lending outstanding by rating

ING Orange
RGB= 255, 98, 0
ING Light Grey
RGB= 168, 168, 168
ING Indigo
RGB= 82, 81, 153
ING Sky
RGB= 96, 166, 218
Colour Guidelines
ING Fuchsia
RGB= 171, 0, 102
ING Lime
RGB= 208, 217, 60
ING Leaf
RGB= 52, 150, 81
ING Mid Grey
RGB= 118, 118, 118
Text Colour
RGB= 51, 51, 51
No content below the grey line
66%
25%
9%
USD
EUR
Other
51%
14%
35% < 1 yr
1-2 yr
> 2 yr
29%
10%
23%
5%
33% General Lending
Transaction Services
Trade & Commodity Finance
Structured Export Finance
Structured Finance - Other
Lending to metals & mining industry is well diversified
34
• Metals & mining lending portfolio is well diversified in terms of underlying commodities, type of product, type of exposures, structures and duration
• Around 25% is short-term self-liquidating trade finance and not sensitive to price risk
• Around 5% is export finance and covered by Export Credit Agencies (ECA)
• Focus is and has always been on high credit quality names, low cost producers and industry leaders
• Around 70% of the NPLs are related to our exposure to the Ukraine (around 50%, see slide 32) and Russia (around 20%, see slide 31)
Lending Credit O/S ING Bank to metals & mining (in EUR bln)
4Q15 4Q14 Change
4Q-4Q 3Q15 Change
4Q-3Q
Total Lending Credit O/S* 14.2 12.7 1.5 13.3 0.9
NPL ratio and Coverage ratio metals & mining
4Q15 4Q14 3Q15
NPL ratio 6.4% 6.5% 6.4%
Coverage ratio 42% 46% 43%
* Approximately EUR 2 bln is Retail Banking
Lending outstanding by segment
Lending outstanding per currency
Lending breakdown by maturity

ING Orange
RGB= 255, 98, 0
ING Light Grey
RGB= 168, 168, 168
ING Indigo
RGB= 82, 81, 153
ING Sky
RGB= 96, 166, 218
Colour Guidelines
ING Fuchsia
RGB= 171, 0, 102
ING Lime
RGB= 208, 217, 60
ING Leaf
RGB= 52, 150, 81
ING Mid Grey
RGB= 118, 118, 118
Text Colour
RGB= 51, 51, 51
No content below the grey line
2014 2015
Environmental Outperformers
Project Finance - Renewable Energy
ING Groenbank*
Sustainable Real Estate
Other
35
Reducing ING’s own environmental footprint
• We published our ambitions to reduce our carbon dioxide footprint, water usage and waste by 20% and have committed to procuring 100% renewable electricity for all our buildings, both by 2020
• We ended the financing of new coal-fired power plants and thermal coal mines worldwide. Going forward, we will reduce our global credit exposure to thermal coal-related businesses
• Successfully issued our first-ever green bond in November, highly oversubscribed and raising approximately EUR 1.2 bln dual currency. Proceeds support sustainable projects in six sectors
Sustainable transitions financed (in EUR bln)
Lending credits outstanding
ING accelerates sustainable transitions through its strong lending capabilities and reduces own environmental footprint
• The ING Sustainable Finance team promotes sustainable business opportunities in addition to our ongoing assessment and management of environmental and social risks (ESR)
• Sustainable transitions financed represents the volume of business that ING conducts with clients and projects that satisfy the following criteria: they provide sustainable solutions and outperform their sector on environmental performance
• At the end of 2015, total sustainable transitions financed were EUR 23.8 bln, up 22% from 2014
19.5
23.8
* ING Groenbank offers lending services at favourable rates for a diverse range of sustainable projects, from wind turbines to organic farming to solar panels, both in and outside the Netherlands. Funding comes from savings with fiscal incentive. ** ING was rated in the DJSI in different industry categories between 2012-2015; 2012: Insurance; 2013-2014: Diversified Financials; 2015: Banks.
DJSI rating ING, 2012-2015 (score out of 100)**
40
60
80
100
2012 2013 2014 2015
ING
Industry Avg.
ING Orange
RGB= 255, 98, 0
ING Light Grey
RGB= 168, 168, 168
ING Indigo
RGB= 82, 81, 153
ING Sky
RGB= 96, 166, 218
Colour Guidelines
ING Fuchsia
RGB= 171, 0, 102
ING Lime
RGB= 208, 217, 60
ING Leaf
RGB= 52, 150, 81
ING Mid Grey
RGB= 118, 118, 118
Text Colour
RGB= 51, 51, 51
No content below the grey line
Important legal information
ING Group’s Annual Accounts are prepared in accordance with International Financial Reporting Standards as adopted by the European Union (‘IFRS-EU’).
In preparing the financial information in this document, the same accounting principles are applied as in the 2014 ING Group Annual Accounts. The Financial statements for 2015 are in progress and may be subject to adjustments from subsequent events. All figures in this document are unaudited. Small differences are possible in the tables due to rounding.
Actual results, performance or events may differ materially from those in such statements due to, without limitation: (1) changes in general economic conditions, in particular economic conditions in ING’s core markets, (2) changes in performance of financial markets, including developing markets, (3) consequences of a potential (partial) break-up of the euro, (4) ING’s implementation of the restructuring plan as agreed with the European Commission, (5) changes in the availability of, and costs associated with, sources of liquidity such as interbank funding, as well as conditions in the credit markets generally, including changes in borrower and counterparty creditworthiness, (6) changes affecting interest rate levels, (7) changes affecting currency exchange rates, (8) changes in investor and customer behaviour, (9) changes in general competitive factors, (10) changes in laws and regulations, (11) changes in the policies of governments and/or regulatory authorities, (12) conclusions with regard to purchase accounting assumptions and methodologies, (13) changes in ownership that could affect the future availability to us of net operating loss, net capital and built-in loss carry forwards, (14) changes in credit ratings, (15) ING’s ability to achieve projected operational synergies and (16) the other risks and uncertainties detailed in the Risk Factors section contained in the most recent annual report of ING Groep N.V. Any forward-looking statements made by or on behalf of ING speak only as of the date they are made, and, ING assumes no obligation to publicly update or revise any forward-looking statements, whether as a result of new information or for any other reason.
This document does not constitute an offer to sell, or a solicitation of an offer to purchase, any securities in the United States or any other jurisdiction. The securities of NN Group have not been and will not be registered under the U.S. Securities Act of 1933, as amended (the “Securities Act”), and may not be offered or sold within the United States absent registration or an applicable exemption from the registration requirements of the Securities Act.
www.ing.com
36