Embed Size (px)
DESCRIPTION
Citation preview
November 8, 2010
www.fullertonsecurities.co.in Page | 1
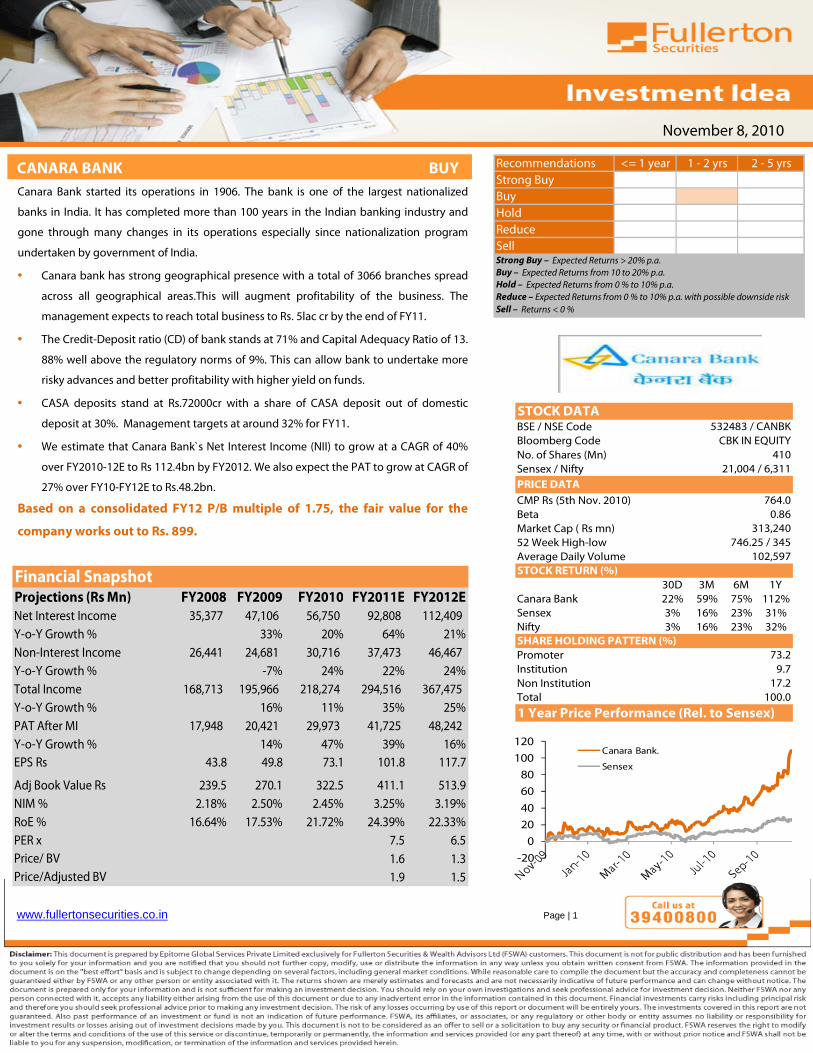
CANARA BANK BUY Canara Bank started its operations in 1906. The bank is one of the largest nationalized
banks in India. It has completed more than 100 years in the Indian banking industry and
gone through many changes in its operations especially since nationalization program
undertaken by government of India.
• Canara bank has strong geographical presence with a total of 3066 branches spread
across all geographical areas.This will augment profitability of the business. The
management expects to reach total business to Rs. 5lac cr by the end of FY11.
• The Credit-Deposit ratio (CD) of bank stands at 71% and Capital Adequacy Ratio of 13.
88% well above the regulatory norms of 9%. This can allow bank to undertake more
risky advances and better profitability with higher yield on funds.
• CASA deposits stand at Rs.72000cr with a share of CASA deposit out of domestic
deposit at 30%. Management targets at around 32% for FY11.
• We estimate that Canara Bank`s Net Interest Income (NII) to grow at a CAGR of 40%
over FY2010-12E to Rs 112.4bn by FY2012. We also expect the PAT to grow at CAGR of
27% over FY10-FY12E to Rs.48.2bn.
Based on a consolidated FY12 P/B multiple of 1.75, the fair value for the
company works out to Rs. 899.
-20
0
20
40
60
80
100
120Canara Bank.
Sensex
STOCK DATABSE / NSE Code
Bloomberg Code
No. of Shares (Mn)
Sensex / Nifty
PRICE DATA
CMP Rs (5th Nov. 2010)
Beta
Market Cap ( Rs mn)
52 Week High-low
Average Daily Volume
STOCK RETURN (%)
30D 3M 6M 1Y
Canara Bank 22% 59% 75% 112%
Sensex 3% 16% 23% 31%
Nifty 3% 16% 23% 32%
SHARE HOLDING PATTERN (%)
Promoter
Institution
Non Institution
Total
1 Year Price Performance (Rel. to Sensex)
100.0
313,240
746.25 / 345
102,597
73.2
9.7
17.2
0.86
532483 / CANBK
CBK IN EQUITY
410
21,004 / 6,311
764.0
Recommendations <= 1 year 1 - 2 yrs 2 - 5 yrs
Strong Buy
Buy
Hold
Reduce
SellStrong Buy – Expected Returns > 20% p.a.
Buy – Expected Returns from 10 to 20% p.a.
Hold – Expected Returns from 0 % to 10% p.a.
Reduce – Expected Returns from 0 % to 10% p.a. with possible downside risk
Sell – Returns < 0 %
Projections (Rs Mn) FY2008 FY2009 FY2010 FY2011E FY2012E
Net Interest Income 35,377 47,106 56,750 92,808 112,409
Y-o-Y Growth % 33% 20% 64% 21%
Non-Interest Income 26,441 24,681 30,716 37,473 46,467
Y-o-Y Growth % -7% 24% 22% 24%
Total Income 168,713 195,966 218,274 294,516 367,475
Y-o-Y Growth % 16% 11% 35% 25%
PAT After MI 17,948 20,421 29,973 41,725 48,242
Y-o-Y Growth % 14% 47% 39% 16%
EPS Rs 43.8 49.8 73.1 101.8 117.7
Adj Book Value Rs 239.5 270.1 322.5 411.1 513.9
NIM % 2.18% 2.50% 2.45% 3.25% 3.19%
RoE % 16.64% 17.53% 21.72% 24.39% 22.33%
PER x 7.5 6.5
Price/ BV 1.6 1.3
Price/Adjusted BV 1.9 1.5
Financial Snapshot
November 8, 2010
www.fullertonsecurities.co.in Page | 2
Canara Bank is one of India’s oldest banks. It is among the top 10 Indian banks in terms of asset size, which stands at
Rs.2668416mn. The Government of India holds over 73.17% stake in the bank. Canara Bank is one of the techno savvy
banks with core banking technology and facilities like intercity ATM network. With the robust performance as reflected
in recent quarters, bank is set to transform its business and improve performance significantly.
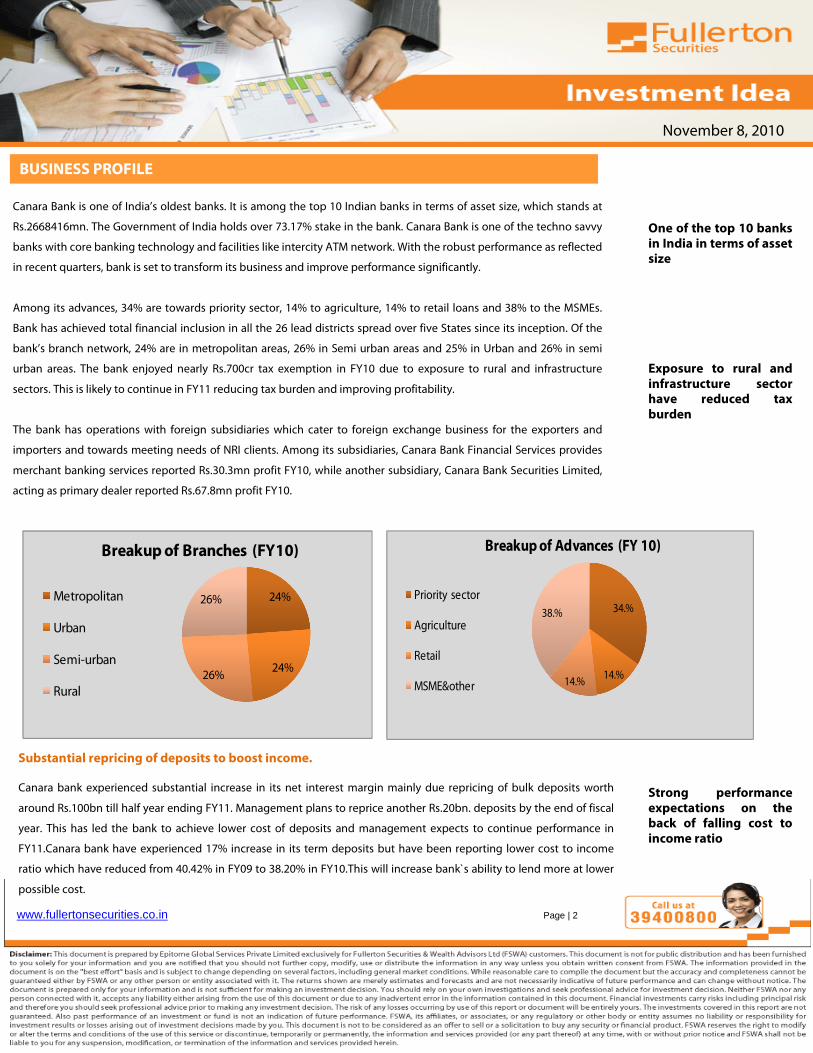
Among its advances, 34% are towards priority sector, 14% to agriculture, 14% to retail loans and 38% to the MSMEs.
Bank has achieved total financial inclusion in all the 26 lead districts spread over five States since its inception. Of the
bank’s branch network, 24% are in metropolitan areas, 26% in Semi urban areas and 25% in Urban and 26% in semi
urban areas. The bank enjoyed nearly Rs.700cr tax exemption in FY10 due to exposure to rural and infrastructure
sectors. This is likely to continue in FY11 reducing tax burden and improving profitability.
The bank has operations with foreign subsidiaries which cater to foreign exchange business for the exporters and
importers and towards meeting needs of NRI clients. Among its subsidiaries, Canara Bank Financial Services provides
merchant banking services reported Rs.30.3mn profit FY10, while another subsidiary, Canara Bank Securities Limited,
acting as primary dealer reported Rs.67.8mn profit FY10.
One of the top 10 banks in India in terms of asset size
Exposure to rural and infrastructure sector have reduced tax burden
Strong performance expectations on the back of falling cost to income ratio
Substantial repricing of deposits to boost income. Canara bank experienced substantial increase in its net interest margin mainly due repricing of bulk deposits worth
around Rs.100bn till half year ending FY11. Management plans to reprice another Rs.20bn. deposits by the end of fiscal
year. This has led the bank to achieve lower cost of deposits and management expects to continue performance in
FY11.Canara bank have experienced 17% increase in its term deposits but have been reporting lower cost to income
ratio which have reduced from 40.42% in FY09 to 38.20% in FY10.This will increase bank`s ability to lend more at lower
possible cost.
BUSINESS PROFILE
24%
24%26%
26%
Breakup of Branches (FY10)
Metropolitan
Urban
Semi-urban
Rural
34.%
14.%14.%
38.%
Breakup of Advances (FY 10)
Priority sector
Agriculture
Retail
MSME&other
November 8, 2010
www.fullertonsecurities.co.in Page | 3
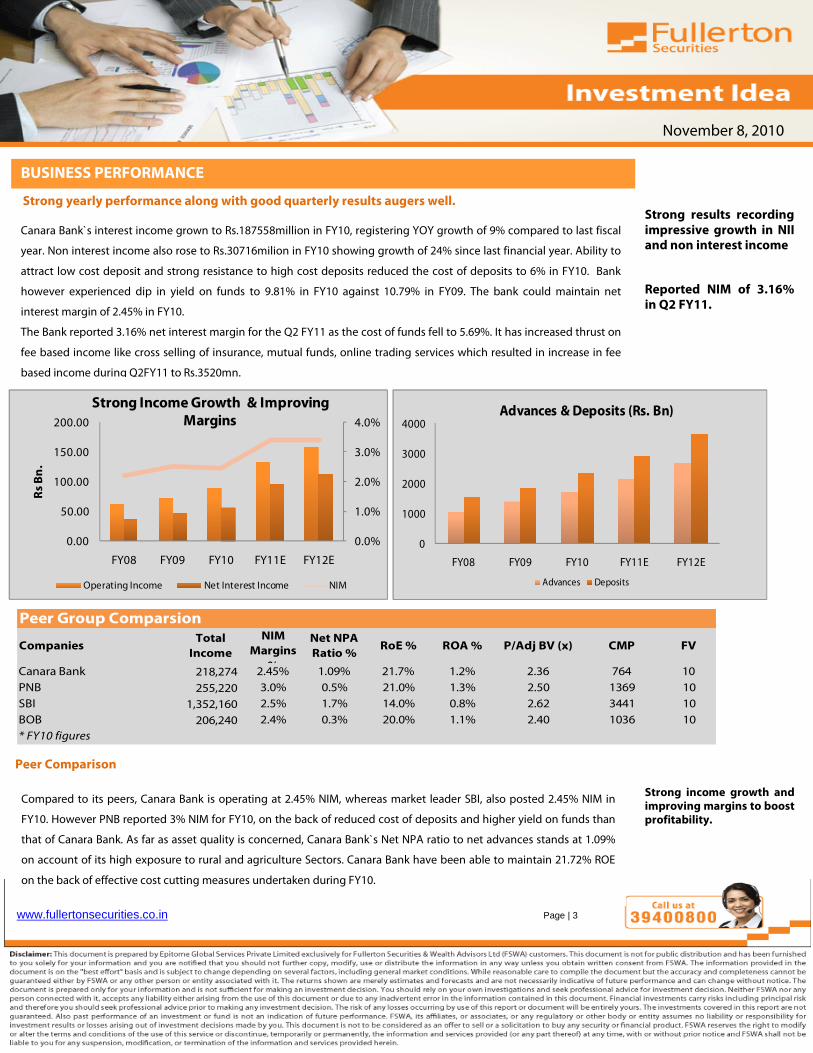
Strong yearly performance along with good quarterly results augers well. Canara Bank`s interest income grown to Rs.187558million in FY10, registering YOY growth of 9% compared to last fiscal
year. Non interest income also rose to Rs.30716milion in FY10 showing growth of 24% since last financial year. Ability to
attract low cost deposit and strong resistance to high cost deposits reduced the cost of deposits to 6% in FY10. Bank
however experienced dip in yield on funds to 9.81% in FY10 against 10.79% in FY09. The bank could maintain net
interest margin of 2.45% in FY10.
The Bank reported 3.16% net interest margin for the Q2 FY11 as the cost of funds fell to 5.69%. It has increased thrust on
fee based income like cross selling of insurance, mutual funds, online trading services which resulted in increase in fee
based income during Q2FY11 to Rs.3520mn.
Strong results recording impressive growth in NII and non interest income
Reported NIM of 3.16% in Q2 FY11.
Strong income growth and improving margins to boost profitability.
BUSINESS PERFORMANCE
Peer Comparison
Compared to its peers, Canara Bank is operating at 2.45% NIM, whereas market leader SBI, also posted 2.45% NIM in
FY10. However PNB reported 3% NIM for FY10, on the back of reduced cost of deposits and higher yield on funds than
that of Canara Bank. As far as asset quality is concerned, Canara Bank`s Net NPA ratio to net advances stands at 1.09%
on account of its high exposure to rural and agriculture Sectors. Canara Bank have been able to maintain 21.72% ROE
on the back of effective cost cutting measures undertaken during FY10.
0.0%
1.0%
2.0%
3.0%
4.0%
0.00
50.00
100.00
150.00
200.00
FY08 FY09 FY10 FY11E FY12E
Rs
Bn
.
Strong Income Growth & Improving
Margins
Operating Income Net Interest Income NIM
0
1000
2000
3000
4000
FY08 FY09 FY10 FY11E FY12E
Advances & Deposits (Rs. Bn)
Advances Deposits
Peer Group Comparsion
CompaniesTotal
Income
NIM
Margins
%
Net NPA
Ratio %RoE % ROA % P/Adj BV (x) CMP FV
Canara Bank 218,274 2.45% 1.09% 21.7% 1.2% 2.36 764 10
PNB 255,220 3.0% 0.5% 21.0% 1.3% 2.50 1369 10
SBI 1,352,160 2.5% 1.7% 14.0% 0.8% 2.62 3441 10
BOB 206,240 2.4% 0.3% 20.0% 1.1% 2.40 1036 10
* FY10 figures
November 8, 2010
www.fullertonsecurities.co.in Page | 4
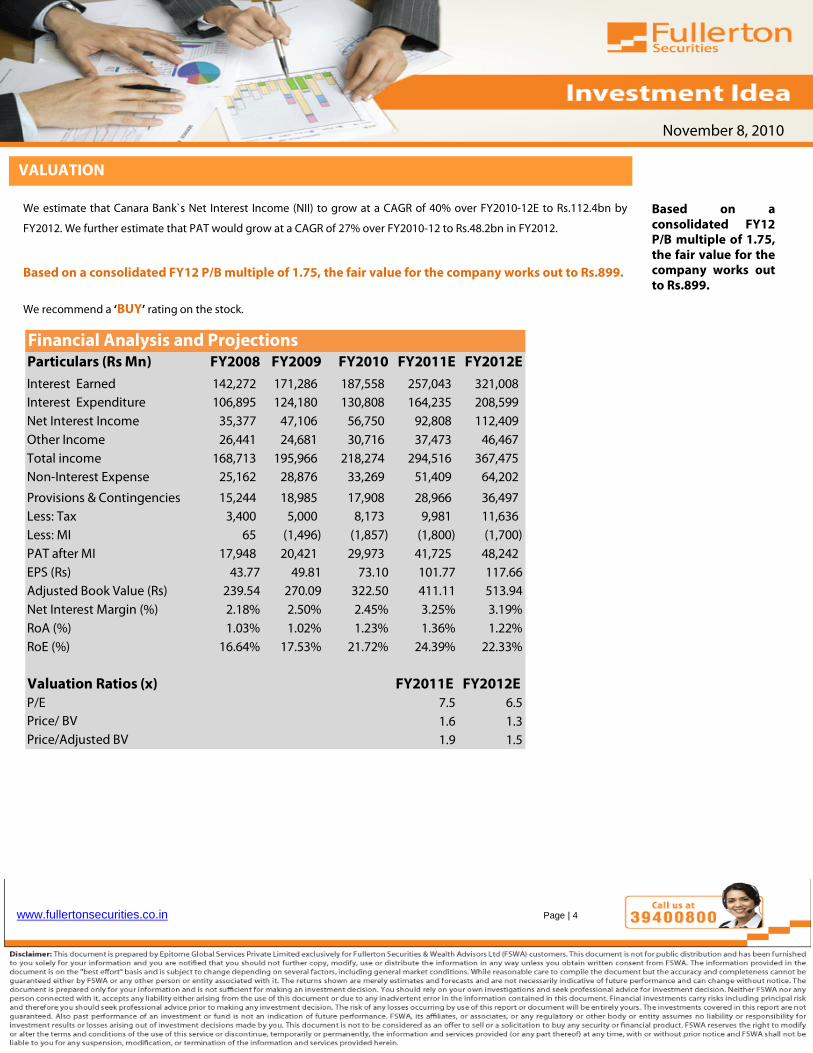
Based on a consolidated FY12 P/B multiple of 1.75, the fair value for the company works out to Rs.899.
VALUATION We estimate that Canara Bank`s Net Interest Income (NII) to grow at a CAGR of 40% over FY2010-12E to Rs.112.4bn by
FY2012. We further estimate that PAT would grow at a CAGR of 27% over FY2010-12 to Rs.48.2bn in FY2012.
Based on a consolidated FY12 P/B multiple of 1.75, the fair value for the company works out to Rs.899.
We recommend a ‘BUY’ rating on the stock.
Particulars (Rs Mn) FY2008 FY2009 FY2010 FY2011E FY2012E
Interest Earned 142,272 171,286 187,558 257,043 321,008
Interest Expenditure 106,895 124,180 130,808 164,235 208,599
Net Interest Income 35,377 47,106 56,750 92,808 112,409
Other Income 26,441 24,681 30,716 37,473 46,467
Total income 168,713 195,966 218,274 294,516 367,475
Non-Interest Expense 25,162 28,876 33,269 51,409 64,202
Provisions & Contingencies 15,244 18,985 17,908 28,966 36,497
Less: Tax 3,400 5,000 8,173 9,981 11,636
Less: MI 65 (1,496) (1,857) (1,800) (1,700)
PAT after MI 17,948 20,421 29,973 41,725 48,242
EPS (Rs) 43.77 49.81 73.10 101.77 117.66
Adjusted Book Value (Rs) 239.54 270.09 322.50 411.11 513.94
Net Interest Margin (%) 2.18% 2.50% 2.45% 3.25% 3.19%
RoA (%) 1.03% 1.02% 1.23% 1.36% 1.22%
RoE (%) 16.64% 17.53% 21.72% 24.39% 22.33%
Valuation Ratios (x) FY2011E FY2012E
P/E 7.5 6.5
Price/ BV 1.6 1.3
Price/Adjusted BV 1.9 1.5
Financial Analysis and Projections
November 8, 2010
www.fullertonsecurities.co.in Page | 5
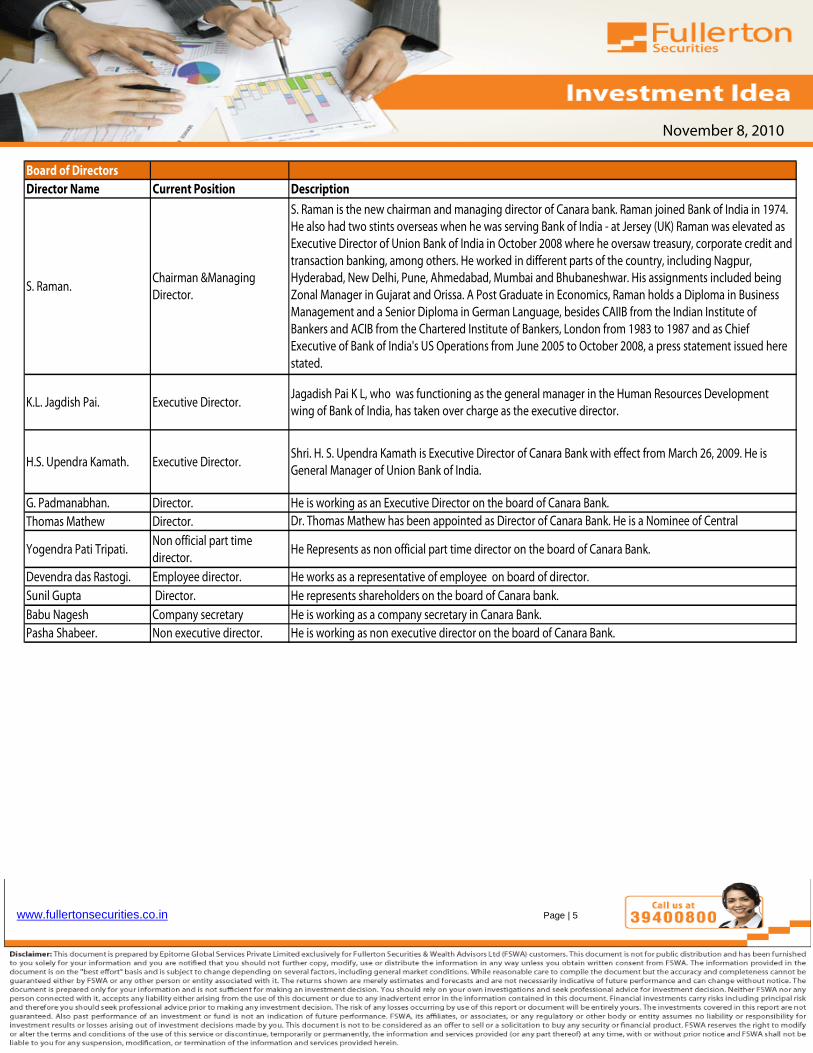
Board of Directors
Director Name Current Position Description
S. Raman.Chairman &Managing
Director.
S. Raman is the new chairman and managing director of Canara bank. Raman joined Bank of India in 1974.
He also had two stints overseas when he was serving Bank of India - at Jersey (UK) Raman was elevated as
Executive Director of Union Bank of India in October 2008 where he oversaw treasury, corporate credit and
transaction banking, among others. He worked in different parts of the country, including Nagpur,
Hyderabad, New Delhi, Pune, Ahmedabad, Mumbai and Bhubaneshwar. His assignments included being
Zonal Manager in Gujarat and Orissa. A Post Graduate in Economics, Raman holds a Diploma in Business
Management and a Senior Diploma in German Language, besides CAIIB from the Indian Institute of
Bankers and ACIB from the Chartered Institute of Bankers, London from 1983 to 1987 and as Chief
Executive of Bank of India's US Operations from June 2005 to October 2008, a press statement issued here
stated.
K.L. Jagdish Pai. Executive Director.Jagadish Pai K L, who was functioning as the general manager in the Human Resources Development
wing of Bank of India, has taken over charge as the executive director.
H.S. Upendra Kamath. Executive Director.Shri. H. S. Upendra Kamath is Executive Director of Canara Bank with effect from March 26, 2009. He is
General Manager of Union Bank of India.
G. Padmanabhan. Director. He is working as an Executive Director on the board of Canara Bank.
Thomas Mathew Director. Dr. Thomas Mathew has been appointed as Director of Canara Bank. He is a Nominee of Central
Government.Yogendra Pati Tripati.
Non official part time
director.He Represents as non official part time director on the board of Canara Bank.
Devendra das Rastogi. Employee director. He works as a representative of employee on board of director.
Sunil Gupta Director. He represents shareholders on the board of Canara bank.
Babu Nagesh Company secretary He is working as a company secretary in Canara Bank.
Pasha Shabeer. Non executive director. He is working as non executive director on the board of Canara Bank.