Embed Size (px)
Citation preview

1
London – March, 2013
Investment Opportunities in the
Brazilian Economy
Luciano Coutinho Luciano Coutinho President

2
Summary
1 Fundamentals of the Brazilian Economy
2 Investment Outlook & Infrastructure
Perspectives
3 The Financing of Infrastructure

3
Fundamentals of the Brazilian Economy 1
4
Brazil has solid fundamentals for sustaining economic growth
Stable legal and institutional framework;
Social inclusion has spurred the domestic market;
Healthy banking sector not exposed to troubled assets;
Robustness of the external sector;
Strengthening of long-term planning;
Government has conditions to foster growth:
Fiscal and monetary instruments;
Improvement of regulatory framework;
Partnership with private sector.
5
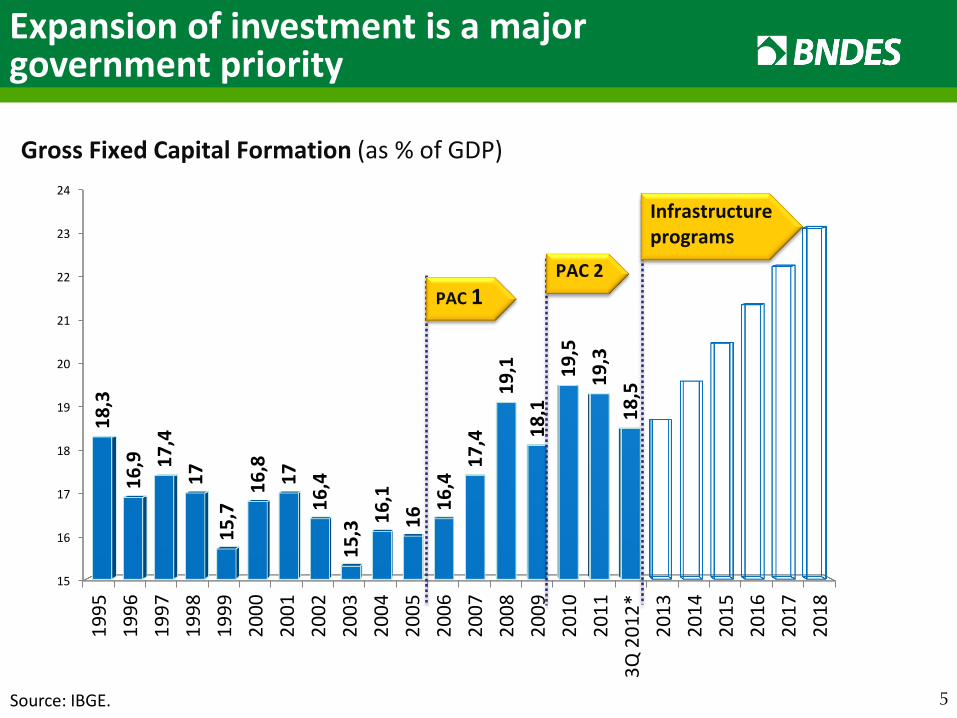
Gross Fixed Capital Formation (as % of GDP)
Expansion of investment is a major government priority
15
16
17
18
19
20
21
22
23
24
19
95
19
96
19
97
19
98
19
99
20
00
20
01
20
02
20
03
20
04
20
05
20
06
20
07
20
08
20
09
20
10
20
11
3Q
20
12
*
20
13
20
14
20
15
20
16
20
17
20
18
18
,3
16
,9
17
,4
17
15
,7 1
6,8
17
16
,4
15
,3 16
,1
16
16
,4 1
7,4
19
,1
18
,1
19
,5
19
,3
18
,5
PAC 1
Infrastructure programs
PAC 2
Source: IBGE.
6
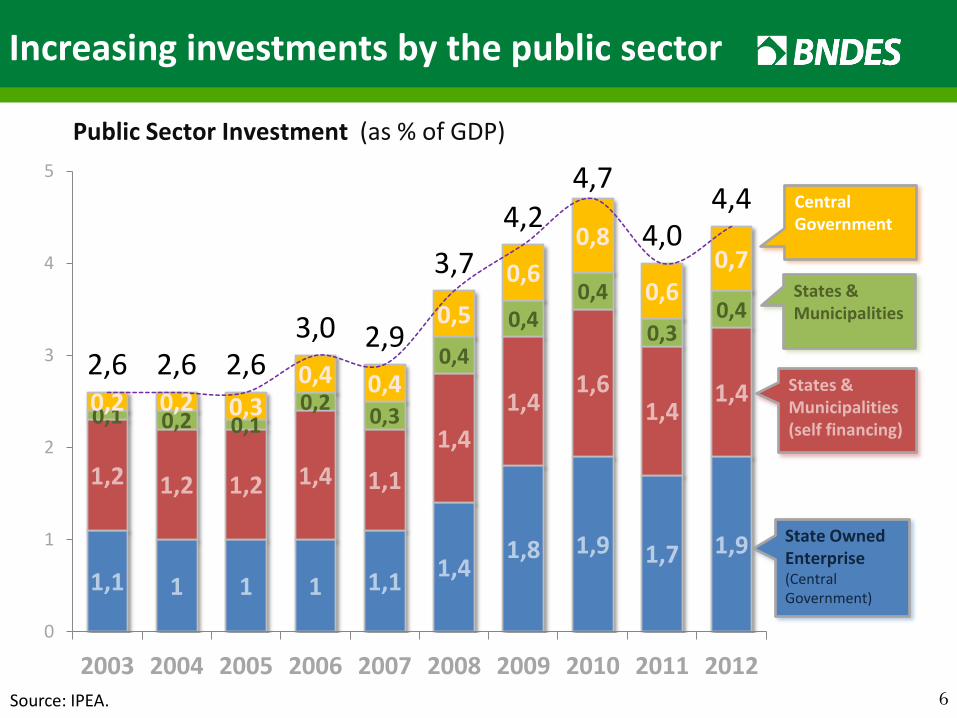
Increasing investments by the public sector
Public Sector Investment (as % of GDP)
1,1 1 1 1 1,1 1,4
1,8 1,9 1,7 1,9
1,2 1,2 1,2 1,4 1,1
1,4
1,4 1,6
1,4 1,4
0,1 0,2 0,1 0,2
0,3
0,4
0,4 0,4
0,3 0,4
0,2 0,2 0,3 0,4 0,4
0,5
0,6
0,8
0,6 0,7
2,6 2,6 2,6 3,0 2,9
3,7
4,2 4,7
4,0 4,4
0
1
2
3
4
5
2003 2004 2005 2006 2007 2008 2009 2010 2011 2012
Central Government
States & Municipalities
States & Municipalities (self financing)
State Owned Enterprise (Central Government)
Source: IPEA.

7
Sound macroeconomic fundamentals: Declining Net Public Debt/GDP
Consolidated Public Sector Net Debt (as % of GDP)
60,4
54,8
50,6 48,4 47,3
45,5
38,5
42,1 39,2
36,4 35,1
30
35
40
45
50
55
60
65
2002 2003 2004 2005 2006 2007 2008 2009 2010 2011 2012
Source: Brazilian Central Bank.

8
CPI Inflation (IPCA index, % YoY)
Sound macroeconomic fundamentals: Inflation under control
8,9
6,0
7,7
12,5
9,3
7,6
5,7
3,1 4,5
5,9
4,3
5,9 6,5
5,84
0
2
4
6
8
10
12
14
1999 2000 2001 2002 2003 2004 2005 2006 2007 2008 2009 2010 2011 2012
IPCA Lower Bound Center of the Target Upper BoundSource: IBGE.
9
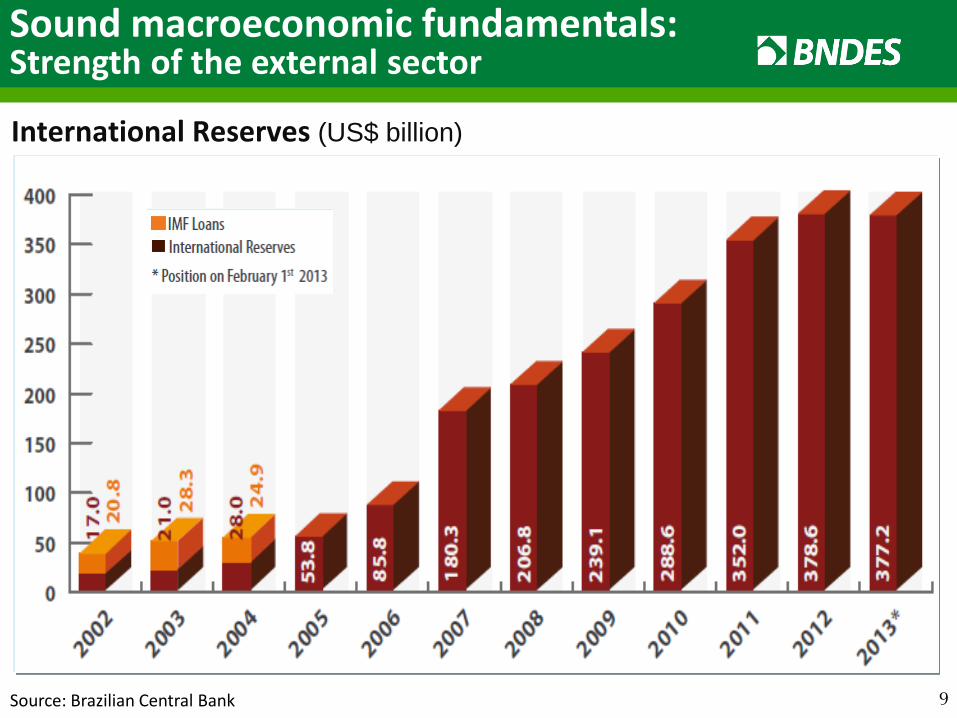
International Reserves (US$ billion)
Sound macroeconomic fundamentals: Strength of the external sector
Source: Brazilian Central Bank

10
Foreign Direct Investment - FDI (US$ billion)
• Fonte: UNCTAD
• Elaboração: Ministério da Fazenda
FDI at highest levels
Source: UNCTAD
11
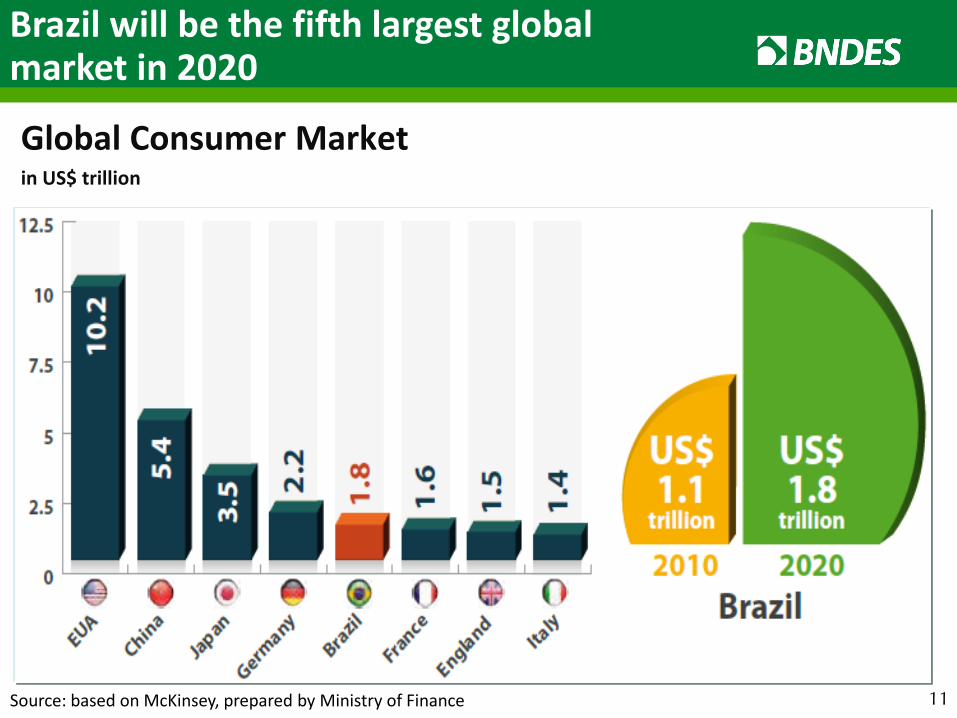
Brazil will be the fifth largest global market in 2020
Global Consumer Market in US$ trillion
Source: based on McKinsey, prepared by Ministry of Finance
12
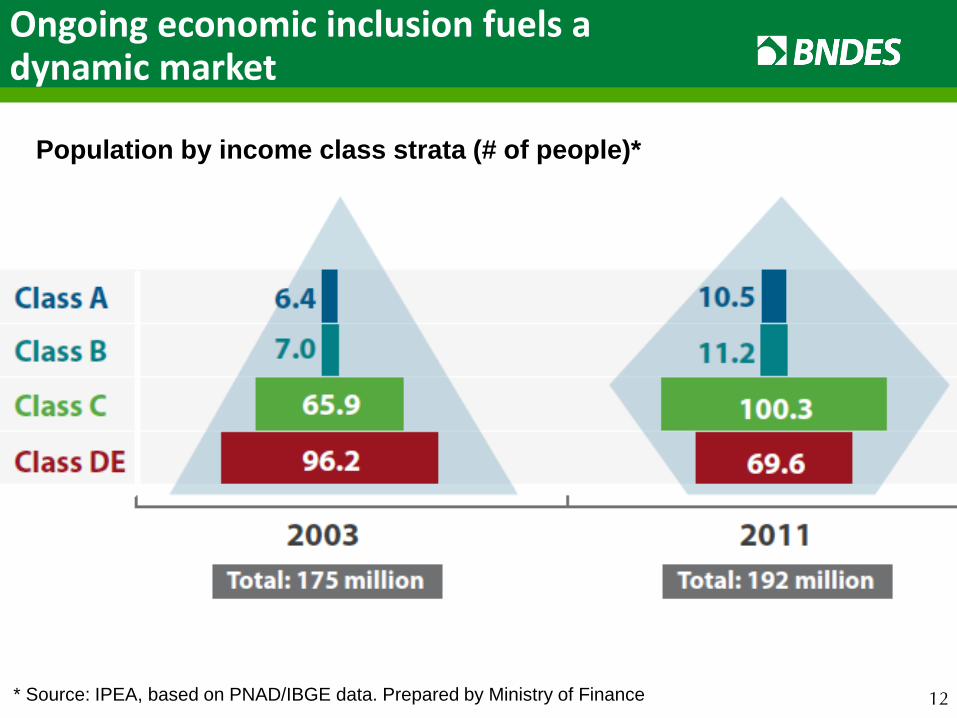
Ongoing economic inclusion fuels a dynamic market
Population by income class strata (# of people)*
* Source: IPEA, based on PNAD/IBGE data. Prepared by Ministry of Finance
13
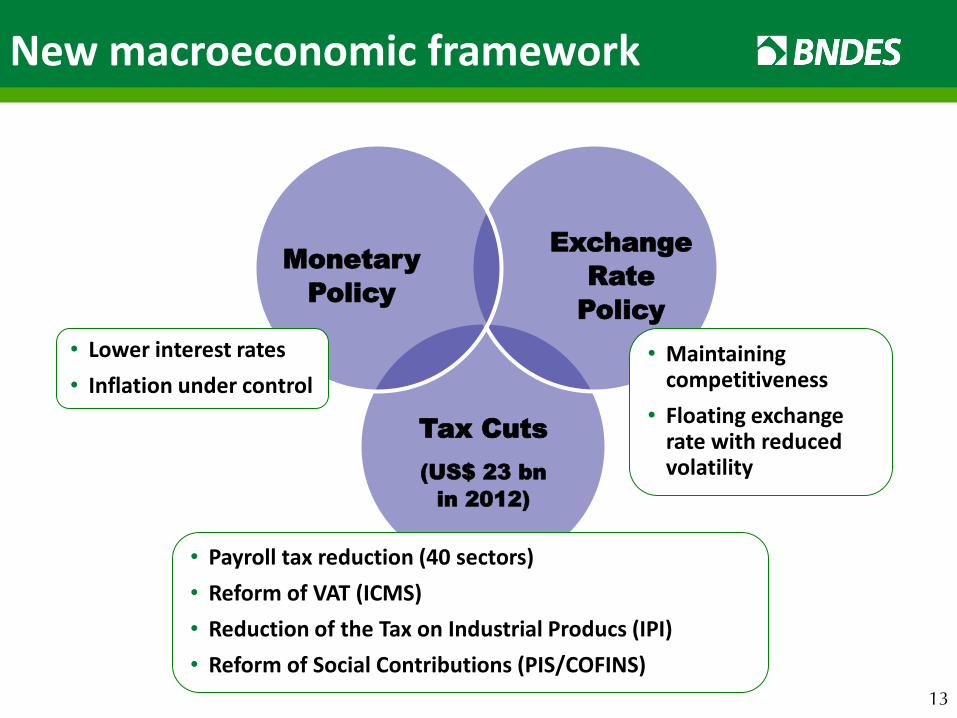
New macroeconomic framework
Tax Cuts
(US$ 23 bn
in 2012)
Exchange
Rate
Policy
Monetary
Policy
• Lower interest rates
• Inflation under control
• Maintaining competitiveness
• Floating exchange rate with reduced volatility
• Payroll tax reduction (40 sectors)
• Reform of VAT (ICMS)
• Reduction of the Tax on Industrial Producs (IPI)
• Reform of Social Contributions (PIS/COFINS)

14
Expected growth in business
Recent survey* (with more than 1,300 CEOs), indicated Brazil as the third most
often mentioned country for expanding business over the next 12 months
Countries where companies expect to expand their business (% of total answers)
* “Dealing with disruption, adapting to survive and thrive”,
PricewaterhouseCoopers, 16th Annual Global CEO Survey, January 2013, p.12.
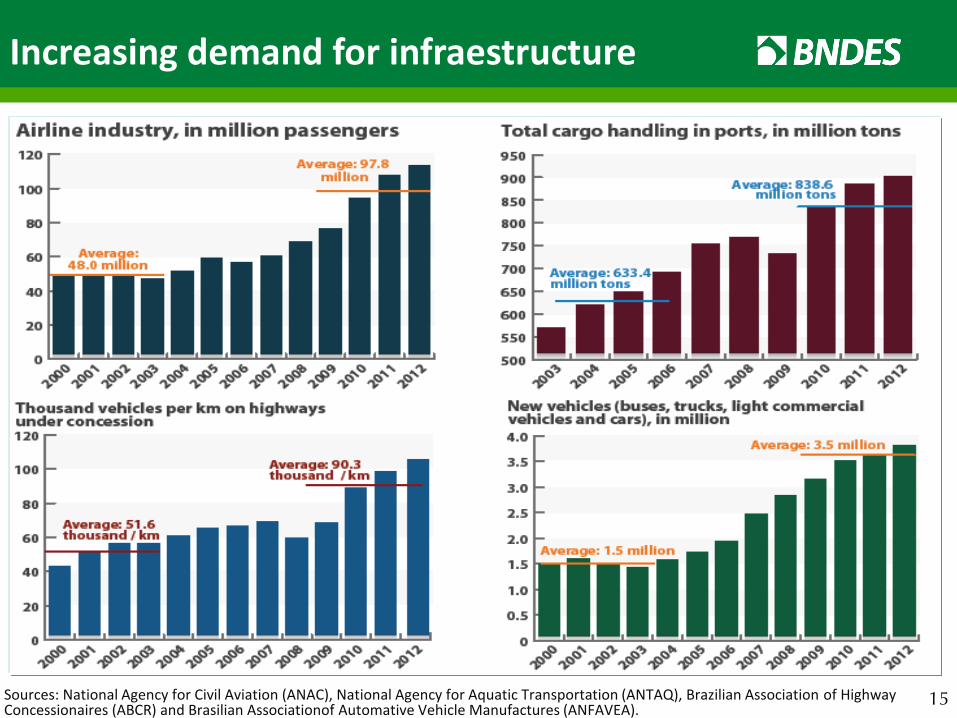
15 Sources: National Agency for Civil Aviation (ANAC), National Agency for Aquatic Transportation (ANTAQ), Brazilian Association of Highway Concessionaires (ABCR) and Brasilian Associationof Automative Vehicle Manufactures (ANFAVEA).
Increasing demand for infraestructure
16
Investment Outlook and Infrastructure Perspectives 2
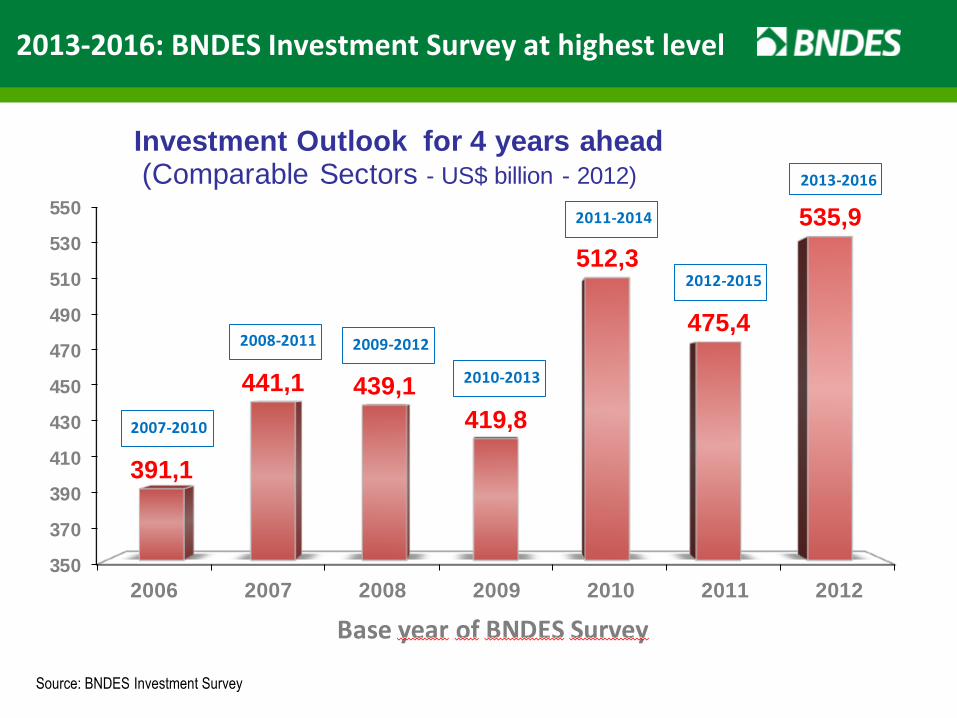
2013-2016: BNDES Investment Survey at highest level
Source: BNDES Investment Survey
350
370
390
410
430
450
470
490
510
530
550
2006 2007 2008 2009 2010 2011 2012
391,1
441,1 439,1
419,8
512,3
475,4
535,9
Investment Outlook for 4 years ahead(Comparable Sectors - US$ billion - 2012)
Base year of BNDES Survey
2007-2010
2008-2011 2009-2012
2010-2013
2011-2014
2012-2015
2013-2016
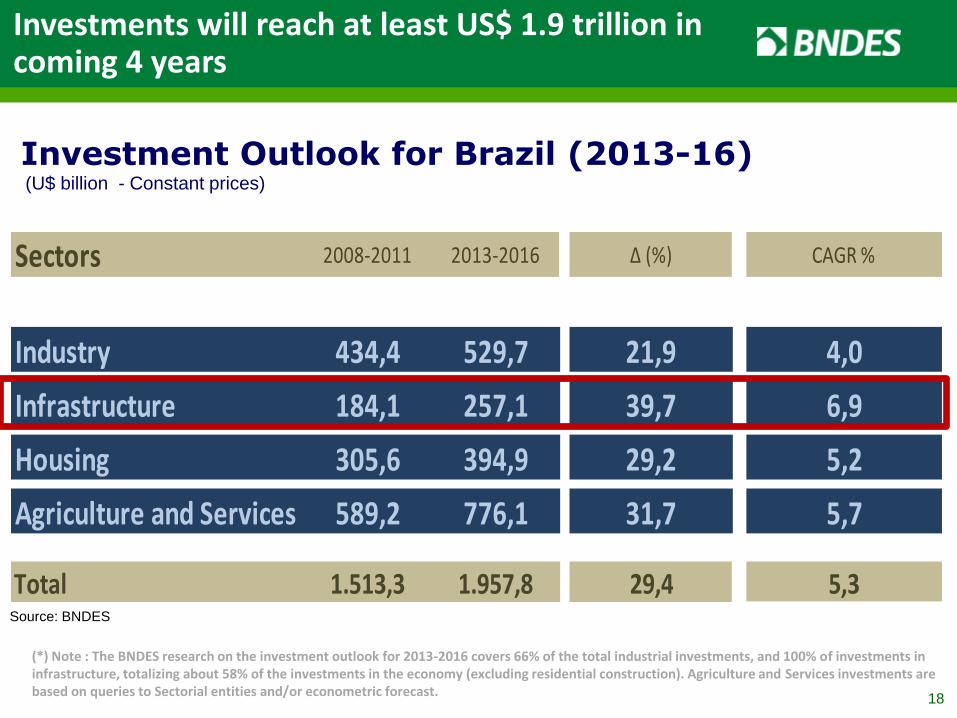
Investments will reach at least US$ 1.9 trillion in coming 4 years
Source: BNDES
(*) Note : The BNDES research on the investment outlook for 2013-2016 covers 66% of the total industrial investments, and 100% of investments in infrastructure, totalizing about 58% of the investments in the economy (excluding residential construction). Agriculture and Services investments are based on queries to Sectorial entities and/or econometric forecast.
Sectors 2008-2011 2013-2016 Δ (%) CAGR %
Industry 434,4 529,7 21,9 4,0
Infrastructure 184,1 257,1 39,7 6,9
Housing 305,6 394,9 29,2 5,2
Agriculture and Services 589,2 776,1 31,7 5,7
Total 1.513,3 1.957,8 29,4 5,3
Investment Outlook for Brazil (2013-16) (U$ billion - Constant prices)
18
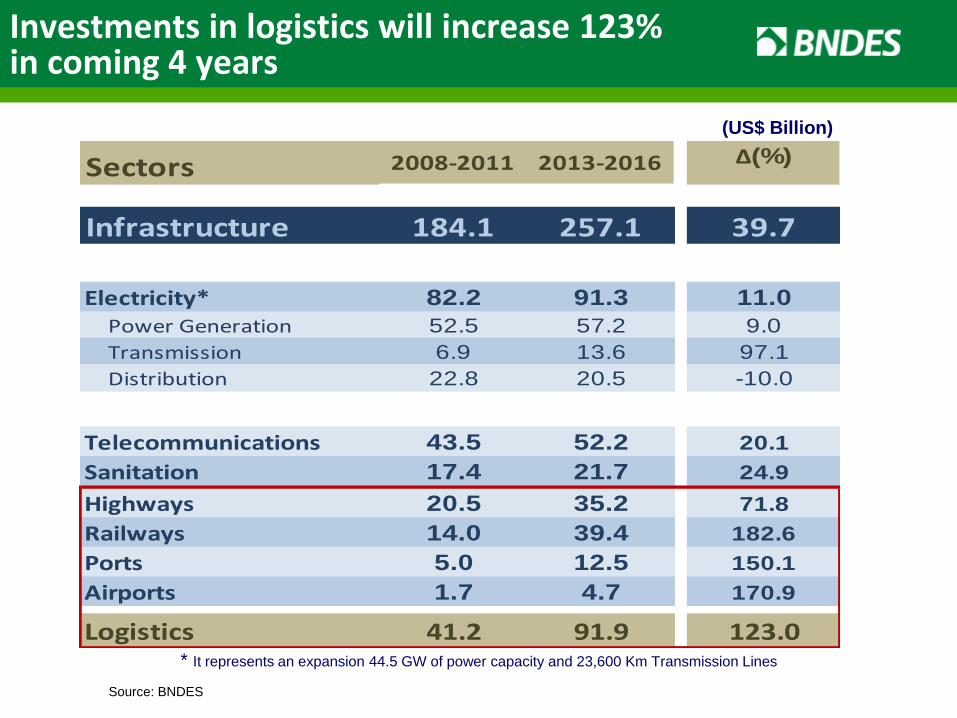
Investments in logistics will increase 123% in coming 4 years
Source: BNDES
(US$ Billion)
Logística 80,4 179,2 123,0 * It represents an expansion 44.5 GW of power capacity and 23,600 Km Transmission Lines
Sectors 2008-2011 2013-2016 Δ(%)
Infrastructure 184.1 257.1 39.7
Electricity* 82.2 91.3 11.0
Power Generation 52.5 57.2 9.0
Transmission 6.9 13.6 97.1
Distribution 22.8 20.5 -10.0
Telecommunications 43.5 52.2 20.1
Sanitation 17.4 21.7 24.9
Highways 20.5 35.2 71.8
Railways 14.0 39.4 182.6
Ports 5.0 12.5 150.1
Airports 1.7 4.7 170.9
Logistics 41.2 91.9 123.0
20
Financing of Infrastructure 3
Hydro Power Plant
Alternative energy
Distribution
Transmission Lines
Railways
Highways
Ports, Terminals, and
Warehouses
Airports and Air
Transportation
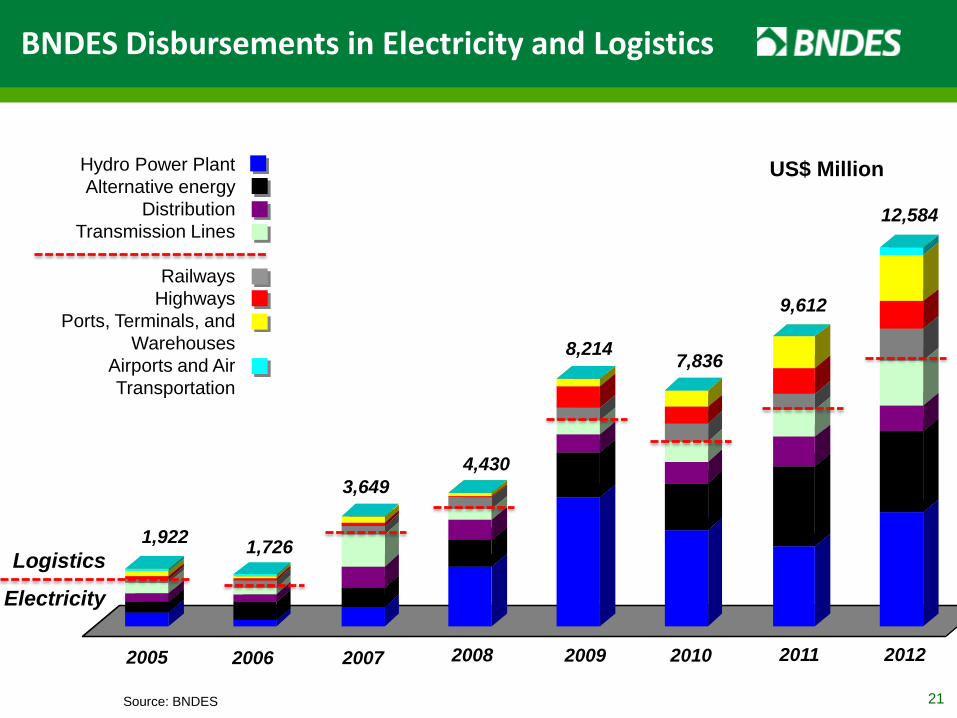
US$ Million
Source: BNDES 21
BNDES Disbursements in Electricity and Logistics
1,922
2006 2007 2008
4,430
8,214 7,836
1,726
3,649
2005 2009 2010 2011 2012
9,612
12,584
Electricity
Logistics
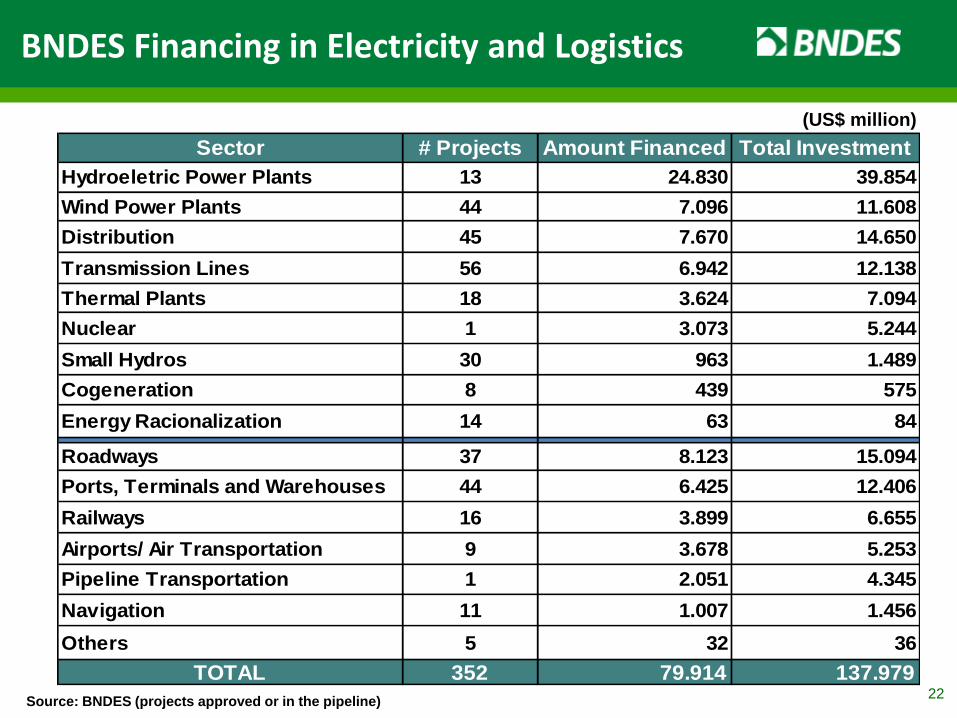
BNDES Financing in Electricity and Logistics
Sector # Projects Amount Financed Total Investment
Hydroeletric Power Plants 13 24.830 39.854
Wind Power Plants 44 7.096 11.608
Distribution 45 7.670 14.650
Transmission Lines 56 6.942 12.138
Thermal Plants 18 3.624 7.094
Nuclear 1 3.073 5.244
Small Hydros 30 963 1.489
Cogeneration 8 439 575
Energy Racionalization 14 63 84
Roadways 37 8.123 15.094
Ports, Terminals and Warehouses 44 6.425 12.406
Railways 16 3.899 6.655
Airports/ Air Transportation 9 3.678 5.253
Pipeline Transportation 1 2.051 4.345
Navigation 11 1.007 1.456
Others 5 32 36
TOTAL 352 79.914 137.979
(US$ million)
Source: BNDES (projects approved or in the pipeline) 22
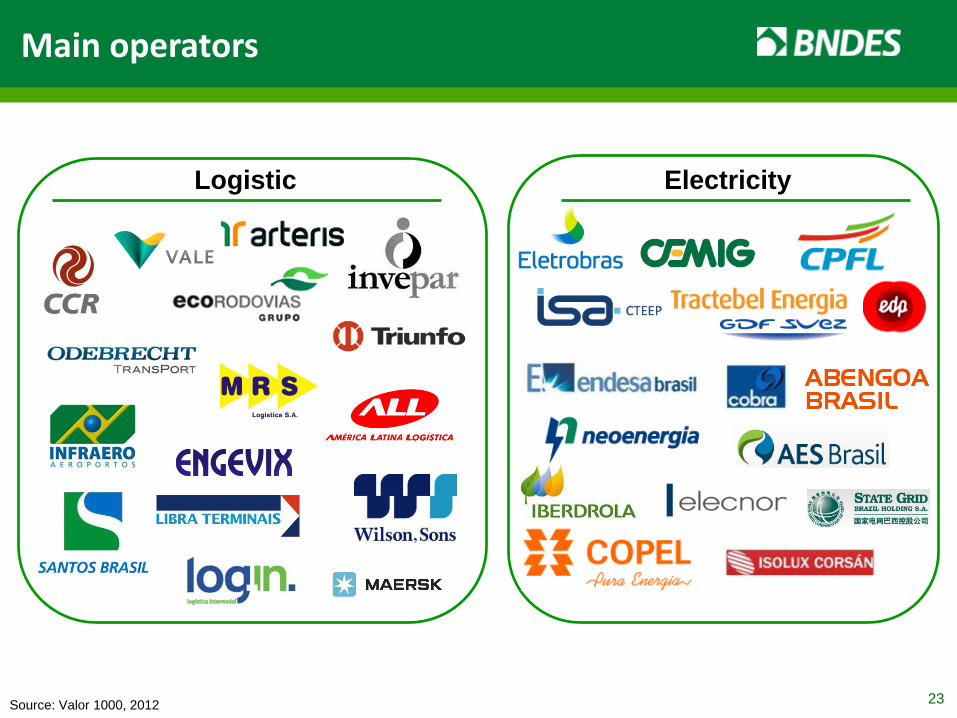
Logistic
Main operators
Electricity
Source: Valor 1000, 2012 23
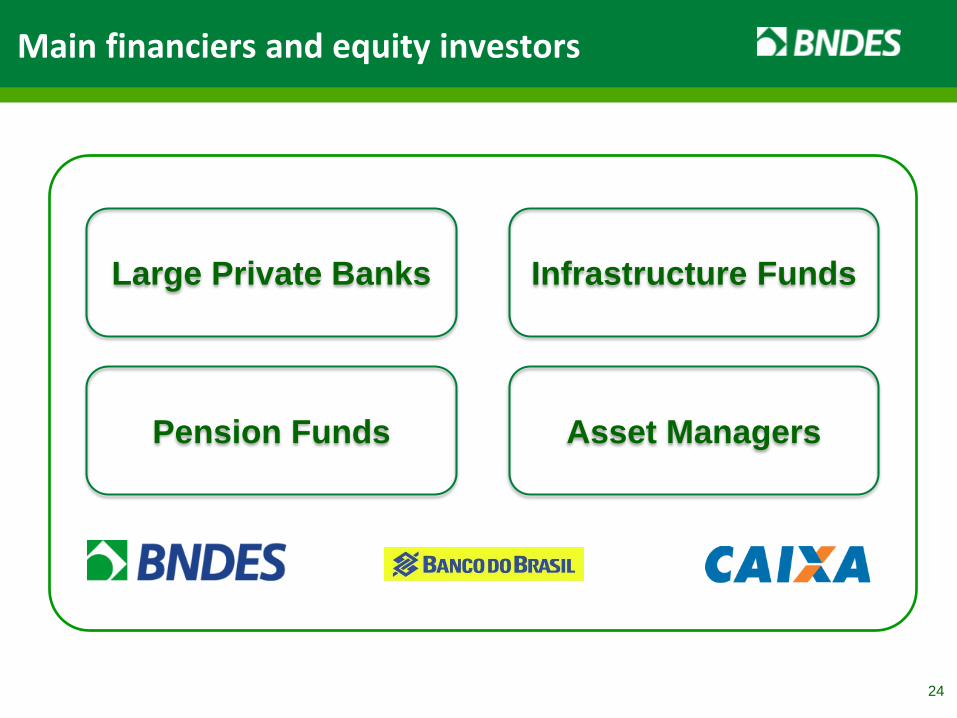
Main financiers and equity investors
24
Infrastructure Funds Large Private Banks
Pension Funds Asset Managers
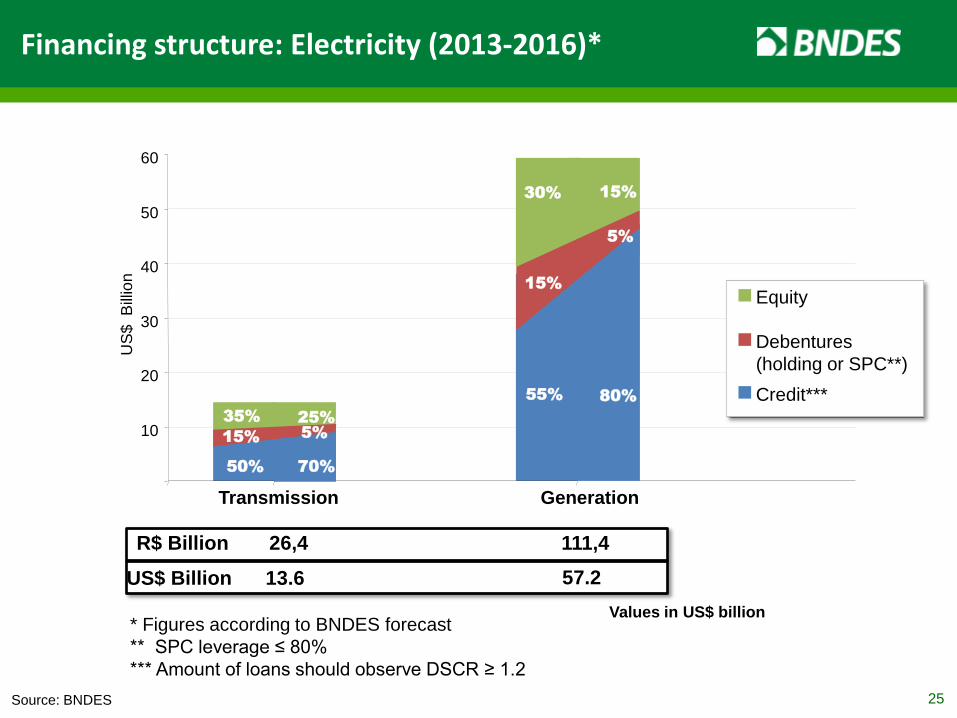
Transmission Generation
26,4 R$ Billion
US$ Billion
111,4
13.6 57.2
50%
55%
10
20
30
40
50
60
US
$ B
illio
n
70%
25%
80%
35%
15% 30%
Source: BNDES
* Figures according to BNDES forecast
** SPC leverage ≤ 80%
*** Amount of loans should observe DSCR ≥ 1.2
Equity
Debentures
(holding or SPC**)
Credit***
Values in US$ billion
Financing structure: Electricity (2013-2016)*
15%
5%
5% 15%
25
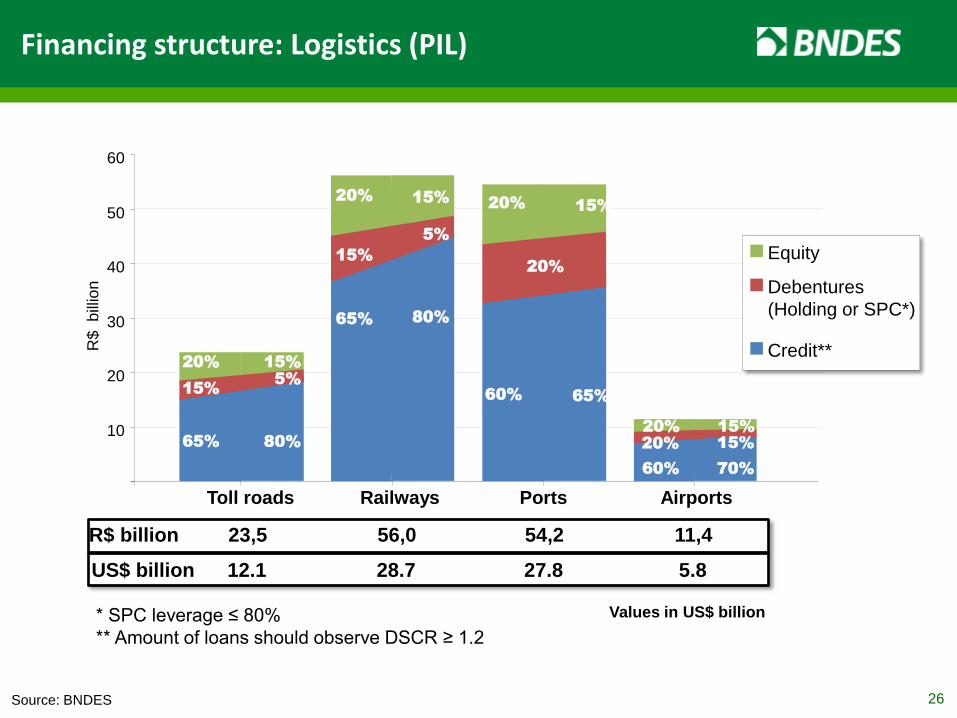
Toll roads Railways Ports Airports
Financing structure: Logistics (PIL)
23,5 R$ billion
US$ billion
56,0 54,2 11,4
12.1 28.7 27.8 5.8
Values in US$ billion
65%
65%
60%
60%
10
20
30
40
50
60
R$
b
illio
n
80%
80%
20%
15%
15%
20%
20%
65%
15%
5%
5%
15%
20%
20% 15%
70%
15%
15%
20%
* SPC leverage ≤ 80%
** Amount of loans should observe DSCR ≥ 1.2
Source: BNDES 26
Equity
Debentures
(Holding or SPC*)
Credit**
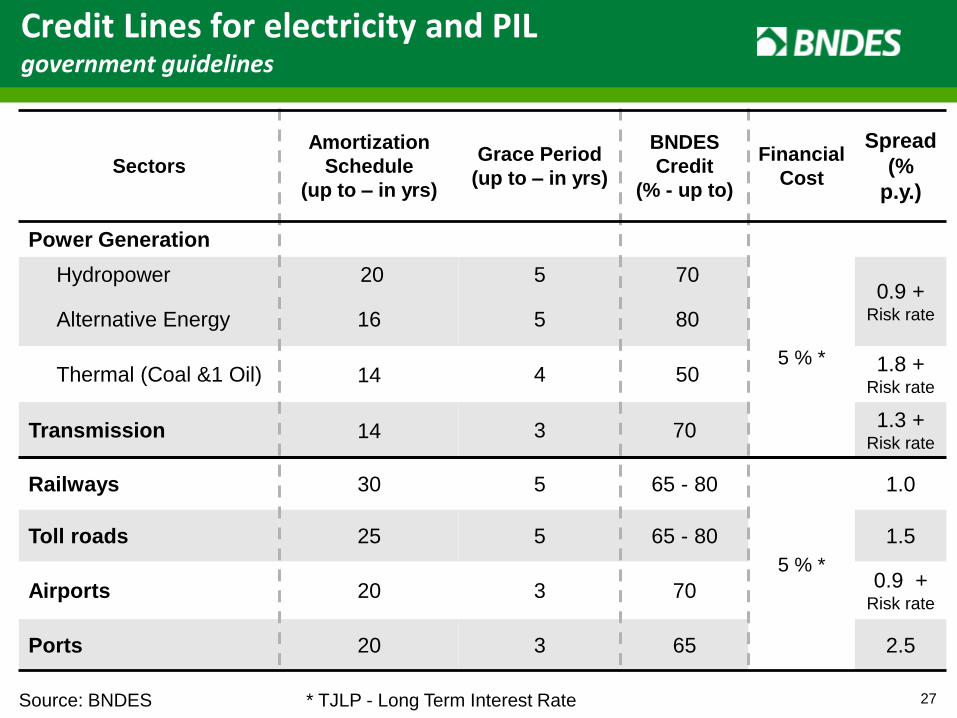
Credit Lines for electricity and PIL government guidelines
Sectors
Amortization
Schedule
(up to – in yrs)
Grace Period
(up to – in yrs)
BNDES
Credit
(% - up to)
Financial
Cost
Spread
(%
p.y.)
Power Generation
Hydropower 20 5 70
5 % *
0.9 + Risk rate Alternative Energy 16 5 80
Thermal (Coal &1 Oil) 14 4 50 1.8 +
Risk rate
Transmission 14 3 70 1.3 +
Risk rate
Railways 30 5 65 - 80
5 % *
1.0
Toll roads 25 5 65 - 80 1.5
Airports 20 3 70 0.9 +
Risk rate
Ports 20 3 65 2.5
Source: BNDES * TJLP - Long Term Interest Rate 27
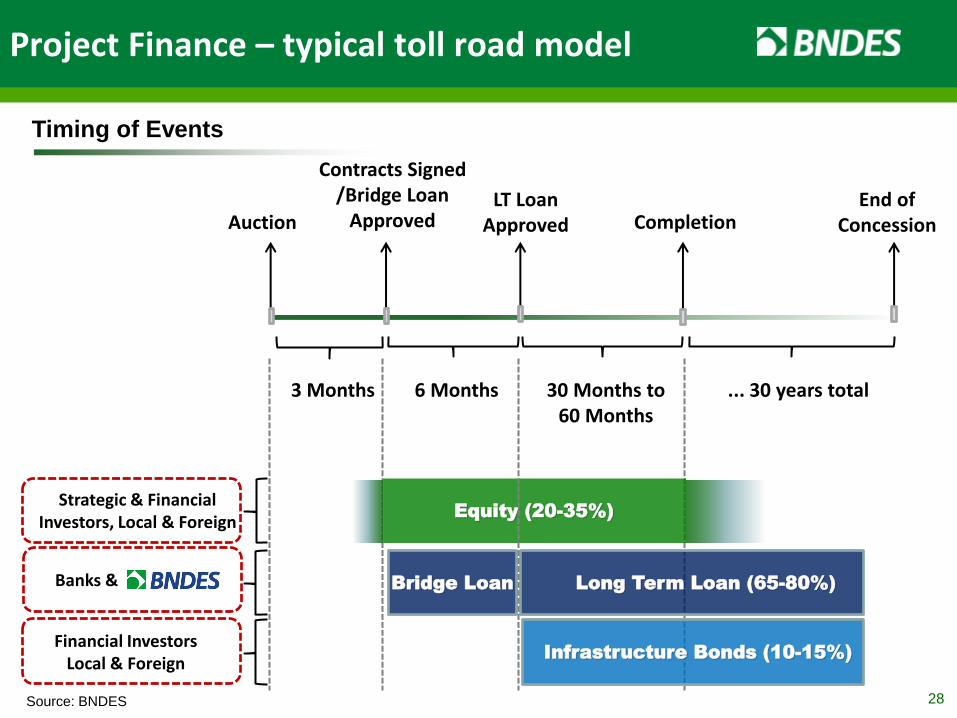
Project Finance – typical toll road model
Auction
3 Months
Contracts Signed /Bridge Loan
Approved LT Loan
Approved
6 Months 30 Months to 60 Months
Completion End of
Concession
... 30 years total
Equity (20-35%)
Bridge Loan Long Term Loan (65-80%)
Infrastructure Bonds (10-15%)
Strategic & Financial Investors, Local & Foreign
Financial Investors Local & Foreign
Timing of Events
Banks &
Source: BNDES 28
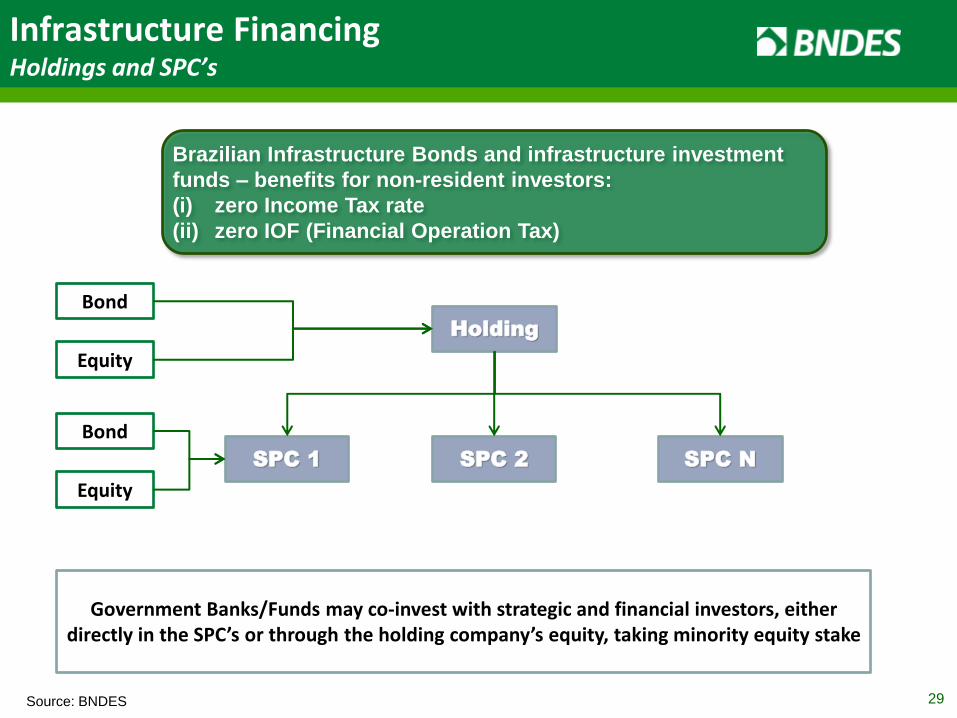
Infrastructure Financing Holdings and SPC’s
Holding
Government Banks/Funds may co-invest with strategic and financial investors, either directly in the SPC’s or through the holding company’s equity, taking minority equity stake
SPC 1 SPC 2 SPC N
Bond
Equity
Bond
Equity
Source: BNDES 29
Brazilian Infrastructure Bonds and infrastructure investment
funds – benefits for non-resident investors:
(i) zero Income Tax rate
(ii) zero IOF (Financial Operation Tax)
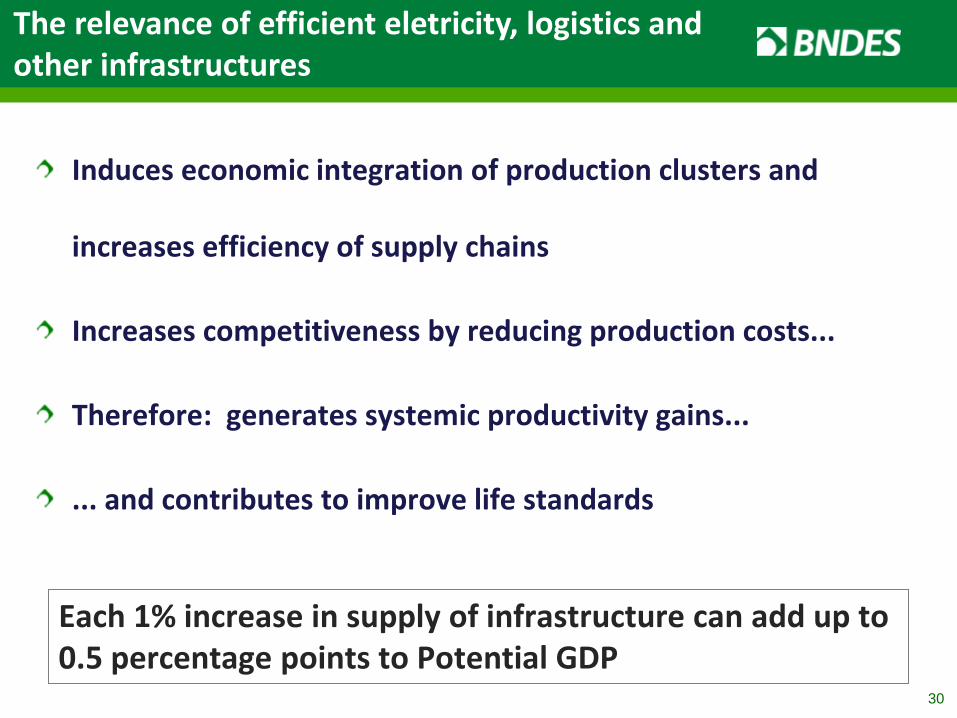
Each 1% increase in supply of infrastructure can add up to 0.5 percentage points to Potential GDP
Induces economic integration of production clusters and
increases efficiency of supply chains
Increases competitiveness by reducing production costs...
Therefore: generates systemic productivity gains...
... and contributes to improve life standards
The relevance of efficient eletricity, logistics and other infrastructures
30
Concluding remarks
• Brazilian growth will be led mainly by infrastructure investments
• Infrastructure pipeline: many opportunities of low risk and attractive yields
• Government financial institutions, like BNDES, will retain a role in financing Brazilian development, but…
• Investment financing in larger scale requires new private players and investors,
• making use of project finance and capital market instruments, led by private financial institutions
31

32
London – March, 2013
Investment Opportunities in the
Brazilian Economy
Luciano Coutinho Luciano Coutinho President