Embed Size (px)
Citation preview
Informed Options Trading prior to Corporate Events
Patrick Augustin · McGill University-Desautels Faculty of ManagementMenachem Brenner · New York University-Leonard N. Stern School of BusinessJianfeng Hu · Singapore Management University-Lee Kong Chian School of BusinessMarti G. Subrahmanyam · New York University-Leonard N. Stern School of Business
International Risk Management Conference
Jerusalem, Israel · June 13-15, 2016
Outline
I Research AgendaI Informed Options Trading prior to Corporate Events
I Mergers & Acquisitions - Up to date!I Identifying Prevalence of informed options trading in the economy.I Distinguish between informed and illegal insider trading.
I SpinoffsI No Prior Evidence on Spinoffs, despite similar announcement effects to M&As.
I Going forward: Study Nature of Insider/Informed TradingI All prior studies focus on one specific event: M&As, Spinoffs, Drug approvals, ....I Heterogeneity in informed trading = f(announcement characteristics).
Augustin, Brenner, Hu, & Subrahmanyam Informed Options Trading prior to Corporate Events 2 / 91
I Research AgendaI Informed Options Trading prior to Corporate Events
I Mergers & Acquisitions - Up to date!I Identifying Prevalence of informed options trading in the economy.I Distinguish between informed and illegal insider trading.
I SpinoffsI No Prior Evidence on Spinoffs, despite similar announcement effects to M&As.
I Going forward: Study Nature of Insider/Informed TradingI All prior studies focus on one specific event: M&As, Spinoffs, Drug approvals, ....I Heterogeneity in informed trading = f(announcement characteristics).
Augustin, Brenner, Hu, & Subrahmanyam Informed Options Trading prior to Corporate Events 3 / 91
Motivation
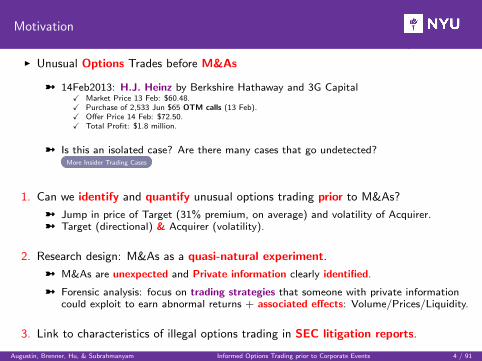
I Unusual Options Trades before M&As
ü 14Feb2013: H.J. Heinz by Berkshire Hathaway and 3G CapitalX Market Price 13 Feb: $60.48.X Purchase of 2,533 Jun $65 OTM calls (13 Feb).X Offer Price 14 Feb: $72.50.X Total Profit: $1.8 million.
ü Is this an isolated case? Are there many cases that go undetected?More Insider Trading Cases
1. Can we identify and quantify unusual options trading prior to M&As?
ü Jump in price of Target (31% premium, on average) and volatility of Acquirer.ü Target (directional) & Acquirer (volatility).
2. Research design: M&As as a quasi-natural experiment.
ü M&As are unexpected and Private information clearly identified.
ü Forensic analysis: focus on trading strategies that someone with private informationcould exploit to earn abnormal returns + associated effects: Volume/Prices/Liquidity.
3. Link to characteristics of illegal options trading in SEC litigation reports.
Augustin, Brenner, Hu, & Subrahmanyam Informed Options Trading prior to Corporate Events 4 / 91
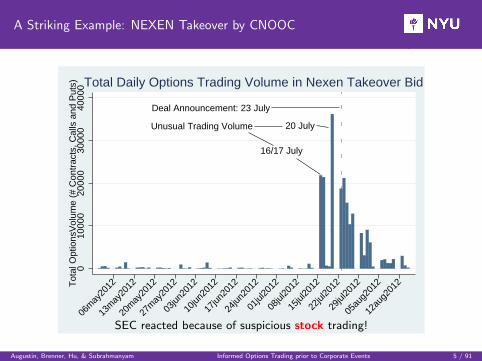
A Striking Example: NEXEN Takeover by CNOOC
Unusual Trading Volume
Deal Announcement: 23 July
20 July
16/17 July
010
000
2000
030
000
4000
0T
otal
Opt
ions
Vol
ume
(# C
ontr
acts
, Cal
ls a
nd P
uts)
06m
ay20
12
13m
ay20
12
20m
ay20
12
27m
ay20
12
03jun
2012
10jun
2012
17jun
2012
24jun
2012
01jul
2012
08jul
2012
15jul
2012
22jul
2012
29jul
2012
05au
g201
2
12au
g201
2
Total Daily Options Trading Volume in Nexen Takeover Bid
SEC reacted because of suspicious stock trading!
Augustin, Brenner, Hu, & Subrahmanyam Informed Options Trading prior to Corporate Events 5 / 91
Why do we care?
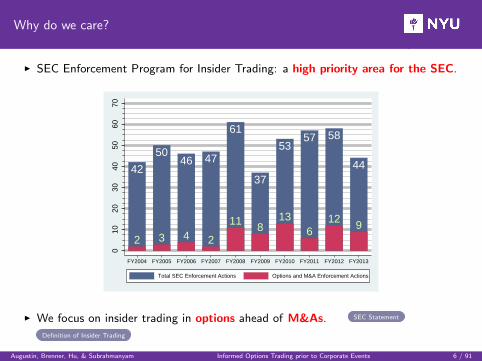
I SEC Enforcement Program for Insider Trading: a high priority area for the SEC.
42
5046 47
61
37
5357 58
44
2 3 4 2
11 813
612 9
010
2030
4050
6070
FY2004 FY2005 FY2006 FY2007 FY2008 FY2009 FY2010 FY2011 FY2012 FY2013
Total SEC Enforcement Actions Options and M&A Enforcement Actions
I We focus on insider trading in options ahead of M&As. SEC Statement
Definition of Insider Trading
Augustin, Brenner, Hu, & Subrahmanyam Informed Options Trading prior to Corporate Events 6 / 91
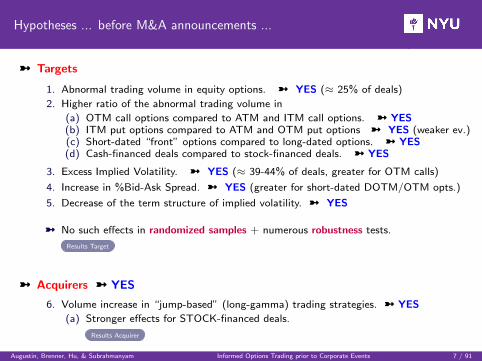
Hypotheses ... before M&A announcements ...
ü Targets
1. Abnormal trading volume in equity options. ü YES (≈ 25% of deals)
2. Higher ratio of the abnormal trading volume in
(a) OTM call options compared to ATM and ITM call options. ü YES(b) ITM put options compared to ATM and OTM put options ü YES (weaker ev.)(c) Short-dated “front” options compared to long-dated options. ü YES(d) Cash-financed deals compared to stock-financed deals. ü YES
3. Excess Implied Volatility. ü YES (≈ 39-44% of deals, greater for OTM calls)
4. Increase in %Bid-Ask Spread. ü YES (greater for short-dated DOTM/OTM opts.)
5. Decrease of the term structure of implied volatility. ü YES
ü No such effects in randomized samples + numerous robustness tests.
Results Target
ü Acquirers ü YES
6. Volume increase in “jump-based” (long-gamma) trading strategies. ü YES
(a) Stronger effects for STOCK-financed deals.
Results Acquirer
Augustin, Brenner, Hu, & Subrahmanyam Informed Options Trading prior to Corporate Events 7 / 91
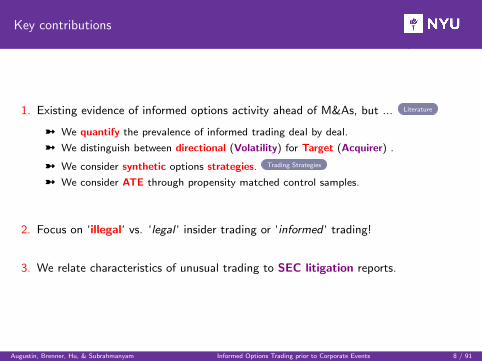
Key contributions
1. Existing evidence of informed options activity ahead of M&As, but ... Literature
ü We quantify the prevalence of informed trading deal by deal.
ü We distinguish between directional (Volatility) for Target (Acquirer) .
ü We consider synthetic options strategies. Trading Strategies
ü We consider ATE through propensity matched control samples.
2. Focus on ‘illegal‘ vs. ‘legal ‘ insider trading or ‘informed ‘ trading!
3. We relate characteristics of unusual trading to SEC litigation reports.
Augustin, Brenner, Hu, & Subrahmanyam Informed Options Trading prior to Corporate Events 8 / 91
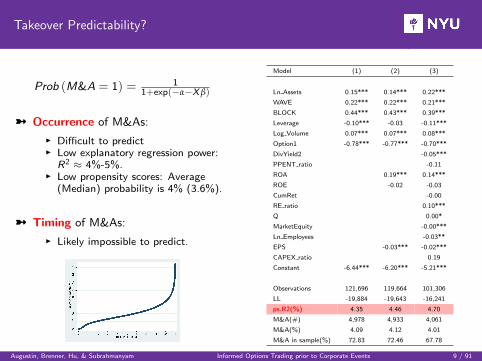
Takeover Predictability?
Prob (M&A = 1) = 11+exp(−α−X β)
ü Occurrence of M&As:
I Difficult to predictI Low explanatory regression power:
R2 ≈ 4%-5%.I Low propensity scores: Average
(Median) probability is 4% (3.6%).
ü Timing of M&As:
I Likely impossible to predict.
Model (1) (2) (3)
Ln Assets 0.15*** 0.14*** 0.22***
WAVE 0.22*** 0.22*** 0.21***
BLOCK 0.44*** 0.43*** 0.39***
Leverage -0.10*** -0.03 -0.11***
Log Volume 0.07*** 0.07*** 0.08***
Option1 -0.78*** -0.77*** -0.70***
DivYield2 -0.05***
PPENT ratio -0.11
ROA 0.19*** 0.14***
ROE -0.02 -0.03
CumRet -0.00
RE ratio 0.10***
Q 0.00*
MarketEquity -0.00***
Ln Employees -0.03**
EPS -0.03*** -0.02***
CAPEX ratio 0.19
Constant -6.44*** -6.20*** -5.21***
Observations 121,696 119,664 101,306
LL -19,884 -19,643 -16,241
ps.R2(%) 4.35 4.46 4.70
M&A(#) 4,978 4,933 4,061
M&A(%) 4.09 4.12 4.01
M&A in sample(%) 72.83 72.46 67.78
Augustin, Brenner, Hu, & Subrahmanyam Informed Options Trading prior to Corporate Events 9 / 91
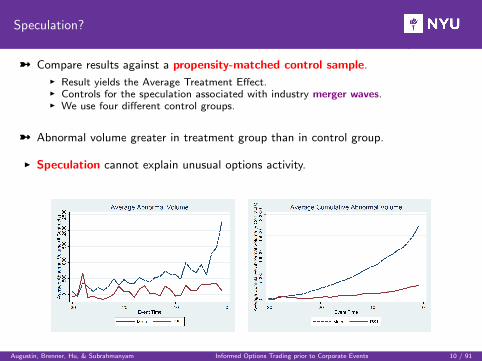
Speculation?
ü Compare results against a propensity-matched control sample.I Result yields the Average Treatment Effect.I Controls for the speculation associated with industry merger waves.I We use four different control groups.
ü Abnormal volume greater in treatment group than in control group.
I Speculation cannot explain unusual options activity.
Augustin, Brenner, Hu, & Subrahmanyam Informed Options Trading prior to Corporate Events 10 / 91
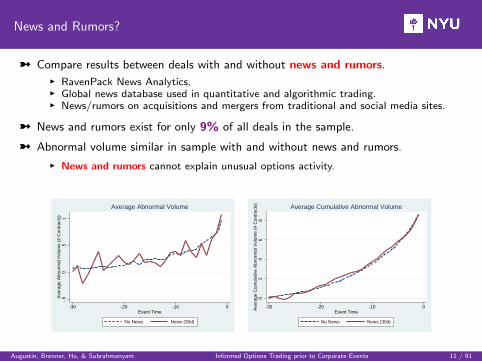
News and Rumors?
ü Compare results between deals with and without news and rumors.I RavenPack News Analytics.I Global news database used in quantitative and algorithmic trading.I News/rumors on acquisitions and mergers from traditional and social media sites.
ü News and rumors exist for only 9% of all deals in the sample.
ü Abnormal volume similar in sample with and without news and rumors.
I News and rumors cannot explain unusual options activity.
-.5
0.5
1A
vera
ge A
bnor
mal
Vol
ume
(# C
ontr
acts
)
-30 -20 -10 0Event Time
No News News (30d)
Average Abnormal Volume
02
46
8A
vera
ge C
umul
ativ
e A
bnor
mal
Vol
ume
(# C
ontr
acts
)
-30 -20 -10 0Event Time
No News News (30d)
Average Cumulative Abnormal Volume
Augustin, Brenner, Hu, & Subrahmanyam Informed Options Trading prior to Corporate Events 11 / 91
Legal Insider Trading?
ü Thomson Reuters insider filings.
I Trades by registered corporate insiders.I Table 2: derivatives transactions and holdings.I Information filed on Forms 3, 4, and 5.
ü No trade by legal insiders within the 30 days preceding the announcement.
ü Abnormal options activity is not coming from legal insiders.
Augustin, Brenner, Hu, & Subrahmanyam Informed Options Trading prior to Corporate Events 12 / 91
Leakage in the stock market?
ü Is there of evidence of leakage in the stock market?
I Abnormal Volume results robust: we control for contemporaneous/past stock returns.
I ≈ 7% of deals exhibit abnormal stock returns in the 30 days before the announcement.
I ≈ 24% of deals exhibit abnormal stock volume: magnitudes much smaller.
I (No) Increase in the call-to-stock (put-to-stock) volume ratio.
ü Unusual activity in the options market unlikely driven by stock market activity.
Augustin, Brenner, Hu, & Subrahmanyam Informed Options Trading prior to Corporate Events 13 / 91
Is informed trading illegal insider trading?
ü Who is trading and is it illegal? Several plausible explanations:
I Legal outsiders: No.
I Legal insiders: No.I Illegal insiders: Perhaps.
X Tippees may trade on information from tippers (“Insider Trading Networks” Ahern, 2015).X If tippees trade, they become illegal insiders.
I Illegal outsiders: Perhaps.
X Illegal insider trading if trade on material non-public information, breach of fiduciary duty.X Until proven innocent, accused investors remain innocent.
ü Difficult to prove beyond reasonable doubt evidence of illegal insider trading.
I But: Options activity certainly suspicious and highly unusual.
Augustin, Brenner, Hu, & Subrahmanyam Informed Options Trading prior to Corporate Events 14 / 91
SEC Litigation Reports
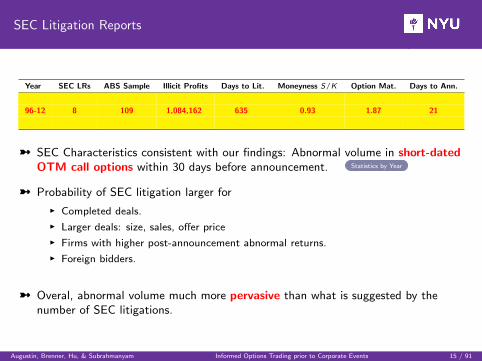
Year SEC LRs ABS Sample Illicit Profits Days to Lit. Moneyness S/K Option Mat. Days to Ann.
96-12 8 109 1,084,162 635 0.93 1.87 21
ü SEC Characteristics consistent with our findings: Abnormal volume in short-datedOTM call options within 30 days before announcement. Statistics by Year
ü Probability of SEC litigation larger for
I Completed deals.
I Larger deals: size, sales, offer price
I Firms with higher post-announcement abnormal returns.
I Foreign bidders.
ü Overal, abnormal volume much more pervasive than what is suggested by thenumber of SEC litigations.
Augustin, Brenner, Hu, & Subrahmanyam Informed Options Trading prior to Corporate Events 15 / 91
Summary of Results
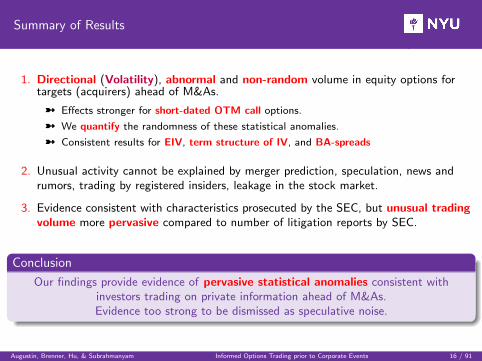
1. Directional (Volatility), abnormal and non-random volume in equity options fortargets (acquirers) ahead of M&As.
ü Effects stronger for short-dated OTM call options.
ü We quantify the randomness of these statistical anomalies.
ü Consistent results for EIV, term structure of IV, and BA-spreads
2. Unusual activity cannot be explained by merger prediction, speculation, news andrumors, trading by registered insiders, leakage in the stock market.
3. Evidence consistent with characteristics prosecuted by the SEC, but unusual tradingvolume more pervasive compared to number of litigation reports by SEC.
Conclusion
Our findings provide evidence of pervasive statistical anomalies consistent withinvestors trading on private information ahead of M&As.Evidence too strong to be dismissed as speculative noise.
Augustin, Brenner, Hu, & Subrahmanyam Informed Options Trading prior to Corporate Events 16 / 91

A Smoking Gun?
Augustin, Brenner, Hu, & Subrahmanyam Informed Options Trading prior to Corporate Events 17 / 91
I Research AgendaI Informed Options Trading prior to Corporate Events
I Mergers & Acquisitions - Up to date!I Identifying Prevalence of informed options trading in the economy.I Distinguish between informed and illegal insider trading.
I SpinoffsI No Prior Evidence on Spinoffs, despite similar announcement effects to M&As.
I Going forward: Study Nature of Insider/Informed TradingI All prior studies focus on one specific event: M&As, Spinoffs, Drug approvals, ....I Heterogeneity in informed trading = f(announcement characteristics).
Augustin, Brenner, Hu, & Subrahmanyam Informed Options Trading prior to Corporate Events 18 / 91
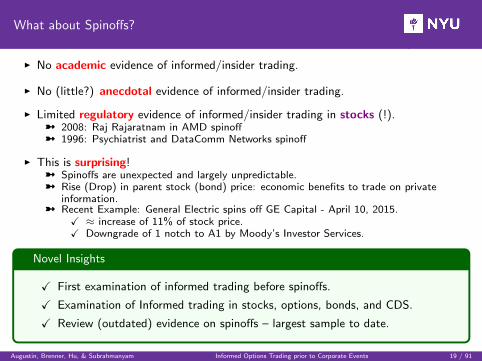
What about Spinoffs?
I No academic evidence of informed/insider trading.
I No (little?) anecdotal evidence of informed/insider trading.
I Limited regulatory evidence of informed/insider trading in stocks (!).ü 2008: Raj Rajaratnam in AMD spinoffü 1996: Psychiatrist and DataComm Networks spinoff
I This is surprising!ü Spinoffs are unexpected and largely unpredictable.ü Rise (Drop) in parent stock (bond) price: economic benefits to trade on private
information.ü Recent Example: General Electric spins off GE Capital - April 10, 2015.
X ≈ increase of 11% of stock price.X Downgrade of 1 notch to A1 by Moody’s Investor Services.
Novel Insights
X First examination of informed trading before spinoffs.
X Examination of Informed trading in stocks, options, bonds, and CDS.
X Review (outdated) evidence on spinoffs – largest sample to date.
Augustin, Brenner, Hu, & Subrahmanyam Informed Options Trading prior to Corporate Events 19 / 91
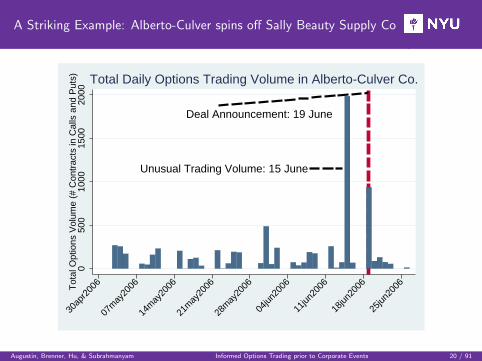
A Striking Example: Alberto-Culver spins off Sally Beauty Supply Co
Deal Announcement: 19 June
Unusual Trading Volume: 15 June
050
010
0015
0020
00T
otal
Opt
ions
Vol
ume
(# C
ontr
acts
in C
alls
and
Put
s)
30ap
r200
6
07m
ay20
06
14m
ay20
06
21m
ay20
06
28m
ay20
06
04jun
2006
11jun
2006
18jun
2006
25jun
2006
Total Daily Options Trading Volume in Alberto-Culver Co.
Augustin, Brenner, Hu, & Subrahmanyam Informed Options Trading prior to Corporate Events 20 / 91
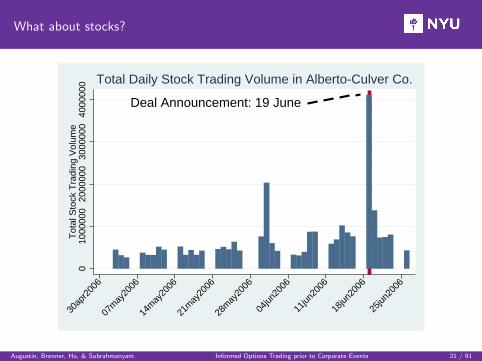
What about stocks?
Deal Announcement: 19 June
010
0000
020
0000
030
0000
040
0000
0T
otal
Sto
ck T
radi
ng V
olum
e
30ap
r200
6
07m
ay20
06
14m
ay20
06
21m
ay20
06
28m
ay20
06
04jun
2006
11jun
2006
18jun
2006
25jun
2006
Total Daily Stock Trading Volume in Alberto-Culver Co.
Augustin, Brenner, Hu, & Subrahmanyam Informed Options Trading prior to Corporate Events 21 / 91
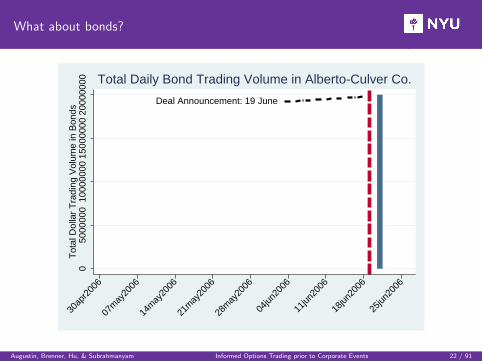
What about bonds?
Deal Announcement: 19 June
050
0000
010
0000
0015
0000
0020
0000
00T
otal
Dol
lar
Tra
ding
Vol
ume
in B
onds
30ap
r200
6
07m
ay20
06
14m
ay20
06
21m
ay20
06
28m
ay20
06
04jun
2006
11jun
2006
18jun
2006
25jun
2006
Total Daily Bond Trading Volume in Alberto-Culver Co.
Augustin, Brenner, Hu, & Subrahmanyam Informed Options Trading prior to Corporate Events 22 / 91
Research Question
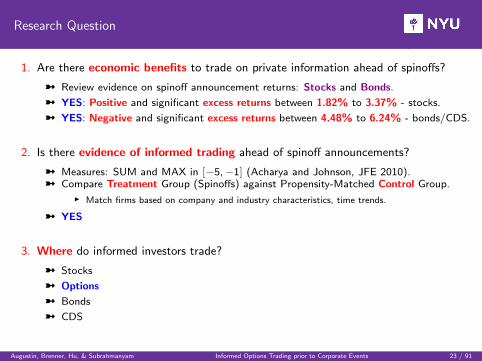
1. Are there economic benefits to trade on private information ahead of spinoffs?
ü Review evidence on spinoff announcement returns: Stocks and Bonds.
ü YES: Positive and significant excess returns between 1.82% to 3.37% - stocks.
ü YES: Negative and significant excess returns between 4.48% to 6.24% - bonds/CDS.
2. Is there evidence of informed trading ahead of spinoff announcements?
ü Measures: SUM and MAX in [−5,−1] (Acharya and Johnson, JFE 2010).ü Compare Treatment Group (Spinoffs) against Propensity-Matched Control Group.
I Match firms based on company and industry characteristics, time trends.
ü YES
3. Where do informed investors trade?
ü Stocks
ü Options
ü Bonds
ü CDS
Augustin, Brenner, Hu, & Subrahmanyam Informed Options Trading prior to Corporate Events 23 / 91
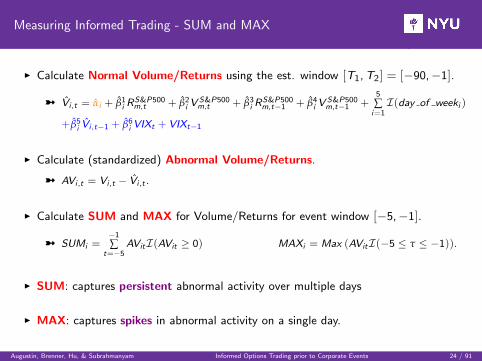
Measuring Informed Trading - SUM and MAX
I Calculate Normal Volume/Returns using the est. window [T1,T2] = [−90,−1].
ü V̂i ,t = α̂i + β̂1i R
S&P500m,t + β̂2
i VS&P500m,t + β̂3
i RS&P500m,t−1 + β̂4
i VS&P500m,t−1 +
5
∑i=1I(day of weeki )
+β̂5i V̂i ,t−1 + β̂6
i VIXt +VIXt−1
I Calculate (standardized) Abnormal Volume/Returns.
ü AVi ,t = Vi ,t − V̂i ,t .
I Calculate SUM and MAX for Volume/Returns for event window [−5,−1].
ü SUMi =−1
∑t=−5
AVitI(AVit ≥ 0) MAXi = Max (AVitI(−5 ≤ τ ≤ −1)).
I SUM: captures persistent abnormal activity over multiple days
I MAX: captures spikes in abnormal activity on a single day.
Augustin, Brenner, Hu, & Subrahmanyam Informed Options Trading prior to Corporate Events 24 / 91
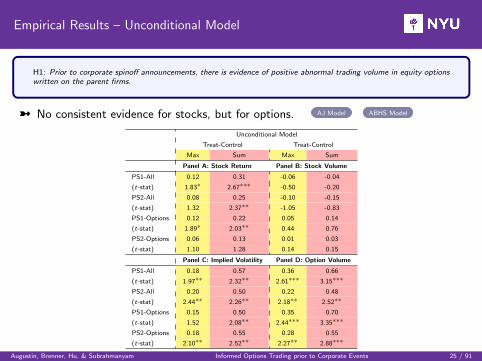
Empirical Results – Unconditional Model
H1: Prior to corporate spinoff announcements, there is evidence of positive abnormal trading volume in equity optionswritten on the parent firms.
ü No consistent evidence for stocks, but for options. AJ Model ABHS Model
Unconditional Model
Treat-Control Treat-Control
Max Sum Max Sum
Panel A: Stock Return Panel B: Stock Volume
PS1-All 0.12 0.31 -0.06 -0.04
(t-stat) 1.83∗ 2.67∗∗∗ -0.50 -0.20
PS2-All 0.08 0.25 -0.10 -0.15
(t-stat) 1.32 2.37∗∗ -1.05 -0.83
PS1-Options 0.12 0.22 0.05 0.14
(t-stat) 1.89∗ 2.03∗∗ 0.44 0.76
PS2-Options 0.06 0.13 0.01 0.03
(t-stat) 1.10 1.28 0.14 0.15
Panel C: Implied Volatility Panel D: Option Volume
PS1-All 0.18 0.57 0.36 0.66
(t-stat) 1.97∗∗ 2.32∗∗ 2.61∗∗∗ 3.15∗∗∗
PS2-All 0.20 0.50 0.22 0.48
(t-stat) 2.44∗∗ 2.26∗∗ 2.18∗∗ 2.52∗∗
PS1-Options 0.15 0.50 0.35 0.70
(t-stat) 1.52 2.08∗∗ 2.44∗∗∗ 3.35∗∗∗
PS2-Options 0.18 0.55 0.28 0.55
(t-stat) 2.10∗∗ 2.52∗∗ 2.27∗∗ 2.88∗∗∗
Augustin, Brenner, Hu, & Subrahmanyam Informed Options Trading prior to Corporate Events 25 / 91
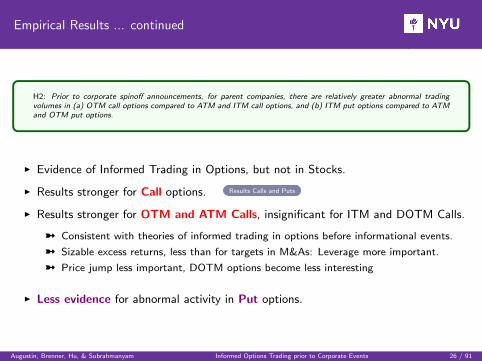
Empirical Results ... continued
H2: Prior to corporate spinoff announcements, for parent companies, there are relatively greater abnormal tradingvolumes in (a) OTM call options compared to ATM and ITM call options, and (b) ITM put options compared to ATMand OTM put options.
I Evidence of Informed Trading in Options, but not in Stocks.
I Results stronger for Call options. Results Calls and Puts
I Results stronger for OTM and ATM Calls, insignificant for ITM and DOTM Calls.
ü Consistent with theories of informed trading in options before informational events.
ü Sizable excess returns, less than for targets in M&As: Leverage more important.
ü Price jump less important, DOTM options become less interesting
I Less evidence for abnormal activity in Put options.
Augustin, Brenner, Hu, & Subrahmanyam Informed Options Trading prior to Corporate Events 26 / 91
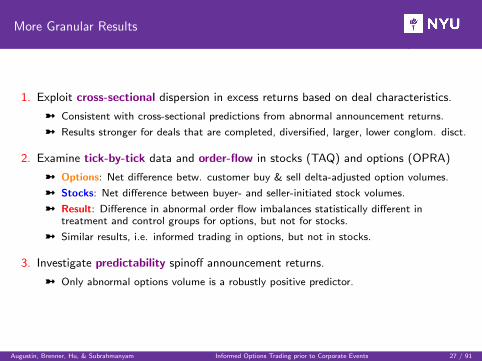
More Granular Results
1. Exploit cross-sectional dispersion in excess returns based on deal characteristics.
ü Consistent with cross-sectional predictions from abnormal announcement returns.
ü Results stronger for deals that are completed, diversified, larger, lower conglom. disct.
2. Examine tick-by-tick data and order-flow in stocks (TAQ) and options (OPRA)
ü Options: Net difference betw. customer buy & sell delta-adjusted option volumes.
ü Stocks: Net difference between buyer- and seller-initiated stock volumes.
ü Result: Difference in abnormal order flow imbalances statistically different intreatment and control groups for options, but not for stocks.
ü Similar results, i.e. informed trading in options, but not in stocks.
3. Investigate predictability spinoff announcement returns.
ü Only abnormal options volume is a robustly positive predictor.
Augustin, Brenner, Hu, & Subrahmanyam Informed Options Trading prior to Corporate Events 27 / 91
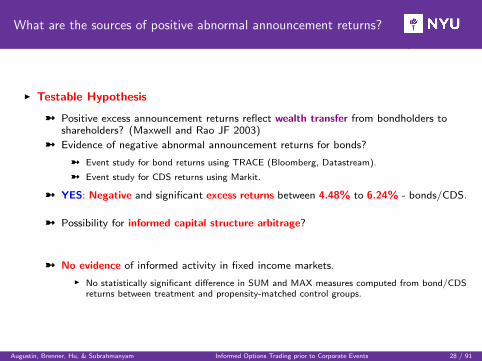
What are the sources of positive abnormal announcement returns?
I Testable Hypothesis
ü Positive excess announcement returns reflect wealth transfer from bondholders toshareholders? (Maxwell and Rao JF 2003)
ü Evidence of negative abnormal announcement returns for bonds?
ü Event study for bond returns using TRACE (Bloomberg, Datastream).
ü Event study for CDS returns using Markit.
ü YES: Negative and significant excess returns between 4.48% to 6.24% - bonds/CDS.
ü Possibility for informed capital structure arbitrage?
ü No evidence of informed activity in fixed income markets.
I No statistically significant difference in SUM and MAX measures computed from bond/CDSreturns between treatment and propensity-matched control groups.
Augustin, Brenner, Hu, & Subrahmanyam Informed Options Trading prior to Corporate Events 28 / 91
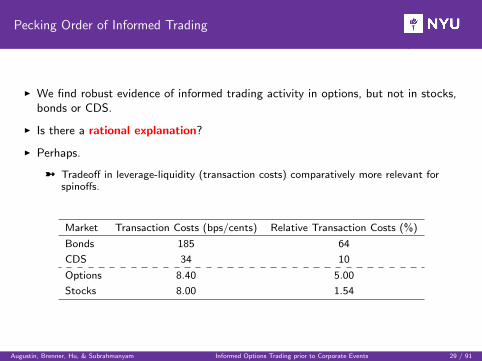
Pecking Order of Informed Trading
I We find robust evidence of informed trading activity in options, but not in stocks,bonds or CDS.
I Is there a rational explanation?
I Perhaps.
ü Tradeoff in leverage-liquidity (transaction costs) comparatively more relevant forspinoffs.
Market Transaction Costs (bps/cents) Relative Transaction Costs (%)
Bonds 185 64
CDS 34 10
Options 8.40 5.00
Stocks 8.00 1.54
Augustin, Brenner, Hu, & Subrahmanyam Informed Options Trading prior to Corporate Events 29 / 91
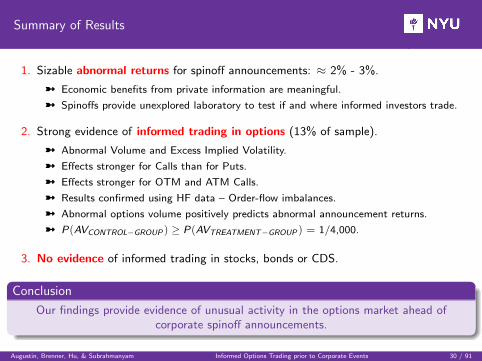
Summary of Results
1. Sizable abnormal returns for spinoff announcements: ≈ 2% - 3%.
ü Economic benefits from private information are meaningful.
ü Spinoffs provide unexplored laboratory to test if and where informed investors trade.
2. Strong evidence of informed trading in options (13% of sample).
ü Abnormal Volume and Excess Implied Volatility.
ü Effects stronger for Calls than for Puts.
ü Effects stronger for OTM and ATM Calls.
ü Results confirmed using HF data – Order-flow imbalances.
ü Abnormal options volume positively predicts abnormal announcement returns.
ü P(AVCONTROL−GROUP ) ≥ P(AVTREATMENT−GROUP ) = 1/4,000.
3. No evidence of informed trading in stocks, bonds or CDS.
Conclusion
Our findings provide evidence of unusual activity in the options market ahead ofcorporate spinoff announcements.
Augustin, Brenner, Hu, & Subrahmanyam Informed Options Trading prior to Corporate Events 30 / 91

Another smoking gun?
Thank you
Bloomberg: “Do Insider Trading Investigators Have a Blind Spot?”
Augustin, Brenner, Hu, & Subrahmanyam Informed Options Trading prior to Corporate Events 31 / 91

News Coverage
I Barron’s, “Are We Too Blase About Iraq, Insider Trading?,” June 17, 2014 (John Kimelman)
I Bloomberg, “Insider Trading Research Says SEC Won’t Sweat Small Stuff,” June 20, 2014 (Joseph Ciolli)
I Bloomberg View, “There Might Be a Lot of Insider Trading,” June 17, 2014 (Matt Levine)
I CBC News Canada, “Insider trading found in 26% of merger deals, study says,” June 17, 2014
I CNBC Closing Bell, “Closing Bell Exchange: Insider trading,” June 17, 2014
I CNBC Fast Money Halftime Report, “1 in 4 deals involves insider trading: Study,” June 17, 2014
I CNBC Squawk Box, “Study Asserts Startling Numbers of Insider Trading Rogues,” June 17, 2014
I CNBC.com, “It’s time to legalize insider trading,” June 17, 2014 (Carol Roth)
I CNBC.com, “Should insider trading be legalized? Some think so,” June 17, 2014 (Michelle Fox)
I CNBC.com, “Legalize insider trading? That’s ridiculous,” June 18, 2014 (Andrew Stoltmann)
I CNBC.com, “Are all insiders rogue traders,” June 23, 2914 (Patrick Augustin, Menachem Brenner and Marti G. Subrahmanyam)
I Fortune, “Study claims insider trading is more prevalent than previously thought,” June 17, 2014 (Tom Huddleston, Jr.)
I Fox Business Network’s The Willis Report, “Insider Trading Rogues Gone Wild; Study Reveals Startling Numbers,” June 19, 2014
I Gawker, “I Wonder Why Corporate Executives Do So Well Trading Their Own Company’s Stock?,” June 23, 2014 (Hamilton Nolan)
I MarketWatch, “A quarter of all public company deals involve insider trading,” June 17, 2014 (Sital Patel)
I MarketWatch, “The real insider trading problem? That no one cares,” June 17, 2014 (David Weidner)
I MarketWatch, “Confessions of insider trader Scott London,” June 23, 2014 (Quentin Fottrell
I The New York Times, “Study Asserts Startling Numbers of Insider Trading Rogues,” June 16, 2014 (Andrew Ross Sorkin)
I The New York Times, “The Hidden Cost of Trading Stocks,” June 22, 2014 (Editorial Board)
I PBS Frontline, “Study: Corporate Mergers Overrun By Insider Trading,” June 17, 2014 (By Jason M. Breslow)
I Reuters, “Insider options trades precede about a fourth of U.S. M&A deals: study,” June 17, 2014 (Angela Moon and Jan Paschal)
I The Wall Street Journal, “How Washington Abets Insider Trading,” June 22, 2014 (Al Lewis)
I The Wall Street Journal MoneyBeat, “Deals of the Day: Siemens, Mitsubishi Make Their Case,” June 17, 2014 (Erik Holm)
I Yahoo! Finance, Hot Stock Minute, “CPI rises, housing starts fall; Senate looks at high-frequency trading,” June 17, 2014 (Dean Arrindell)
I Yahoo! Finance, The Daily Ticker, “Insider trading is even more common than you think, study says,” June 17, 2014 (Michael Santoli)
Augustin, Brenner, Hu, & Subrahmanyam Informed Options Trading prior to Corporate Events 32 / 91
I Research AgendaI Informed Options Trading prior to Corporate Events
I Mergers & Acquisitions - Up to date!I Identifying Prevalence of informed options trading in the economy.I Distinguish between informed and illegal insider trading.
I SpinoffsI No Prior Evidence on Spinoffs, despite similar announcement effects to M&As.
I Going forward: Study Nature of Insider/Informed TradingI All prior studies focus on one specific event: M&As, Spinoffs, Drug approvals, ....I Heterogeneity in informed trading = f(announcement characteristics).
Augustin, Brenner, Hu, & Subrahmanyam Informed Options Trading prior to Corporate Events 33 / 91
Studying Heterogeneity in insider trading
How would you trade in options if you were the informed investor?
Suppose you receive one of the following tips:
1. “Walt Disney will buy Marvel at a takeover premium of 29%. Not sure when they’llannounce it.”
2. “Microsoft’s next quarterly earnings will exceed analyst estimates by 3% but theoutlook is mixed.”
3. “Abbott Laboratories will make an announcement related to a blockbuster drug nextweek, not sure what it is about.”
It depends on the type and quality of the private information.
Augustin, Brenner, Hu, & Subrahmanyam Informed Options Trading prior to Corporate Events 34 / 91

The End
Thank you
Augustin, Brenner, Hu, & Subrahmanyam Informed Options Trading prior to Corporate Events 35 / 91
More Suspicious Options Trades
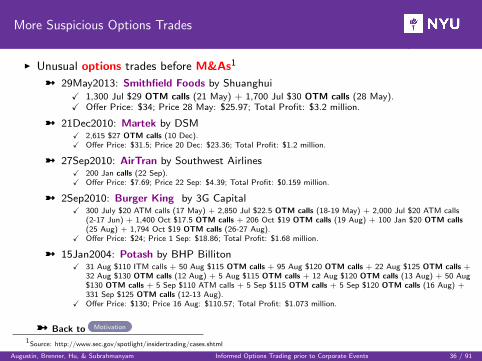
I Unusual options trades before M&As1
ü 29May2013: Smithfield Foods by ShuanghuiX 1,300 Jul $29 OTM calls (21 May) + 1,700 Jul $30 OTM calls (28 May).X Offer Price: $34; Price 28 May: $25.97; Total Profit: $3.2 million.
ü 21Dec2010: Martek by DSMX 2,615 $27 OTM calls (10 Dec).X Offer Price: $31.5; Price 20 Dec: $23.36; Total Profit: $1.2 million.
ü 27Sep2010: AirTran by Southwest AirlinesX 200 Jan calls (22 Sep).X Offer Price: $7.69; Price 22 Sep: $4.39; Total Profit: $0.159 million.
ü 2Sep2010: Burger King by 3G CapitalX 300 July $20 ATM calls (17 May) + 2,850 Jul $22.5 OTM calls (18-19 May) + 2,000 Jul $20 ATM calls
(2-17 Jun) + 1,400 Oct $17.5 OTM calls + 206 Oct $19 OTM calls (19 Aug) + 100 Jan $20 OTM calls(25 Aug) + 1,794 Oct $19 OTM calls (26-27 Aug).
X Offer Price: $24; Price 1 Sep: $18.86; Total Profit: $1.68 million.
ü 15Jan2004: Potash by BHP BillitonX 31 Aug $110 ITM calls + 50 Aug $115 OTM calls + 95 Aug $120 OTM calls + 22 Aug $125 OTM calls +
32 Aug $130 OTM calls (12 Aug) + 5 Aug $115 OTM calls + 12 Aug $120 OTM calls (13 Aug) + 50 Aug$130 OTM calls + 5 Sep $110 ATM calls + 5 Sep $115 OTM calls + 5 Sep $120 OTM calls (16 Aug) +331 Sep $125 OTM calls (12-13 Aug).
X Offer Price: $130; Price 16 Aug: $110.57; Total Profit: $1.073 million.
ü Back to Motivation
1Source: http://www.sec.gov/spotlight/insidertrading/cases.shtml
Augustin, Brenner, Hu, & Subrahmanyam Informed Options Trading prior to Corporate Events 36 / 91
Why do we care?
SEC Enforcement Actions: Insider Trading Cases
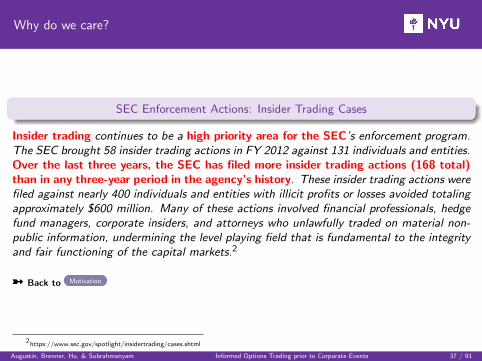
Insider trading continues to be a high priority area for the SEC’s enforcement program.The SEC brought 58 insider trading actions in FY 2012 against 131 individuals and entities.Over the last three years, the SEC has filed more insider trading actions (168 total)than in any three-year period in the agency’s history. These insider trading actions werefiled against nearly 400 individuals and entities with illicit profits or losses avoided totalingapproximately $600 million. Many of these actions involved financial professionals, hedgefund managers, corporate insiders, and attorneys who unlawfully traded on material non-public information, undermining the level playing field that is fundamental to the integrityand fair functioning of the capital markets.2
ü Back to Motivation
2https://www.sec.gov/spotlight/insidertrading/cases.shtml
Augustin, Brenner, Hu, & Subrahmanyam Informed Options Trading prior to Corporate Events 37 / 91
SEC Definition of Insider Trading
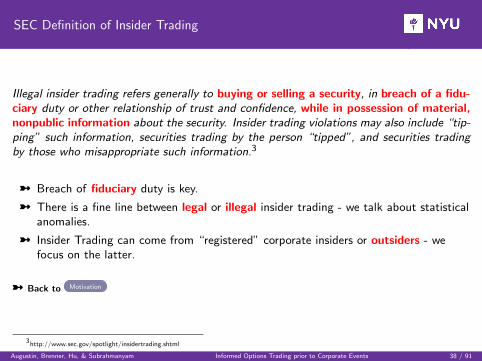
Illegal insider trading refers generally to buying or selling a security, in breach of a fidu-ciary duty or other relationship of trust and confidence, while in possession of material,nonpublic information about the security. Insider trading violations may also include “tip-ping” such information, securities trading by the person “tipped”, and securities tradingby those who misappropriate such information.3
ü Breach of fiduciary duty is key.
ü There is a fine line between legal or illegal insider trading - we talk about statisticalanomalies.
ü Insider Trading can come from “registered” corporate insiders or outsiders - wefocus on the latter.
ü Back to Motivation
3http://www.sec.gov/spotlight/insidertrading.shtml
Augustin, Brenner, Hu, & Subrahmanyam Informed Options Trading prior to Corporate Events 38 / 91
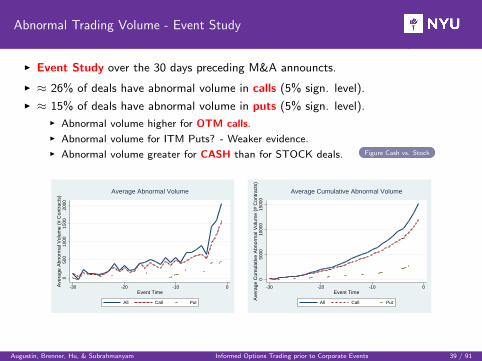
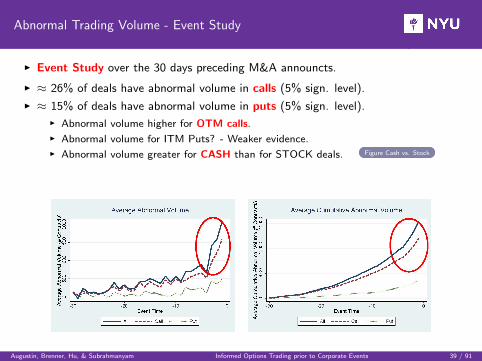
Abnormal Trading Volume - Event Study
I Event Study over the 30 days preceding M&A announcts.
I ≈ 26% of deals have abnormal volume in calls (5% sign. level).
I ≈ 15% of deals have abnormal volume in puts (5% sign. level).
I Abnormal volume higher for OTM calls.
I Abnormal volume for ITM Puts? - Weaker evidence.
I Abnormal volume greater for CASH than for STOCK deals. Figure Cash vs. Stock
050
010
0015
0020
00A
vera
ge A
bnor
mal
Vol
ume
(# C
ontr
acts
)
-30 -20 -10 0Event Time
All Call Put
Average Abnormal Volume
050
0010
000
1500
0A
vera
ge C
umul
ativ
e A
bnor
mal
Vol
ume
(# C
ontr
acts
)
-30 -20 -10 0Event Time
All Call Put
Average Cumulative Abnormal Volume
Augustin, Brenner, Hu, & Subrahmanyam Informed Options Trading prior to Corporate Events 39 / 91
Abnormal Trading Volume - Event Study
I Event Study over the 30 days preceding M&A announcts.
I ≈ 26% of deals have abnormal volume in calls (5% sign. level).
I ≈ 15% of deals have abnormal volume in puts (5% sign. level).
I Abnormal volume higher for OTM calls.
I Abnormal volume for ITM Puts? - Weaker evidence.
I Abnormal volume greater for CASH than for STOCK deals. Figure Cash vs. Stock
Augustin, Brenner, Hu, & Subrahmanyam Informed Options Trading prior to Corporate Events 39 / 91
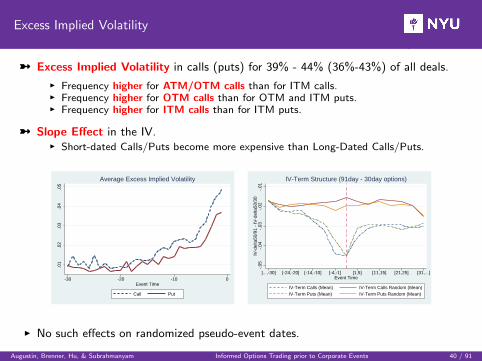
Excess Implied Volatility
ü Excess Implied Volatility in calls (puts) for 39% - 44% (36%-43%) of all deals.
I Frequency higher for ATM/OTM calls than for ITM calls.I Frequency higher for OTM calls than for OTM and ITM puts.I Frequency higher for ITM calls than for ITM puts.
ü Slope Effect in the IV.I Short-dated Calls/Puts become more expensive than Long-Dated Calls/Puts.
.01
.02
.03
.04
.05
-30 -20 -10 0Event Time
Call Put
Average Excess Implied Volatility
-.05
-.04
-.03
-.02
-.01
IV-d
elta
50/9
1 -
IV-d
elta
50/3
0
]...,-30] [-24,-20] [-14,-10] [-4,-1] [1,5] [11,15] [21,25] [31,...[Event Time
IV-Term Calls (Mean) IV-Term Calls Random (Mean)IV-Term Puts (Mean) IV-Term Puts Random (Mean)
IV-Term Structure (91day - 30day options)
I No such effects on randomized pseudo-event dates.
Augustin, Brenner, Hu, & Subrahmanyam Informed Options Trading prior to Corporate Events 40 / 91
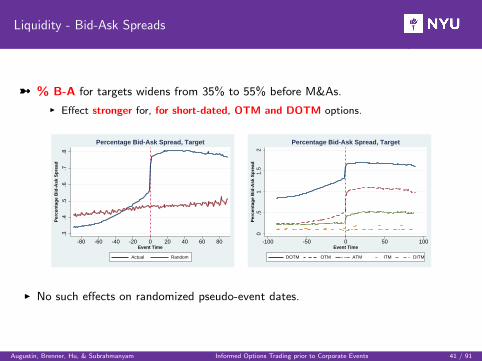
Liquidity - Bid-Ask Spreads
ü % B-A for targets widens from 35% to 55% before M&As.
I Effect stronger for, for short-dated, OTM and DOTM options.
.3.4
.5.6
.7.8
Per
cen
tag
e B
id-A
sk S
pre
ad
-80 -60 -40 -20 0 20 40 60 80Event Time
Actual Random
Percentage Bid-Ask Spread, Target
0.5
11.
52
Per
cen
tag
e B
id-A
sk S
pre
ad
-100 -50 0 50 100Event Time
DOTM OTM ATM ITM DITM
Percentage Bid-Ask Spread, Target
I No such effects on randomized pseudo-event dates.
Augustin, Brenner, Hu, & Subrahmanyam Informed Options Trading prior to Corporate Events 41 / 91
Is Unusual Options Trading Volume Random?
I Robustness.
ü Alternative “Normal” Volume Models.
ü Natural log and raw volumes.
ü Multivariate Kolmogorov-Smirnov Test: Test for shift in volume surface.
ü Conditional illiquidity: Zero-volume Runs.
ü Compare abnormal trading in SUT against Random Sample (RS).
X Zero BidX Positive VolumeX Expiration after Announcement DateX Trades within 30 days before the AnnouncementX Front Date Option (First Expiration Month).
ü SUT Volume double than that of a matched random sample.
ü Chance that average volume in RS is larger: ≈ 3 in a trillion
Back to Hypotheses
Augustin, Brenner, Hu, & Subrahmanyam Informed Options Trading prior to Corporate Events 42 / 91
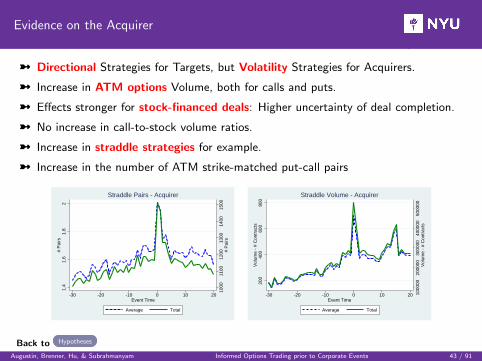
Evidence on the Acquirer
ü Directional Strategies for Targets, but Volatility Strategies for Acquirers.
ü Increase in ATM options Volume, both for calls and puts.
ü Effects stronger for stock-financed deals: Higher uncertainty of deal completion.
ü No increase in call-to-stock volume ratios.
ü Increase in straddle strategies for example.
ü Increase in the number of ATM strike-matched put-call pairs
1000
1100
1200
1300
1400
1500
# P
airs
1.4
1.6
1.8
2#
Pai
rs
-30 -20 -10 0 10 20Event Time
Average Total
Straddle Pairs - Acquirer
1000
0020
0000
3000
0040
0000
5000
00V
olum
e -
# C
ontr
acts
200
400
600
800
Vol
ume
- #
Con
trac
ts
-30 -20 -10 0 10 20Event Time
Average Total
Straddle Volume - Acquirer
Back to Hypotheses
Augustin, Brenner, Hu, & Subrahmanyam Informed Options Trading prior to Corporate Events 43 / 91
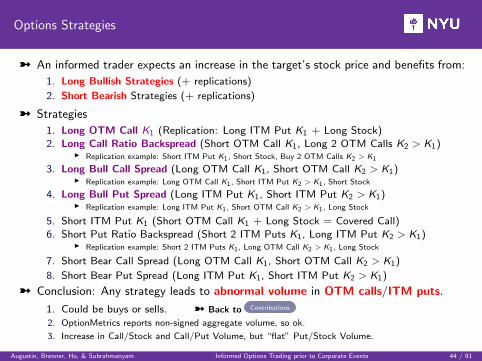
Options Strategies
ü An informed trader expects an increase in the target’s stock price and benefits from:
1. Long Bullish Strategies (+ replications)
2. Short Bearish Strategies (+ replications)
ü Strategies
1. Long OTM Call K1 (Replication: Long ITM Put K1 + Long Stock)2. Long Call Ratio Backspread (Short OTM Call K1, Long 2 OTM Calls K2 > K1)
I Replication example: Short ITM Put K1, Short Stock, Buy 2 OTM Calls K2 > K1
3. Long Bull Call Spread (Long OTM Call K1, Short OTM Call K2 > K1)I Replication example: Long OTM Call K1, Short ITM Put K2 > K1, Short Stock
4. Long Bull Put Spread (Long ITM Put K1, Short ITM Put K2 > K1)I Replication example: Long ITM Put K1, Short OTM Call K2 > K1, Long Stock
5. Short ITM Put K1 (Short OTM Call K1 + Long Stock = Covered Call)6. Short Put Ratio Backspread (Short 2 ITM Puts K1, Long ITM Put K2 > K1)
I Replication example: Short 2 ITM Puts K1, Long OTM Call K2 > K1, Long Stock
7. Short Bear Call Spread (Long OTM Call K1, Short OTM Call K2 > K1)
8. Short Bear Put Spread (Long ITM Put K1, Short ITM Put K2 > K1)
ü Conclusion: Any strategy leads to abnormal volume in OTM calls/ITM puts.
1. Could be buys or sells. ü Back to Contributions
2. OptionMetrics reports non-signed aggregate volume, so ok.
3. Increase in Call/Stock and Call/Put Volume, but “flat” Put/Stock Volume.
Augustin, Brenner, Hu, & Subrahmanyam Informed Options Trading prior to Corporate Events 44 / 91
Literature
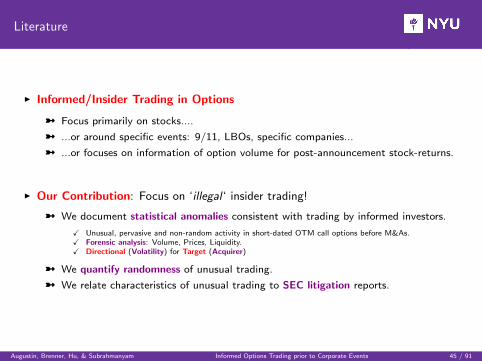
I Informed/Insider Trading in Options
ü Focus primarily on stocks....
ü ...or around specific events: 9/11, LBOs, specific companies...
ü ...or focuses on information of option volume for post-announcement stock-returns.
I Our Contribution: Focus on ‘illegal ‘ insider trading!
ü We document statistical anomalies consistent with trading by informed investors.
X Unusual, pervasive and non-random activity in short-dated OTM call options before M&As.X Forensic analysis: Volume, Prices, Liquidity.X Directional (Volatility) for Target (Acquirer)
ü We quantify randomness of unusual trading.
ü We relate characteristics of unusual trading to SEC litigation reports.
Augustin, Brenner, Hu, & Subrahmanyam Informed Options Trading prior to Corporate Events 45 / 91
Literature
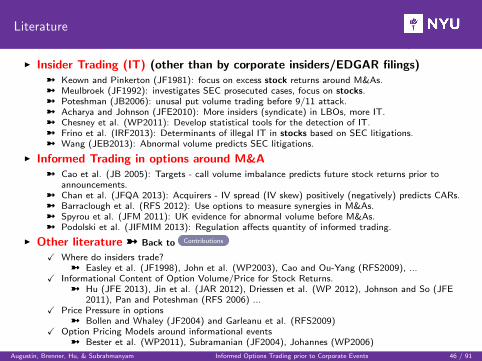
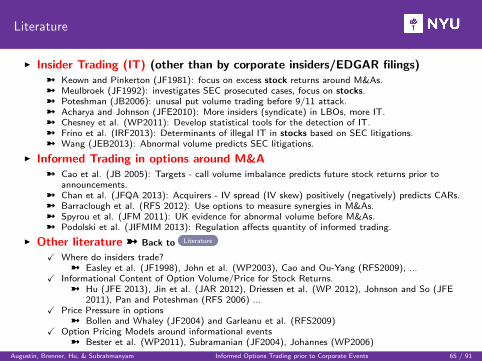
I Insider Trading (IT) (other than by corporate insiders/EDGAR filings)ü Keown and Pinkerton (JF1981): focus on excess stock returns around M&As.ü Meulbroek (JF1992): investigates SEC prosecuted cases, focus on stocks.ü Poteshman (JB2006): unusal put volume trading before 9/11 attack.ü Acharya and Johnson (JFE2010): More insiders (syndicate) in LBOs, more IT.ü Chesney et al. (WP2011): Develop statistical tools for the detection of IT.ü Frino et al. (IRF2013): Determinants of illegal IT in stocks based on SEC litigations.ü Wang (JEB2013): Abnormal volume predicts SEC litigations.
I Informed Trading in options around M&Aü Cao et al. (JB 2005): Targets - call volume imbalance predicts future stock returns prior to
announcements.ü Chan et al. (JFQA 2013): Acquirers - IV spread (IV skew) positively (negatively) predicts CARs.ü Barraclough et al. (RFS 2012): Use options to measure synergies in M&As.ü Spyrou et al. (JFM 2011): UK evidence for abnormal volume before M&As.ü Podolski et al. (JIFMIM 2013): Regulation affects quantity of informed trading.
I Other literature ü Back to Contributions
X Where do insiders trade?ü Easley et al. (JF1998), John et al. (WP2003), Cao and Ou-Yang (RFS2009), ...
X Informational Content of Option Volume/Price for Stock Returns.ü Hu (JFE 2013), Jin et al. (JAR 2012), Driessen et al. (WP 2012), Johnson and So (JFE
2011), Pan and Poteshman (RFS 2006) ...X Price Pressure in options
ü Bollen and Whaley (JF2004) and Garleanu et al. (RFS2009)X Option Pricing Models around informational events
ü Bester et al. (WP2011), Subramanian (JF2004), Johannes (WP2006)
Augustin, Brenner, Hu, & Subrahmanyam Informed Options Trading prior to Corporate Events 46 / 91
Deal Size Distribution
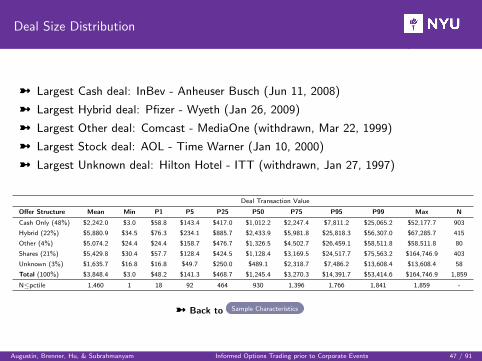
ü Largest Cash deal: InBev - Anheuser Busch (Jun 11, 2008)
ü Largest Hybrid deal: Pfizer - Wyeth (Jan 26, 2009)
ü Largest Other deal: Comcast - MediaOne (withdrawn, Mar 22, 1999)
ü Largest Stock deal: AOL - Time Warner (Jan 10, 2000)
ü Largest Unknown deal: Hilton Hotel - ITT (withdrawn, Jan 27, 1997)
Deal Transaction Value
Offer Structure Mean Min P1 P5 P25 P50 P75 P95 P99 Max N
Cash Only (48%) $2,242.0 $3.0 $58.8 $143.4 $417.0 $1,012.2 $2,247.4 $7,811.2 $25,065.2 $52,177.7 903
Hybrid (22%) $5,880.9 $34.5 $76.3 $234.1 $885.7 $2,433.9 $5,981.8 $25,818.3 $56,307.0 $67,285.7 415
Other (4%) $5,074.2 $24.4 $24.4 $158.7 $476.7 $1,326.5 $4,502.7 $26,459.1 $58,511.8 $58,511.8 80
Shares (21%) $5,429.8 $30.4 $57.7 $128.4 $424.5 $1,128.4 $3,169.5 $24,517.7 $75,563.2 $164,746.9 403
Unknown (3%) $1,635.7 $16.8 $16.8 $49.7 $250.0 $489.1 $2,318.7 $7,486.2 $13,608.4 $13,608.4 58
Total (100%) $3,848.4 $3.0 $48.2 $141.3 $468.7 $1,245.4 $3,270.3 $14,391.7 $53,414.6 $164,746.9 1,859
N≤pctile 1,460 1 18 92 464 930 1,396 1,766 1,841 1,859 -
ü Back to Sample Characteristics
Augustin, Brenner, Hu, & Subrahmanyam Informed Options Trading prior to Corporate Events 47 / 91
Options Trading Acquirer - Summary Statistics
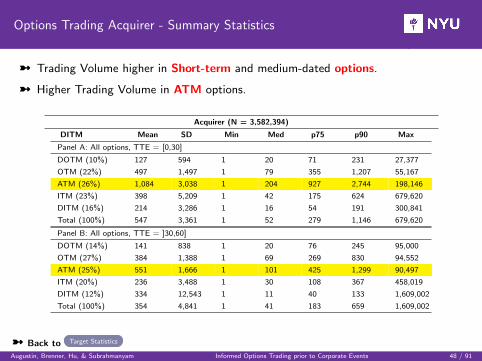
ü Trading Volume higher in Short-term and medium-dated options.
ü Higher Trading Volume in ATM options.
Acquirer (N = 3,582,394)
DITM Mean SD Min Med p75 p90 Max
Panel A: All options, TTE = [0,30]
DOTM (10%) 127 594 1 20 71 231 27,377
OTM (22%) 497 1,497 1 79 355 1,207 55,167
ATM (26%) 1,084 3,038 1 204 927 2,744 198,146
ITM (23%) 398 5,209 1 42 175 624 679,620
DITM (16%) 214 3,286 1 16 54 191 300,841
Total (100%) 547 3,361 1 52 279 1,146 679,620
Panel B: All options, TTE = ]30,60]
DOTM (14%) 141 838 1 20 76 245 95,000
OTM (27%) 384 1,388 1 69 269 830 94,552
ATM (25%) 551 1,666 1 101 425 1,299 90,497
ITM (20%) 236 3,488 1 30 108 367 458,019
DITM (12%) 334 12,543 1 11 40 133 1,609,002
Total (100%) 354 4,841 1 41 183 659 1,609,002
ü Back to Target Statistics
Augustin, Brenner, Hu, & Subrahmanyam Informed Options Trading prior to Corporate Events 48 / 91
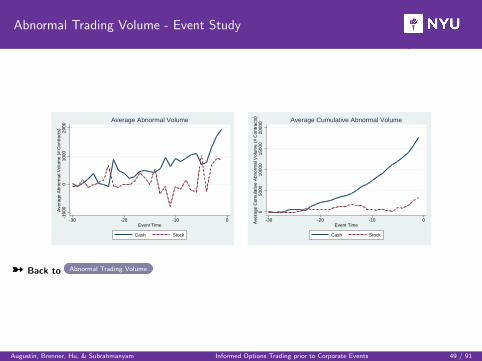
Abnormal Trading Volume - Event Study
-100
00
1000
2000
Ave
rage
Abn
orm
al V
olum
e (#
Con
trac
ts)
-30 -20 -10 0Event Time
Cash Stock
Average Abnormal Volume
050
0010
000
1500
020
000
Ave
rage
Cum
ulat
ive
Abn
orm
al V
olum
e (#
Con
trac
ts)
-30 -20 -10 0Event Time
Cash Stock
Average Cumulative Abnormal Volume
ü Back to Abnormal Trading Volume
Augustin, Brenner, Hu, & Subrahmanyam Informed Options Trading prior to Corporate Events 49 / 91
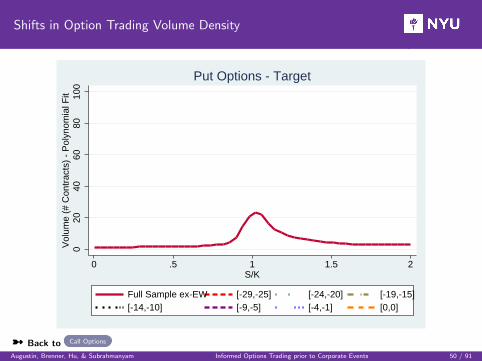
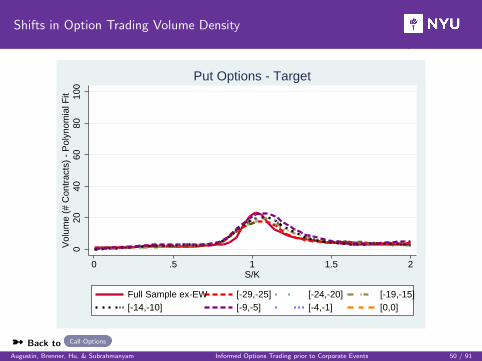
Shifts in Option Trading Volume Density
020
4060
8010
0V
olum
e (#
Con
trac
ts)
- P
olyn
omia
l Fit
0 .5 1 1.5 2S/K
Full Sample ex-EW [-29,-25] [-24,-20] [-19,-15][-14,-10] [-9,-5] [-4,-1] [0,0]
Put Options - Target
ü Back to Call Options
Augustin, Brenner, Hu, & Subrahmanyam Informed Options Trading prior to Corporate Events 50 / 91
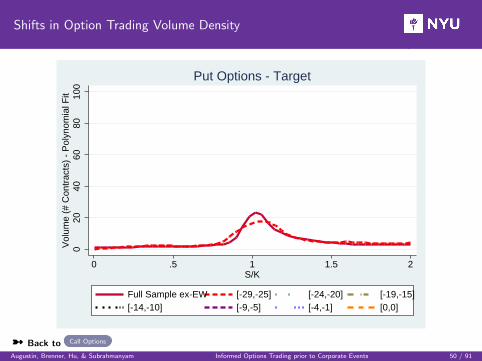
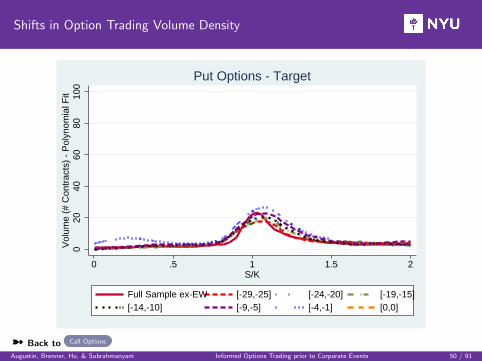
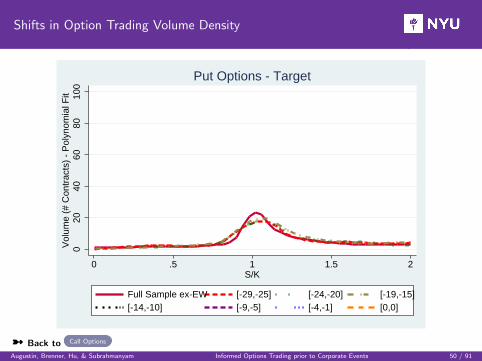
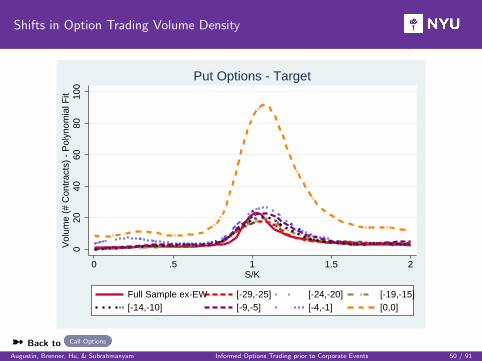
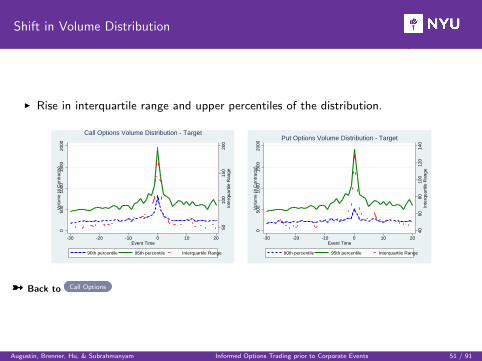
Shift in Volume Distribution
I Rise in interquartile range and upper percentiles of the distribution.
5010
015
020
0In
terq
uart
ile R
ange
050
010
0015
0020
00V
olum
e (#
Con
trac
ts)
-30 -20 -10 0 10 20Event Time
90th percentile 95th percentile Interquartile Range
Call Options Volume Distribution - Target
4060
8010
012
014
0In
terq
uart
ile R
ange
050
010
0015
0020
00V
olum
e (#
Con
trac
ts)
-30 -20 -10 0 10 20Event Time
90th percentile 95th percentile Interquartile Range
Put Options Volume Distribution - Target
ü Back to Call Options
Augustin, Brenner, Hu, & Subrahmanyam Informed Options Trading prior to Corporate Events 51 / 91
Bivariate Kolmogorov-Smirnov Test
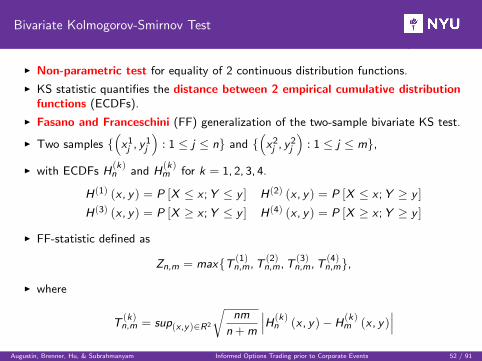
I Non-parametric test for equality of 2 continuous distribution functions.
I KS statistic quantifies the distance between 2 empirical cumulative distributionfunctions (ECDFs).
I Fasano and Franceschini (FF) generalization of the two-sample bivariate KS test.
I Two samples {(x1j , y1
j
): 1 ≤ j ≤ n} and {
(x2j , y2
j
): 1 ≤ j ≤ m},
I with ECDFs H(k)n and H
(k)m for k = 1, 2, 3, 4.
H(1) (x , y) = P [X ≤ x ;Y ≤ y ] H(2) (x , y) = P [X ≤ x ;Y ≥ y ]
H(3) (x , y) = P [X ≥ x ;Y ≤ y ] H(4) (x , y) = P [X ≥ x ;Y ≥ y ]
I FF-statistic defined as
Zn,m = max{T (1)n,m,T
(2)n,m,T
(3)n,m,T
(4)n,m},
I where
T(k)n,m = sup(x ,y )∈R2
√nm
n+m
∣∣∣H(k)n (x , y)−H
(k)m (x , y)
∣∣∣Augustin, Brenner, Hu, & Subrahmanyam Informed Options Trading prior to Corporate Events 52 / 91
Shifts in Option Trading Volume Density...continued
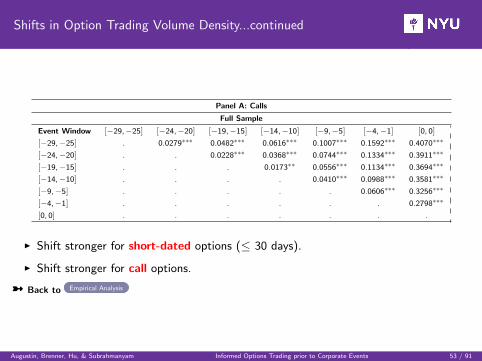
Panel A: Calls
Full Sample
Event Window [−29,−25] [−24,−20] [−19,−15] [−14,−10] [−9,−5] [−4,−1] [0, 0]
[−29,−25] . 0.0279∗∗∗ 0.0482∗∗∗ 0.0616∗∗∗ 0.1007∗∗∗ 0.1592∗∗∗ 0.4070∗∗∗
[−24,−20] . . 0.0228∗∗∗ 0.0368∗∗∗ 0.0744∗∗∗ 0.1334∗∗∗ 0.3911∗∗∗
[−19,−15] . . . 0.0173∗∗ 0.0556∗∗∗ 0.1134∗∗∗ 0.3694∗∗∗
[−14,−10] . . . . 0.0410∗∗∗ 0.0988∗∗∗ 0.3581∗∗∗
[−9,−5] . . . . . 0.0606∗∗∗ 0.3256∗∗∗
[−4,−1] . . . . . . 0.2798∗∗∗
[0, 0] . . . . . . .
I Shift stronger for short-dated options (≤ 30 days).
I Shift stronger for call options.
ü Back to Empirical Analysis
Augustin, Brenner, Hu, & Subrahmanyam Informed Options Trading prior to Corporate Events 53 / 91
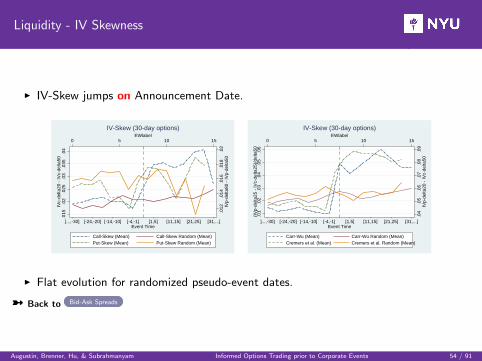
Liquidity - IV Skewness
I IV-Skew jumps on Announcement Date.
.012
.014
.016
.018
.02
IVp-
delta
80 -
IVp-
delta
50
.015
.02
.025
.03
.035
.04
IVc-
delta
20 -
IVc-
delta
50
0 5 10 15EWlabel
]...,-30] [-24,-20] [-14,-10] [-4,-1] [1,5] [11,15] [21,25] [31,...[Event Time
Call-Skew (Mean) Call-Skew Random (Mean)Put-Skew (Mean) Put-Skew Random (Mean)
IV-Skew (30-day options)
.04
.05
.06
.07
.08
.09
IVp-
delta
20 -
IVc-
delta
50
.01
.02
.03
.04
.05
.06
(IV
p-de
lta25
- IV
c-de
lta25
)/de
lta50
0 5 10 15EWlabel
]...,-30] [-24,-20] [-14,-10] [-4,-1] [1,5] [11,15] [21,25] [31,...[Event Time
Carr-Wu (Mean) Carr-Wu Random (Mean)Cremers et al. (Mean) Cremers et al. Random (Mean)
IV-Skew (30-day options)
I Flat evolution for randomized pseudo-event dates.
ü Back to Bid-Ask Spreads
Augustin, Brenner, Hu, & Subrahmanyam Informed Options Trading prior to Corporate Events 54 / 91
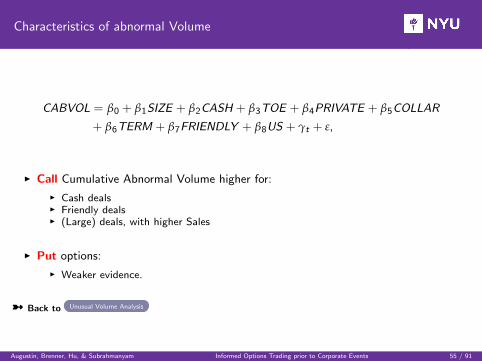
Characteristics of abnormal Volume
CABVOL = β0 + β1SIZE + β2CASH + β3TOE + β4PRIVATE + β5COLLAR
+ β6TERM + β7FRIENDLY + β8US + γt + ε,
I Call Cumulative Abnormal Volume higher for:
I Cash dealsI Friendly dealsI (Large) deals, with higher Sales
I Put options:
I Weaker evidence.
ü Back to Unusual Volume Analysis
Augustin, Brenner, Hu, & Subrahmanyam Informed Options Trading prior to Corporate Events 55 / 91
SEC Litigation Reports
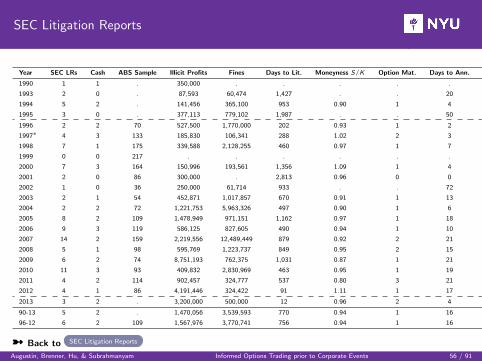
Year SEC LRs Cash ABS Sample Illicit Profits Fines Days to Lit. Moneyness S/K Option Mat. Days to Ann. Defend.
1990 1 1 . 350,000 . . . . . 1
1993 2 0 . 87,593 60,474 1,427 . . 20 5
1994 5 2 . 141,456 365,100 953 0.90 1 4 3
1995 3 0 . 377,113 779,102 1,987 . . 50 12
1996 2 2 70 527,500 1,770,000 202 0.93 1 2 .
1997∗ 4 3 133 185,830 106,341 288 1.02 2 3 2
1998 7 1 175 339,588 2,128,255 460 0.97 1 7 2
1999 0 0 217 . . . . . . .
2000 7 3 164 150,996 193,561 1,356 1.09 1 4 2
2001 2 0 86 300,000 . 2,813 0.96 0 0 .
2002 1 0 36 250,000 61,714 933 . . 72 4
2003 2 1 54 452,871 1,017,857 670 0.91 1 13 3
2004 2 2 72 1,221,753 5,963,326 497 0.90 1 6 .
2005 8 2 109 1,478,949 971,151 1,162 0.97 1 18 3
2006 9 3 119 586,125 827,605 490 0.94 1 10 3
2007 14 2 159 2,219,556 12,489,449 879 0.92 2 21 2
2008 5 1 98 595,769 1,223,737 849 0.95 2 15 2
2009 6 2 74 8,751,193 762,375 1,031 0.87 1 21 2
2010 11 3 93 409,832 2,830,969 463 0.95 1 19 2
2011 4 2 114 902,457 324,777 537 0.80 3 21 6
2012 4 1 86 4,191,446 324,422 91 1.11 1 17 2
2013 3 2 . 3,200,000 500,000 12 0.96 2 4 1
90-13 5 2 . 1,470,056 3,539,593 770 0.94 1 16 3
96-12 6 2 109 1,567,976 3,770,741 756 0.94 1 16 3
ü Back to SEC Litigation Reports
Augustin, Brenner, Hu, & Subrahmanyam Informed Options Trading prior to Corporate Events 56 / 91

Why do we care?
SEC Enforcement Actions: Insider Trading Cases
Insider trading continues to be a high priority area for the SEC’s enforcement program.The SEC brought 58 insider trading actions in FY 2012 against 131 individuals and entities.Over the last three years, the SEC has filed more insider trading actions (168 total)than in any three-year period in the agency’s history. These insider trading actions werefiled against nearly 400 individuals and entities with illicit profits or losses avoided totalingapproximately $600 million. Many of these actions involved financial professionals, hedgefund managers, corporate insiders, and attorneys who unlawfully traded on material non-public information, undermining the level playing field that is fundamental to the integrityand fair functioning of the capital markets.4
ü Back to Motivation
4https://www.sec.gov/spotlight/insidertrading/cases.shtml
Augustin, Brenner, Hu, & Subrahmanyam Informed Options Trading prior to Corporate Events 57 / 91

SEC Definition of Insider Trading
Illegal insider trading refers generally to buying or selling a security, in breach of a fidu-ciary duty or other relationship of trust and confidence, while in possession of material,nonpublic information about the security. Insider trading violations may also include “tip-ping” such information, securities trading by the person “tipped”, and securities tradingby those who misappropriate such information.5
ü Breach of fiduciary duty is key.
ü There is a fine line between legal or illegal insider trading - we talk about statisticalanomalies.
ü Insider Trading can come from “registered” corporate insiders or outsiders - wefocus on the latter.
ü Back to Motivation
5http://www.sec.gov/spotlight/insidertrading.shtml
Augustin, Brenner, Hu, & Subrahmanyam Informed Options Trading prior to Corporate Events 58 / 91
Literature
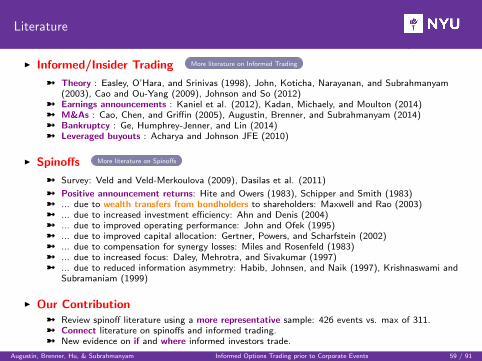
I Informed/Insider Trading More literature on Informed Trading
ü Theory : Easley, O’Hara, and Srinivas (1998), John, Koticha, Narayanan, and Subrahmanyam(2003), Cao and Ou-Yang (2009), Johnson and So (2012)
ü Earnings announcements : Kaniel et al. (2012), Kadan, Michaely, and Moulton (2014)ü M&As : Cao, Chen, and Griffin (2005), Augustin, Brenner, and Subrahmanyam (2014)ü Bankruptcy : Ge, Humphrey-Jenner, and Lin (2014)ü Leveraged buyouts : Acharya and Johnson JFE (2010)
I Spinoffs More literature on Spinoffs
ü Survey: Veld and Veld-Merkoulova (2009), Dasilas et al. (2011)
ü Positive announcement returns: Hite and Owers (1983), Schipper and Smith (1983)ü ... due to wealth transfers from bondholders to shareholders: Maxwell and Rao (2003)ü ... due to increased investment efficiency: Ahn and Denis (2004)ü ... due to improved operating performance: John and Ofek (1995)ü ... due to improved capital allocation: Gertner, Powers, and Scharfstein (2002)ü ... due to compensation for synergy losses: Miles and Rosenfeld (1983)ü ... due to increased focus: Daley, Mehrotra, and Sivakumar (1997)ü ... due to reduced information asymmetry: Habib, Johnsen, and Naik (1997), Krishnaswami and
Subramaniam (1999)
I Our Contributionü Review spinoff literature using a more representative sample: 426 events vs. max of 311.ü Connect literature on spinoffs and informed trading.ü New evidence on if and where informed investors trade.
Augustin, Brenner, Hu, & Subrahmanyam Informed Options Trading prior to Corporate Events 59 / 91
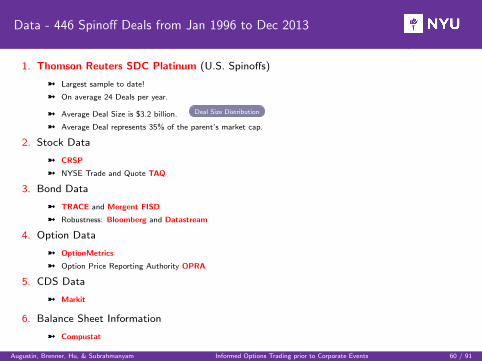
Data - 446 Spinoff Deals from Jan 1996 to Dec 2013
1. Thomson Reuters SDC Platinum (U.S. Spinoffs)
ü Largest sample to date!
ü On average 24 Deals per year.
ü Average Deal Size is $3.2 billion. Deal Size Distribution
ü Average Deal represents 35% of the parent’s market cap.
2. Stock Data
ü CRSP
ü NYSE Trade and Quote TAQ
3. Bond Data
ü TRACE and Mergent FISD
ü Robustness: Bloomberg and Datastream
4. Option Data
ü OptionMetrics
ü Option Price Reporting Authority OPRA
5. CDS Data
ü Markit
6. Balance Sheet Information
ü Compustat
Augustin, Brenner, Hu, & Subrahmanyam Informed Options Trading prior to Corporate Events 60 / 91
Data -Sample Cuts
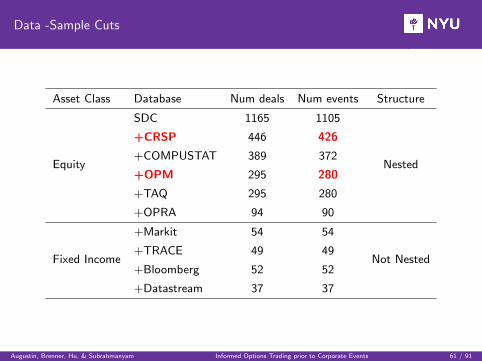
Asset Class Database Num deals Num events Structure
Equity
SDC 1165 1105
Nested
+CRSP 446 426
+COMPUSTAT 389 372
+OPM 295 280
+TAQ 295 280
+OPRA 94 90
Fixed Income
+Markit 54 54
Not Nested+TRACE 49 49
+Bloomberg 52 52
+Datastream 37 37
Augustin, Brenner, Hu, & Subrahmanyam Informed Options Trading prior to Corporate Events 61 / 91
Abnormal Announcement Returns - Event Study
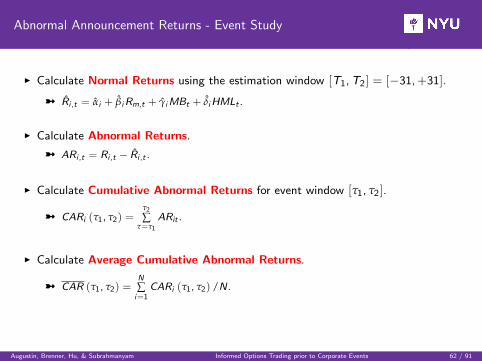
I Calculate Normal Returns using the estimation window [T1,T2] = [−31,+31].
ü R̂i ,t = α̂i + β̂iRm,t + γ̂iMBt + δ̂iHMLt .
I Calculate Abnormal Returns.
ü ARi ,t = Ri ,t − R̂i ,t .
I Calculate Cumulative Abnormal Returns for event window [τ1, τ2].
ü CARi (τ1, τ2) =τ2
∑τ=τ1
ARit .
I Calculate Average Cumulative Abnormal Returns.
ü CAR (τ1, τ2) =N
∑i=1
CARi (τ1, τ2) /N.
Augustin, Brenner, Hu, & Subrahmanyam Informed Options Trading prior to Corporate Events 62 / 91
Abnormal Announcement Returns - Event Study
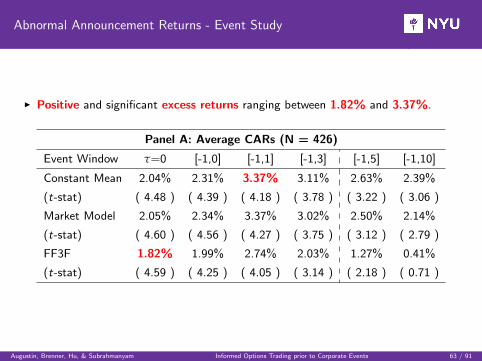
I Positive and significant excess returns ranging between 1.82% and 3.37%.
Panel A: Average CARs (N = 426)
Event Window τ=0 [-1,0] [-1,1] [-1,3] [-1,5] [-1,10]
Constant Mean 2.04% 2.31% 3.37% 3.11% 2.63% 2.39%
(t-stat) ( 4.48 ) ( 4.39 ) ( 4.18 ) ( 3.78 ) ( 3.22 ) ( 3.06 )
Market Model 2.05% 2.34% 3.37% 3.02% 2.50% 2.14%
(t-stat) ( 4.60 ) ( 4.56 ) ( 4.27 ) ( 3.75 ) ( 3.12 ) ( 2.79 )
FF3F 1.82% 1.99% 2.74% 2.03% 1.27% 0.41%
(t-stat) ( 4.59 ) ( 4.25 ) ( 4.05 ) ( 3.14 ) ( 2.18 ) ( 0.71 )
Augustin, Brenner, Hu, & Subrahmanyam Informed Options Trading prior to Corporate Events 63 / 91
Abnormal Announcement Returns - Event Study
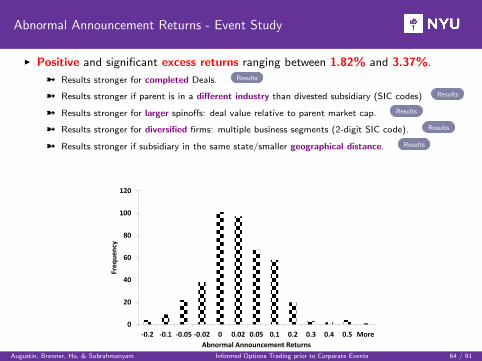
I Positive and significant excess returns ranging between 1.82% and 3.37%.
ü Results stronger for completed Deals. Results
ü Results stronger if parent is in a different industry than divested subsidiary (SIC codes) Results
ü Results stronger for larger spinoffs: deal value relative to parent market cap. Results
ü Results stronger for diversified firms: multiple business segments (2-digit SIC code). Results
ü Results stronger if subsidiary in the same state/smaller geographical distance. Results
0
20
40
60
80
100
120
‐0.2 ‐0.1 ‐0.05 ‐0.02 0 0.02 0.05 0.1 0.2 0.3 0.4 0.5 More
Freq
uency
Abnormal Announcement ReturnsAugustin, Brenner, Hu, & Subrahmanyam Informed Options Trading prior to Corporate Events 64 / 91
Literature
I Insider Trading (IT) (other than by corporate insiders/EDGAR filings)ü Keown and Pinkerton (JF1981): focus on excess stock returns around M&As.ü Meulbroek (JF1992): investigates SEC prosecuted cases, focus on stocks.ü Poteshman (JB2006): unusal put volume trading before 9/11 attack.ü Acharya and Johnson (JFE2010): More insiders (syndicate) in LBOs, more IT.ü Chesney et al. (WP2011): Develop statistical tools for the detection of IT.ü Frino et al. (IRF2013): Determinants of illegal IT in stocks based on SEC litigations.ü Wang (JEB2013): Abnormal volume predicts SEC litigations.
I Informed Trading in options around M&Aü Cao et al. (JB 2005): Targets - call volume imbalance predicts future stock returns prior to
announcements.ü Chan et al. (JFQA 2013): Acquirers - IV spread (IV skew) positively (negatively) predicts CARs.ü Barraclough et al. (RFS 2012): Use options to measure synergies in M&As.ü Spyrou et al. (JFM 2011): UK evidence for abnormal volume before M&As.ü Podolski et al. (JIFMIM 2013): Regulation affects quantity of informed trading.
I Other literature ü Back to Literature
X Where do insiders trade?ü Easley et al. (JF1998), John et al. (WP2003), Cao and Ou-Yang (RFS2009), ...
X Informational Content of Option Volume/Price for Stock Returns.ü Hu (JFE 2013), Jin et al. (JAR 2012), Driessen et al. (WP 2012), Johnson and So (JFE
2011), Pan and Poteshman (RFS 2006) ...X Price Pressure in options
ü Bollen and Whaley (JF2004) and Garleanu et al. (RFS2009)X Option Pricing Models around informational events
ü Bester et al. (WP2011), Subramanian (JF2004), Johannes (WP2006)
Augustin, Brenner, Hu, & Subrahmanyam Informed Options Trading prior to Corporate Events 65 / 91

Literature
I Spinoff Short-Run Effectsü No debate: positive abnormal performance of ap[proximately 2%-3%.ü Survey: Veld and Veld-Merkoulova (IJMR 2009), Dasilas et al. (WP 2011)
ü Positive announcement returns: Hite and Owers (JFE 1983), Schipper and Smith (JFE 1983)ü ... due to wealth transfers from bondholders to shareholders: Maxwell and Rao (JF 2003), Veld
and Veld-Merkoulova (FM 2008),ü ... due to increased investment efficiency: Ahn and Denis (JFE 2004)ü ... due to improved operating performance: John and Ofek (JFE 1995)ü ... due to improved capital allocation: Gertner, Powers, and Scharfstein (JF 2002)ü ... due to compensation for synergy losses: Miles and Rosenfeld (JF 1983), Allen McConnell, and
Reed (JFQA 1995)ü ... due to increased focus: John and Ofek (JFE 1995), Daley, Mehrotra, and Sivakumar (JFE 1997)ü ... due to tax and regulatory considerations: Copeland and Mayers (1987).ü ... due to reduced information asymmetry: Habib, Johnsen, and Naik (JFI 1997), Krishnaswami
and Subramaniam (JFE 1999), Martin and Sayrak (JCF 2003)ü Positive announcement returns are stronger for larger deals: (Klein (JF 1986).
I Spinoff Long-Run Effectsü In favor: Cusatis, Miles, and Woolridge (JFE 1993), Desai and Jain (JFE 1999)ü Challenged based on methodological grounds: Fama (JFE 1998), Lyon, Barber, and Tsai (JF
1999).ü Against: McConnell, Ozbilgin, and Wahal (JB 2001), Veld and Veld-Merkoulova (JBF 2004),
McConnell and Ovtchinnikov (JOIM 2004).
I Conglomerate discount ü Back to Literature
ü In favor: Berger and Ofek (JFE 1995), Burch and Nanda (JFE 2003), Laeven and Levine (JFE2007), Hoechle, Schmid, Walter, and Yermack (JFE 2012), Lamont and Polk (JFE 2002).
ü Challenged: Custodio (JF 2014)Augustin, Brenner, Hu, & Subrahmanyam Informed Options Trading prior to Corporate Events 66 / 91
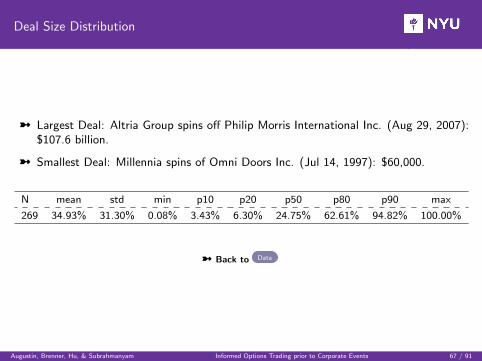
Deal Size Distribution
ü Largest Deal: Altria Group spins off Philip Morris International Inc. (Aug 29, 2007):$107.6 billion.
ü Smallest Deal: Millennia spins of Omni Doors Inc. (Jul 14, 1997): $60,000.
N mean std min p10 p20 p50 p80 p90 max
269 34.93% 31.30% 0.08% 3.43% 6.30% 24.75% 62.61% 94.82% 100.00%
ü Back to Data
Augustin, Brenner, Hu, & Subrahmanyam Informed Options Trading prior to Corporate Events 67 / 91
Informed Trading
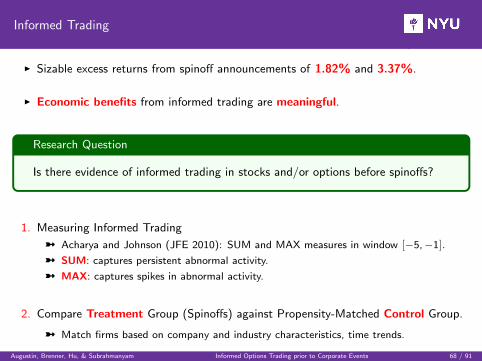
I Sizable excess returns from spinoff announcements of 1.82% and 3.37%.
I Economic benefits from informed trading are meaningful.
Research Question
Is there evidence of informed trading in stocks and/or options before spinoffs?
1. Measuring Informed Trading
ü Acharya and Johnson (JFE 2010): SUM and MAX measures in window [−5,−1].
ü SUM: captures persistent abnormal activity.
ü MAX: captures spikes in abnormal activity.
2. Compare Treatment Group (Spinoffs) against Propensity-Matched Control Group.
ü Match firms based on company and industry characteristics, time trends.
Augustin, Brenner, Hu, & Subrahmanyam Informed Options Trading prior to Corporate Events 68 / 91
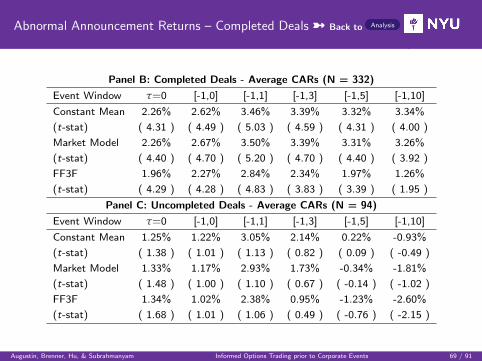
Abnormal Announcement Returns – Completed Deals ü Back to Analysis
Panel B: Completed Deals - Average CARs (N = 332)
Event Window τ=0 [-1,0] [-1,1] [-1,3] [-1,5] [-1,10]
Constant Mean 2.26% 2.62% 3.46% 3.39% 3.32% 3.34%
(t-stat) ( 4.31 ) ( 4.49 ) ( 5.03 ) ( 4.59 ) ( 4.31 ) ( 4.00 )
Market Model 2.26% 2.67% 3.50% 3.39% 3.31% 3.26%
(t-stat) ( 4.40 ) ( 4.70 ) ( 5.20 ) ( 4.70 ) ( 4.40 ) ( 3.92 )
FF3F 1.96% 2.27% 2.84% 2.34% 1.97% 1.26%
(t-stat) ( 4.29 ) ( 4.28 ) ( 4.83 ) ( 3.83 ) ( 3.39 ) ( 1.95 )
Panel C: Uncompleted Deals - Average CARs (N = 94)
Event Window τ=0 [-1,0] [-1,1] [-1,3] [-1,5] [-1,10]
Constant Mean 1.25% 1.22% 3.05% 2.14% 0.22% -0.93%
(t-stat) ( 1.38 ) ( 1.01 ) ( 1.13 ) ( 0.82 ) ( 0.09 ) ( -0.49 )
Market Model 1.33% 1.17% 2.93% 1.73% -0.34% -1.81%
(t-stat) ( 1.48 ) ( 1.00 ) ( 1.10 ) ( 0.67 ) ( -0.14 ) ( -1.02 )
FF3F 1.34% 1.02% 2.38% 0.95% -1.23% -2.60%
(t-stat) ( 1.68 ) ( 1.01 ) ( 1.06 ) ( 0.49 ) ( -0.76 ) ( -2.15 )
Augustin, Brenner, Hu, & Subrahmanyam Informed Options Trading prior to Corporate Events 69 / 91
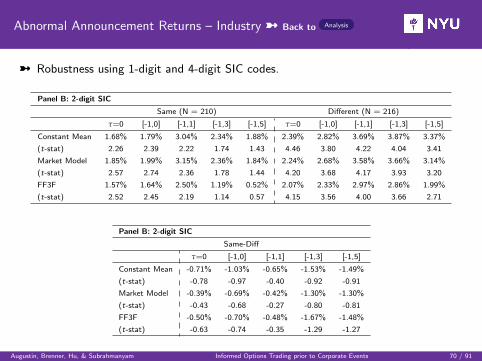
Abnormal Announcement Returns – Industry ü Back to Analysis
ü Robustness using 1-digit and 4-digit SIC codes.
Panel B: 2-digit SIC
Same (N = 210) Different (N = 216)
τ=0 [-1,0] [-1,1] [-1,3] [-1,5] τ=0 [-1,0] [-1,1] [-1,3] [-1,5]
Constant Mean 1.68% 1.79% 3.04% 2.34% 1.88% 2.39% 2.82% 3.69% 3.87% 3.37%
(t-stat) 2.26 2.39 2.22 1.74 1.43 4.46 3.80 4.22 4.04 3.41
Market Model 1.85% 1.99% 3.15% 2.36% 1.84% 2.24% 2.68% 3.58% 3.66% 3.14%
(t-stat) 2.57 2.74 2.36 1.78 1.44 4.20 3.68 4.17 3.93 3.20
FF3F 1.57% 1.64% 2.50% 1.19% 0.52% 2.07% 2.33% 2.97% 2.86% 1.99%
(t-stat) 2.52 2.45 2.19 1.14 0.57 4.15 3.56 4.00 3.66 2.71
Panel B: 2-digit SIC
Same-Diff
τ=0 [-1,0] [-1,1] [-1,3] [-1,5]
Constant Mean -0.71% -1.03% -0.65% -1.53% -1.49%
(t-stat) -0.78 -0.97 -0.40 -0.92 -0.91
Market Model -0.39% -0.69% -0.42% -1.30% -1.30%
(t-stat) -0.43 -0.68 -0.27 -0.80 -0.81
FF3F -0.50% -0.70% -0.48% -1.67% -1.48%
(t-stat) -0.63 -0.74 -0.35 -1.29 -1.27
Augustin, Brenner, Hu, & Subrahmanyam Informed Options Trading prior to Corporate Events 70 / 91
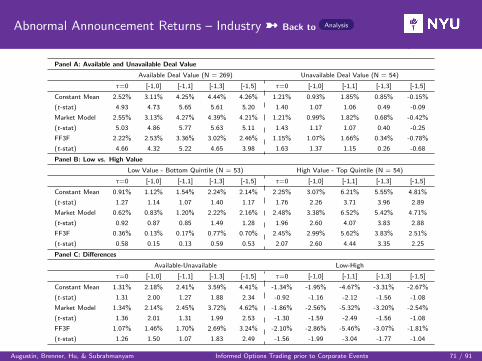
Abnormal Announcement Returns – Industry ü Back to Analysis
Panel A: Available and Unavailable Deal Value
Available Deal Value (N = 269) Unavailable Deal Value (N = 54)
τ=0 [-1,0] [-1,1] [-1,3] [-1,5] τ=0 [-1,0] [-1,1] [-1,3] [-1,5]
Constant Mean 2.52% 3.11% 4.25% 4.44% 4.26% 1.21% 0.93% 1.85% 0.85% -0.15%
(t-stat) 4.93 4.73 5.65 5.61 5.20 1.40 1.07 1.06 0.49 -0.09
Market Model 2.55% 3.13% 4.27% 4.39% 4.21% 1.21% 0.99% 1.82% 0.68% -0.42%
(t-stat) 5.03 4.86 5.77 5.63 5.11 1.43 1.17 1.07 0.40 -0.25
FF3F 2.22% 2.53% 3.36% 3.02% 2.46% 1.15% 1.07% 1.66% 0.34% -0.78%
(t-stat) 4.66 4.32 5.22 4.65 3.98 1.63 1.37 1.15 0.26 -0.68
Panel B: Low vs. High Value
Low Value - Bottom Quintile (N = 53) High Value - Top Quintile (N = 54)
τ=0 [-1,0] [-1,1] [-1,3] [-1,5] τ=0 [-1,0] [-1,1] [-1,3] [-1,5]
Constant Mean 0.91% 1.12% 1.54% 2.24% 2.14% 2.25% 3.07% 6.21% 5.55% 4.81%
(t-stat) 1.27 1.14 1.07 1.40 1.17 1.76 2.26 3.71 3.96 2.89
Market Model 0.62% 0.83% 1.20% 2.22% 2.16% 2.48% 3.38% 6.52% 5.42% 4.71%
(t-stat) 0.92 0.87 0.85 1.49 1.28 1.96 2.60 4.07 3.83 2.88
FF3F 0.36% 0.13% 0.17% 0.77% 0.70% 2.45% 2.99% 5.62% 3.83% 2.51%
(t-stat) 0.58 0.15 0.13 0.59 0.53 2.07 2.60 4.44 3.35 2.25
Panel C: Differences
Available-Unavailable Low-High
τ=0 [-1,0] [-1,1] [-1,3] [-1,5] τ=0 [-1,0] [-1,1] [-1,3] [-1,5]
Constant Mean 1.31% 2.18% 2.41% 3.59% 4.41% -1.34% -1.95% -4.67% -3.31% -2.67%
(t-stat) 1.31 2.00 1.27 1.88 2.34 -0.92 -1.16 -2.12 -1.56 -1.08
Market Model 1.34% 2.14% 2.45% 3.72% 4.62% -1.86% -2.56% -5.32% -3.20% -2.54%
(t-stat) 1.36 2.01 1.31 1.99 2.53 -1.30 -1.59 -2.49 -1.56 -1.08
FF3F 1.07% 1.46% 1.70% 2.69% 3.24% -2.10% -2.86% -5.46% -3.07% -1.81%
(t-stat) 1.26 1.50 1.07 1.83 2.49 -1.56 -1.99 -3.04 -1.77 -1.04
Augustin, Brenner, Hu, & Subrahmanyam Informed Options Trading prior to Corporate Events 71 / 91
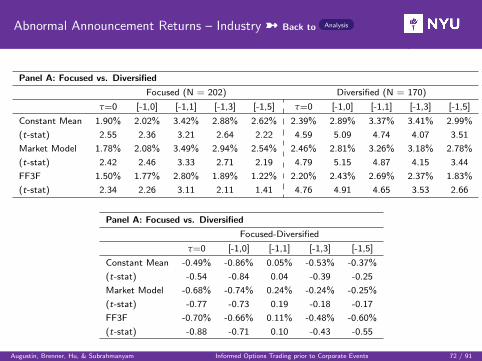
Abnormal Announcement Returns – Industry ü Back to Analysis
Panel A: Focused vs. Diversified
Focused (N = 202) Diversified (N = 170)
τ=0 [-1,0] [-1,1] [-1,3] [-1,5] τ=0 [-1,0] [-1,1] [-1,3] [-1,5]
Constant Mean 1.90% 2.02% 3.42% 2.88% 2.62% 2.39% 2.89% 3.37% 3.41% 2.99%
(t-stat) 2.55 2.36 3.21 2.64 2.22 4.59 5.09 4.74 4.07 3.51
Market Model 1.78% 2.08% 3.49% 2.94% 2.54% 2.46% 2.81% 3.26% 3.18% 2.78%
(t-stat) 2.42 2.46 3.33 2.71 2.19 4.79 5.15 4.87 4.15 3.44
FF3F 1.50% 1.77% 2.80% 1.89% 1.22% 2.20% 2.43% 2.69% 2.37% 1.83%
(t-stat) 2.34 2.26 3.11 2.11 1.41 4.76 4.91 4.65 3.53 2.66
Panel A: Focused vs. Diversified
Focused-Diversified
τ=0 [-1,0] [-1,1] [-1,3] [-1,5]
Constant Mean -0.49% -0.86% 0.05% -0.53% -0.37%
(t-stat) -0.54 -0.84 0.04 -0.39 -0.25
Market Model -0.68% -0.74% 0.24% -0.24% -0.25%
(t-stat) -0.77 -0.73 0.19 -0.18 -0.17
FF3F -0.70% -0.66% 0.11% -0.48% -0.60%
(t-stat) -0.88 -0.71 0.10 -0.43 -0.55
Augustin, Brenner, Hu, & Subrahmanyam Informed Options Trading prior to Corporate Events 72 / 91
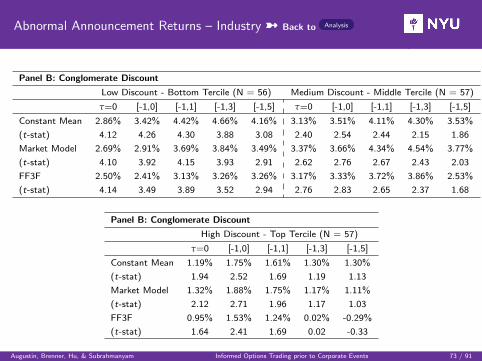
Abnormal Announcement Returns – Industry ü Back to Analysis
Panel B: Conglomerate Discount
Low Discount - Bottom Tercile (N = 56) Medium Discount - Middle Tercile (N = 57)
τ=0 [-1,0] [-1,1] [-1,3] [-1,5] τ=0 [-1,0] [-1,1] [-1,3] [-1,5]
Constant Mean 2.86% 3.42% 4.42% 4.66% 4.16% 3.13% 3.51% 4.11% 4.30% 3.53%
(t-stat) 4.12 4.26 4.30 3.88 3.08 2.40 2.54 2.44 2.15 1.86
Market Model 2.69% 2.91% 3.69% 3.84% 3.49% 3.37% 3.66% 4.34% 4.54% 3.77%
(t-stat) 4.10 3.92 4.15 3.93 2.91 2.62 2.76 2.67 2.43 2.03
FF3F 2.50% 2.41% 3.13% 3.26% 3.26% 3.17% 3.33% 3.72% 3.86% 2.53%
(t-stat) 4.14 3.49 3.89 3.52 2.94 2.76 2.83 2.65 2.37 1.68
Panel B: Conglomerate Discount
High Discount - Top Tercile (N = 57)
τ=0 [-1,0] [-1,1] [-1,3] [-1,5]
Constant Mean 1.19% 1.75% 1.61% 1.30% 1.30%
(t-stat) 1.94 2.52 1.69 1.19 1.13
Market Model 1.32% 1.88% 1.75% 1.17% 1.11%
(t-stat) 2.12 2.71 1.96 1.17 1.03
FF3F 0.95% 1.53% 1.24% 0.02% -0.29%
(t-stat) 1.64 2.41 1.69 0.02 -0.33
Augustin, Brenner, Hu, & Subrahmanyam Informed Options Trading prior to Corporate Events 73 / 91
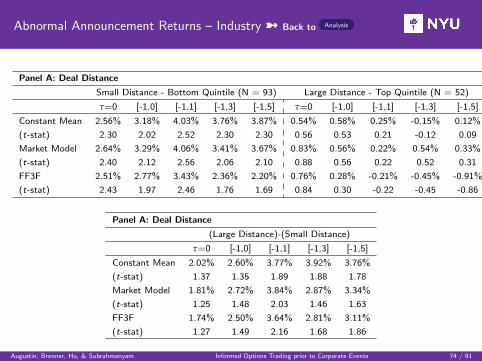
Abnormal Announcement Returns – Industry ü Back to Analysis
Panel A: Deal Distance
Small Distance - Bottom Quintile (N = 93) Large Distance - Top Quintile (N = 52)
τ=0 [-1,0] [-1,1] [-1,3] [-1,5] τ=0 [-1,0] [-1,1] [-1,3] [-1,5]
Constant Mean 2.56% 3.18% 4.03% 3.76% 3.87% 0.54% 0.58% 0.25% -0.15% 0.12%
(t-stat) 2.30 2.02 2.52 2.30 2.30 0.56 0.53 0.21 -0.12 0.09
Market Model 2.64% 3.29% 4.06% 3.41% 3.67% 0.83% 0.56% 0.22% 0.54% 0.33%
(t-stat) 2.40 2.12 2.56 2.06 2.10 0.88 0.56 0.22 0.52 0.31
FF3F 2.51% 2.77% 3.43% 2.36% 2.20% 0.76% 0.28% -0.21% -0.45% -0.91%
(t-stat) 2.43 1.97 2.46 1.76 1.69 0.84 0.30 -0.22 -0.45 -0.86
Panel A: Deal Distance
(Large Distance)-(Small Distance)
τ=0 [-1,0] [-1,1] [-1,3] [-1,5]
Constant Mean 2.02% 2.60% 3.77% 3.92% 3.76%
(t-stat) 1.37 1.35 1.89 1.88 1.78
Market Model 1.81% 2.72% 3.84% 2.87% 3.34%
(t-stat) 1.25 1.48 2.03 1.46 1.63
FF3F 1.74% 2.50% 3.64% 2.81% 3.11%
(t-stat) 1.27 1.49 2.16 1.68 1.86
Augustin, Brenner, Hu, & Subrahmanyam Informed Options Trading prior to Corporate Events 74 / 91
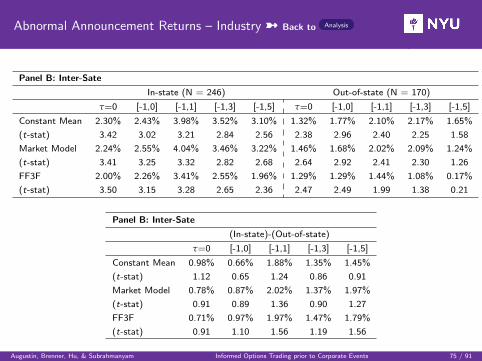
Abnormal Announcement Returns – Industry ü Back to Analysis
Panel B: Inter-Sate
In-state (N = 246) Out-of-state (N = 170)
τ=0 [-1,0] [-1,1] [-1,3] [-1,5] τ=0 [-1,0] [-1,1] [-1,3] [-1,5]
Constant Mean 2.30% 2.43% 3.98% 3.52% 3.10% 1.32% 1.77% 2.10% 2.17% 1.65%
(t-stat) 3.42 3.02 3.21 2.84 2.56 2.38 2.96 2.40 2.25 1.58
Market Model 2.24% 2.55% 4.04% 3.46% 3.22% 1.46% 1.68% 2.02% 2.09% 1.24%
(t-stat) 3.41 3.25 3.32 2.82 2.68 2.64 2.92 2.41 2.30 1.26
FF3F 2.00% 2.26% 3.41% 2.55% 1.96% 1.29% 1.29% 1.44% 1.08% 0.17%
(t-stat) 3.50 3.15 3.28 2.65 2.36 2.47 2.49 1.99 1.38 0.21
Panel B: Inter-Sate
(In-state)-(Out-of-state)
τ=0 [-1,0] [-1,1] [-1,3] [-1,5]
Constant Mean 0.98% 0.66% 1.88% 1.35% 1.45%
(t-stat) 1.12 0.65 1.24 0.86 0.91
Market Model 0.78% 0.87% 2.02% 1.37% 1.97%
(t-stat) 0.91 0.89 1.36 0.90 1.27
FF3F 0.71% 0.97% 1.97% 1.47% 1.79%
(t-stat) 0.91 1.10 1.56 1.19 1.56
Augustin, Brenner, Hu, & Subrahmanyam Informed Options Trading prior to Corporate Events 75 / 91
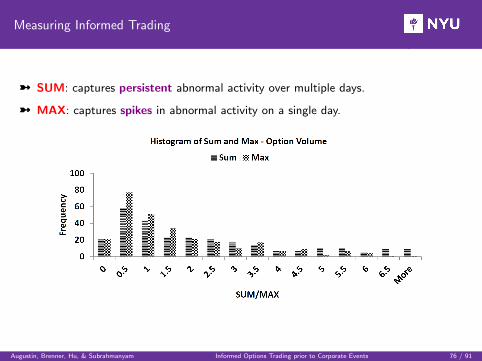
Measuring Informed Trading
ü SUM: captures persistent abnormal activity over multiple days.
ü MAX: captures spikes in abnormal activity on a single day.
Augustin, Brenner, Hu, & Subrahmanyam Informed Options Trading prior to Corporate Events 76 / 91
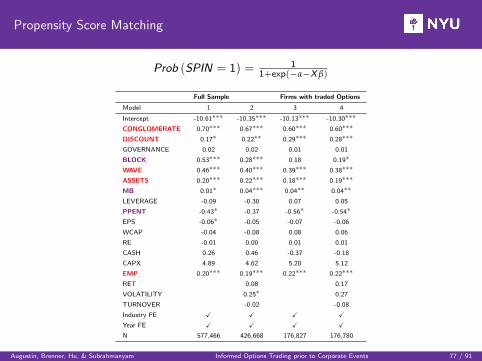
Propensity Score Matching
Prob (SPIN = 1) = 11+exp(−α−X β)
Full Sample Firms with traded Options
Model 1 2 3 4
Intercept -10.61∗∗∗ -10.35∗∗∗ -10.13∗∗∗ -10.30∗∗∗
CONGLOMERATE 0.70∗∗∗ 0.67∗∗∗ 0.60∗∗∗ 0.60∗∗∗
DISCOUNT 0.17∗ 0.22∗∗ 0.29∗∗∗ 0.28∗∗∗
GOVERNANCE 0.02 0.02 0.01 0.01
BLOCK 0.53∗∗∗ 0.28∗∗∗ 0.18 0.19∗
WAVE 0.46∗∗∗ 0.40∗∗∗ 0.39∗∗∗ 0.38∗∗∗
ASSETS 0.20∗∗∗ 0.22∗∗∗ 0.18∗∗∗ 0.19∗∗∗
MB 0.01∗ 0.04∗∗∗ 0.04∗∗ 0.04∗∗
LEVERAGE -0.09 -0.30 0.07 0.05
PPENT -0.43∗ -0.37 -0.56∗ -0.54∗
EPS -0.06∗ -0.05 -0.07 -0.06
WCAP -0.04 -0.08 0.08 0.06
RE -0.01 0.00 0.01 0.01
CASH 0.26 0.46 -0.37 -0.18
CAPX 4.89 4.62 5.20 5.12
EMP 0.20∗∗∗ 0.19∗∗∗ 0.22∗∗∗ 0.22∗∗∗
RET 0.08 0.17
VOLATILITY 0.25∗ 0.27
TURNOVER -0.02 -0.08
Industry FE X X X X
Year FE X X X X
N 577,466 426,668 176,827 176,780
Augustin, Brenner, Hu, & Subrahmanyam Informed Options Trading prior to Corporate Events 77 / 91
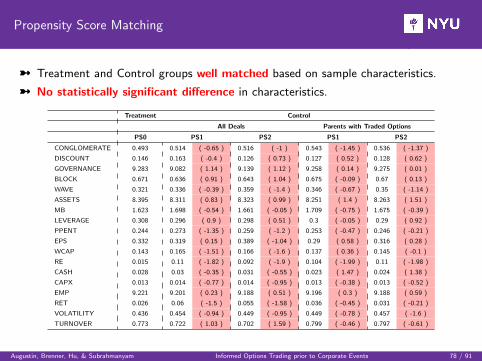
Propensity Score Matching
ü Treatment and Control groups well matched based on sample characteristics.
ü No statistically significant difference in characteristics.
Treatment Control
All Deals Parents with Traded Options
PS0 PS1 PS2 PS1 PS2
CONGLOMERATE 0.493 0.514 ( -0.65 ) 0.516 ( -1 ) 0.543 ( -1.45 ) 0.536 ( -1.37 )
DISCOUNT 0.146 0.163 ( -0.4 ) 0.126 ( 0.73 ) 0.127 ( 0.52 ) 0.128 ( 0.62 )
GOVERNANCE 9.283 9.082 ( 1.14 ) 9.139 ( 1.12 ) 9.258 ( 0.14 ) 9.275 ( 0.01 )
BLOCK 0.671 0.636 ( 0.91 ) 0.643 ( 1.04 ) 0.675 ( -0.09 ) 0.67 ( 0.13 )
WAVE 0.321 0.336 ( -0.39 ) 0.359 ( -1.4 ) 0.346 ( -0.67 ) 0.35 ( -1.14 )
ASSETS 8.395 8.311 ( 0.83 ) 8.323 ( 0.99 ) 8.251 ( 1.4 ) 8.263 ( 1.51 )
MB 1.623 1.698 ( -0.54 ) 1.661 ( -0.05 ) 1.709 ( -0.75 ) 1.675 ( -0.39 )
LEVERAGE 0.308 0.296 ( 0.9 ) 0.298 ( 0.51 ) 0.3 ( -0.05 ) 0.29 ( 0.92 )
PPENT 0.244 0.273 ( -1.35 ) 0.259 ( -1.2 ) 0.253 ( -0.47 ) 0.246 ( -0.21 )
EPS 0.332 0.319 ( 0.15 ) 0.389 ( -1.04 ) 0.29 ( 0.58 ) 0.316 ( 0.28 )
WCAP 0.143 0.165 ( -1.51 ) 0.166 ( -1.6 ) 0.137 ( 0.36 ) 0.145 ( -0.1 )
RE 0.015 0.11 ( -1.82 ) 0.092 ( -1.9 ) 0.104 ( -1.99 ) 0.11 ( -1.98 )
CASH 0.028 0.03 ( -0.35 ) 0.031 ( -0.55 ) 0.023 ( 1.47 ) 0.024 ( 1.38 )
CAPX 0.013 0.014 ( -0.77 ) 0.014 ( -0.95 ) 0.013 ( -0.38 ) 0.013 ( -0.52 )
EMP 9.221 9.201 ( 0.23 ) 9.188 ( 0.51 ) 9.196 ( 0.3 ) 9.188 ( 0.59 )
RET 0.026 0.06 ( -1.5 ) 0.055 ( -1.58 ) 0.036 ( -0.45 ) 0.031 ( -0.21 )
VOLATILITY 0.436 0.454 ( -0.94 ) 0.449 ( -0.95 ) 0.449 ( -0.78 ) 0.457 ( -1.6 )
TURNOVER 0.773 0.722 ( 1.03 ) 0.702 ( 1.59 ) 0.799 ( -0.46 ) 0.797 ( -0.61 )
Augustin, Brenner, Hu, & Subrahmanyam Informed Options Trading prior to Corporate Events 78 / 91
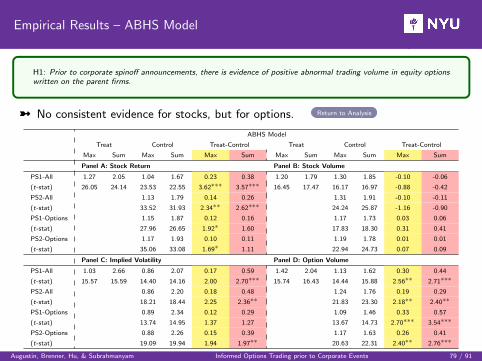
Empirical Results – ABHS Model
H1: Prior to corporate spinoff announcements, there is evidence of positive abnormal trading volume in equity optionswritten on the parent firms.
ü No consistent evidence for stocks, but for options. Return to Analysis
ABHS Model
Treat Control Treat-Control Treat Control Treat-Control
Max Sum Max Sum Max Sum Max Sum Max Sum Max Sum
Panel A: Stock Return Panel B: Stock Volume
PS1-All 1.27 2.05 1.04 1.67 0.23 0.38 1.20 1.79 1.30 1.85 -0.10 -0.06
(t-stat) 26.05 24.14 23.53 22.55 3.62∗∗∗ 3.57∗∗∗ 16.45 17.47 16.17 16.97 -0.88 -0.42
PS2-All 1.13 1.79 0.14 0.26 1.31 1.91 -0.10 -0.11
(t-stat) 33.52 31.93 2.34∗∗ 2.62∗∗∗ 24.24 25.87 -1.16 -0.90
PS1-Options 1.15 1.87 0.12 0.16 1.17 1.73 0.03 0.06
(t-stat) 27.96 26.65 1.92∗ 1.60 17.83 18.30 0.31 0.41
PS2-Options 1.17 1.93 0.10 0.11 1.19 1.78 0.01 0.01
(t-stat) 35.06 33.08 1.69∗ 1.11 22.94 24.73 0.07 0.09
Panel C: Implied Volatility Panel D: Option Volume
PS1-All 1.03 2.66 0.86 2.07 0.17 0.59 1.42 2.04 1.13 1.62 0.30 0.44
(t-stat) 15.57 15.59 14.40 14.16 2.00 2.70∗∗∗ 15.74 16.43 14.44 15.88 2.56∗∗ 2.71∗∗∗
PS2-All 0.86 2.20 0.18 0.48 1.24 1.76 0.19 0.29
(t-stat) 18.21 18.44 2.25 2.36∗∗ 21.83 23.30 2.18∗∗ 2.40∗∗
PS1-Options 0.89 2.34 0.12 0.29 1.09 1.46 0.33 0.57
(t-stat) 13.74 14.95 1.37 1.27 13.67 14.73 2.70∗∗∗ 3.54∗∗∗
PS2-Options 0.88 2.26 0.15 0.39 1.17 1.63 0.26 0.41
(t-stat) 19.09 19.94 1.94 1.97∗∗ 20.63 22.31 2.40∗∗ 2.76∗∗∗
Augustin, Brenner, Hu, & Subrahmanyam Informed Options Trading prior to Corporate Events 79 / 91
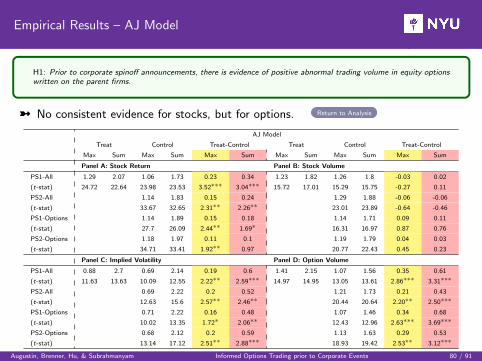
Empirical Results – AJ Model
H1: Prior to corporate spinoff announcements, there is evidence of positive abnormal trading volume in equity optionswritten on the parent firms.
ü No consistent evidence for stocks, but for options. Return to Analysis
AJ Model
Treat Control Treat-Control Treat Control Treat-Control
Max Sum Max Sum Max Sum Max Sum Max Sum Max Sum
Panel A: Stock Return Panel B: Stock Volume
PS1-All 1.29 2.07 1.06 1.73 0.23 0.34 1.23 1.82 1.26 1.8 -0.03 0.02
(t-stat) 24.72 22.64 23.98 23.53 3.52∗∗∗ 3.04∗∗∗ 15.72 17.01 15.29 15.75 -0.27 0.11
PS2-All 1.14 1.83 0.15 0.24 1.29 1.88 -0.06 -0.06
(t-stat) 33.67 32.65 2.31∗∗ 2.26∗∗ 23.01 23.89 -0.64 -0.46
PS1-Options 1.14 1.89 0.15 0.18 1.14 1.71 0.09 0.11
(t-stat) 27.7 26.09 2.44∗∗ 1.69∗ 16.31 16.97 0.87 0.76
PS2-Options 1.18 1.97 0.11 0.1 1.19 1.79 0.04 0.03
(t-stat) 34.71 33.41 1.92∗∗ 0.97 20.77 22.43 0.45 0.23
Panel C: Implied Volatility Panel D: Option Volume
PS1-All 0.88 2.7 0.69 2.14 0.19 0.6 1.41 2.15 1.07 1.56 0.35 0.61
(t-stat) 11.63 13.63 10.09 12.55 2.22∗∗ 2.59∗∗∗ 14.97 14.95 13.05 13.61 2.86∗∗∗ 3.31∗∗∗
PS2-All 0.69 2.22 0.2 0.52 1.21 1.73 0.21 0.43
(t-stat) 12.63 15.6 2.57∗∗ 2.46∗∗ 20.44 20.64 2.20∗∗ 2.50∗∗∗
PS1-Options 0.71 2.22 0.16 0.48 1.07 1.46 0.34 0.68
(t-stat) 10.02 13.35 1.72∗ 2.06∗∗ 12.43 12.96 2.63∗∗∗ 3.69∗∗∗
PS2-Options 0.68 2.12 0.2 0.59 1.13 1.63 0.29 0.53
(t-stat) 13.14 17.12 2.51∗∗ 2.88∗∗∗ 18.93 19.42 2.53∗∗ 3.12∗∗∗
Augustin, Brenner, Hu, & Subrahmanyam Informed Options Trading prior to Corporate Events 80 / 91
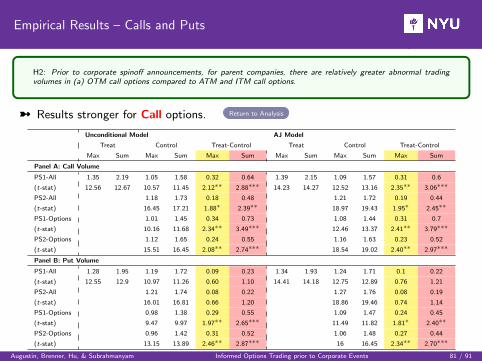
Empirical Results – Calls and Puts
H2: Prior to corporate spinoff announcements, for parent companies, there are relatively greater abnormal tradingvolumes in (a) OTM call options compared to ATM and ITM call options.
ü Results stronger for Call options. Return to Analysis
Unconditional Model AJ Model
Treat Control Treat-Control Treat Control Treat-Control
Max Sum Max Sum Max Sum Max Sum Max Sum Max Sum
Panel A: Call Volume
PS1-All 1.35 2.19 1.05 1.58 0.32 0.64 1.39 2.15 1.09 1.57 0.31 0.6
(t-stat) 12.56 12.67 10.57 11.45 2.12∗∗ 2.88∗∗∗ 14.23 14.27 12.52 13.16 2.35∗∗ 3.06∗∗∗
PS2-All 1.18 1.73 0.18 0.48 1.21 1.72 0.19 0.44
(t-stat) 16.45 17.21 1.88∗ 2.39∗∗ 18.97 19.43 1.95∗ 2.45∗∗
PS1-Options 1.01 1.45 0.34 0.73 1.08 1.44 0.31 0.7
(t-stat) 10.16 11.68 2.34∗∗ 3.49∗∗∗ 12.46 13.37 2.41∗∗ 3.79∗∗∗
PS2-Options 1.12 1.65 0.24 0.55 1.16 1.63 0.23 0.52
(t-stat) 15.51 16.45 2.08∗∗ 2.74∗∗∗ 18.54 19.02 2.40∗∗ 2.97∗∗∗
Panel B: Put Volume
PS1-All 1.28 1.95 1.19 1.72 0.09 0.23 1.34 1.93 1.24 1.71 0.1 0.22
(t-stat) 12.55 12.9 10.97 11.26 0.60 1.10 14.41 14.18 12.75 12.89 0.76 1.21
PS2-All 1.21 1.74 0.08 0.22 1.27 1.76 0.08 0.19
(t-stat) 16.01 16.81 0.66 1.20 18.86 19.46 0.74 1.14
PS1-Options 0.98 1.38 0.29 0.55 1.09 1.47 0.24 0.45
(t-stat) 9.47 9.97 1.97∗∗ 2.65∗∗∗ 11.49 11.82 1.81∗ 2.40∗∗
PS2-Options 0.96 1.42 0.31 0.52 1.06 1.48 0.27 0.44
(t-stat) 13.15 13.89 2.46∗∗ 2.87∗∗∗ 16 16.45 2.34∗∗ 2.70∗∗∗
Augustin, Brenner, Hu, & Subrahmanyam Informed Options Trading prior to Corporate Events 81 / 91
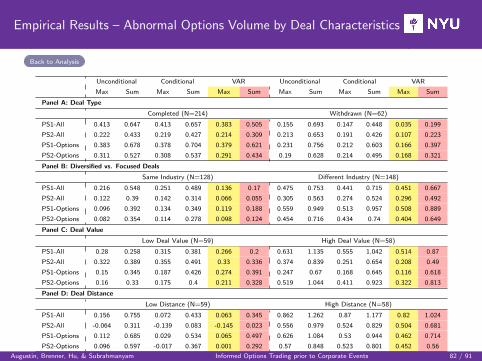
Empirical Results – Abnormal Options Volume by Deal Characteristics
Back to Analysis
Unconditional Conditional VAR Unconditional Conditional VAR
Max Sum Max Sum Max Sum Max Sum Max Sum Max Sum
Panel A: Deal Type
Completed (N=214) Withdrawn (N=62)
PS1-All 0.413 0.647 0.413 0.657 0.383 0.505 0.155 0.693 0.147 0.448 0.035 0.199
PS2-All 0.222 0.433 0.219 0.427 0.214 0.309 0.213 0.653 0.191 0.426 0.107 0.223
PS1-Options 0.383 0.678 0.378 0.704 0.379 0.621 0.231 0.756 0.212 0.603 0.166 0.397
PS2-Options 0.311 0.527 0.308 0.537 0.291 0.434 0.19 0.628 0.214 0.495 0.168 0.321
Panel B: Diversified vs. Focused Deals
Same Industry (N=128) Different Industry (N=148)
PS1-All 0.216 0.548 0.251 0.489 0.136 0.17 0.475 0.753 0.441 0.715 0.451 0.667
PS2-All 0.122 0.39 0.142 0.314 0.066 0.055 0.305 0.563 0.274 0.524 0.296 0.492
PS1-Options 0.096 0.392 0.134 0.349 0.119 0.188 0.559 0.949 0.513 0.957 0.508 0.889
PS2-Options 0.082 0.354 0.114 0.278 0.098 0.124 0.454 0.716 0.434 0.74 0.404 0.649
Panel C: Deal Value
Low Deal Value (N=59) High Deal Value (N=58)
PS1-All 0.28 0.258 0.315 0.381 0.266 0.2 0.631 1.135 0.555 1.042 0.514 0.87
PS2-All 0.322 0.389 0.355 0.491 0.33 0.336 0.374 0.839 0.251 0.654 0.208 0.49
PS1-Options 0.15 0.345 0.187 0.426 0.274 0.391 0.247 0.67 0.168 0.645 0.116 0.618
PS2-Options 0.16 0.33 0.175 0.4 0.211 0.328 0.519 1.044 0.411 0.923 0.322 0.813
Panel D: Deal Distance
Low Distance (N=59) High Distance (N=58)
PS1-All 0.156 0.755 0.072 0.433 0.063 0.345 0.862 1.262 0.87 1.177 0.82 1.024
PS2-All -0.064 0.311 -0.139 0.083 -0.145 0.023 0.556 0.979 0.524 0.829 0.504 0.681
PS1-Options 0.112 0.685 0.029 0.534 0.065 0.497 0.626 1.084 0.53 0.944 0.462 0.714
PS2-Options 0.096 0.597 -0.017 0.367 0.001 0.292 0.57 0.848 0.523 0.801 0.452 0.56
Panel E: Conglomerate Discount
Low Discount (N=46) High Discount (N=46)
PS1-All 1.005 1.394 0.945 1.414 0.903 1.273 0.338 0.531 0.568 0.854 0.473 0.588
PS2-All 0.754 1.09 0.657 1.066 0.656 1.009 0.186 0.441 0.334 0.611 0.235 0.343
PS1-Options 0.906 1.272 0.835 1.322 0.791 1.188 -0.056 0.185 0.057 0.376 0.039 0.213
PS2-Options 0.761 0.949 0.732 1.063 0.719 1.039 0.081 0.227 0.224 0.413 0.169 0.209
Augustin, Brenner, Hu, & Subrahmanyam Informed Options Trading prior to Corporate Events 82 / 91
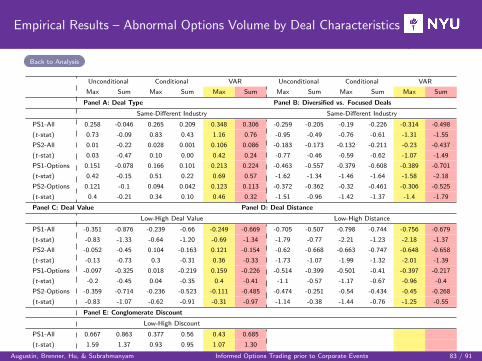
Empirical Results – Abnormal Options Volume by Deal Characteristics
Back to Analysis
Unconditional Conditional VAR Unconditional Conditional VAR
Max Sum Max Sum Max Sum Max Sum Max Sum Max Sum
Panel A: Deal Type Panel B: Diversified vs. Focused Deals
Same-Different Industry Same-Different Industry
PS1-All 0.258 -0.046 0.265 0.209 0.348 0.306 -0.259 -0.205 -0.19 -0.226 -0.314 -0.498
(t-stat) 0.73 -0.09 0.83 0.43 1.16 0.76 -0.95 -0.49 -0.76 -0.61 -1.31 -1.55
PS2-All 0.01 -0.22 0.028 0.001 0.106 0.086 -0.183 -0.173 -0.132 -0.211 -0.23 -0.437
(t-stat) 0.03 -0.47 0.10 0.00 0.42 0.24 -0.77 -0.46 -0.59 -0.62 -1.07 -1.49
PS1-Options 0.151 -0.078 0.166 0.101 0.213 0.224 -0.463 -0.557 -0.379 -0.608 -0.389 -0.701
(t-stat) 0.42 -0.15 0.51 0.22 0.69 0.57 -1.62 -1.34 -1.46 -1.64 -1.58 -2.18
PS2-Options 0.121 -0.1 0.094 0.042 0.123 0.113 -0.372 -0.362 -0.32 -0.461 -0.306 -0.525
(t-stat) 0.4 -0.21 0.34 0.10 0.46 0.32 -1.51 -0.96 -1.42 -1.37 -1.4 -1.79
Panel C: Deal Value Panel D: Deal Distance
Low-High Deal Value Low-High Distance
PS1-All -0.351 -0.876 -0.239 -0.66 -0.249 -0.669 -0.705 -0.507 -0.798 -0.744 -0.756 -0.679
(t-stat) -0.83 -1.33 -0.64 -1.20 -0.69 -1.34 -1.79 -0.77 -2.21 -1.23 -2.18 -1.37
PS2-All -0.052 -0.45 0.104 -0.163 0.121 -0.154 -0.62 -0.668 -0.663 -0.747 -0.648 -0.658
(t-stat) -0.13 -0.73 0.3 -0.31 0.36 -0.33 -1.73 -1.07 -1.99 -1.32 -2.01 -1.39
PS1-Options -0.097 -0.325 0.018 -0.219 0.159 -0.226 -0.514 -0.399 -0.501 -0.41 -0.397 -0.217
(t-stat) -0.2 -0.45 0.04 -0.35 0.4 -0.41 -1.1 -0.57 -1.17 -0.67 -0.96 -0.4
PS2-Options -0.359 -0.714 -0.236 -0.523 -0.111 -0.485 -0.474 -0.251 -0.54 -0.434 -0.45 -0.268
(t-stat) -0.83 -1.07 -0.62 -0.91 -0.31 -0.97 -1.14 -0.38 -1.44 -0.76 -1.25 -0.55
Panel E: Conglomerate Discount
Low-High Discount
PS1-All 0.667 0.863 0.377 0.56 0.43 0.685
(t-stat) 1.59 1.37 0.93 0.95 1.07 1.30
PS2-All 0.567 0.648 0.323 0.455 0.421 0.666
(t-stat) 1.42 1.12 0.83 0.8 1.09 1.34
PS1-Options 0.962 1.087 0.778 0.946 0.751 0.975
(t-stat) 2.02 1.8 1.78 1.63 1.77 1.87
PS2-Options 0.68 0.723 0.508 0.65 0.55 0.83
(t-stat) 1.58 1.22 1.26 1.13 1.38 1.64
Augustin, Brenner, Hu, & Subrahmanyam Informed Options Trading prior to Corporate Events 83 / 91
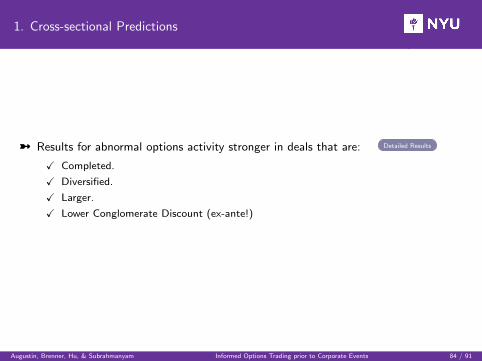
1. Cross-sectional Predictions
ü Results for abnormal options activity stronger in deals that are: Detailed Results
X Completed.
X Diversified.
X Larger.
X Lower Conglomerate Discount (ex-ante!)
Augustin, Brenner, Hu, & Subrahmanyam Informed Options Trading prior to Corporate Events 84 / 91
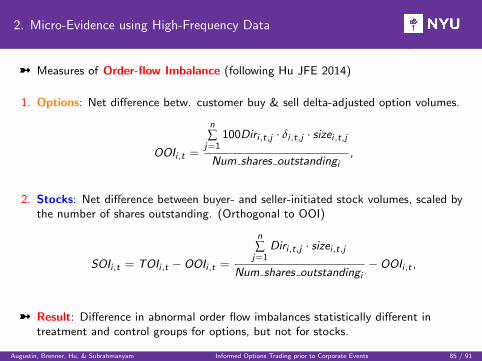
2. Micro-Evidence using High-Frequency Data
ü Measures of Order-flow Imbalance (following Hu JFE 2014)
1. Options: Net difference betw. customer buy & sell delta-adjusted option volumes.
OOIi ,t =
n∑j=1
100Diri ,t,j · δi ,t,j · sizei ,t,j
Num shares outstandingi,
2. Stocks: Net difference between buyer- and seller-initiated stock volumes, scaled bythe number of shares outstanding. (Orthogonal to OOI)
SOIi ,t = TOIi ,t −OOIi ,t =
n∑j=1
Diri ,t,j · sizei ,t,j
Num shares outstandingi−OOIi ,t ,
ü Result: Difference in abnormal order flow imbalances statistically different intreatment and control groups for options, but not for stocks.
Augustin, Brenner, Hu, & Subrahmanyam Informed Options Trading prior to Corporate Events 85 / 91
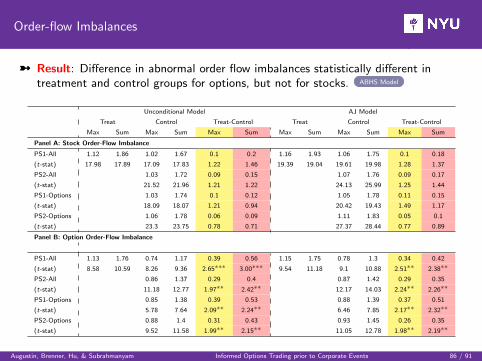
Order-flow Imbalances
ü Result: Difference in abnormal order flow imbalances statistically different intreatment and control groups for options, but not for stocks. ABHS Model
Unconditional Model AJ Model
Treat Control Treat-Control Treat Control Treat-Control
Max Sum Max Sum Max Sum Max Sum Max Sum Max Sum
Panel A: Stock Order-Flow Imbalance
PS1-All 1.12 1.86 1.02 1.67 0.1 0.2 1.16 1.93 1.06 1.75 0.1 0.18
(t-stat) 17.98 17.89 17.09 17.83 1.22 1.46 19.39 19.04 19.61 19.98 1.28 1.37
PS2-All 1.03 1.72 0.09 0.15 1.07 1.76 0.09 0.17
(t-stat) 21.52 21.96 1.21 1.22 24.13 25.99 1.25 1.44
PS1-Options 1.03 1.74 0.1 0.12 1.05 1.78 0.11 0.15
(t-stat) 18.09 18.07 1.21 0.94 20.42 19.43 1.49 1.17
PS2-Options 1.06 1.78 0.06 0.09 1.11 1.83 0.05 0.1
(t-stat) 23.3 23.75 0.78 0.71 27.37 28.44 0.77 0.89
Panel B: Option Order-Flow Imbalance
PS1-All 1.13 1.76 0.74 1.17 0.39 0.56 1.15 1.75 0.78 1.3 0.34 0.42
(t-stat) 8.58 10.59 8.26 9.36 2.65∗∗∗ 3.00∗∗∗ 9.54 11.18 9.1 10.88 2.51∗∗ 2.38∗∗
PS2-All 0.86 1.37 0.29 0.4 0.87 1.42 0.29 0.35
(t-stat) 11.18 12.77 1.97∗∗ 2.42∗∗ 12.17 14.03 2.24∗∗ 2.26∗∗
PS1-Options 0.85 1.38 0.39 0.53 0.88 1.39 0.37 0.51
(t-stat) 5.78 7.64 2.09∗∗ 2.24∗∗ 6.46 7.85 2.17∗∗ 2.32∗∗
PS2-Options 0.88 1.4 0.31 0.43 0.93 1.45 0.26 0.35
(t-stat) 9.52 11.58 1.99∗∗ 2.15∗∗ 11.05 12.78 1.98∗∗ 2.19∗∗
Augustin, Brenner, Hu, & Subrahmanyam Informed Options Trading prior to Corporate Events 86 / 91
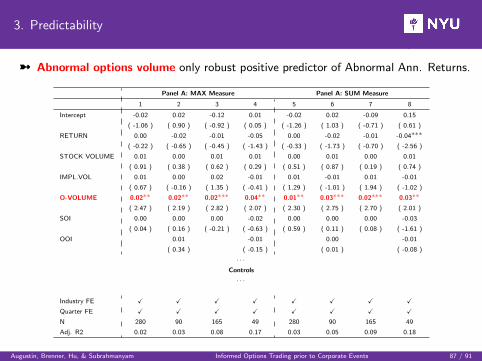
3. Predictability
ü Abnormal options volume only robust positive predictor of Abnormal Ann. Returns.
Panel A: MAX Measure Panel A: SUM Measure
1 2 3 4 5 6 7 8
Intercept -0.02 0.02 -0.12 0.01 -0.02 0.02 -0.09 0.15
( -1.06 ) ( 0.90 ) ( -0.92 ) ( 0.05 ) ( -1.26 ) ( 1.03 ) ( -0.71 ) ( 0.61 )
RETURN 0.00 -0.02 -0.01 -0.05 0.00 -0.02 -0.01 -0.04∗∗∗
( -0.22 ) ( -0.65 ) ( -0.45 ) ( -1.43 ) ( -0.33 ) ( -1.73 ) ( -0.70 ) ( -2.56 )
STOCK VOLUME 0.01 0.00 0.01 0.01 0.00 0.01 0.00 0.01
( 0.91 ) ( 0.38 ) ( 0.62 ) ( 0.29 ) ( 0.51 ) ( 0.87 ) ( 0.19 ) ( 0.74 )
IMPL.VOL 0.01 0.00 0.02 -0.01 0.01 -0.01 0.01 -0.01
( 0.67 ) ( -0.16 ) ( 1.35 ) ( -0.41 ) ( 1.29 ) ( -1.01 ) ( 1.94 ) ( -1.02 )
O-VOLUME 0.02∗∗ 0.02∗∗ 0.02∗∗∗ 0.04∗∗ 0.01∗∗ 0.03∗∗∗ 0.02∗∗∗ 0.03∗∗
( 2.47 ) ( 2.19 ) ( 2.82 ) ( 2.07 ) ( 2.30 ) ( 2.75 ) ( 2.70 ) ( 2.01 )
SOI 0.00 0.00 0.00 -0.02 0.00 0.00 0.00 -0.03
( 0.04 ) ( 0.16 ) ( -0.21 ) ( -0.63 ) ( 0.59 ) ( 0.11 ) ( 0.08 ) ( -1.61 )
OOI 0.01 -0.01 0.00 -0.01
( 0.34 ) ( -0.15 ) ( 0.01 ) ( -0.08 )
· · ·Controls
· · ·
Industry FE X X X X X X X X
Quarter FE X X X X X X X X
N 280 90 165 49 280 90 165 49
Adj. R2 0.02 0.03 0.08 0.17 0.03 0.05 0.09 0.18
Augustin, Brenner, Hu, & Subrahmanyam Informed Options Trading prior to Corporate Events 87 / 91
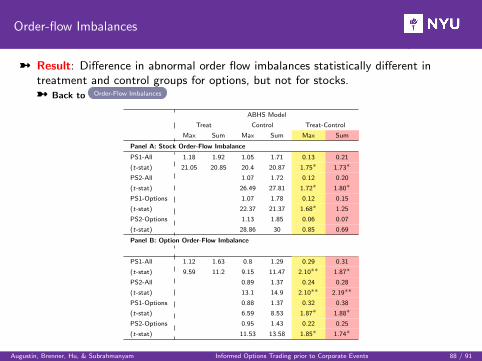
Order-flow Imbalances
ü Result: Difference in abnormal order flow imbalances statistically different intreatment and control groups for options, but not for stocks.ü Back to Order-Flow Imbalances
ABHS Model
Treat Control Treat-Control
Max Sum Max Sum Max Sum
Panel A: Stock Order-Flow Imbalance
PS1-All 1.18 1.92 1.05 1.71 0.13 0.21
(t-stat) 21.05 20.85 20.4 20.87 1.75∗ 1.73∗
PS2-All 1.07 1.72 0.12 0.20
(t-stat) 26.49 27.81 1.72∗ 1.80∗
PS1-Options 1.07 1.78 0.12 0.15
(t-stat) 22.37 21.37 1.68∗ 1.25
PS2-Options 1.13 1.85 0.06 0.07
(t-stat) 28.86 30 0.85 0.69
Panel B: Option Order-Flow Imbalance
PS1-All 1.12 1.63 0.8 1.29 0.29 0.31
(t-stat) 9.59 11.2 9.15 11.47 2.10∗∗ 1.87∗
PS2-All 0.89 1.37 0.24 0.28
(t-stat) 13.1 14.9 2.10∗∗ 2.19∗∗
PS1-Options 0.88 1.37 0.32 0.38
(t-stat) 6.59 8.53 1.87∗ 1.88∗
PS2-Options 0.95 1.43 0.22 0.25
(t-stat) 11.53 13.58 1.85∗ 1.74∗
Augustin, Brenner, Hu, & Subrahmanyam Informed Options Trading prior to Corporate Events 88 / 91
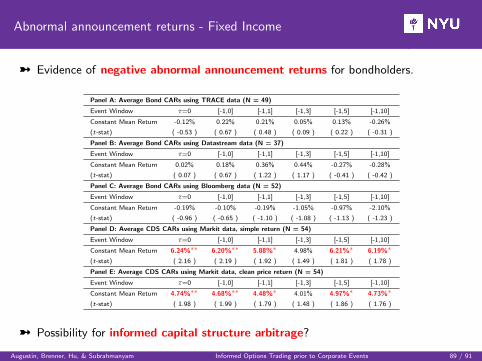
Abnormal announcement returns - Fixed Income
ü Evidence of negative abnormal announcement returns for bondholders.
Panel A: Average Bond CARs using TRACE data (N = 49)
Event Window τ=0 [-1,0] [-1,1] [-1,3] [-1,5] [-1,10]
Constant Mean Return -0.12% 0.22% 0.21% 0.05% 0.13% -0.26%
(t-stat) ( -0.53 ) ( 0.67 ) ( 0.48 ) ( 0.09 ) ( 0.22 ) ( -0.31 )
Panel B: Average Bond CARs using Datastream data (N = 37)
Event Window τ=0 [-1,0] [-1,1] [-1,3] [-1,5] [-1,10]
Constant Mean Return 0.02% 0.18% 0.36% 0.44% -0.27% -0.28%
(t-stat) ( 0.07 ) ( 0.67 ) ( 1.22 ) ( 1.17 ) ( -0.41 ) ( -0.42 )
Panel C: Average Bond CARs using Bloomberg data (N = 52)
Event Window τ=0 [-1,0] [-1,1] [-1,3] [-1,5] [-1,10]
Constant Mean Return -0.19% -0.10% -0.19% -1.05% -0.97% -2.10%
(t-stat) ( -0.96 ) ( -0.65 ) ( -1.10 ) ( -1.08 ) ( -1.13 ) ( -1.23 )
Panel D: Average CDS CARs using Markit data, simple return (N = 54)
Event Window τ=0 [-1,0] [-1,1] [-1,3] [-1,5] [-1,10]
Constant Mean Return 6.24%∗∗ 6.20%∗∗ 5.88%∗ 4.98% 6.21%∗ 6.19%∗
(t-stat) ( 2.16 ) ( 2.19 ) ( 1.92 ) ( 1.49 ) ( 1.81 ) ( 1.78 )
Panel E: Average CDS CARs using Markit data, clean price return (N = 54)
Event Window τ=0 [-1,0] [-1,1] [-1,3] [-1,5] [-1,10]
Constant Mean Return 4.74%∗∗ 4.68%∗∗ 4.48%∗ 4.01% 4.97%∗ 4.73%∗
(t-stat) ( 1.98 ) ( 1.99 ) ( 1.79 ) ( 1.48 ) ( 1.86 ) ( 1.76 )
ü Possibility for informed capital structure arbitrage?
Augustin, Brenner, Hu, & Subrahmanyam Informed Options Trading prior to Corporate Events 89 / 91
Informed capital structure arbitrage
I Testable Hypothesis
ü Possibility for informed capital structure arbitrage?
ü No evidence of informed activity in fixed income markets.
I No statistically significant difference in SUM and MAX measures computed from bond/CDSreturns between treatment and propensity-matched control groups.
Augustin, Brenner, Hu, & Subrahmanyam Informed Options Trading prior to Corporate Events 90 / 91
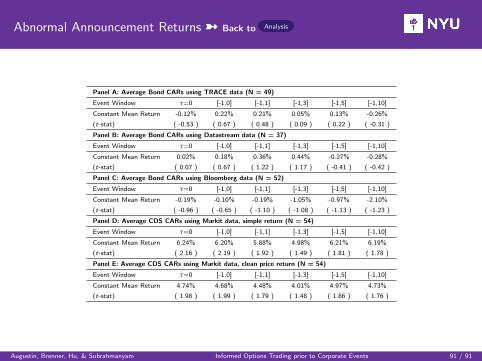
Abnormal Announcement Returns ü Back to Analysis
Panel A: Average Bond CARs using TRACE data (N = 49)
Event Window τ=0 [-1,0] [-1,1] [-1,3] [-1,5] [-1,10]
Constant Mean Return -0.12% 0.22% 0.21% 0.05% 0.13% -0.26%
(t-stat) ( -0.53 ) ( 0.67 ) ( 0.48 ) ( 0.09 ) ( 0.22 ) ( -0.31 )
Panel B: Average Bond CARs using Datastream data (N = 37)
Event Window τ=0 [-1,0] [-1,1] [-1,3] [-1,5] [-1,10]
Constant Mean Return 0.02% 0.18% 0.36% 0.44% -0.27% -0.28%
(t-stat) ( 0.07 ) ( 0.67 ) ( 1.22 ) ( 1.17 ) ( -0.41 ) ( -0.42 )
Panel C: Average Bond CARs using Bloomberg data (N = 52)
Event Window τ=0 [-1,0] [-1,1] [-1,3] [-1,5] [-1,10]
Constant Mean Return -0.19% -0.10% -0.19% -1.05% -0.97% -2.10%
(t-stat) ( -0.96 ) ( -0.65 ) ( -1.10 ) ( -1.08 ) ( -1.13 ) ( -1.23 )
Panel D: Average CDS CARs using Markit data, simple return (N = 54)
Event Window τ=0 [-1,0] [-1,1] [-1,3] [-1,5] [-1,10]
Constant Mean Return 6.24% 6.20% 5.88% 4.98% 6.21% 6.19%
(t-stat) ( 2.16 ) ( 2.19 ) ( 1.92 ) ( 1.49 ) ( 1.81 ) ( 1.78 )
Panel E: Average CDS CARs using Markit data, clean price return (N = 54)
Event Window τ=0 [-1,0] [-1,1] [-1,3] [-1,5] [-1,10]
Constant Mean Return 4.74% 4.68% 4.48% 4.01% 4.97% 4.73%
(t-stat) ( 1.98 ) ( 1.99 ) ( 1.79 ) ( 1.48 ) ( 1.86 ) ( 1.76 )
Augustin, Brenner, Hu, & Subrahmanyam Informed Options Trading prior to Corporate Events 91 / 91